Abstract
Glucose is a simple sugar molecule. The chemical formula of this sugar molecule is C6H12O6. This means that the glucose molecule contains six carbon atoms (C), twelve hydrogen atoms (H), and six oxygen atoms (O). In human blood, the molecule glucose circulates as blood sugar. Normally, after eating or drinking, our bodies break down the sugars in food and use them to obtain energy for our cells. To execute this process, our pancreas produces insulin. Insulin “pulls” sugar from the blood and puts it into the cells for use. If someone has diabetes, their pancreas cannot produce enough insulin. As a result, the level of glucose in their blood rises. This can lead to many potential complications, including blindness, disease, nerve damage, amputation, stroke, heart attack, damage to blood vessels, etc. In this study, a non-invasive and therefore easily usable method for monitoring blood glucose was developed. With the experiment carried out, it was possible to measure glucose levels continuously, thus eliminating the disadvantages of invasive systems. Near-IR sensors (optical sensors) were used to estimate the concentration of glucose in blood; these sensors have a wavelength of 940 nm. The sensor was placed on a small black parallelepiped-shaped box on the tip of the finger and the output of the optical sensor was then connected to a microcontroller at the analogue input. Another sensor used, but only to provide more medical information, was the heartbeat sensor, inserted into an armband (along with the microprocessor). After processing and linear regression analysis, the glucose level was predicted, and data were sent via the Bluetooth network to a developed APP. The results of the implemented device were compared with available invasive methods (commercial products). The hardware consisted of a microcontroller, a near-IR optical sensor, a heartbeat sensor, and a Bluetooth module. Another objective of this experiment using low-cost and low-power hardware was to not carry out complex processing of data from the sensors. Our practical laboratory experiment resulted in an error of 2.86 per cent when compared to a commercial product, with a hardware cost of EUR 8 and a consumption of 50 mA.
1. Introduction
Carbohydrates are molecules of enormous biological importance that have empirical formulas such as Cn (H2O)n or Cn(H2O)n−1. These formulas suggest they are “hydrates of carbon” and that is why early chemists gave them the general name carbohydrates. We commonly call carbohydrates sugars, and they are also known as saccharides. They are organic compounds represented by the formulas above. Since these compounds are synthesized through photosynthesis in plants, they are mostly components specific to plant foods. However, they are also the building blocks of many vital tissues in animals. Glucose is the most important carbohydrate group; it is called simple sugar (monosaccharide) and is abundant in foods. Another area where determining glucose values is very important is the health sector. Measurements to determine blood glucose levels are important in the treatment of patients with diabetes and hyperglycemia [1]. Diabetes Mellitus type I has a strong genetic component and is a very common hereditary disease today. It causes blindness, heart attack, kidney failure, amputation, and in later stages, death. The rapidly increasing number of patients makes it necessary to control and constantly monitor diabetes. Monitoring diabetes is also extremely important in terms of reducing the progression of the disease and healthcare costs [2]. Non-invasive techniques for blood glucose monitoring have attracted significant research interest due to their high sensitivity and better patient compliance, unlike invasive ones. Typical non-invasive biosensors based on different approaches include iontophoretic extraction of glucose from the skin, surface plasmon resonance, Raman spectroscopy, visible or near-infrared (NIR) spectroscopy, polarimetry, photo-acoustic probes, and fluorescence methods. These methods may be alternative options for continuous glucose measurement [3]. Some studies have already been carried out on this subject, either describing or comparing the several technologies at our disposal [3,4,5] and choosing and testing NIR spectroscopy [6,7,8].
Other developing technologies like flexible sensors based on carbon nanotube paper film (CNTF) and stress-induced square frustum structures (SSFSs) [9] have shown very promising results in research and potential to be applied in the medical field, but it is important to note that while these technologies have shown significant potential in a research context, the transition to commercial application is still ongoing and often this transition involves additional challenges and considerations, including scalability, cost-effectiveness, and regulatory approval. For now, this technology is still not ready for commercial applications.
Other technologies like durable superhydrophobic surfaces [10] are already in a different stage of development but still give rise to concerns related to poor durability and short service life [11]; due to this, to date, the practical applications of superhydrophobic materials have been greatly restricted. Researchers are still focusing on ways to prolong the lifetime of superhydrophobic surfaces with respect to two aspects, namely surface structures and materials [11].
The development and creation of low-cost, non-invasive glucose-measuring equipment would generate interest both among people who suffer from diabetes and among people who do not yet suffer but are in risk groups. One advantage of being non-invasive is that there are people who avoid taking the test using conventional invasive equipment because they do not like the prospect of having their finger pricked (it is uncomfortable and could lead to infection) and others who are very sensitive to the sight of blood, making self-testing with conventional invasive equipment unlikely for a good part of the population. A non-invasive technique would allow the acquisition by everyone of equipment that would be used regularly at home and at work, allowing continuous monitoring and control and thus preventing sudden emergencies in the population already suffering from this disease (if blood glucose remains too high or is steadily rising, the person will speak with their doctor, as they may need to adjust their treatment) or even an increase in the population with this problem. Optical detection of glucose allows for more frequent and better monitoring for people with diabetes.
The environmental aspect cannot be forgotten either; the fact that people stop using (and throw away) meter blood strips and have to periodically change the needles with the conventional equipment is another point in favor of changing to the use of non-invasive equipment.
The International Organization for Standardization [12] in their ISO 15197:2015 [13] recommends some goals for glucose meters and for system accuracy. Firstly, 95% of the glucose results should fall within ±15 mg/dL of the reference result at glucose concentrations <100 mg/dL and within ±15% at glucose concentrations ≥100 mg/dL [13,14]. Secondly, 99% of individual glucose measured values should fall within clinically acceptable zones A and B of the consensus error grid (CEG) for diabetes [13,14,15]. Under optimal circumstances, many meters meet these accuracy standards.
Also, the Food and Drug Administration (FDA) has given non-binding guidance for commercial equipment; devices should deliver measurements that are within +/−15% of a highly precise lab measurement 95% of the time and within +/−20% of a highly precise lab measurement 99% of the time [16].
Yet, user-related errors are a more significant source of errors than are instrument-related errors [17]. This is also a point in favor of the adoption of a non-invasive method that reduces the number of steps for glucose measurements, thus minimizing errors and essentially leading to better control and monitoring of glucose. In our study, using commercial invasive equipment as a standard and with an error rate for this equipment lower than the ISO recommendation, we minimized typical user-related errors by adopting recommended procedures, such as ensuring that the glucose meter was correctly calibrated (according to the manufacturer’s instructions), making sure that the test strips (and control solution) were stored in appropriate conditions (to prevent damage or degradation) and were clean and free of substances that could interfere with the reading, and using the correct amount of blood for the test strip, thus leading to accurate and reliable standard glucose-monitoring values to later be able to compare with our measurements from the non-invasive equipment, and thus being sure to significantly reduce the typical errors associated with measurement of glucose with commercial meters.
Classic commercial equipment is not easy to use. The following are typical user-related errors with the strip: not fully inserting it in the meter, moving it after insertion, and not keeping it at the recommend temperature (as the control solution); these are common errors and lead to errors in readings. Insufficient amount of blood or squeezing the fingertip too much (because the blood is not flowing) are also typical errors and consequently lead to repeated attempts. Users’ failure to calibrate the glucose meter regularly is also a common cause of error.
A more recent adopted solution is the continuous glucose monitor (CGM) applied typically by a patch in the arm of the user. They have more stable results than the classic meters but rely on the interstitial fluid that surrounds the body cells (instead of blood). So, they rely on an algorithm to give us a prediction of the blood sugar level. Also, they need calibration. It could take up to an hour and is usually completed on the first day. But reports [18] by users say that the first day is the worst day to calibrate since the data gathered show less accuracy in the sensors in the first 24 h. Adding to this, the reading of the interstitial fluid lags behind the blood glucose by an average of 17 minutes [19]; this is due to the physiological time lag of glucose transport from the vascular to the interstitial space, which makes difficult to predict sudden changes in the glucose level and prevent crisis. And every two weeks, the patch needs to be changed and the calibration process repeated. So, as a good option for the continuing monitoring for the population with diabetes, CGMs do not replace the need and usefulness for a non-invasive low-cost optical solution like ours.
In terms of sensitivity and accuracy, while invasive equipment has traditionally been regarded as more sensitive than non-invasive equipment [20], user-related errors associated with the procedures required for invasive equipment can diminish this advantage or even shift it in favor of non-invasive devices in real-world usage. User-related errors in invasive glucose monitoring equipment can significantly impact the overall sensitivity and accuracy of these devices. This demonstrates the potential viability of Near-Infrared (NIR) equipment for glucose monitoring, even when considering sensitivity and accuracy.
The aim of our study is to identify a straightforward solution that allows us to demonstrate, through the correlation derived from linear regression between the values measured by conventional invasive equipment (considered the standard) and our non-invasive equipment, that our Near-Infrared (NIR) equipment provides a superior alternative. This is particularly significant for individuals who are not yet at risk but seek to monitor their glucose levels, as well as for those in high-risk groups.
The equation derived from the linear regression analysis will establish the correlation between the two sets of readings. A program will be developed and installed on a microprocessor, which will take the readings from the NIR sensors as input and use the correlation from the linear regression analysis to output the corresponding glucose values.
2. Research and System Design
This section explains the elements that make up the architecture of this project: microcontroller (Arduino Uno), optical sensors, heartbeat sensor, and wireless communication via the Bluetooth network. The firmware flowchart and its explanation are also presented, as well as the experimental tests and all the results obtained, which prove the functionality of the work as defined.
2.1. Light Spectrum and 940 nm Infrared Spectrum
Within the vast electromagnetic spectrum, beyond the boundaries of human vision, lies the enigmatic realm of infrared radiation. Among its myriad wavelengths, the 940 nm infrared spectrum stands out for its diverse applications across various fields, from telecommunications to healthcare [21,22]. In this work, we embark on a journey to explore the intricacies of the 940 nm IR spectrum (see Figure 1), shedding light on its properties, practical uses, and significance in contemporary science and technology.
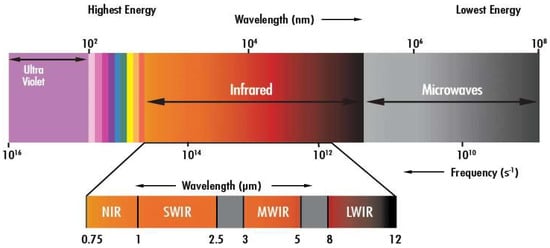
Figure 1.
Light spectrum [23].
The electromagnetic spectrum encompasses a broad range of wavelengths (the wavelength is the distance between repetitions of a wave), including those of visible light and beyond. Situated adjacent to the visible spectrum, the infrared region comprises wavelengths longer than those of visible light. Within this domain, the 940 nm wavelength occupies a special place, offering unique characteristics that make it indispensable for numerous applications [21,22]. The versatility of the 940 nm infrared spectrum lends itself to a wide array of applications, each harnessing its distinct properties to achieve specific objectives. Let us delve into some key domains where the 940 nm IR spectrum plays a pivotal role.
Telecommunications and Data Transmission: The 940 nm wavelength serves as a cornerstone for optical communication systems, enabling high-speed data transmission over fiber optic networks. Its ability to travel through optical fibers with minimal attenuation ensures efficient and reliable communication over short/medium distances (e.g., LAN). Vertical Cavity Surface Emitting Lasers (VCSELs), for example, operate at 940 nm.
Sensing and Imaging Technologies: In fields such as surveillance, medical diagnostics, and environmental monitoring, the 940 nm infrared spectrum is instrumental in enhancing sensing and imaging capabilities. Night vision cameras, for instance, utilize 940 nm IR illuminators to capture clear images in low-light conditions, while medical devices leverage near-infrared spectroscopy (NIRS) for non-invasive tissue analysis.
Biomedical and Healthcare Applications: Researchers and healthcare practitioners harness the 940 nm infrared spectrum for various biomedical applications, including diagnostics and therapeutic interventions. Near-infrared light, at 940 nm wavelength, exhibits excellent tissue penetration properties, making it suitable for deep tissue imaging and photo biomodulation therapy [21,22].
Security and Defense Systems: In the realm of security and defense, infrared technology, including the 940 nm spectrum, plays a critical role in surveillance and threat detection. Infrared surveillance cameras equipped with 940 nm IR illuminators enable covert monitoring and perimeter protection, enhancing security measures in both civilian and military contexts.
In summary, the 940 nm infrared spectrum represents a captivating convergence of science, technology, and innovation, offering insight into the invisible forces that shape our world. Its applications, ranging from facilitating high-speed communication to advancing medical diagnostics and enhancing security, are as diverse as they are profound. As we continue to unlock the potential of the 940 nm IR spectrum, it stands as a testament to human ingenuity and our relentless pursuit to explore the unseen [22].
2.2. System Design
This section explains the elements that make up the architecture of this project: microcontroller (ATmega328), optical sensors (near IR), heartbeat sensor, and wireless communication via the Bluetooth network.
Figure 2 shows the project’s block diagram, which consists of a microcontroller (ATmega328), the main component, as it receives information from the optical near-IR sensor and the heartbeat sensor, the two sensors used in the project. The Arduino is powered by 5 VDC so that it can work, receive data from the sensor, and send it via the Bluetooth module. The Bluetooth module communicates these data with the application.
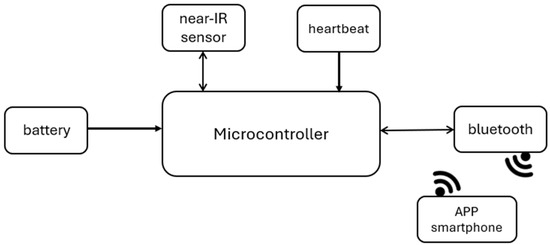
Figure 2.
System architecture.
The development board used for this project is Arduino Uno [24], with the ATMega328 microcontroller [25]. The ATMega328 is a low-power chip, so it only needs 1.8–5.5 VDC to work, which is one of the main advantages of implementing it on Arduino boards, making power consumption extremely low [25]. This microcontroller has an Analog-to-Digital Converter (ADC) with ten-bit resolution. With this ADC it is possible to measure analogue signals and convert them into digital values for processing. Some of the features of the ADC in the ATMega328 are:
- -
- Ten-bit resolution: Converts analog signals into digital ones, allowing through this resolution the production of 210 (1024) possible values for each conversion.
- -
- Input voltage range: Possibility of measuring input voltages in the 0 V to 5 V range.
- -
- Input channels: This ADC offers six input channels, labelled ADC0 to ADC5, each of which can be individually selected for conversion.
- -
- Sample rate: The ADC’s maximum sample rate is 15,000 samples per second.
In addition to these features, the ADC uses the process of successive approximations to carry out the conversion. This process consists of a binary search algorithm to determine the digital representation of the analog input signal. In this process, the ADC compares the analog input voltage with a reference voltage and determines whether this voltage is higher or lower than the reference voltage. This process is repeated until the digital representation of the input voltage is determined within the desired resolution, which, in the case of this microcontroller, is 10 bits. The process of successive approximations is an efficient ADC conversion method for producing precise results with relatively low power consumption. However, there are other methods that are faster and more effective, such as flash conversion, which can provide a conversion time in just one clock cycle. Unfortunately, flash converters consume more power and need many comparators, making them impractical for precisions greater than eight bits. So, on an Arduino Uno, which has a clock of 16 MHz, if we use a prescaler of 128, the ADC will work with a clock of 16 MHz/128 = 125 kHz.
Sensors are devices which, using energy from the medium being measured, provide the output with a processable signal that is a function of a measurement variable. A sensor is classified as a device which, when subjected to the action of a non-electrical physical quantity, produces a characteristic of an electrical nature. Although the concept is broader, the concept of sensor and transducer is often confused. Transducers are devices that convert a signal of one physical form into another of a different physical form; in short, they convert one type of energy into another. The physical quantities associated with transducers are mechanical, thermal, magnetic, electrical, optical, and chemical. There are three classes of sensors: passive, active, and digital sensors. Passive (analogue) sensors are those whose variation in the property to be measured is reflected in variations in impedance. Active (analog) sensors are those whose energy is directly used by the process to be measured. Digital sensors are those that measure discrete quantities such as logic states and devices with a frequency output.
Non-invasive methods can generally be categorized as thermal, electrical, optical, and nanotechnology. Much current research concentrates on optical methods, mid- and near-infrared spectroscopy in particular [26,27,28].
Near-infrared spectroscopy (NIRS) is a form of vibrational spectroscopy in which electromagnetic radiation causes vibrations such as stretching and bending of bonds in a chemical species [6]. Each molecule consists of several different bonds that absorb radiation in different specific characteristic spectra. The absorption of radiation by a molecule leads to an increase in the energy level from an electronic ground state to a higher electronic excited state. The absorption of infrared radiation makes the transition from the energy level to the electron excited state. The NIR spectrum consists of harmonics and combined absorption bands of fundamental vibrations of C-H, O-H, N-H and S-H bonds [29]. In more detail:
- C-H Bonds (Carbon–Hydrogen): C-H bonds are present everywhere in organic molecules. They appear as distinctive bands in NIR spectra between 2050 nm and 2180 nm.
- O-H Bonds (Water): Water molecules exhibit strong absorption in the NIR range. Their absorption bands are broad and dominant. The main absorption bands from liquid water are located around 1450 nm and 1940 nm.
- N-H Bonds (Protein): Protein content is challenging to spot at lower concentrations, but it manifests as two distinctive bands. These bands occur at 2050 nm and 2180 nm.
- S-H Bonds (Thiols): S-H bonds represent the presence of thiols, which are sulfur- containing organic compounds. Thiols are commonly found in proteins, amino acids, and other biological molecules. The absorption bands associated with S-H bonds typically occur around 2500 nm in the NIR spectrum.
There are essentially three bands: the second or upper harmonic band (750–1400 nm), the first harmonic band (1400–2000 nm), and the combined harmonic band (2000–2500 nm). In more detail:
- Second (Upper) Harmonic Band (750–1400 nm): This band corresponds to the second harmonic of fundamental vibrations.
- ◦
- Key Features:
- ▪
- Overtone Absorptions: In this range, we observe overtone absorptions related to fundamental vibrations of various chemical bonds.
- ▪
- C-H Bonds: The second harmonic band includes overtones (multiples of the fundamental frequency) of C-H bonds, which are prevalent in organic compounds.
- ▪
- Protein and Lipid Content: Researchers often use this band to assess protein and lipid content in samples.
When analyzing food products or biological tissues, the second harmonic band provides valuable information about their composition.
- First Harmonic Band (1400–2000 nm): The first harmonic band corresponds to the fundamental vibrations of specific bonds.
- ◦
- Key Features:
- ▪
- O-H Bonds (Water): Water molecules exhibit strong absorption in this range. Monitoring water content is crucial for various applications.
- ▪
- Protein Bands: The first harmonic band includes absorption features related to protein content (e.g., amide bonds).
- ▪
- Starch and Sugar Bands: Starch and sugar content also contribute to the absorption in this region.
By analyzing the first harmonic band, researchers can assess hydration levels, protein concentrations, and carbohydrate content.
- Combined Harmonic Band (2000–2500 nm): This band combines both fundamental vibrations and overtones.
- ◦
- Key Features:
- ▪
- C-H, N-H, and O-H Bonds: The combined harmonic band includes absorption features related to C-H, N-H, and O-H bonds.
- ▪
- Thiols (S-H Bonds): Thiols (sulfur-containing compounds) also contribute to absorption in this range.
When studying biological samples or assessing chemical reactions, the combined harmonic band offers valuable insights into various functional groups.
As reported in [28], this region has a series of optical windows characterized by low absorption of water, hemoglobin, and lipids. This allows NIR radiation to penetrate areas with a higher concentration of blood beneath the skin while remaining non-destructive. Most importantly, the NIR method is relatively low-cost, as the necessary materials, such as 940 nm Near-IR emitter and receiver LEDs, can be purchased affordably. Additionally, NIR can penetrate deeper into the skin compared to mid-range IR radiation, making it the optimal choice.
The frequency of 940 nm was chosen for this experiment because, even though glucose has light absorption peaks at other wavelengths belonging to the NIR range (e.g., 970 nm, 1197 nm, and others), it is this wavelength that has the lowest signal attenuation by other biological components, such as red blood cells, water, and platelets. There are other possible choices related with higher peak absorptions of glucose in other regions, like the first harmonic or the combined region being traded for the area of the second harmonic, by the crucial fact that the second allows deeper penetration in the biological tissue. Also, for lower wavelengths, the absorption of deoxyhemoglobin, oxyhemoglobin, and melanin increases, while for larger wavelengths, water absorption has an increasing impact.
In addition, there is no need for prior sample preparation with this method and it provides rapid results.
However, shorter NIR wavelengths cause a high level of scattering in the tissue. Other disadvantages include poor sensitivity to low blood glucose concentrations, which makes accurate detection difficult, and interference from compounds with similar absorption characteristics to glucose.
The key to a successful non-invasive optical measurement of glucose is the collection of an optical spectrum with a very high signal-to-noise ratio in a spectral region containing significant glucose. Optical sensors exploit different interaction properties of light with glucose molecules in a concentration-dependent manner. Infrared (IR) provides an optical window through which it passes subcutaneously, independent of the epidermis and skin pigmentation.
The optical sensor detects transmitted infrared radiation and converts it into electrical signals. Arduino Uno is connected to the near-IR emitter and collects the data from the near-IR receiver via the 10-bit analog–digital converter (ADC) that is part of the microcontroller’s architecture, with an accuracy per bit of 4.8 mV, after which the glucose level was calculated using a linear regression based on the measured values (this point is developed in Section 3).
The near-IR emitter and receiver have been integrated into a black housing to reduce the noise that can be caused by ambient light. A set of two emitter LEDs and receiver photodiode were arranged opposite each other, with a small space in the middle to allow the finger to be placed. Among the various places where we could place our NIR sensor and obtain our measurements are the lips, tongue, earlobes, or fingertips, all of which are rich in blood vessels. The fingertip ended up being chosen for practical reasons relating to the construction of the black box that houses the NIR sensor. In Figure 3, we can see the image of an IR LED of 940 nm (TSAL6200) as well as the photodiode used as the optical receiver (BPV22NF) with peak sensitivity at 940 nm, both from Vishay, used in our experiment.
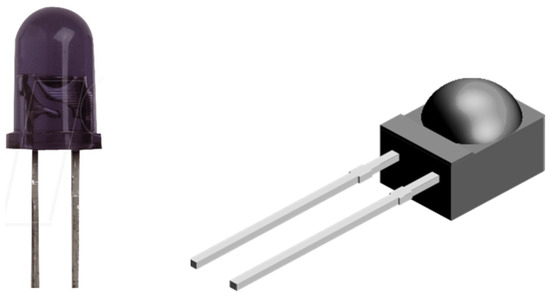
Figure 3.
NIR emitter LED (left) and optical receiver (right).
Another sensor used in the experiment, the MAX30102 (Figure 4 and Figure 5), is not relevant for measuring glucose levels, but is used to provide the user with more information, such as a heartbeat (and thus relating the measured individuals with a healthier, or not, lifestyle). The MAX30102 is an integrated pulse oximeter and heart rate sensor IC, from Analog Devices. It combines two LEDs (IR and red LEDs), a photodetector, optimized optics, and low-noise analog signal processing to detect pulse oximetry (Saturation of Peripheral Oxygen, SpO2) and heart rate signals.
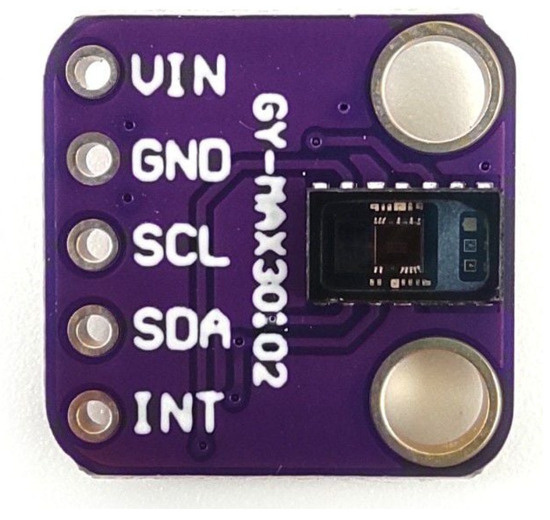
Figure 4.
MAX30102 board (5-pin version).
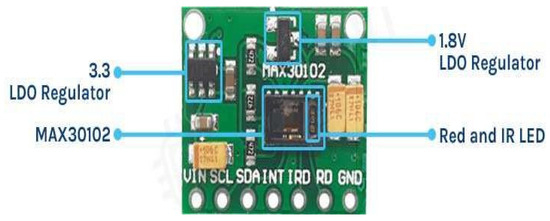
Figure 5.
MAX30102 board (7-pin version).
In our experiment, we use the version of the MAX30102 with 5 pins.
The board has two voltage regulators, 3.3 VDC to power the LEDs and 1.8 VDC to power the IC of the MAX30102. Communication with the Arduino Uno is via I2C. One of the most important features of the MAX30102 is its low power consumption; the MAX30102 consumes less than 600 μA during measurement (in standby mode only 0.7 μA). The IR LED wavelength is of 880 nm (Figure 6).
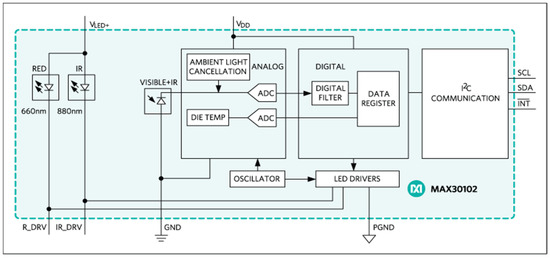
Figure 6.
MAX30102 block diagram.
Our body comprises veins and arteries, with veins visually represented by blue lines (see Figure 7) and arteries by red lines. In the veins, blood travels through the body’s tissues toward the heart, whereas in the arteries, blood flows from the heart toward the rest of the body. Structurally, arteries are blood vessels with thick, resistant walls through which blood flows at high pressure. In contrast, veins have thinner walls and blood flows through them at lower pressure. The blood flowing through the arteries is rich in oxygen and is referred to as oxyhemoglobin (a complex formed by the binding of oxygen (O₂) to hemoglobin). Arteries absorb more infrared light compared to other tissues. Conversely, the blood flowing through the veins is low in oxygen, known as deoxyhemoglobin (the form of hemoglobin that has released its bound oxygen). Deoxyhemoglobin has a particular affinity for red light, contributing to the purplish-blue appearance of deoxygenated blood. As light passes through our tissues, deoxyhemoglobin selectively absorbs red wavelengths, allowing other colors to pass through.
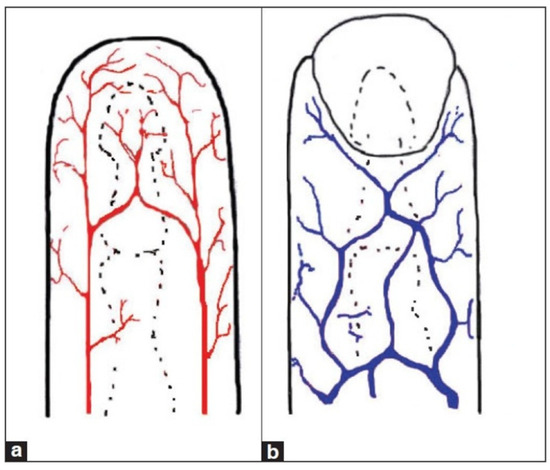
Figure 7.
Blood circulation example: arteries (a) and veins (b).
By comparing the absorption levels of oxyhemoglobin and deoxyhemoglobin, the sensor will calculate the SpO2 percentage.
The blood that runs through the arteries is rich in oxygen. The more oxygenated the blood, the more hemoglobin it contains, so the blood is redder and consequently absorbs more infrared light. In short, the more oxygenated the blood, the greater the amount of infrared light absorbed. As was said previously, the sensor IR and red LEDs are used to generate the light that penetrates the skin and red-colored tissues. The infrared LED penetrates the skin and is predominantly absorbed by the arteries, while the red LED penetrates even further away and is predominantly absorbed by the veins. When the light passes through the skin, it encounters reflection from the flowing blood in the blood vessels. The sensor employs a photodiode (along with a photonic filter for ambient light cancellation) to measure the amount of light reflected by the blood. The photodiode receives the light-reflected signals and converts them into analog data. These data are then converted into digital data by the ADC (electrical scheme in Figure 8). As the heart pumps, the reflected light (that which is not absorbed) is altered, generating a wave reading on the photodetector, which then generates a waveform that correlates the heartbeat rate.
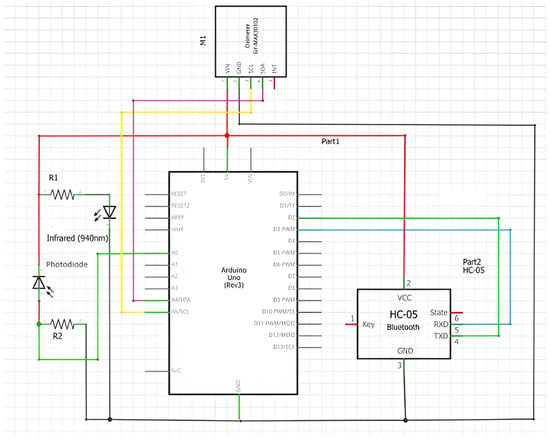
Figure 8.
Electrical scheme of experiment.
The Bluetooth module used in this work is the HC-05. It has a range of up to ten meters without obstacles and can be configured in two modes, Master and Slave.
This work uses two programming languages, C/C++ and block programming. The C/C++ programming language is used to develop the firmware for the Arduino Uno. Block programming (APP Inventor) is used to program the application (APP) resident on the smartphone.
2.3. Algorithm Design
Figure 9 shows the flowchart of the firmware developed for the microcontroller and the algorithm developed.
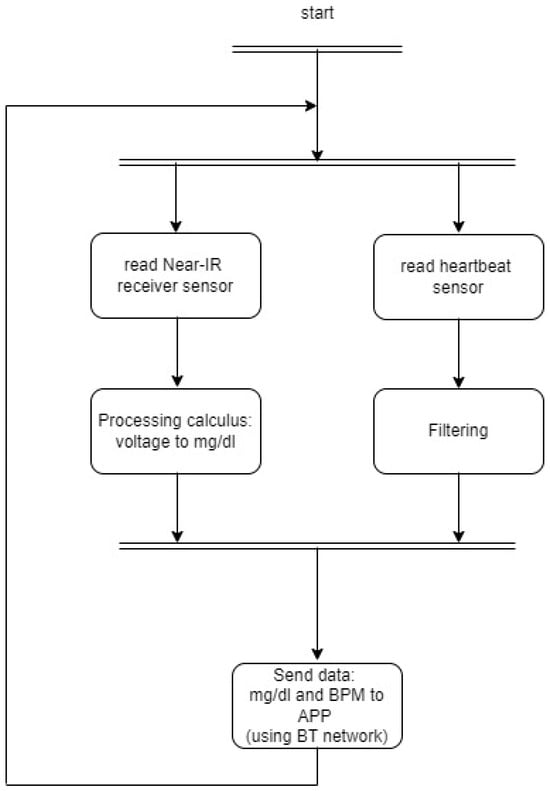
Figure 9.
Firmware flowchart.
- Declare integer variable i
- Declare float variable value and initialize to 0
- Declare integer variable numReadings and initialize to 3000
- Declare integer variable r
- Declare float variable rs
- Declare float variable gluc
- Loop infinitely:
- Read analog value from pin 0 into r
- Calculate rs:
- rs = (r * (5.0 / 1023.0)) * 1000
- For i from 0 to numReadings - 1
- Add rs to value
- Wait for 1 ms
- Calculate the average value:
- value = value / numReadings
- Calculate gluc:
- gluc = (−0.03 * value) + 221.45
- Send gluc via Bluetooth serial interface
3. Results and Discussion
In this work, tests were conducted on the optical sensors (Near IR emitter LED and Near IR receiver photodiode), measuring the voltage at the receiver Near IR photodiode, so that the values could be acquired by the microcontroller’s ADC on the Arduino Uno board. As previously mentioned, this ADC has a resolution of 10 bits. To implement a process for reading glucose levels, measurements were taken and compared with commercial meters, specifically the OneTouch Select Plus. The OneTouch Select Plus is a conventional device that requires applying blood to a test strip. It associates the custom interval limit, either before or after a meal, with the result, based on whether a corresponding meal marker has been added.
One Touch Select Plus Meter meets international standards of EN ISO 15197:2015 [13]. For system accuracy, the standard requires the following:
- -
- First criterion: 95% of the glucose results must fall within ±15 mg/dL of the reference result at glucose concentrations <100 mg/dL and within ±15% at glucose concentrations ≥100 mg/dL [13,14].
- -
- Second criterion: 99% of individual glucose measured values shall fall within clinically acceptable zones A and B of the Consensus Error Grid (CEG) for diabetes [13,14,15].
It should be noted that the manufacturer carried out a set of tests that meet these requirements and this can be seen in [30].
The standard also adds that for measurement repeatability and intermediate measurement precision, the standard deviation (SD) should be ≤4.1 mg/dL for glucose levels <100 mg/dL and the coefficient of variation (CV) should be ≤4.2% for glucose concentrations ≥100 mg/dL.
Between the several choices of tests that detect diabetes (e.g., glucose tolerance test (GTT), random blood sugar test, fast blood sugar test), the fast blood sugar test, also known by Fasting Plasma Glucose test (FPG), is typically the best option based on its ability to provide a stable baseline (not influenced by recent meals or physical activity). This stability allows for accurate assessment of glucose metabolism. Fasting means not having anything to eat or drink (except water) for at least 8 h before the test. This test is usually performed first thing in the morning, before breakfast. Diabetes is diagnosed at a fasting blood glucose of greater than or equal to 126 mg/dL [31]. To have an idea of what type of results we should expect (interval limits):
- ▪ Normal: less than 100 mg/dL;
- ▪ Prediabetes: between 100 and 125 mg/dL;
- ▪ Diabetes: 126 mg/dL or higher.
For a different type of population group, such as children or pregnant women, other levels than these should be considered.
In our experiment and to achieve a range of values that is robust and wide enough to be able to establish the connection between the infrared optical receiver voltage supplied to the Arduino and the glucose values, we used the values of 10 different persons aged 18 to 24 whose physical condition was considered healthy. These 10 people measured their glucose values on the commercial conventional equipment (One Touch Select Plus meter) and then in our experiment.
The recorded values were obtained before and after meals, and their average is presented in Table 1. We specifically used six values in Table 1 because some of them were equal. By reducing the number of values to six, we aimed to achieve better linearization for implementing Equation (1) in the firmware development process. This approach allows us to establish a correlation between ADC levels and blood glucose levels with more samples, ultimately reducing the processing load on the microcontroller and minimizing energy consumption.

Table 1.
Values measured (in mV) and commercial meter.
In programming terms, the implementation required linear regression to derive the expression in Equation (1). Linear regression is an essential tool for estimating the expected value of a dependent variable (y). By analyzing real measured values, we can graphically approximate a linear line that best fits the data points. In our project, linear regression helped us estimate glucose values in mg/dL based on the mV readings obtained from the sensor.
Additionally, we considered Lambert’s law, which states that the intensity of light decreases exponentially as the thickness of the absorbing medium increases linearly. When infrared radiation passes through the finger and reaches the infrared receiver, it undergoes attenuation due to the presence of blood glucose molecules. Depending on the glucose concentration, the IR light received by the photodetector can be higher (indicating low glucose levels) or lower (indicating higher glucose levels). Figure 10 illustrates this phenomenon.
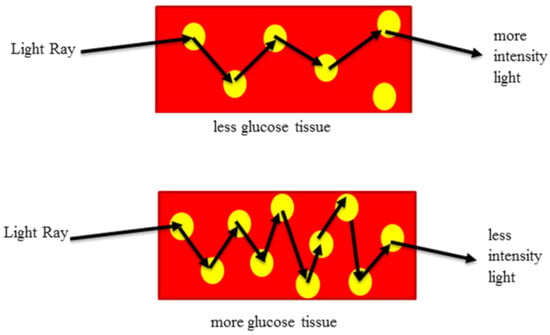
Figure 10.
Influence of light propagation in glucose molecules.
For reference, an integrated image of our glucose meter is shown in Figure 11.

Figure 11.
Experimental diagram of the glucose meter.
Based on the results in Table 1, we implemented linear regression using Geogebra, as illustrated in Figure 12. The expression from Equation (1) was then incorporated into the C/C++ programming language for the Arduino Uno microcontroller. In Table 2, we compare the average values measured by the Arduino with the glucose level values obtained from the One Touch Select Plus commercial meter.
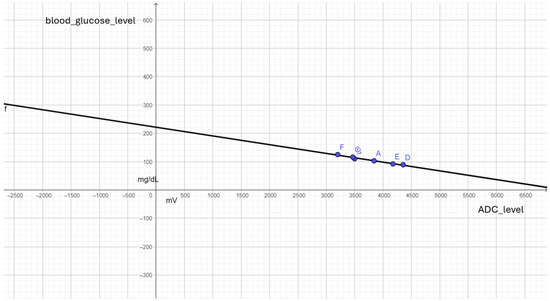
Figure 12.
Point cloud and linear regression to expression in (1).

Table 2.
Comparing the measured values to those obtained from a commercial meter.
For the heartbeat sensor, the results shown in Table 3 were obtained.

Table 3.
Measured heart rate values.
Figure 13 and Figure 14 depict our experiment during the testing phase, along with the application developed and the corresponding experimental results.
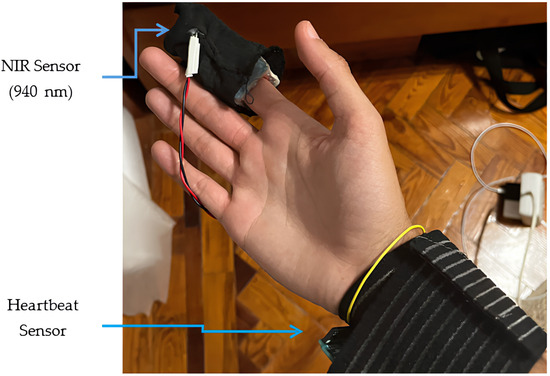
Figure 13.
Visual design of the experimental prototype.
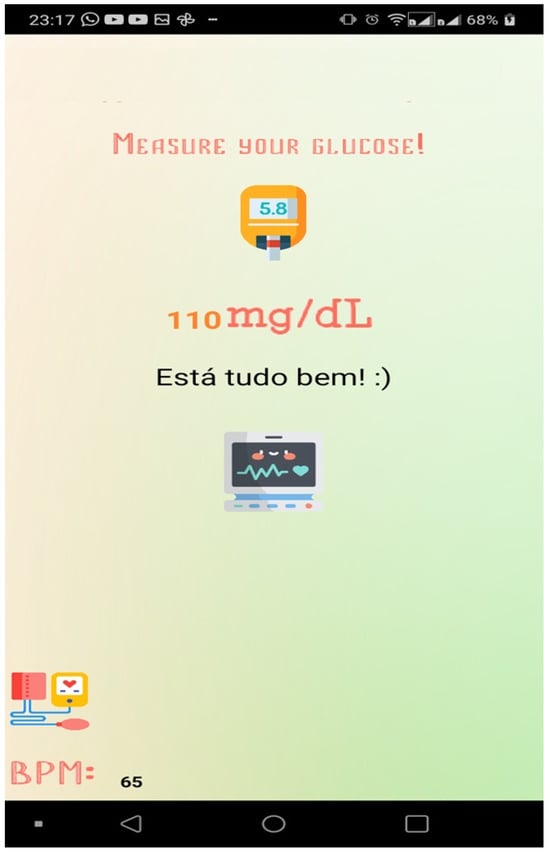
Figure 14.
Appearance of the app.
4. Conclusions
The adoption by the population of a crucial piece of equipment for their health depends on two main premises: reliability and affordability. Reliability ensures that the equipment performs consistently and accurately, providing the user with confidence in the results it provides. This is especially important for health-related equipment. On the other hand, affordability ensures that the equipment is accessible to as many people as possible. Health is a universal need, and thus, it is important that critical health equipment is priced in a way that allows the population to afford it.
In our academic and experimental work, we provided, by finding a solid and simple solution (regression analysis) for the correlation between the values measured from the pair of photoemitter/receiver and the values of glucose, that the implementation of a simple algorithm/program in an Arduino microprocessor is viable and makes the two initial premises come true. The precision and simplicity of our solution leads therefore to the low-cost solution (and availability) announced in the introduction of this study. Other factors, like the ease of use of such equipment, also play a significant role in its adoption.
Also, in this work, using the method of the linear regression to achieve a correlation between the measured ADC values and glucose, we were able to achieve an average error of 2.86 per cent when compared to commercial glucose meters, which is very promising (because it shows us that are highly correlated), as we were able to develop a system that cost around EUR 8 in terms of hardware and demonstrated low consumption (during use, it consumes around 50 mA).
Invasive glucose meters, which require a blood sample, typically require a series of time-consuming procedures (also increasing user errors), and our equipment will be easy to use and able to provide readings within a few seconds (the total time from placing your finger on the reader to reading by the microprocessor, which has the ADC with a sample rate of 125 kHz, is8 microseconds).
The possibility of the user and/or doctor being able to visualize the data collected via an app is an added value, because it can share with healthcare providers the data for further analysis, enabling early detection of any potential issues. The app provides features such as real-time tracking, historical data and alerts (high/low level of glucose), and heartbeat.
Extensive testing in different types of populations, such as type I or II diabetics or risk groups, was not in the initial scope of our work. So, the next steps will be to perform more extensive tests looking at different populations (and diabetics). Integrating screenings carried out by the Ministry of Health or by private clinics, with the aim of detecting and preventing this type of disease, would also be an objective, as we would then have access to a sample of the wider population and could compare it with the values obtained by various pieces of commercial equipment used in these screenings.
Author Contributions
Conceptualization, L.M.P. and J.M.; methodology, L.M.P. and J.M.; software, L.M.P. and J.M.; validation, L.M.P. and J.M.; formal analysis, L.M.P. and J.M.; investigation, L.M.P. and J.M.; resources, L.M.P.; data curation, L.M.P. and J.M.; writing—original draft preparation, L.M.P. and J.M.; writing—review and editing, L.M.P. and J.M.; visualization, L.M.P. and J.M.; supervision, L.M.P. and J.M. All authors have read and agreed to the published version of the manuscript.
Funding
This research received no external funding.
Data Availability Statement
Data are contained within the article.
Conflicts of Interest
The authors declare no conflicts of interest.
References
- Gonzales, W.V.; Mobashsher, A.T.; Abbosh, A. The progress of glucose monitoring—A review of invasive to minimally and non-invasive techniques, devices and sensors. Sensors 2019, 19, 800. [Google Scholar] [CrossRef] [PubMed]
- Cho, O.K.; Kim, Y.O.; Mitsumaki, H.; Kuwa, K. Noninvasive measurement of glucose by metabolic heat conformation method. Clin. Chem. 2004, 50, 1894–1898. [Google Scholar] [CrossRef]
- Lin, T.; Gal, A.; Mayzel, Y.; Horman, K.; Bahartan, K. Non-invasive glucose monitoring: A review of challenges and recent advances. Curr. Trends Biomed. Eng. Biosci. 2017, 6, 555696. [Google Scholar] [CrossRef]
- Di Filippo, D.; Sunstrum, F.N.; Khan, J.U.; Welsh, A.W. Non-Invasive Glucose Sensing Technologies and Products: A Comprehensive Review for Researchers and Clinicians. Sensors 2023, 23, 9130. [Google Scholar] [CrossRef]
- Xue, Y.; Thalmayer, A.S.; Zeising, S.; Fischer, G.; Lübke, M. Commercial and Scientific Solutions for Blood Glucose Monitoring—A Review. Sensors 2022, 22, 425. [Google Scholar] [CrossRef]
- Islam, M.M.; Manjur, S.M. Design and Implementation of a Wearable System for Non-Invasive Glucose Level Monitoring. In Proceedings of the 2019 IEEE International Conference on Biomedical Engineering, Computer and Information Technology for Health (BECITHCON), Dhaka, Bangladesh, 28–30 November 2019. [Google Scholar]
- Venkataramanan, S.; Kamble, D.; Bairolu, A.; Singh, A.; Rao, R. A Novel Heart Rate and Non-Invasive Glucose Measuring Device. In Proceedings of the International Conference on Communication and Signal Processing, Chennai, India, 6–8 April 2017. [Google Scholar]
- Naresh, M.; Peddakrishna, S. Non-invasive glucose measurement using 950 nm reflective short wave NIR technique. Res. Biomed. Eng. 2023, 39, 747–757. [Google Scholar] [CrossRef]
- Wang, C.; Gong, D.; Feng, P.; Cheng, Y.; Cheng, X.; Jiang, Y.; Zhang, D.; Cai, J. Ultra-Sensitive and Wide Sensing-Range Flexible Pressure Sensors Based on the Carbon Nanotube Film/Stress-Induced Square Frustum Structure. ACS Appl. Mater. Interfaces 2023, 15, 8546–8554. [Google Scholar] [CrossRef] [PubMed]
- Dai, Z.; Lei, M.; Ding, S.; Zhou, Q.; Ji, B.; Wang, M.; Zhou, B. Durable superhydrophobic surface in wearable sensors: From nature to application. Explor. J. 2023, 4, 20230046. [Google Scholar] [CrossRef] [PubMed]
- Quan, Y.-Y.; Chen, Z.; Lai, Y.; Huang, Z.-S.; Li, H. Recent advances in fabricating durable superhydrophobic surfaces: A review in the aspects of structures and materials. J. Mater. Chem. Front. 2021, 5, 1655–1682. [Google Scholar] [CrossRef]
- ISO. Available online: http://www.iso.org (accessed on 10 June 2024).
- ISO 15197:2013; In Vitro Diagnostic Test Systems—Requirements for Blood-Glucose Monitoring Systems for Self-Testing in Managing Diabetes Mellitus. International Organization for Standardization: Geneva, Switzerland, 2013.
- Pleus, S.; Jendrike, N.; Baumstark, A.; Mende, J.; Wehrstedt, S.; Haug, C.; Freckmann, G. Evaluation of System Accuracy, Precision, Hematocrit Influence, and User Performance of Two Blood Glucose Monitoring Systems Based on ISO 15197:2013/EN ISO 15197:2015. Diabetes Ther. 2014, 15, 447–459. [Google Scholar] [CrossRef] [PubMed]
- Parkes, J.L.; Pardo, S.; Slatin, S.L.; Ginsberg, B.H. A New Consesus Error Grid to Evaluate the Clinical Significance of Inaccuracies in the Measurement of Blood Glucose. Diabetes Care 2000, 23, 1143–1148. [Google Scholar] [CrossRef] [PubMed]
- Food Drug Administration. Available online: https://www.fda.gov/media/87721/download (accessed on 10 June 2024).
- Lewandrowski, K.; Cheek, R.; Nathan, D.M.; Godine, J.E.; Hurxthal, K.; Eschenbach, K.; Laposata, M. Implementation of capillary blood glucose monitoring in a teaching hospital and determination of program requirements to maintain quality testing. Am. J. Med. 1992, 93, 419–426. [Google Scholar] [CrossRef] [PubMed]
- Diabetes Daily. How Accurate Are Blood Sugar Meters and Continuous Glucose Monitors, Really?—Diabetes Daily. Available online: https://www.diabetesdaily.com/ (accessed on 10 June 2024).
- Kulcu, E.; Tamada, J.A.; Reach, G.; Potts, R.O.; Lesho, M.J. Physiological Differences Between Interstitial Glucose and Blood Glucose Measured in Human Subjects. Diabetes Care 2003, 26, 2405–2409. [Google Scholar] [CrossRef] [PubMed]
- Lindner, N.; Kuwabara, A.; Holt, T. Non-invasive and minimally invasive glucose monitoring devices: A systematic review and meta-analysis on diagnostic accuracy of hypoglycaemia detection. Syst. Rev. J. 2021, 10, 145. [Google Scholar] [CrossRef] [PubMed]
- Karim, A.; Andersson, J.Y. Infrared detectors: Advances, challenges and new technologies. IOP Conf. Ser. Mater. Sci. Eng. 2013, 51, 012001. [Google Scholar] [CrossRef]
- Shaikh, S.; Nazneen, A.; Ramesh, M. Current Trends in the Application of Thermal Imaging in Medical Condition Analysis. Int. J. Innov. Technol. Explor. Eng. 2019, 8, 2708–2712. [Google Scholar]
- Edmundoptics. Available online: https://www.edmundoptics.com/knowledge-center/application-notes/imaging/what-is-swir/ (accessed on 24 April 2024).
- Arduino. Available online: http://arduino.cc/en/Main/ArduinoBoardUno (accessed on 8 March 2024).
- Microchip. Available online: https://www.microchip.com/en-us/product/atmega328 (accessed on 11 April 2024).
- Reich, G. Near-infrared spectroscopy and imaging: Basic principles and pharmaceutical applications. Adv. Drug Deliv. Rev. 2005, 57, 1109–1143. [Google Scholar] [CrossRef] [PubMed]
- Goodarzi, M.; Sharma, S.; Ramon, H.; Saeys, W. Multivariate calibration of NIR spectroscopic sensors for continuous glucose monitoring. TrAC Trends Anal. Chem. 2015, 67, 147–158. [Google Scholar] [CrossRef]
- Yadav, J.; Rani, A.; Singh, V.; Murari, B.M. Prospects and limitations of non-invasive blood glucose monitoring using near-infrared spectroscopy. Biomed. Signal Process. Control 2015, 18, 214–227. [Google Scholar] [CrossRef]
- Agelet, L.E.; Hurburgh, C.R. A Tutorial on Near Infrared Spectroscopy and Its Calibration. Crit. Rev. Anal. Chem. 2010, 40, 246–260. [Google Scholar] [CrossRef]
- One Touch Select Plus. Available online: https://www.onetouch.in/sites/default/files/2024-01/07262803B_Owners_Guide_SPS_IN_LEG_R1_web.pdf (accessed on 10 June 2024).
- Diabetes Diagnosis & Tests. Available online: https://diabetes.org/about-diabetes/diagnosis (accessed on 21 April 2024).
Disclaimer/Publisher’s Note: The statements, opinions and data contained in all publications are solely those of the individual author(s) and contributor(s) and not of MDPI and/or the editor(s). MDPI and/or the editor(s) disclaim responsibility for any injury to people or property resulting from any ideas, methods, instructions or products referred to in the content. |
© 2024 by the authors. Licensee MDPI, Basel, Switzerland. This article is an open access article distributed under the terms and conditions of the Creative Commons Attribution (CC BY) license (https://creativecommons.org/licenses/by/4.0/).