Article

Towards a Sustainable Laser Powder Bed Fusion Process via the Characterisation of Additively Manufactured Nitinol Parts

1
School of Mechanical and Manufacturing Engineering, Dublin City University, D09 V209 Dublin, Ireland
2
Advanced Processing Technology Research Centre APT, D09 V209 Dublin, Ireland
3
I-Form Advanced Manufacturing Research Centre, D04 C1P1 Dublin, Ireland
4
Fort Wayne Metals Ireland Ltd., F23 CK27 Castlebar, Ireland
5
School of Science, University College Dublin, D04 C1P1 Dublin, Ireland
*
Author to whom correspondence should be addressed.
Designs 2024, 8(3), 45; https://doi.org/10.3390/designs8030045
Submission received: 16 April 2024 / Revised: 10 May 2024 / Accepted: 13 May 2024 / Published: 15 May 2024
(This article belongs to the Section Mechanical Engineering Design)

Abstract

:
Is additive manufacturing (AM) a sustainable process? Can the process be optimised to produce sustainable AM parts and production techniques? Additive manufacturing offers the production of parts made of different types of materials in addition to the complex geometry that is difficult or impossible to produce by using the traditional subtractive methods. This study is focused on the optimisation of laser powder bed fusion (L-PBF), one of the most common technologies used in additive manufacturing and 3D printing. This research was carried out by modulating the build layer thickness of the deposited metal powder and the input volumetric energy density. The aim of the proposed strategy is to save the build time by maximizing the applied layer thickness of nitinol powder while retrieving the different AM part properties. The saving in the process time has a direct effect on the total cost of the produced part as a result of several components like electric energy, inert gas consumption, and labour. Nickel-rich nitinol (52.39 Ni at.%) was selected for investigation in this study due to its extremely high superplastic and shape memory properties in addition to the wide application in various industries like aerospace, biomedical, and automotive. The results obtained show that significant energy and material consumption can be found by producing near full dens AM parts with limited or no alteration in chemical and mechanical properties.

1. Introduction

The growing awareness of climate change and the formulation of stricter environmental legislations have emerged as significant drivers for the development and adoption of more sustainable manufacturing solutions as part of Industry 4.0, the latest industrial revolution. Metal additive manufacturing (MAM), poised to be an essential ingredient of Industry 4.0, is a family of metal-based additive technologies encompassing powder bed, powder feed, and wire feed processes [1,2]. These processes differ in terms of how they introduce the feedstock into the process and how they fuse or bond the feedstock. Fusion-based technologies can be further classified based on the heat source utilised for melting and fusion—namely, laser or electron beam. Among the array of fusion-based MAM technologies, laser powder bed fusion (L-PBF) currently stands as a leading technology, distinguished by its increased precision and resolution when compared to alternative techniques [3,4,5].
In contrast to conventional subtractive manufacturing techniques, MAM offers the potential for several sustainable advantages, including the lightweighting of components, the consolidation of multi-component assemblies into singular components, and reduced raw material waste by eliminating the necessity to remove material from larger billets as is customary in subtractive machining [1,6].
Numerous studies have assessed the environmental and economic sustainability of MAM parts in comparison to those produced using traditional methods [2,6,7]. Within each MAM process, manufacturers hold the capacity to influence part sustainability by optimizing resource consumption without compromising product functionality. Within the L-PBF process, hundreds of input parameters exist; however, the most significant factors include laser power, scanning speed, laser spot size, hatch distance, and layer thickness [8]. Historically, process parameter development has centred on achieving parts with maximised density, minimal process-related defects, and the requisite mechanical properties, with limited emphasis on optimisation for sustainability. Consequently, a pressing need exists to maintain optimal melting and solidification conditions while simultaneously maximizing production rates and minimizing power input to enhance sustainability metrics. Unfortunately, increasing production rates or decreasing power input often precipitates knock-on effects related to process defects.
For example, lack-of-fusion (LOF) porosity may arise due to insufficient penetration of the upper layer melt pool into the previously deposited layer or the absence of interpenetration between adjacent melt pools on the same layer. As layer thickness or hatch spacing increases, LOF porosity can become more prevalent, imposing an upper limit on these input parameters for a fixed laser power, scanning speed, and spot size. [9] Another prevalent process-related defect is keyhole porosity, which occurs when the laser processing mode moves from conduction mode to keyholing mode at high power intensities and slow scanning speeds, leading to metal vaporisation within the melt pool. Depending on local melt pool dynamics, formed vapor bubbles can become pinched off, either escaping to the surface or solidifying in the metal, resulting in keyhole-induced porosity [3,10,11]. This defect places restrictions on the maximum powder layer thickness that can be processed by means of increasing the laser power at low scanning speeds. The third process-related defect, known as balling, also contributes to porosity in L-PBF. Balling manifests in two scenarios: The first is during incomplete melting at low power, high scanning speed, or high layer thicknesses. During incomplete melting, the melt pool consists of a solid/liquid mixture with high viscosity and poor wettability which can result in a string of unconnected balls or beads along the scan direction [12]. The second case occurs when the melt pool is fully molten during regimes of high laser power and high scanning speed. This type of balling is theorised to occur due to the Plateau–Rayleigh (P-R) instability, which theorises that a cylindrical column of liquid is an unstable shape due to surface tension effects, therefore tending to break up into beads whose total surface tension is lower [13]. The Rosenthal solution predicts that as the power and scan speed increase, so does the melt pool length-to-width ratio, thereby increasing the melt pool’s instability and the tendency for balling, thus placing restrictions on build rates [14]. Researchers investigated the formation of such defects and the way to mitigate them both experimentally and mathematically [15,16]. The study was based on a finite element model to simulate the formation of voids during the melting and solidification and the tension–compression associated with it.
Within the scope of Industry 4.0, the capability to additively manufacture Shape Memory Alloys (SMAs), enabling part shape and material properties to adapt to external conditions, holds significant value. Nitinol, a prominent SMA consisting of nearly equal-atomic proportions of nickel and titanium, has found widespread application in aerospace and medical devices due to its commendable attributes, including shape memory (SM), superelasticity (SE), biocompatibility, and corrosion resistance [17]. Nitinol poses challenges when processed using traditional manufacturing methods given its low machinability, limited permissible cold deformation, the challenges associated with welding without forming brittle intermetallic compounds, and sensitivity to thermomechanical processing [18,19]. Consequently, the desire to fabricate nitinol using AM has grown.
The SM and SE properties of nitinol originate from its ability to undergo a reversible solid-state phase transformation between the martensite and austenite phases. The martensite phase features a twinned monoclinic structure (B19’) and is stable at lower temperatures, whereas the austenite (B2) phase exhibits a highly symmetric, ordered Body-Centred Cubic (BCC) structure that is stable at higher temperatures [18]. To demonstrate SM, the SMA must be cooled without load, initiating a transformation from austenite to twinned martensite. The application of load results in elastic deformation of the matrix, followed by martensite detwinning accommodating the strain. Upon reheating above the Austenite Finish (Af) temperature, the parent phase is restored, returning the original shape. This effect can recover strains of between 6 and 8% [20]. To demonstrate SE requires the SMA being in the high-temperature austenite phase. Loading results in elastic deformation, followed by a Stress-Induced Martensite (SIM) transformation which occurs at stresses above the martensite critical stress. Providing loading is stopped before the onset of plastic deformation, the strains are recoverable during unloading, thus allowing nitinol to accommodate strains up to 8% [21].
The phase transformation temperatures of nitinol are highly sensitive to nickel and titanium content. In the nickel content range of 50–51 at.%, increasing the nickel content by 0.1 at.% can result in as much as a 8–10 °C decrease in the Martensite Start (Ms) temperature during cooling [22]. Aging of nickel-rich alloys in the 300–500 °C range can yield nickel-rich precipitates depleting the matrix of nickel, thereby increasing the Af temperature whilst also enhancing one-way reversible strain [23]. Impurities such as carbon and oxygen can lower transformation temperatures by readily forming inclusions with titanium in the form of TiC and Ti4Ni2Ox, thus increasing the concentration of nickel in the matrix. These inclusions are brittle in nature with larger inclusions having a more drastic effect on fatigue life [16]. For alloys with a nickel content below approximately 49.75 at. %, titanium saturation occurs, thus limiting the upper end of the transformation temperatures possible with binary nitinol [22].
Given nitinol’s sensitivity to composition, impurities, and microstructure, the AM of nitinol presents many challenges to ensure fabricated parts have maximised density, minimised defects, and have the desired mechanical, SM, or SE properties, while also optimizing sustainability. Previous studies have shown that the process parameters used influence the microstructure and composition of the obtained parts, affecting both mechanical performance and phase transformation temperatures [24]. A study by Haberland et al. [25] using Ni-rich, near-equiatomic, and Ti-rich powders found that the transformation temperatures of all three powders increased with increasing volumetric energy density (VED), which was attributed to the increase in nickel evaporation at the higher VEDs. Nickel was reported as having a lower vaporisation enthalpy of 374.8 kJ/mol versus 425.5 kJ/mol for titanium and also a lower boiling of 2913 °C versus 3287 °C for titanium [24]. A study by Speirs et al. [25] noted that samples produced with a high oxygen content of 1800 ppm had a lower transformation temperature than samples produced with an oxygen content of 220 ppm [26]. Other studies have shown that by increasing the VED, oxygen uptake is also expected to increase. Optimal process parameters reported in the literature encompass a broad spectrum of VEDs, ranging from 55 to 235 J/mm3 with no consensus on an ideal range from 55 to 235 J/mm3 [25,27,28,29,30,31,32]. For example, Tan et al. [31] reported a VED of 60–90 J/mm3 as being optimal for achieving high densities with minimal defects and low impurity pick-up, whereas Walker et al. [28] reported a VED of 55.6 J/mm3 as being ideal. Moghaddam et al. [31] reported a VED of 83.33 J/mm3 as being optimal for achieving parts with high superelasticity and excellent phase transformation performance. Dadbakhsh et al. [30] reported higher values of 111–126 J/mm3 as being optimal, and Haberland et al. [25] reported values as high as 234 J/mm3 as being optimal for producing high-quality parts that meet impurity requirements for medical-grade nitinol. Biffi et al., found that parts could be fabricated with a wide VED range of 63–160 J/mm3 [27]
In the subsequent sections of this paper, the theoretical underpinnings of layer thickness in AM and its implications on time efficiency, energy consumption, and consumable usage will be explored. Through a synthesis of experimental data, the authors aim to provide a comprehensive understanding of how adjusting the layer thickness can be strategically leveraged to enhance the sustainability of additive manufacturing.

2. Materials and Methods

2.1. Laser Powder Bed Fusion (L-PBF)

The process is one of the seven additive manufacturing (AM) technologies classified by the American Society for Testing and Materials (ASTM) [33]. The process can be described as the process of producing engineered parts by adding and fusing metal powder layers, usually layer by layer until the full part is completed. The thermal source used to fuse the metal powder is fibre laser beam irradiation from IPG Photonics with the wavelength of 1.068 microns. The following Figure 1 shows a detailed description of a typical build chamber that mimics the Aconity MINI metal printer from Aachen, Germany, which is used in this study.
The metal printer is equipped with a pyrometer that acquires light reflected from the melt pool in the infra-red (IR) range of 1500 to 1700 nm which is directly related to the melt pool temperature. Moreover, the printer is supplied with a preheating element and a chiller unit for utilising the global temperature control during the print in addition to the accurate control over the cooling rate upon the print completion. The pre-heater and the chiller consume electric power of 5.8 and 6 kW/hr, respectively. Aconity MINI consumes power of 17.5 kW/hr.
A three-parameter Design of Experiment (DoE) model in two levels was developed for producing the test samples. Table 1 lists the produced samples with the corresponding processing parameters and the resulting volumetric energy density (VED) for the different layer thicknesses (LTs). The laser beam hatch spacing (HS) was set to a fixed value of 80 microns.
The VED was calculated by using the following equation:
VED   ( J m m 3 ) = I n p u t   l a s e r   p o w e r W S c a n n i n g   s p e e d , m m s × L T , m m × H S , m m

2.2. Build Time Study

This study is designed on time bases. The time consumed in building an AM part can be explained by the following breakdown for each feature carried out during the fusion of each layer. For a symmetrical part geometry similar to the cube used in this study, the total build time (Tt) can be calculated by multiplying the time consumed per layer by the total number of layers. Parts with complex geometry and varying layer surface area require the build time per layer to be varied accordingly. In principle, Tt can be represented by the time required for the following:
Tt = Build plate movement time (Bp.t) + Powder re-coater movement time (Pr.t) + Powder supply time (Ps.t) + Exposure time (Ex.t)
The terms indicated in Equation (1) can be explained and correspond to Figure 1 as follows:
(a)
Build plate movement time (Bp.t)
This time is consumed during the downward movement of the build plate which can be represented by two portions:
i
Safety movement, when the build plate moves down for a certain distance (0.5 mm in the case of Aconity MINI) immediately after fusing the current powder layer and prior to the re-coater movement. This is important in order to avoid any collision between the re-coater blade and the build part in case of any warpage or uplifts.
ii
Return movement, when the build plate moves back upwards leaving the exact set space for the new powder layer thickness.
B p . t = Time required for   ( i ) + Time required for   ( ii )                                                                   = S a f e t y   d i s t a n c e S e t   s p e e d + S a f e t y   d i s t a n c e s e t   l a y e r   t h i c k n e s s S e t   S p e e d                                                                         = 0.5   m m 0.5   m / s + 0.5   m m s e t   l a y e r   t h i c k n e s s 0.5   m m / s
The time required for this feature for the three different layer thicknesses (30, 60, and 90 µm) used in this study are Bp.t = 1.94, 1.88, and 1.82 s, respectively.
  • (b) Powder re-coater movement time (Pr.t)
This time is consumed during the forward/backward movement of the re-coater axis and blade for the powder deposition feature. This movement is composed of three strokes:
i
The return stroke when the re-coater (part no. 3 in Figure 1) moves in idle status to the front of the build chamber as prior to the powder deposition on the build plate. This is an adjustable speed, and during the entire study, this speed was set to 250 mm/s.
ii
The transport stroke when the metal powder is transmitted from the powder supply (no. 7) to the build plate (no. 6). This speed was set to a fixed value of 150 mm/s.
iii
The deposition stroke when the metal powder is placed on the build plate (or build part). This speed was set to a fixed value of 50 mm/s.
Thus:
P r . t = F u l l l   e n g t h   s t r o k e ( m a c h i n e   b e d ) R e t u r n   s p e e d + F u l l l   e n g t h   s t r o k e b u i l d   p l a t e   d i a m e t e r T r a n s p o r t   s p e e d + B u i l d   p l a t e   d i a m e t e r D e p o s i t i o n   s p e e d = 450   m m S e t   s p e e d   250   m m / s + 450 140   m m 150   m m / s + 140   m m 50   m m / s = 6.6   s
As can be seen, this time consumption is not related to the build layer thickness. Also, the last two speeds related to the powder transport and deposition were set to relatively lower values. This is important in order to secure high control over the powder deposition and reduce the looseness and spatter of the metal powder on the sides of the re-coater blade. This is crucial for consistent powder deposition, achieving accurate geometries and maintaining the integrity of the final product.
  • (c) Powder supply time (Ps.t)
This is the time required for the powder supply axis (no. 6 in Figure 1) to move upwards and deposit the metal powder in front of the powder re-coater. This movement stroke is proportional to the set value of the layer thickness and the applied supply factor. The latter is important in order to secure the sufficient amount of powder to be placed on the build plate and any excess powder will be pushed by the re-coater blade to the over-flow container (no. 4 in Figure 1).
Ps . t = L a y e r   t h i c k n e s s   v a l u e × S a f e t y   F a c t o r S p p l y   s p e e d
For this study, the supply factor value and the supply speed were set to 2 and 0.5 mm/s, respectively. This set-up result in supply times for the three layer thickness values of 0.12, 0.24, and 0.36 s, respectively.
  • (d) Exposure time (Ex.t)
This is the time required for the laser beam to completely fuse one singular build layer. This time interval is independent of the layer thickness and it is fixed for all samples since the input processing parameters like the scanning speed and the parts’ geometry and quantity are similar. This time was found to be 14 s for a set of 8 cube samples (1.75 s/cube).
Thus, the total time required per build layer can be found by applying Equation (1), and then the times for the entire build were found and are listed in the following Table 2:
The following Figure 2a summarises the time impact of each feature on the entire time required per build layer. The figure indicates that the major time consumption is that consumed during the laser exposure (fusion) and the powder re-coater movement. This can also be changed significantly depending on the build part’s dimensions and the number of parts being printed. The correlation between the build layer thickness and the total time required to produce each set of samples was found to be non-linear as can be seen in Figure 2b. This is due to the non-linearity in the number of layers of the different sets, which can be described by the following Equation (5):
Total build time (min) = 0.023x2 − 4.12x + 228
where x is the build layers thickness.

2.3. Material

The material selected for this study was gas-atomised nitinol (NiTi) supplied by Fort Wayne Metals, Castlebar, Ireland, with the chemical composition of Ni 52.39 (at%). This metal alloy was chosen for this study due to its wide application, especially in the biomedical and aerospace industries. Also, the chemical composition of this alloy is essential in identifying its application to be of the shape memory or superelastic type, which are related to the nickel content in the final AM part. The chemical composition and heat flow and phase transformation temperatures of the produced samples were tested by using an Oxford detector and a TA Discovery DSC2500, respectively, and compared to those of the virgin powder.

2.4. Testing and Inspection

The surface roughness and profilometry were carried out by using a Bruker Contour GT 3D microscope and were performed on two perpendicular sides facing the argon gas supply and the powder deposition direction.
The chemical composition and Energy-Dispersive X-ray (EDX) was carried out on all the different sides of the produced samples.
The nano-hardness testing was carried out by using a Bruker HYSITRON TI Premier nano-indenter. The test was performed in the build direction by producing three lines on one side of the test samples as shown in the following schematic diagram in Figure 3. The test strategy was based on performing multiple indents with a 20 µm transition distance by applying a maximum force of 9 µN and measuring the resulting depth penetration of the Berkovich indenter into the sample surface. The plot of this correlation reveals the elastic modulus of the produced AM parts and can be used for comparing the effect of the different layer thicknesses on the mechanical properties.

3. Results and Discussion

3.1. Relative Density

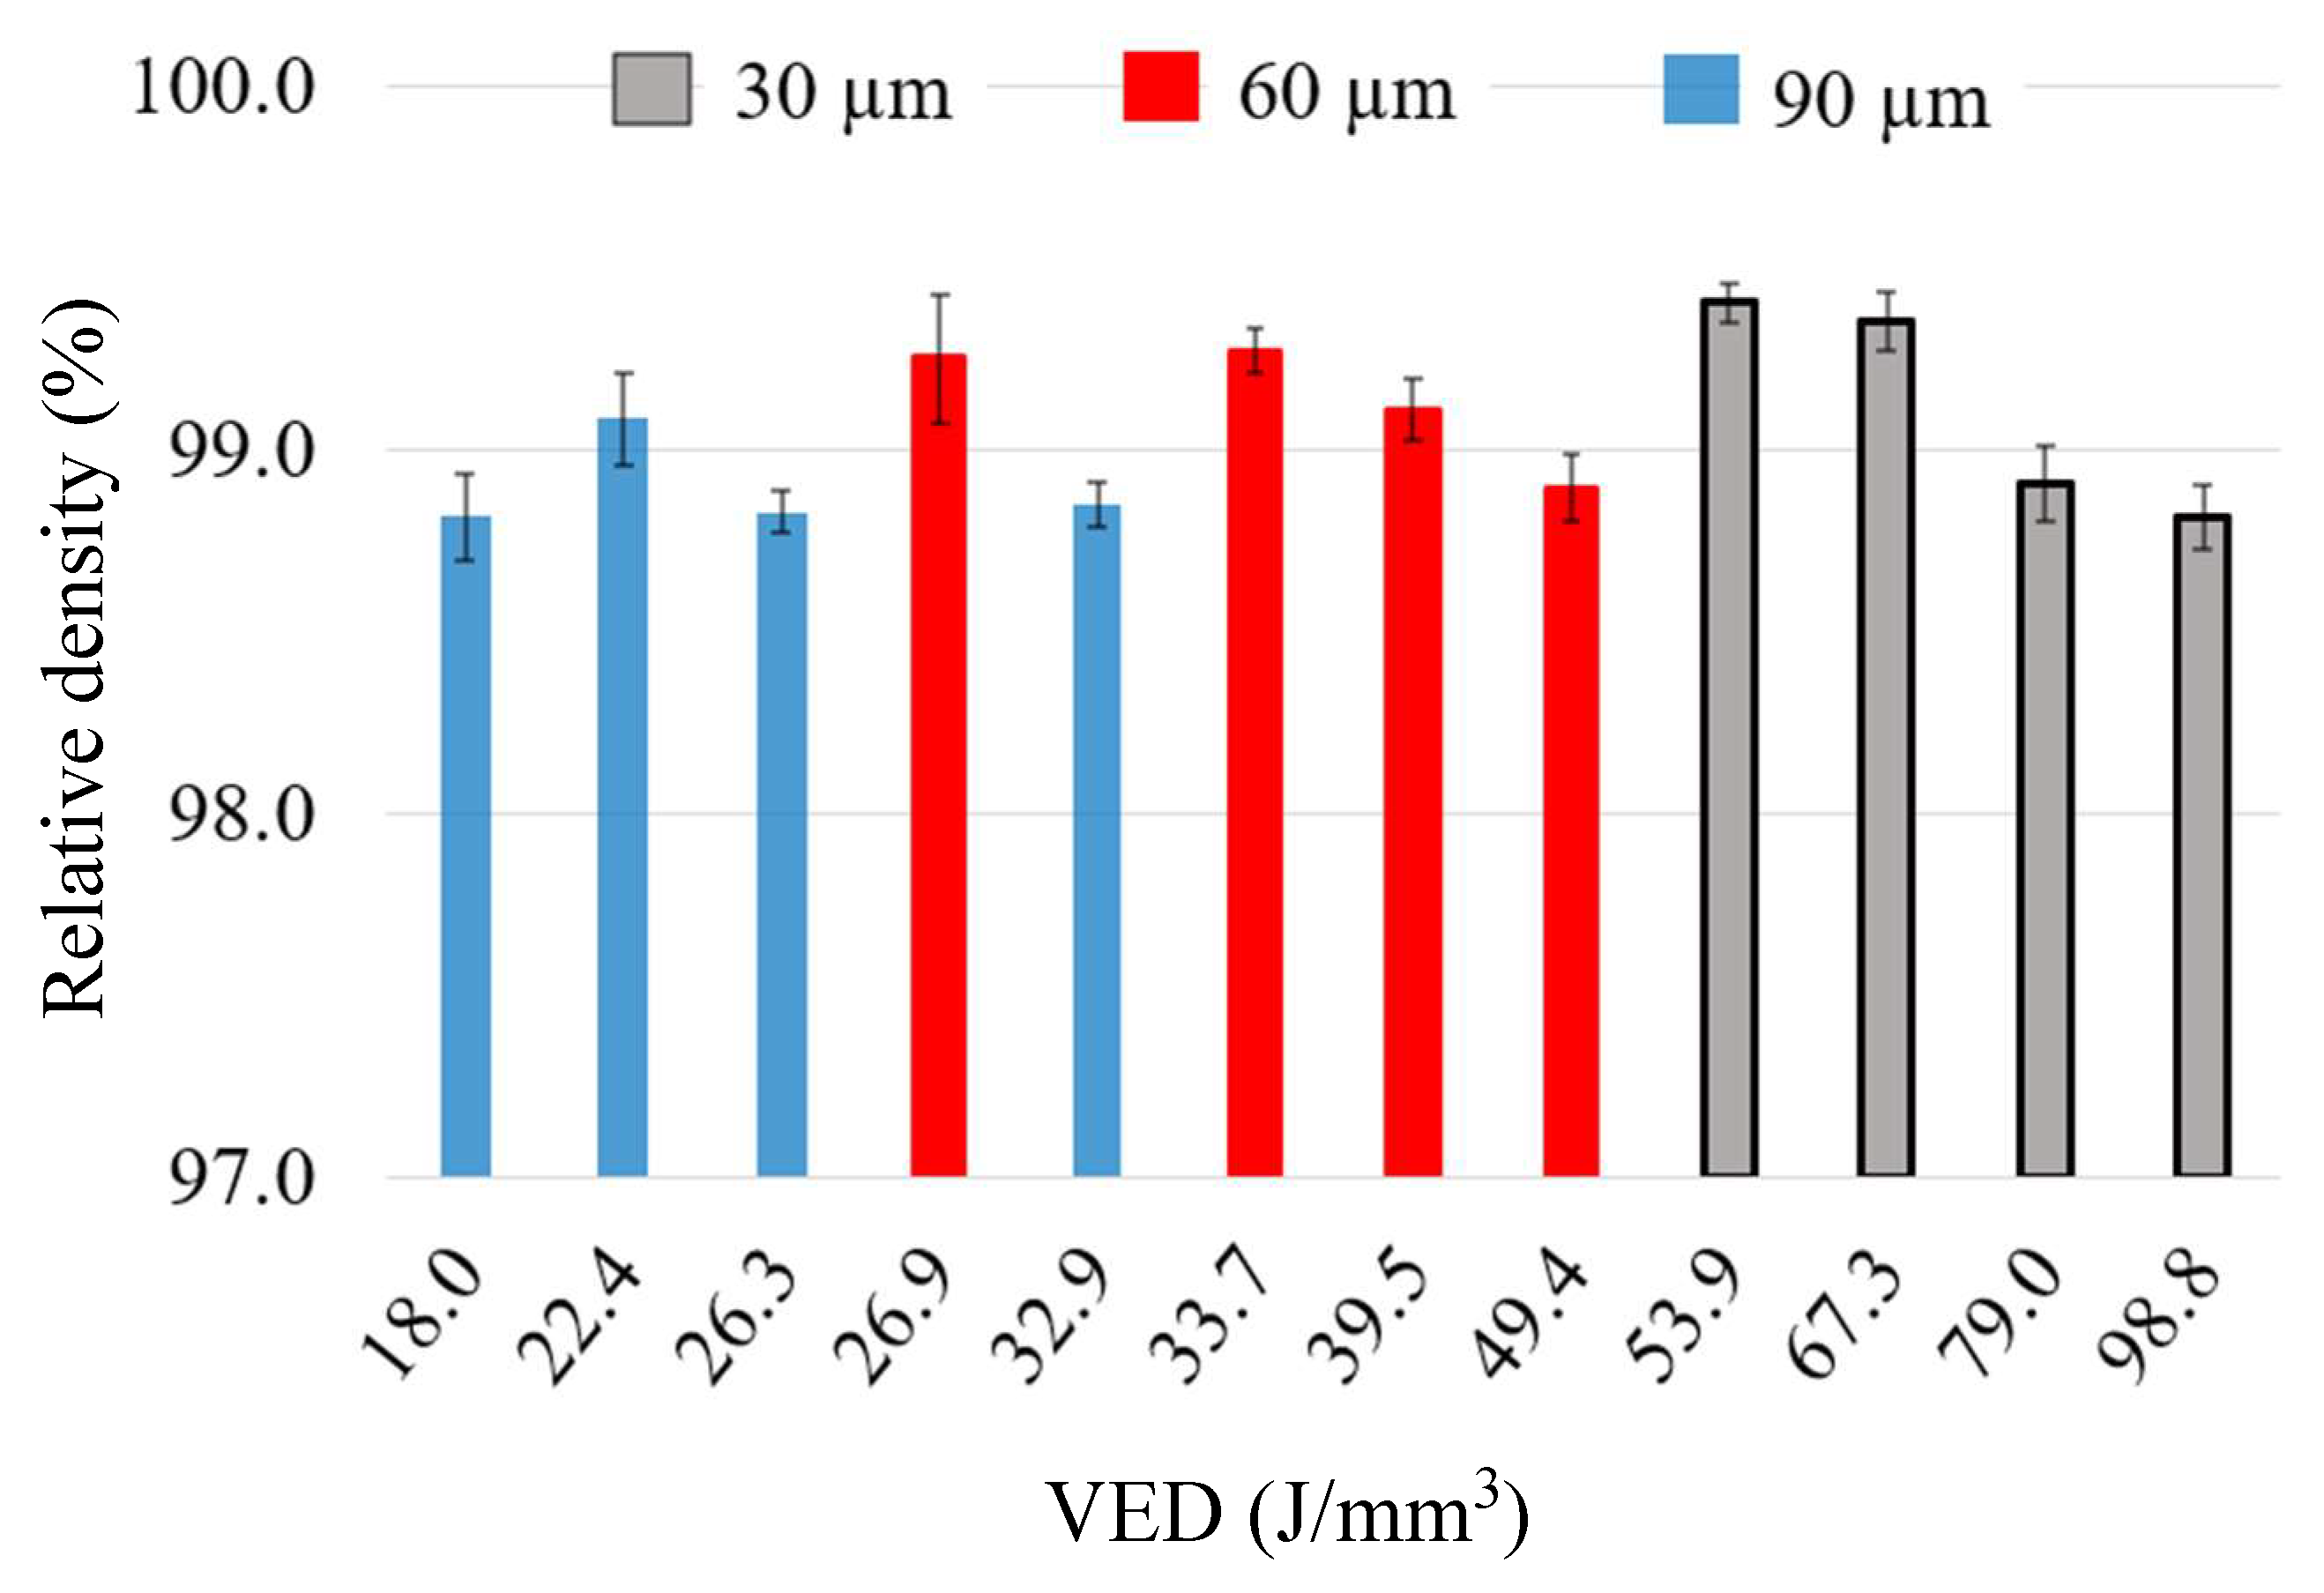
The relative density was obtained by using Archimedes’ principle in ethanol. Figure 4 shows the measured density of four samples from each set of the different layer thicknesses based on a fractional Design of Experiment (DoE) model. Those are the samples numbered (1, 2, 3, and 4) and listed in Table 1. Figure 4 suggests a noticeably improved density in the samples produced by using a 30-micron layer thickness which can be explained by the significant melting between the consecutive build layer as a result of the higher VED levels applied. A limited reduction in the density was observed when higher powder layer thicknesses were applied and the VED was reduced. The higher average relative density value obtained for the 90-micron LT was 99.1% for sample no. 2 (Table 1) processed with 160 W, 1100 mm/s, and 80 µm spot size resulting in a VED of 20 J/mm3.
Since this study is focused on reducing the production time by increasing the build layer thickness while maintaining a high density, focus was placed on sample no. 2 and the measured outputs were compared with the samples with the smaller LTs and same processing parameters.
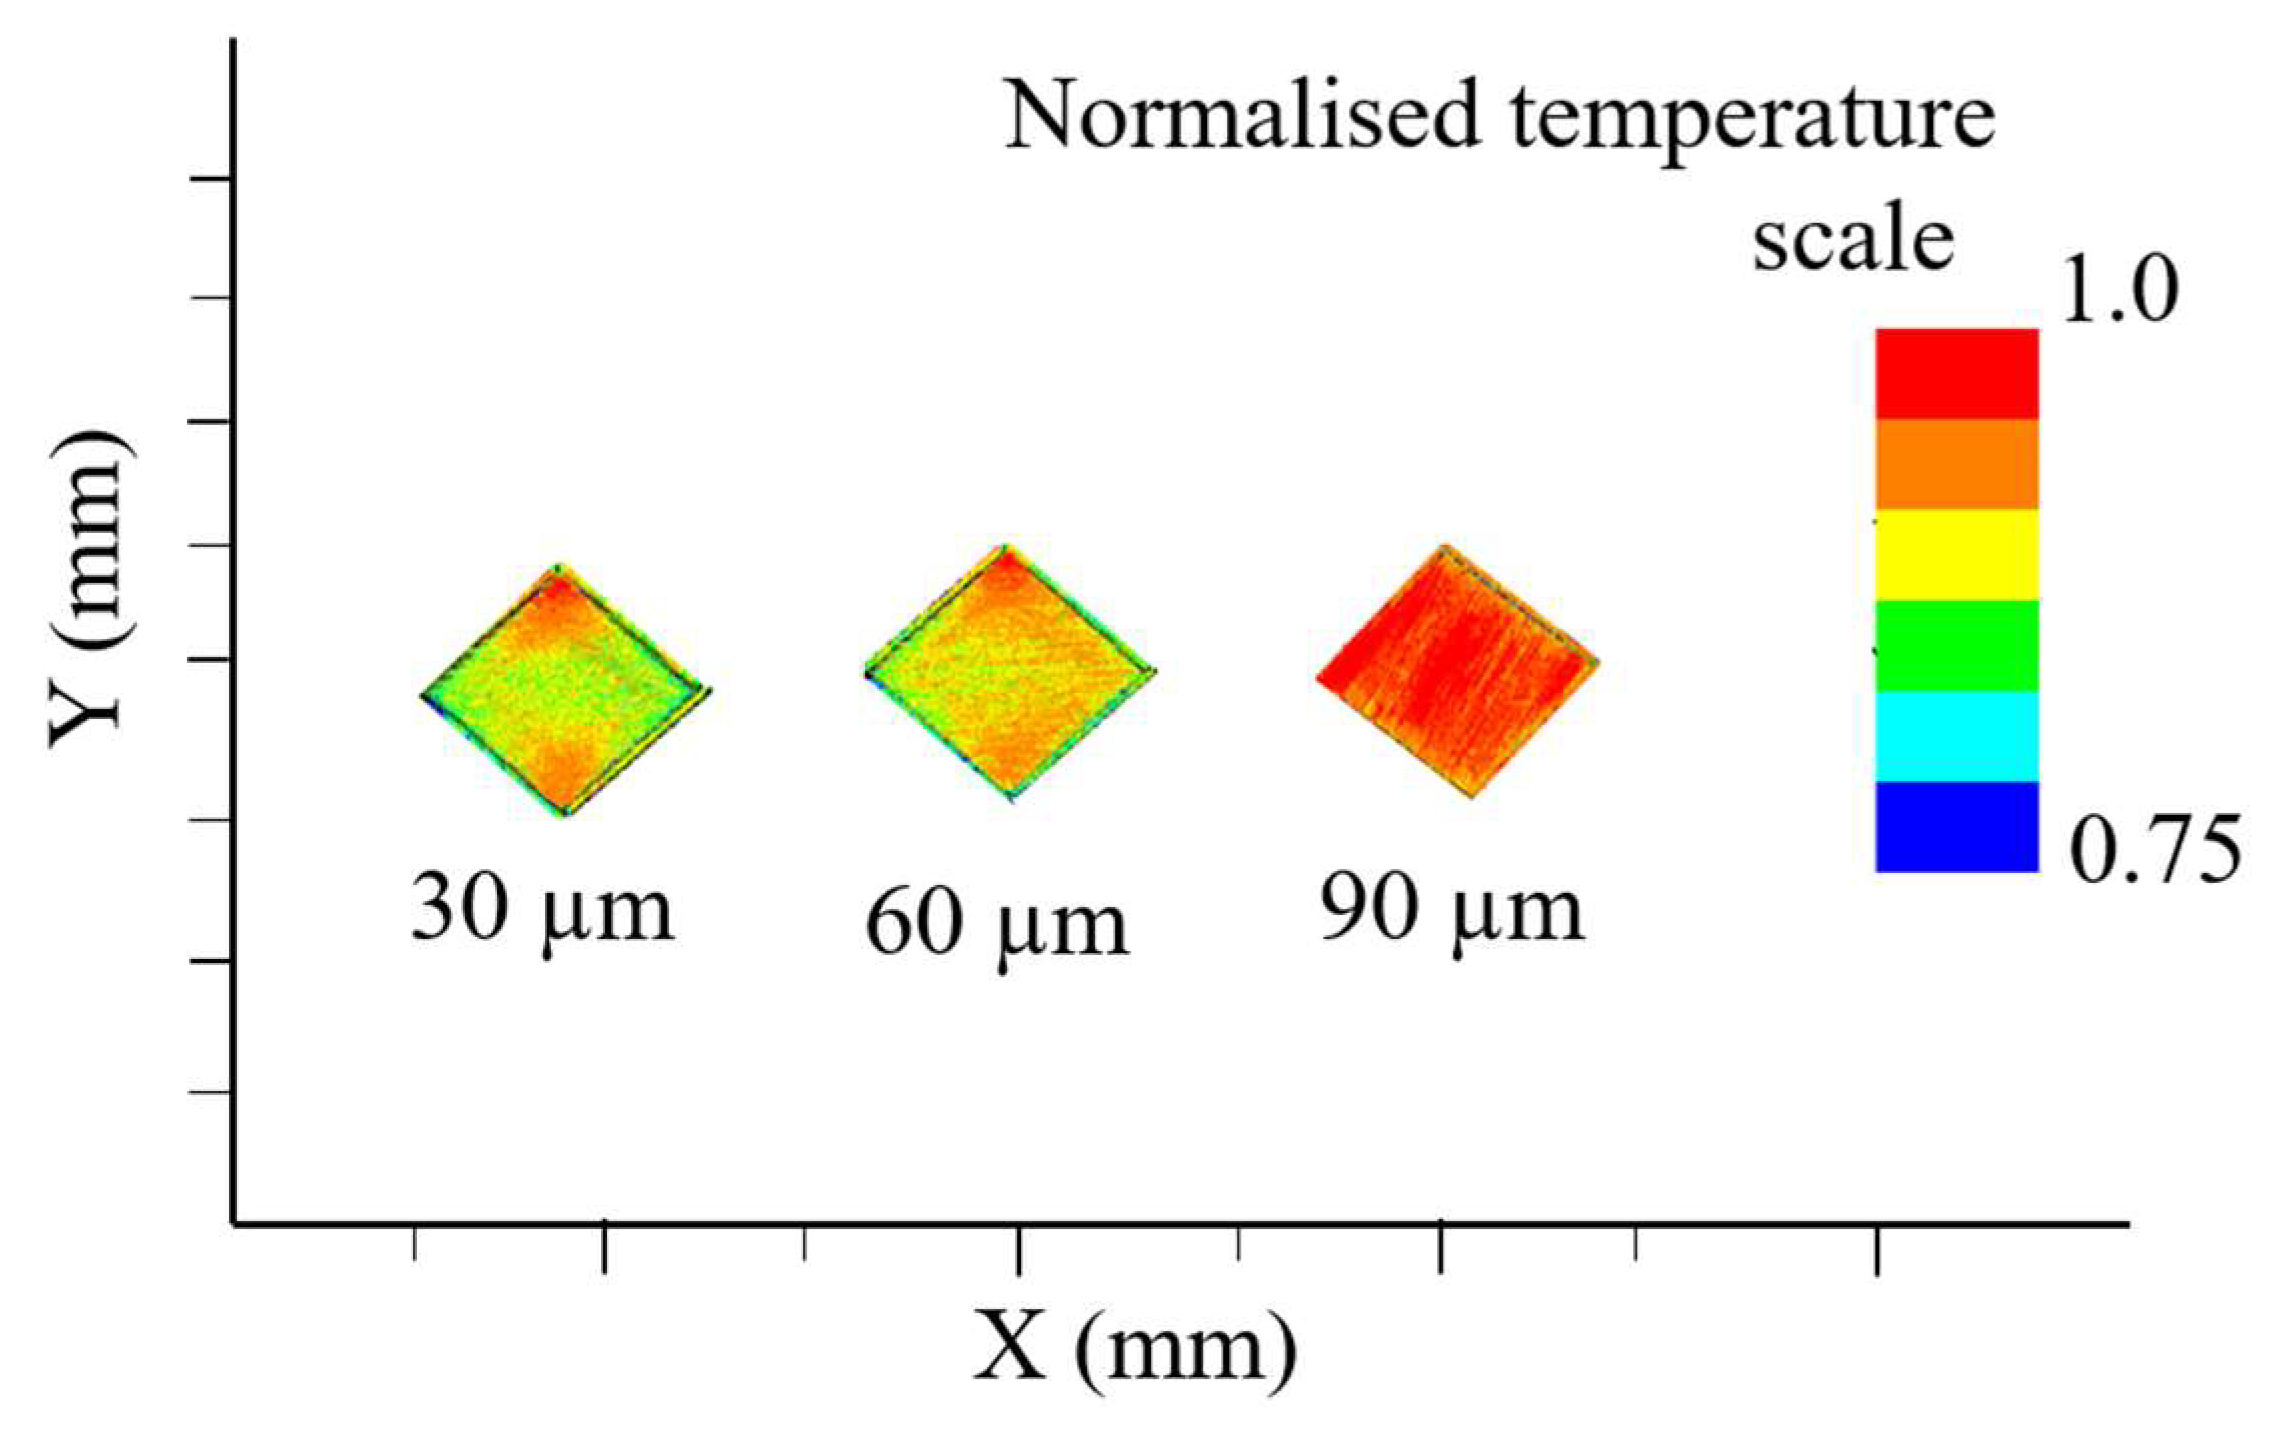
The decreased relative density with the increased LT can be explained by the need for more VED in order to achieve significant (full) melting of the excessive metal powder. This result was also expected since the powder is less heat-conductive compared to the solidified metal, leading to reduced heat dissipation to the surrounding and previous layers. This phenomenon leads to the powder surface temperature reaching high elevated levels, as can be seen in the following Figure 5.
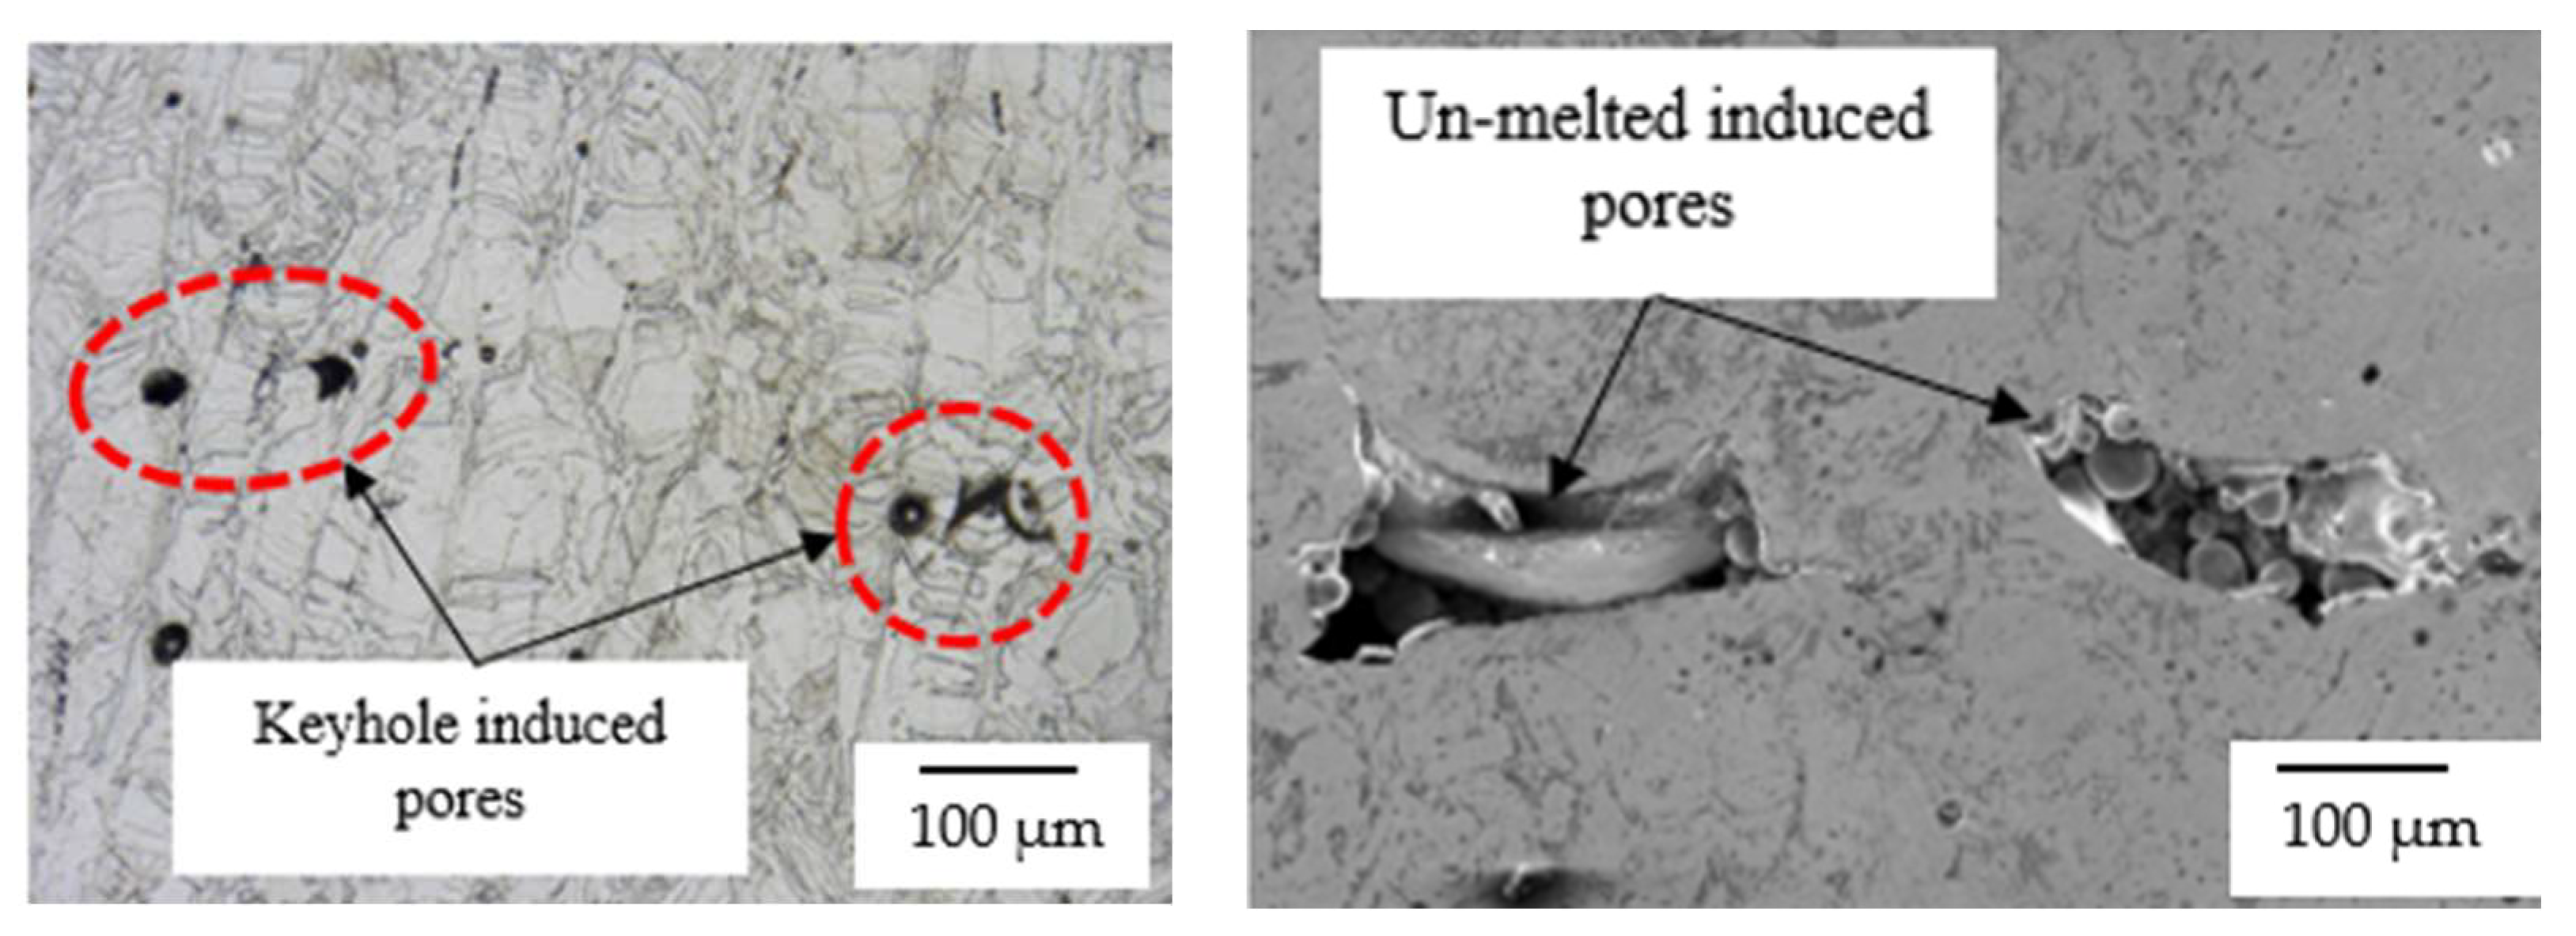
With the presence of this scenario, any increase in the VED will lead to overheating, keyhole formation, and more reduction in the part’s density as can be seen in the following samples processed with 90 µm LT, 26.3 and 32.9 J/mm3, respectively. On the other hand, the lower VED level results in a lack of fusion and reduced density as can be seen in Figure 4 with the sample processed with 18 J/mm3. The following Figure 6 shows optical image of a process-induced keyhole and an electronic (SEM) image of an unmelted-powder-induced porosity as examples of the aforementioned scenarios. No similar defects were observed when fusing the same LT of 90 µm with a VED of 22.4 J/mm3, indicating a sufficient amount of melting and heat dissipation to the previously built layer.

3.2. Surface Profile

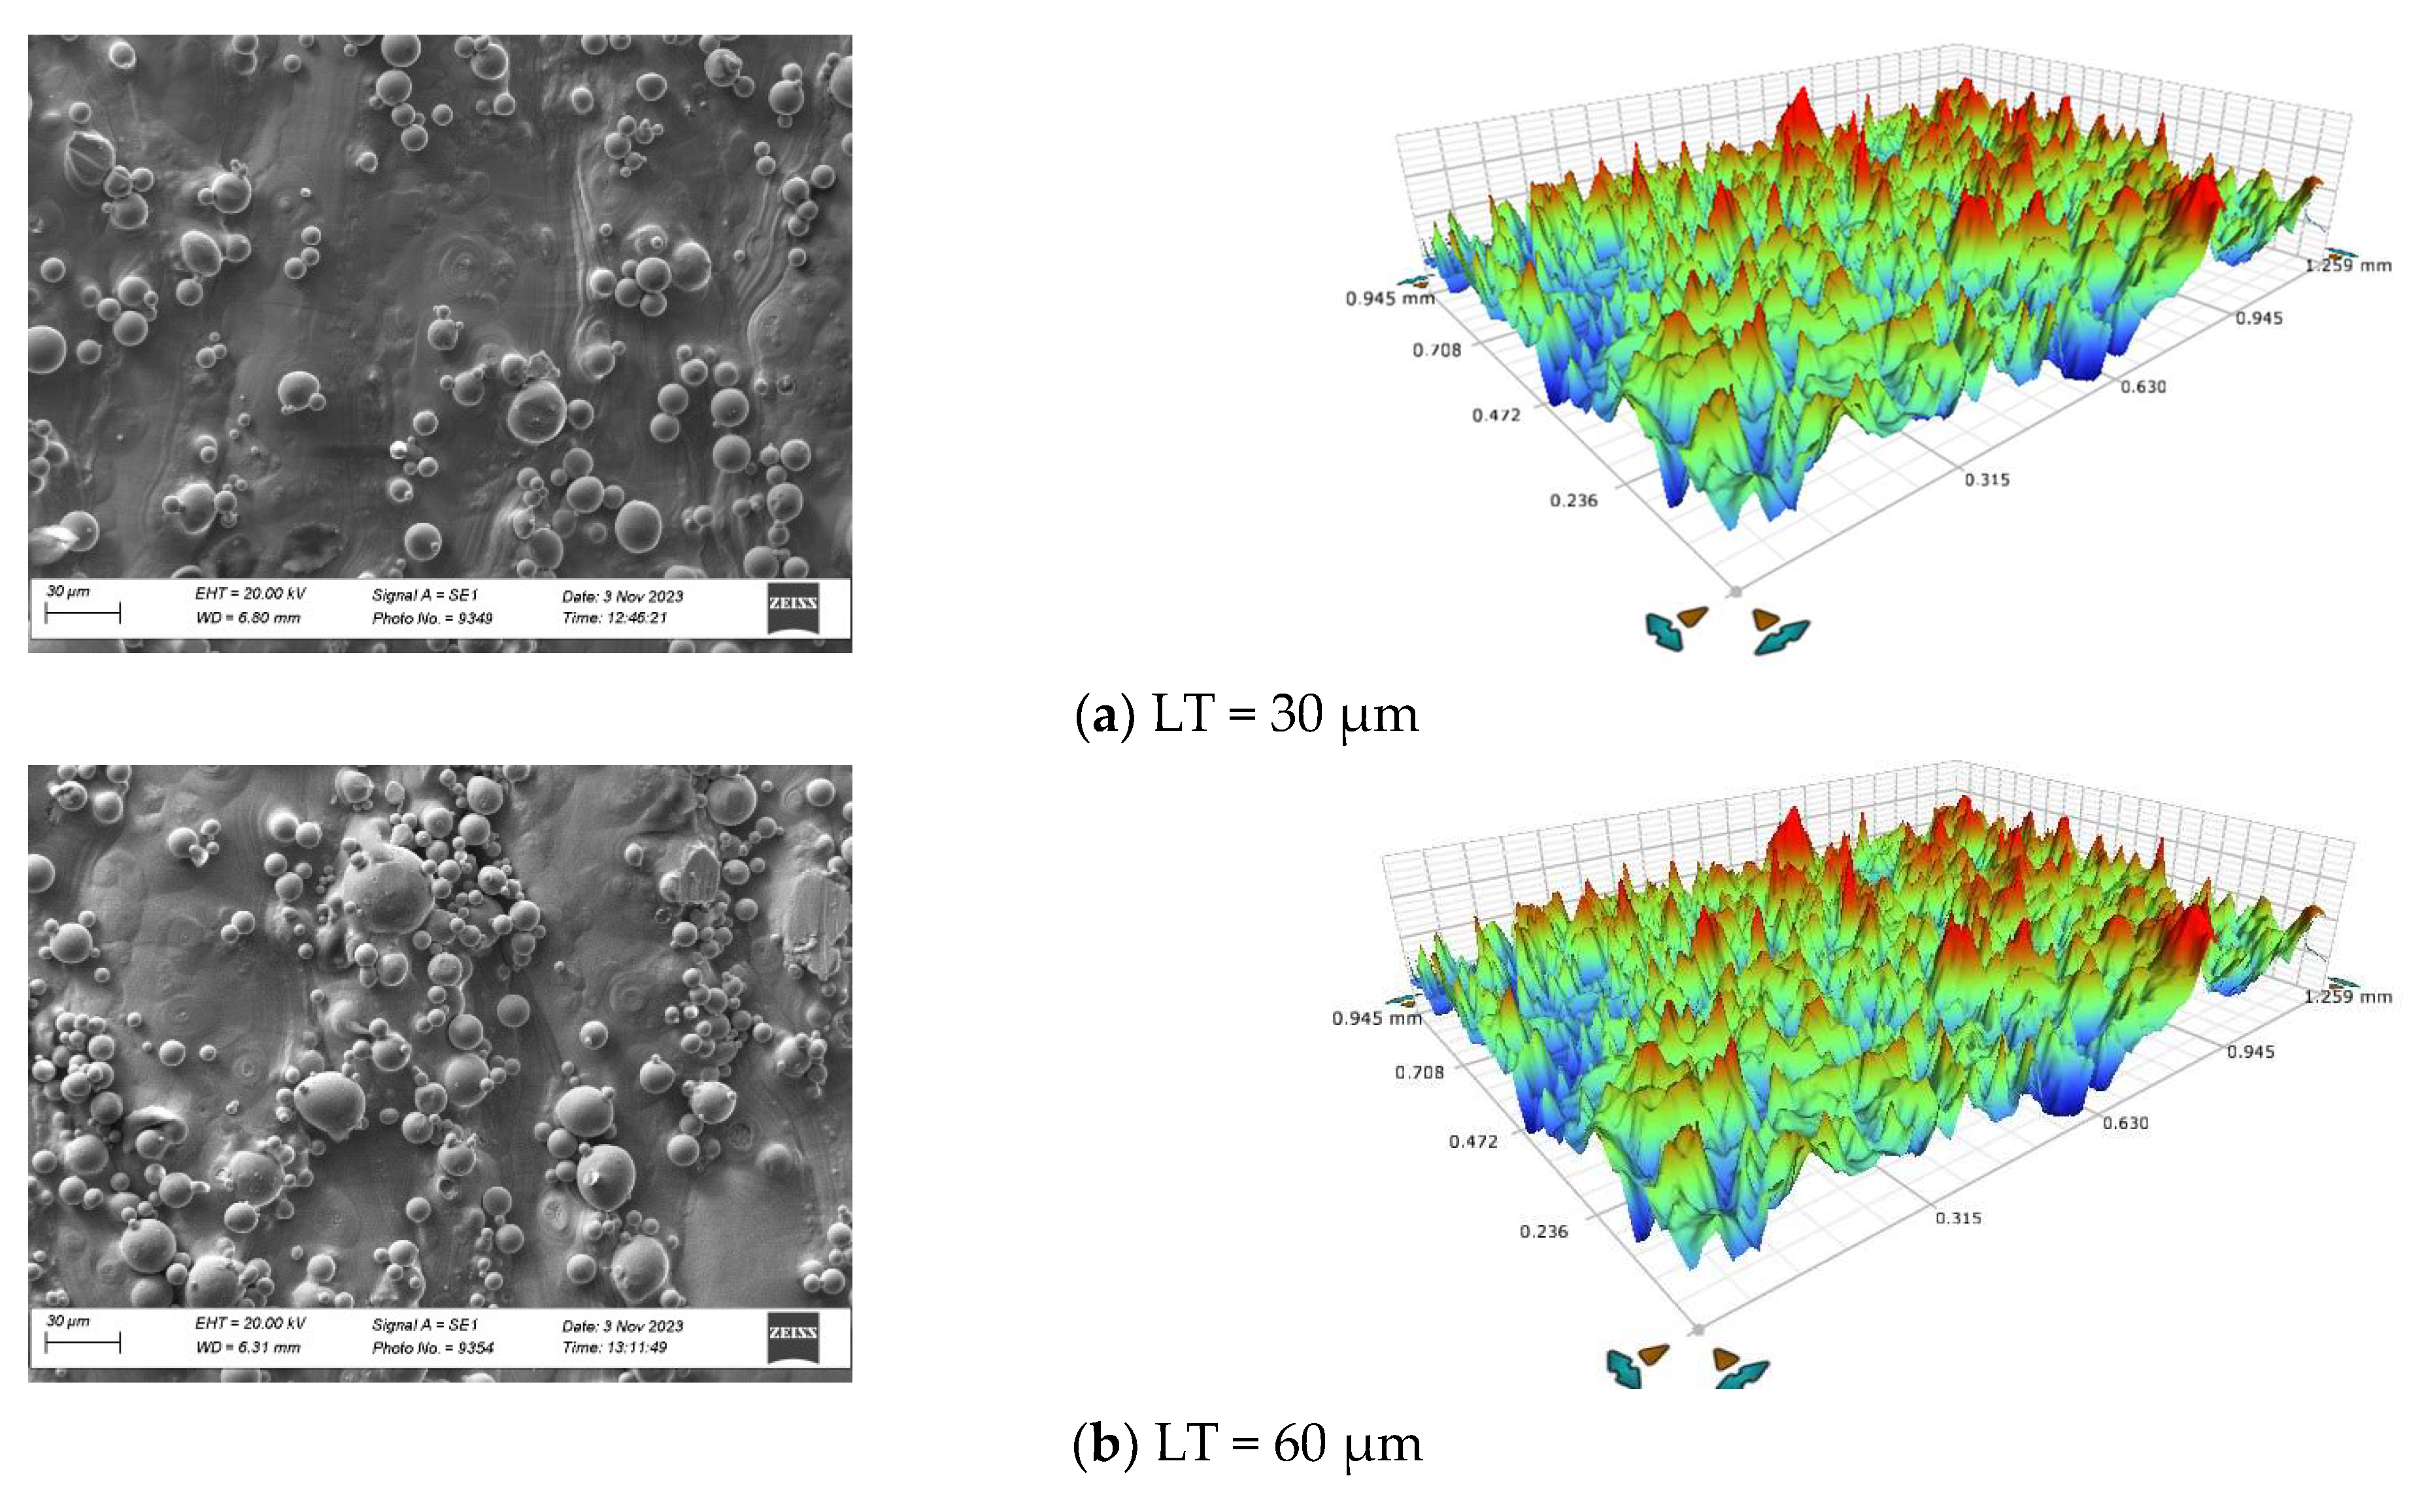
The surface profile investigations revealed the effect of increasing the powder layer thickness on the resulting surface roughness. The following Figure 7 shows the SEM and 3D optical microscopic images of the produced samples. The figures show the stair steps caused by fusing the consecutive build layers and the sintered powder particles. The results agree well with those reported in the literature [34,35,36,37,38], as can also be seen in the following Table 3 which lists the most important technical and scientific terms describing the surface profile. Those terms are as follows:
  • The average surface roughness (Sa), which expresses the mean of the absolute values of the surface profile above and below the mean plane within the captured area.
  • (Sz), which expresses the average of the height difference of the five highest peaks and the five lowest valleys.
As listed in Table 1, the input processing parameters for sample no. 2 are the same but differ in the resulting VED due to the different build layer thickness. The increased layer thickness resulted in a significant saving in the volumetric energy density and limited effects on the sample’s density and surface finish. The degradation in the surface quality is cause by the increased layer thickness producing more waves on the surface and an increase in the difference between the peaks and valleys.

3.3. Energy-Dispersive X-ray (EDX)

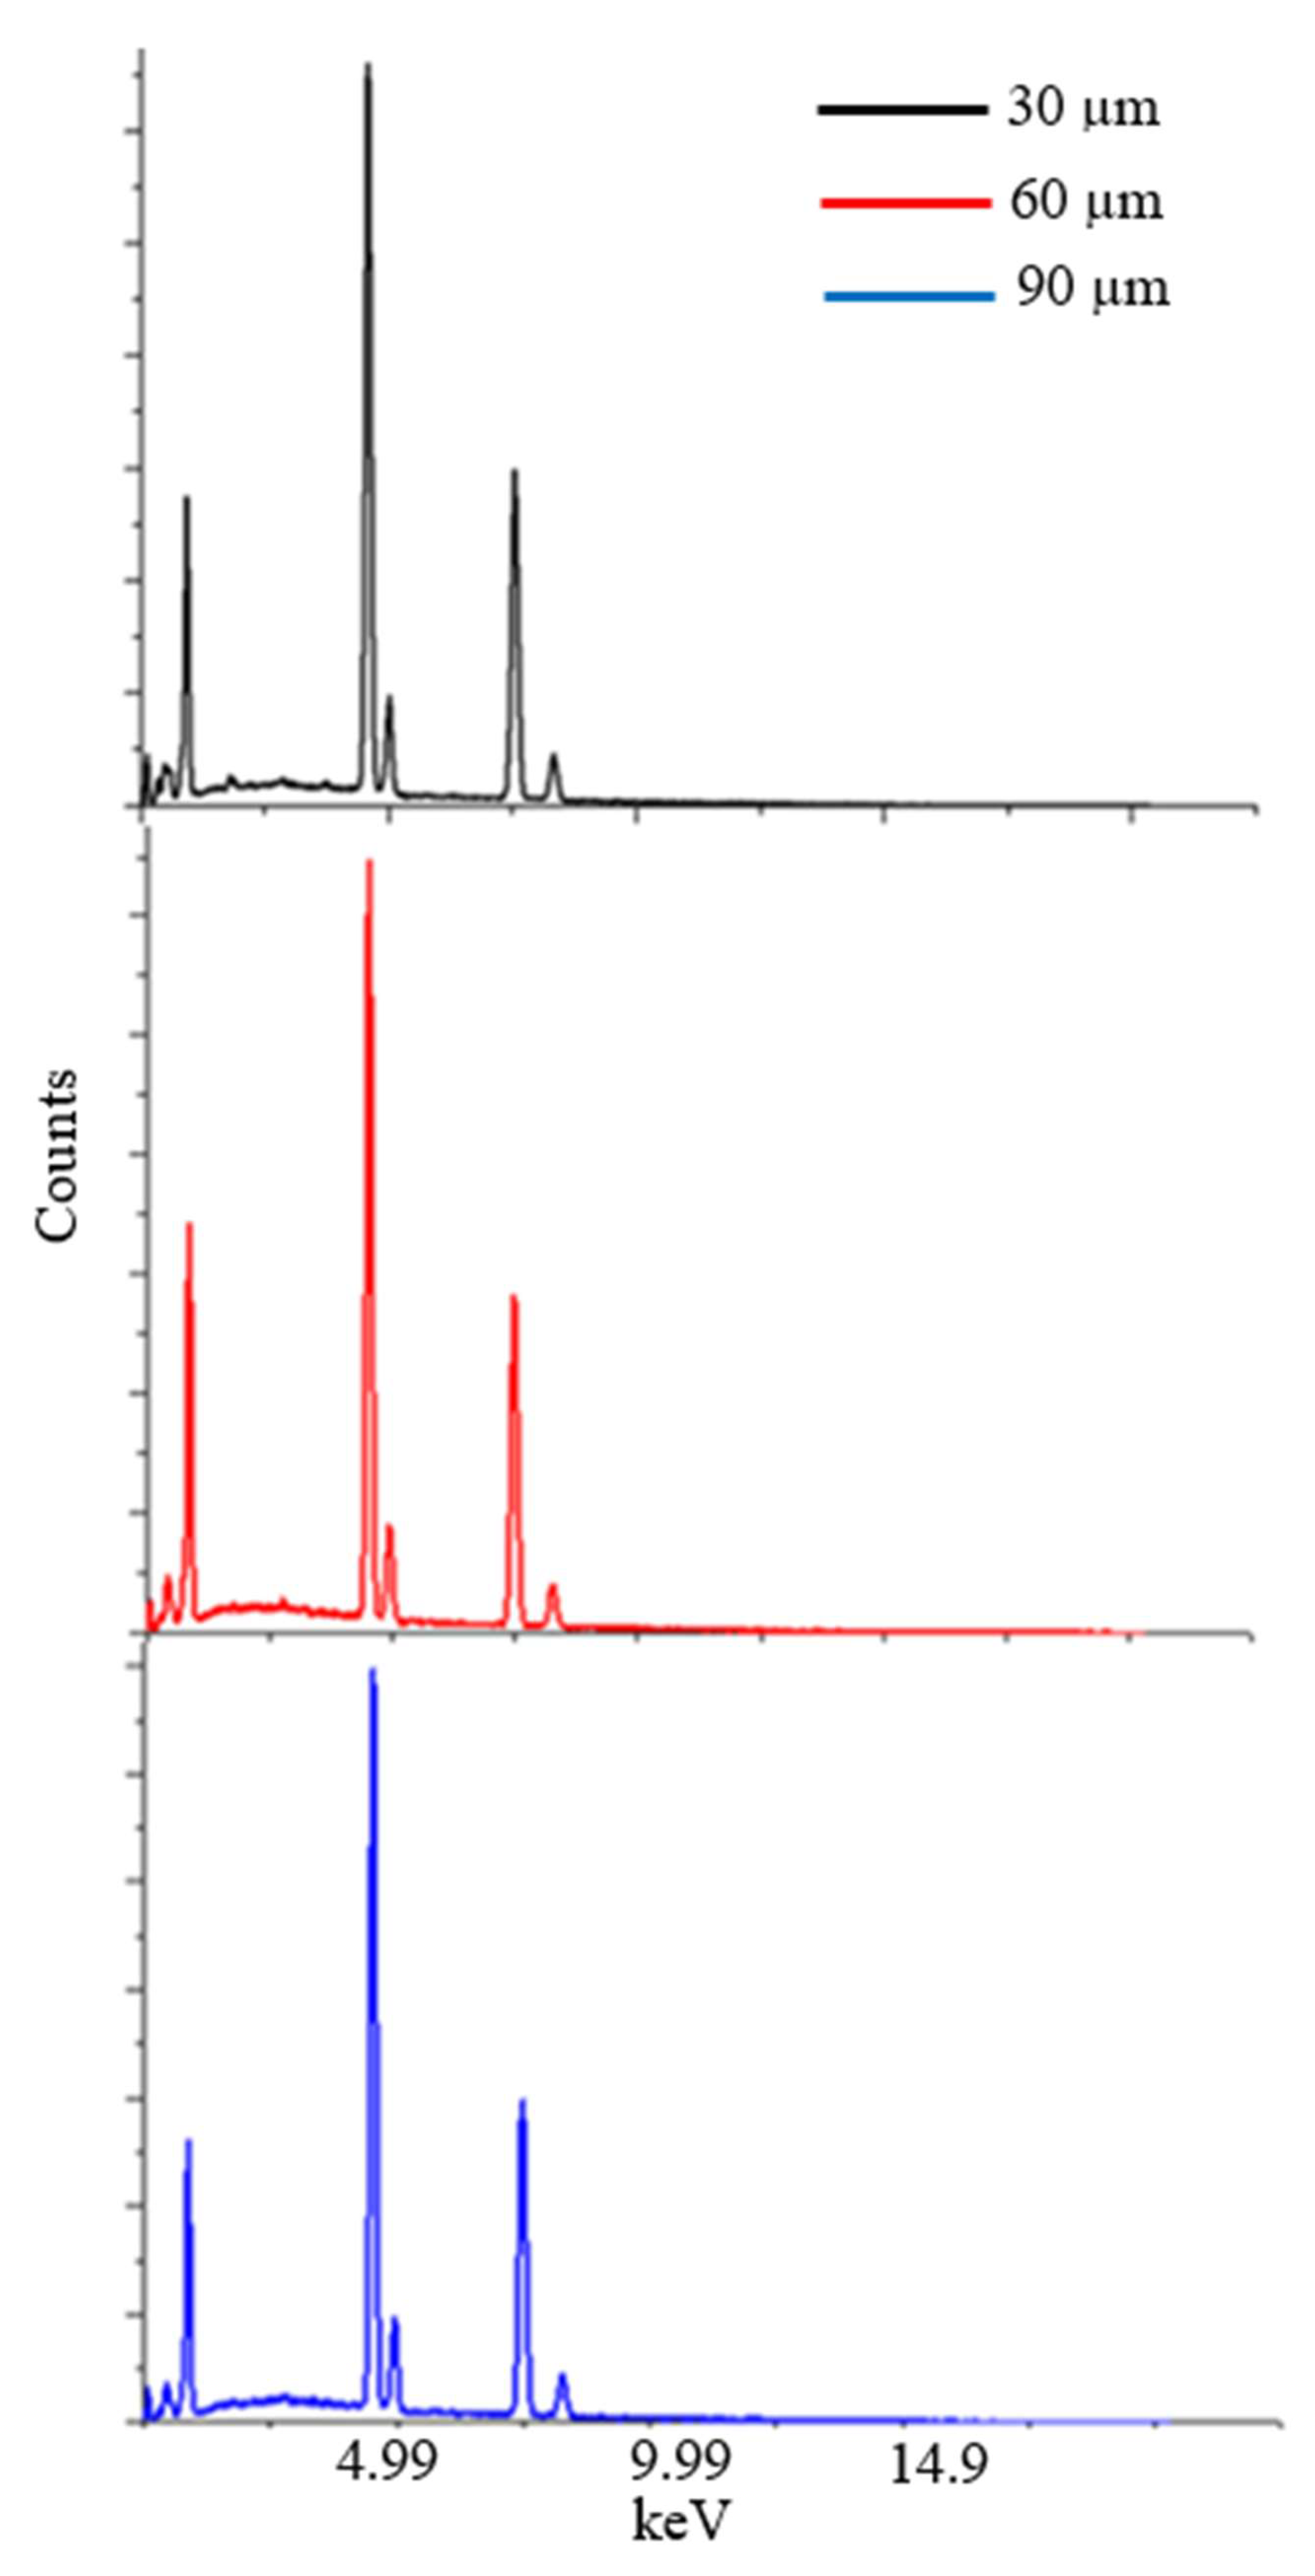
Limited reduction in the Ni content was obtained in the produced samples with the increase in the build layer thickness; see Table 4. Several studies reported similar results and explained the reduction in nickel by the increased temperatures associated with the increase in LT, as seen in Figure 5 [39,40,41,42,43,44,45,46]. The lower boiling temperature of nickel compared to titanium enhances the nickel loss at this level of layer surface temperatures. The EDX spectrum in Figure 8 below does not show a significant difference between the tested samples.

3.4. Differential Scanning Calorimetry (DSC)

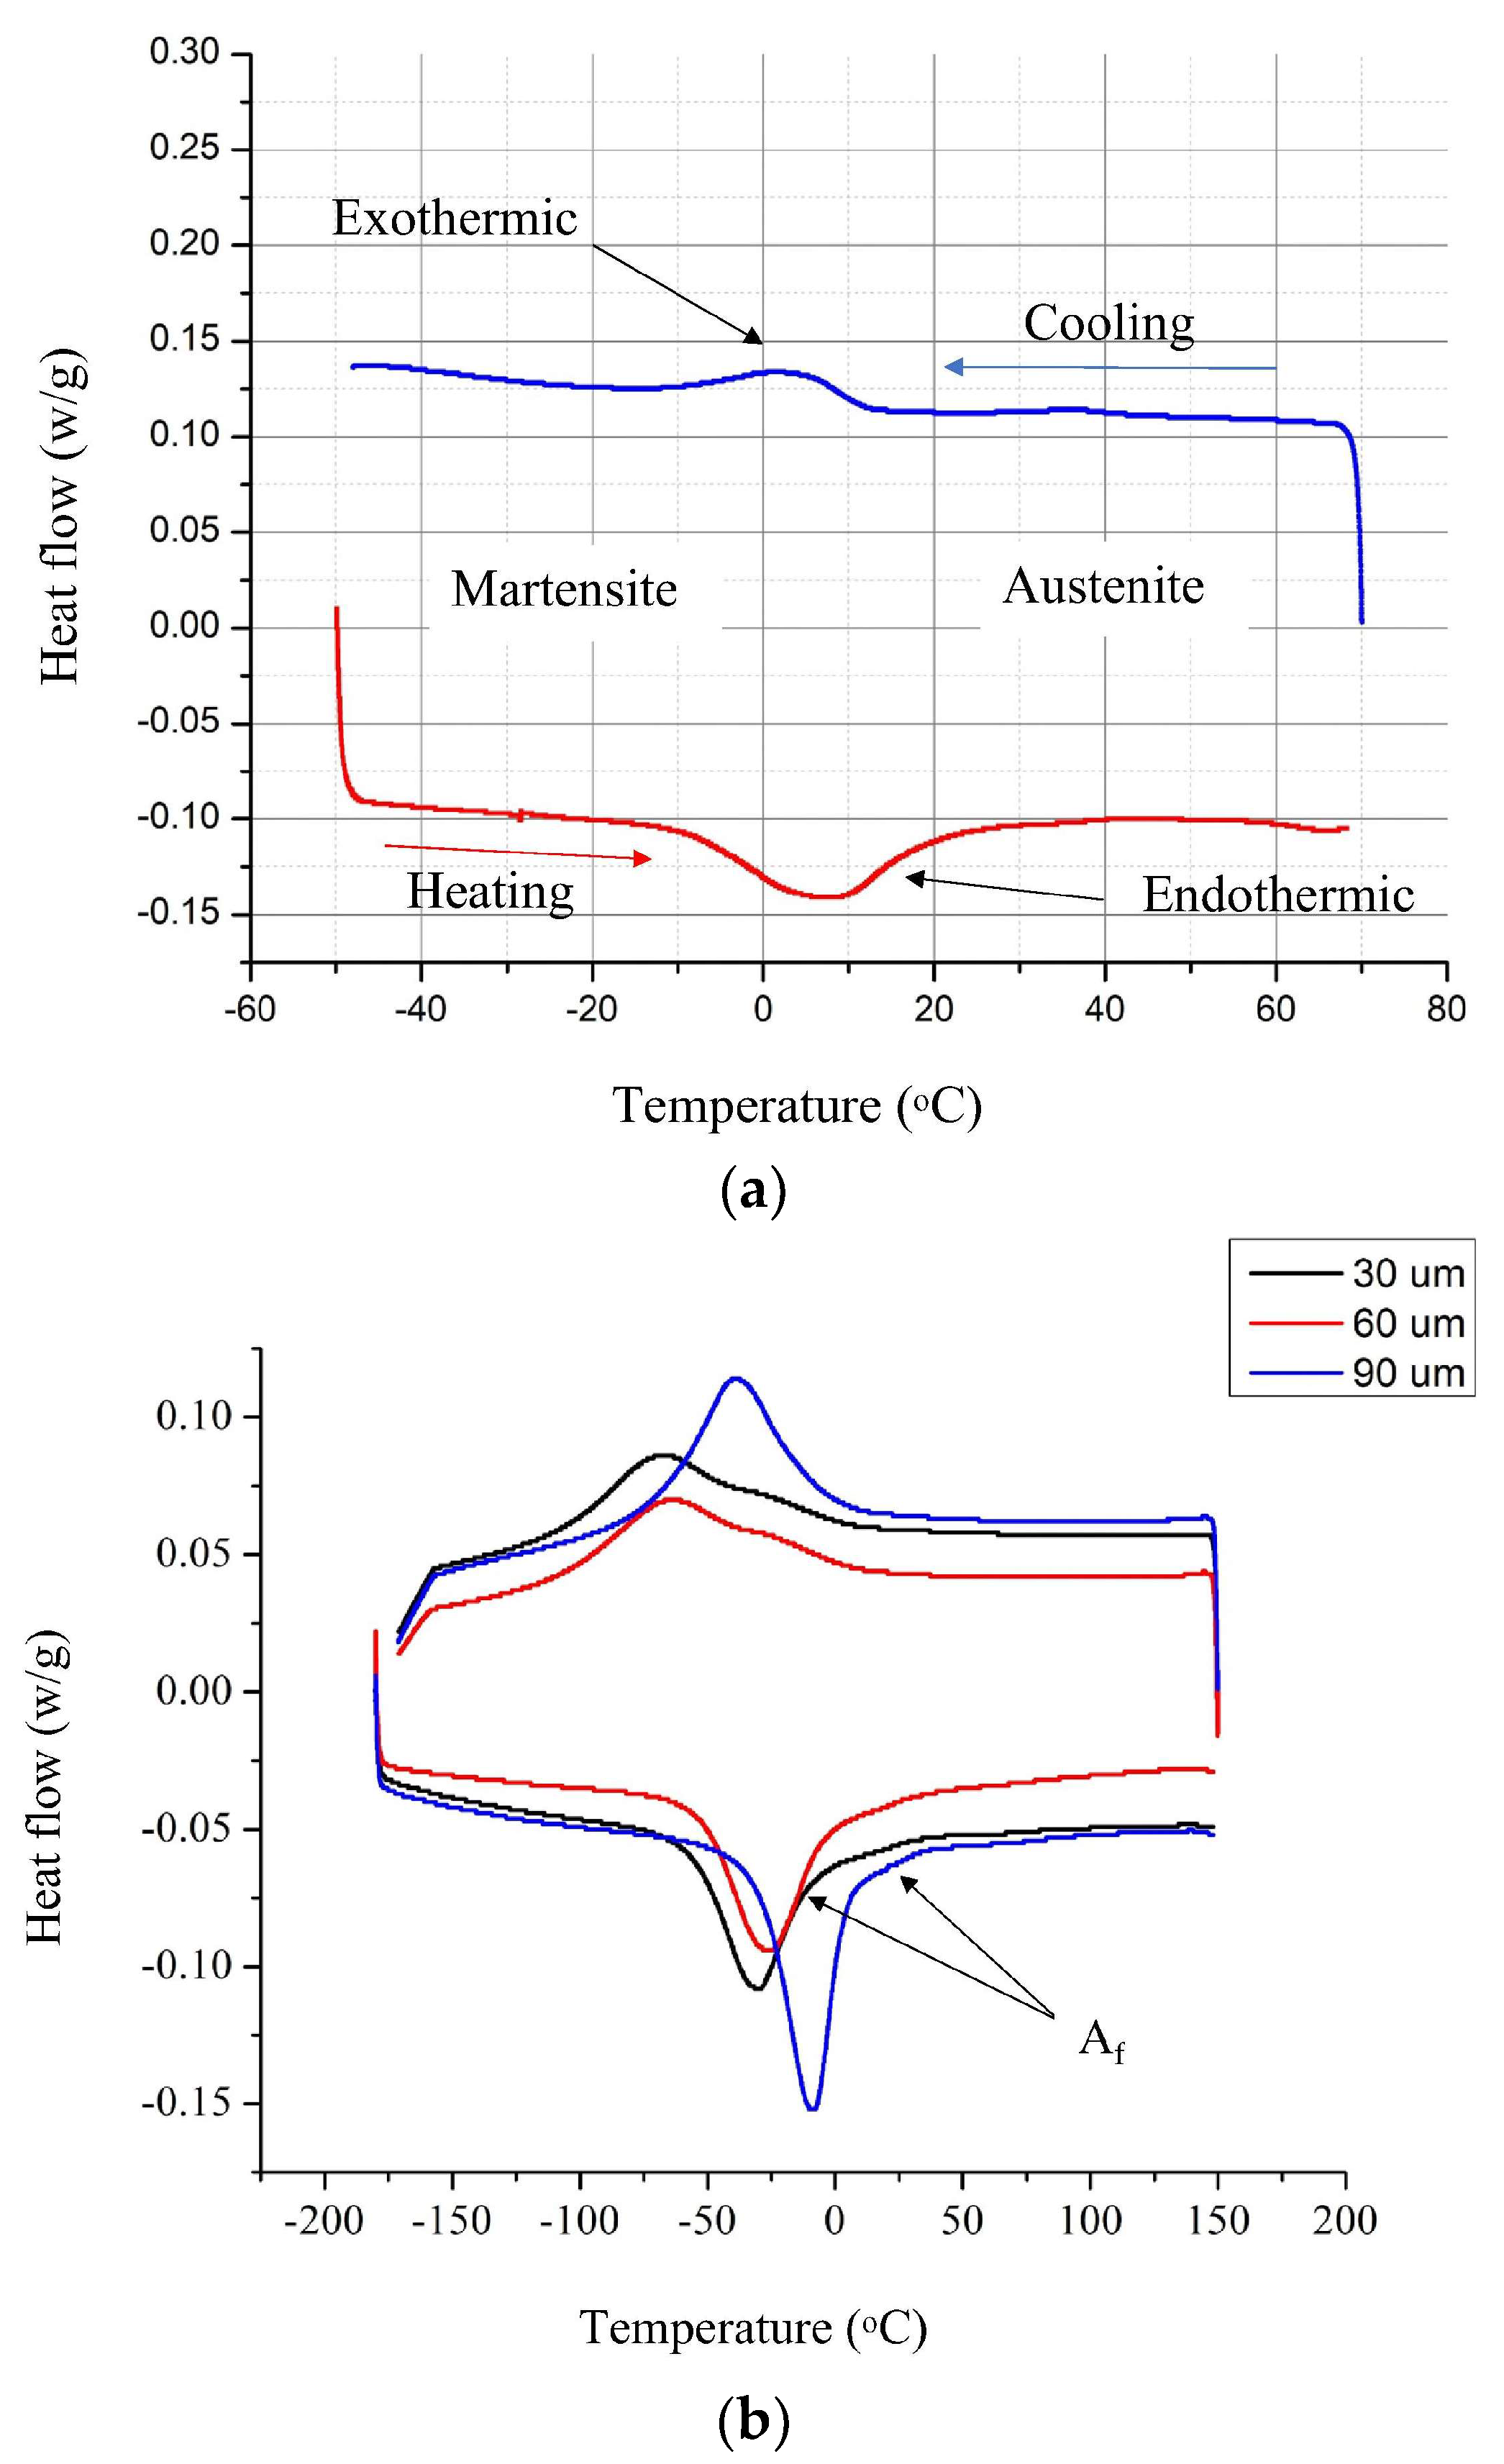
The phase transformation temperatures, heat flow, and enthalpies of the produced samples were obtained and compared to those of the raw powder material by using the TA Discovery DSC2500 analyser. The test samples and the raw powder material exhibited austenitic microstructures at room temperature with a noticeable increase in enthalpies and peak temperatures with the increase in the build layer thickness; Figure 9 and Table 5. Moreover, a noticeable increase in the Austenite Finish (Af) phase transformation temperatures was noted with the increase in the layer thickness; see Figure 9b (LT = 30 and 90 µm). This is due to the loss of Ni which is validated by the EDX results in the previous section.
The enthalpy values refer to the amount of heat absorbed (endothermic) or released (exothermic) by a substance as it undergoes a physical or chemical change while the temperature is varied. These values are often represented as peaks or ramps on the DSC plot. Enthalpy can be affected by several factors including the layer thickness and any post-heat treatment. The individual samples exhibited limited variation in the enthalpy values, indicating a similar amount of energy was absorbed and released during the transformation from martensite to austenite (M-A) and austenite to martensite (A-M); Table 5. Similar results were reported in the literature [47,48,49]. When comparing the enthalpies of the different samples, it was noted that the increased layer thickness leads to reduction in the enthalpies in both the M-A and A-M phase transformations. The increase in the layer surface temperature (Figure 5) generated a relatively high thermal gradient. Thus, the produced samples undergo different thermal gradient and structure changes until reaching a stabilised crystalised structure and chemical composition. The reduction in enthalpy indicates that the material has already undergone the major structural rearrangements.
Other significant factors that affect the enthalpy values in additively manufactured parts are the part quality and porosity content. Thicker layers produce more porosity and defects within the AM part. These variations in print quality could impact the enthalpy changes and heat transfer observed during DSC testing.

3.5. Nano-Indentation and Microhardness

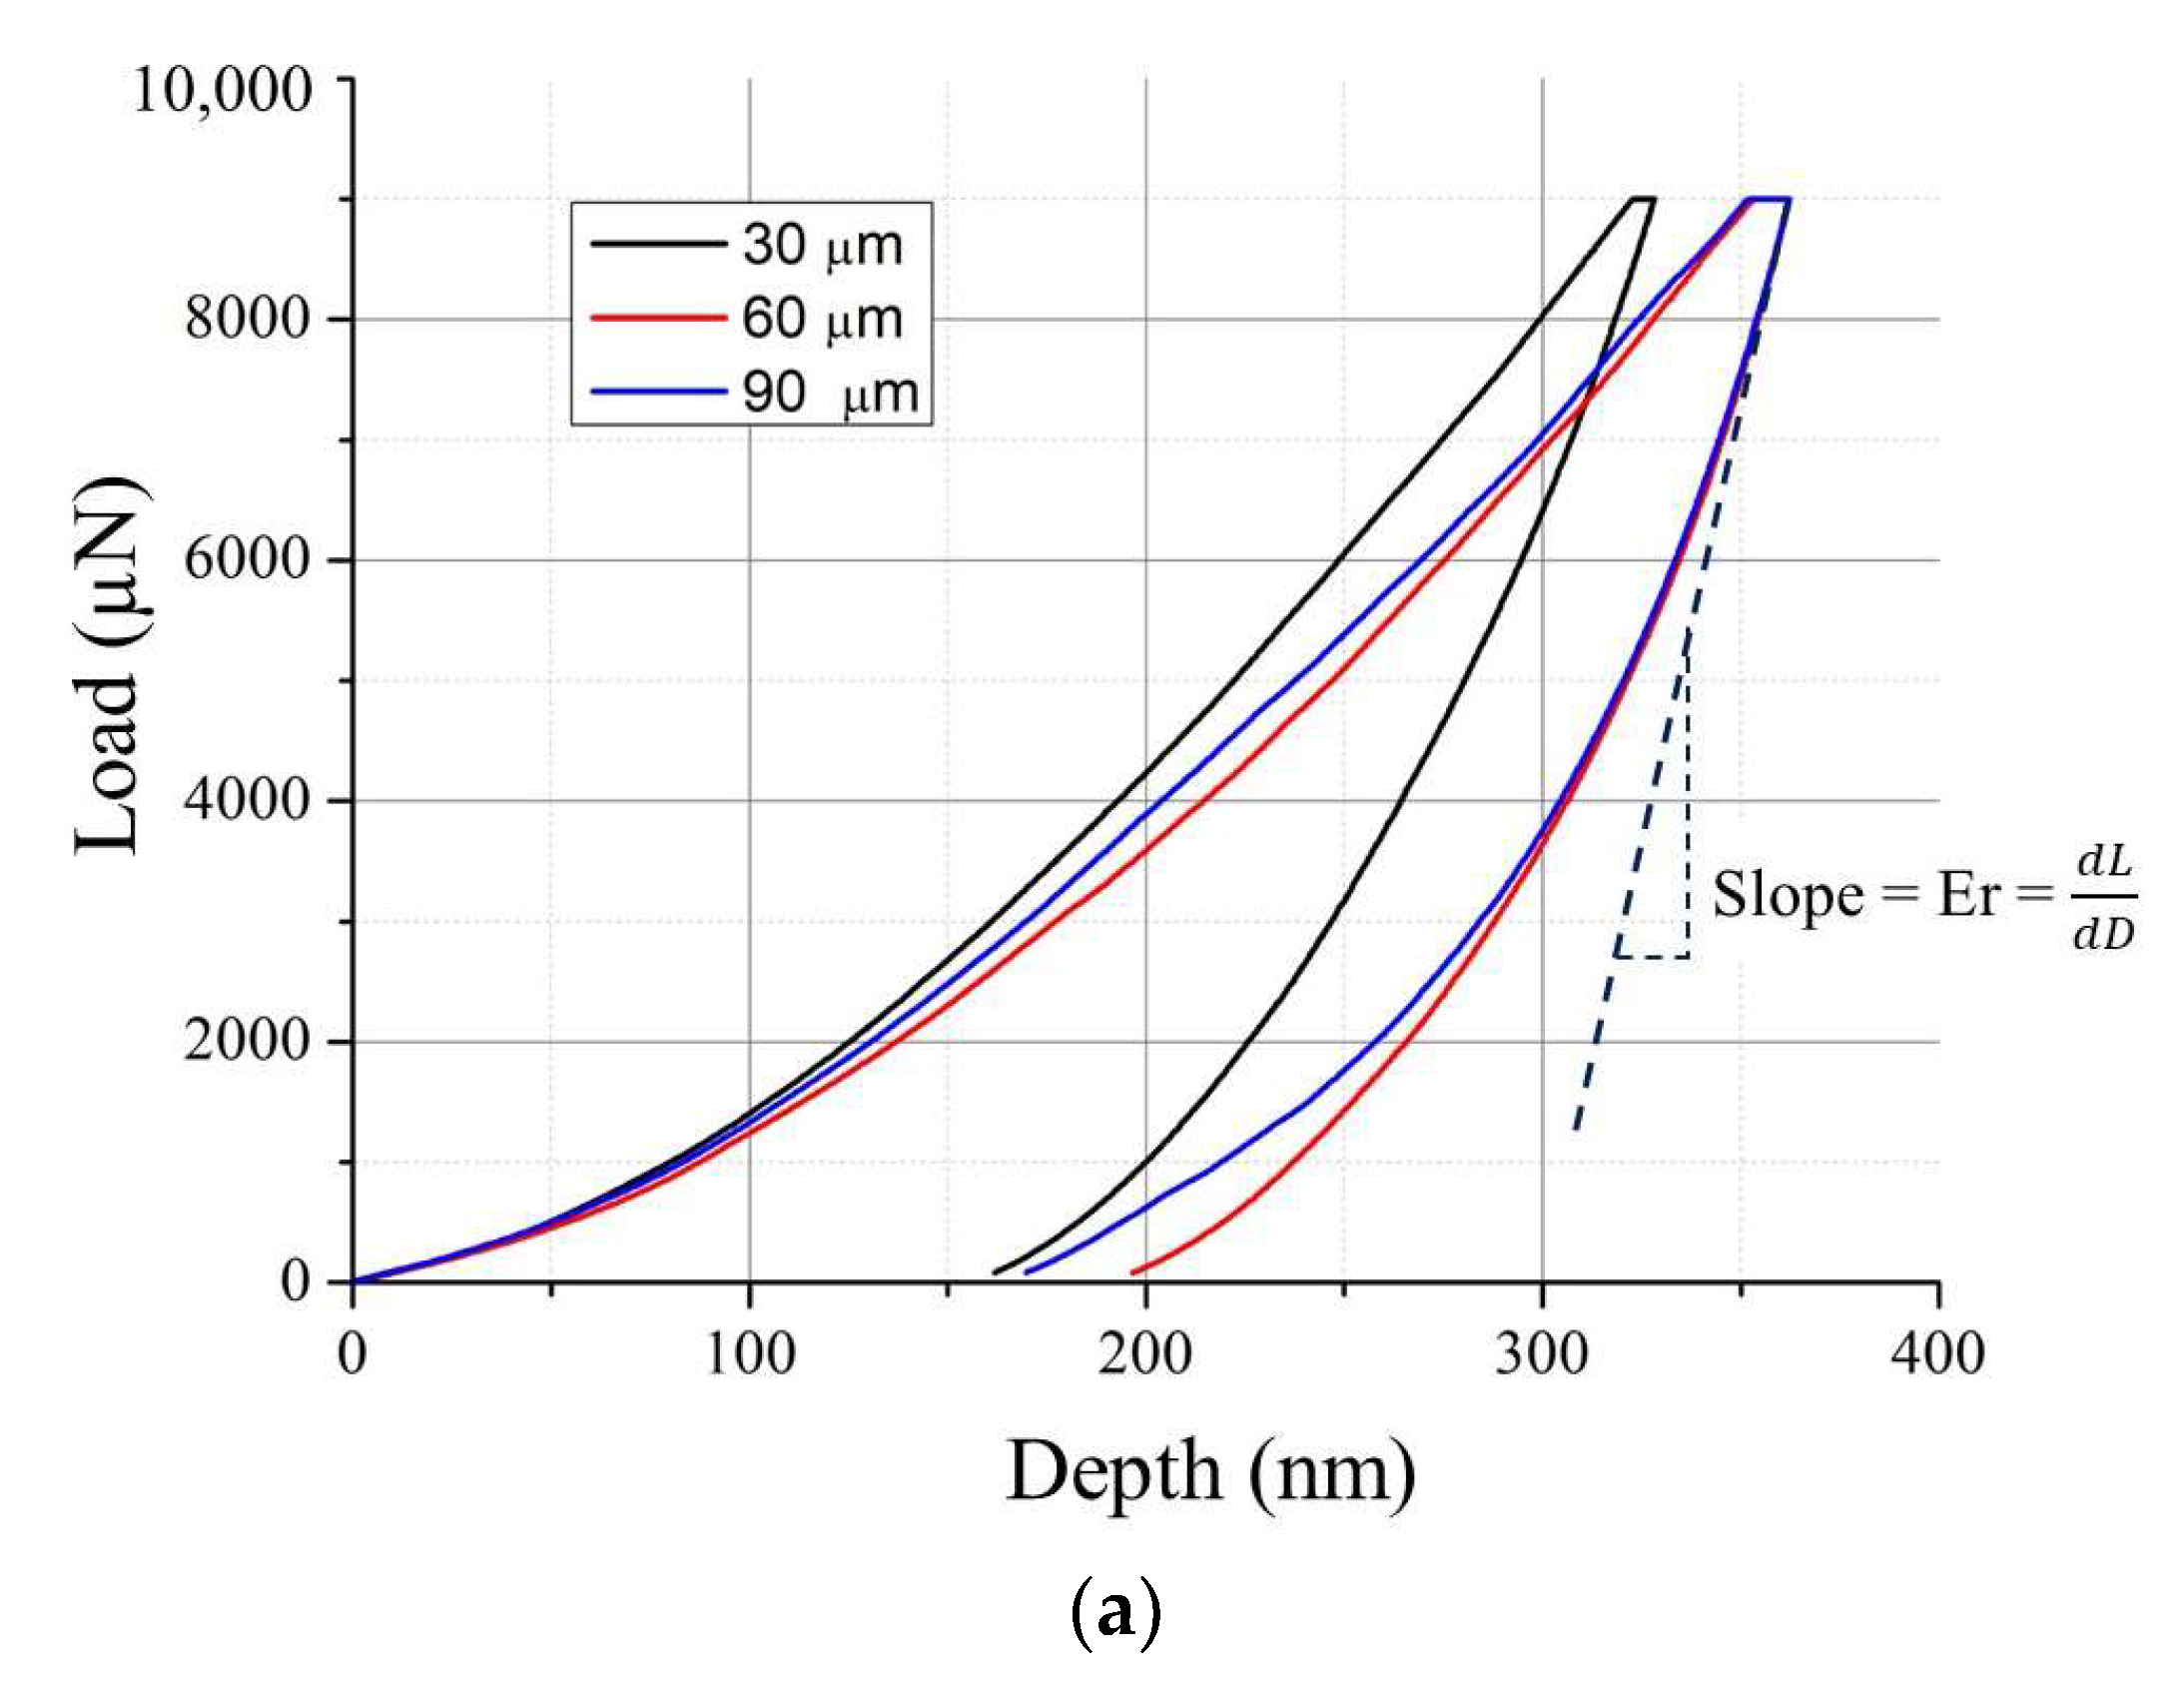
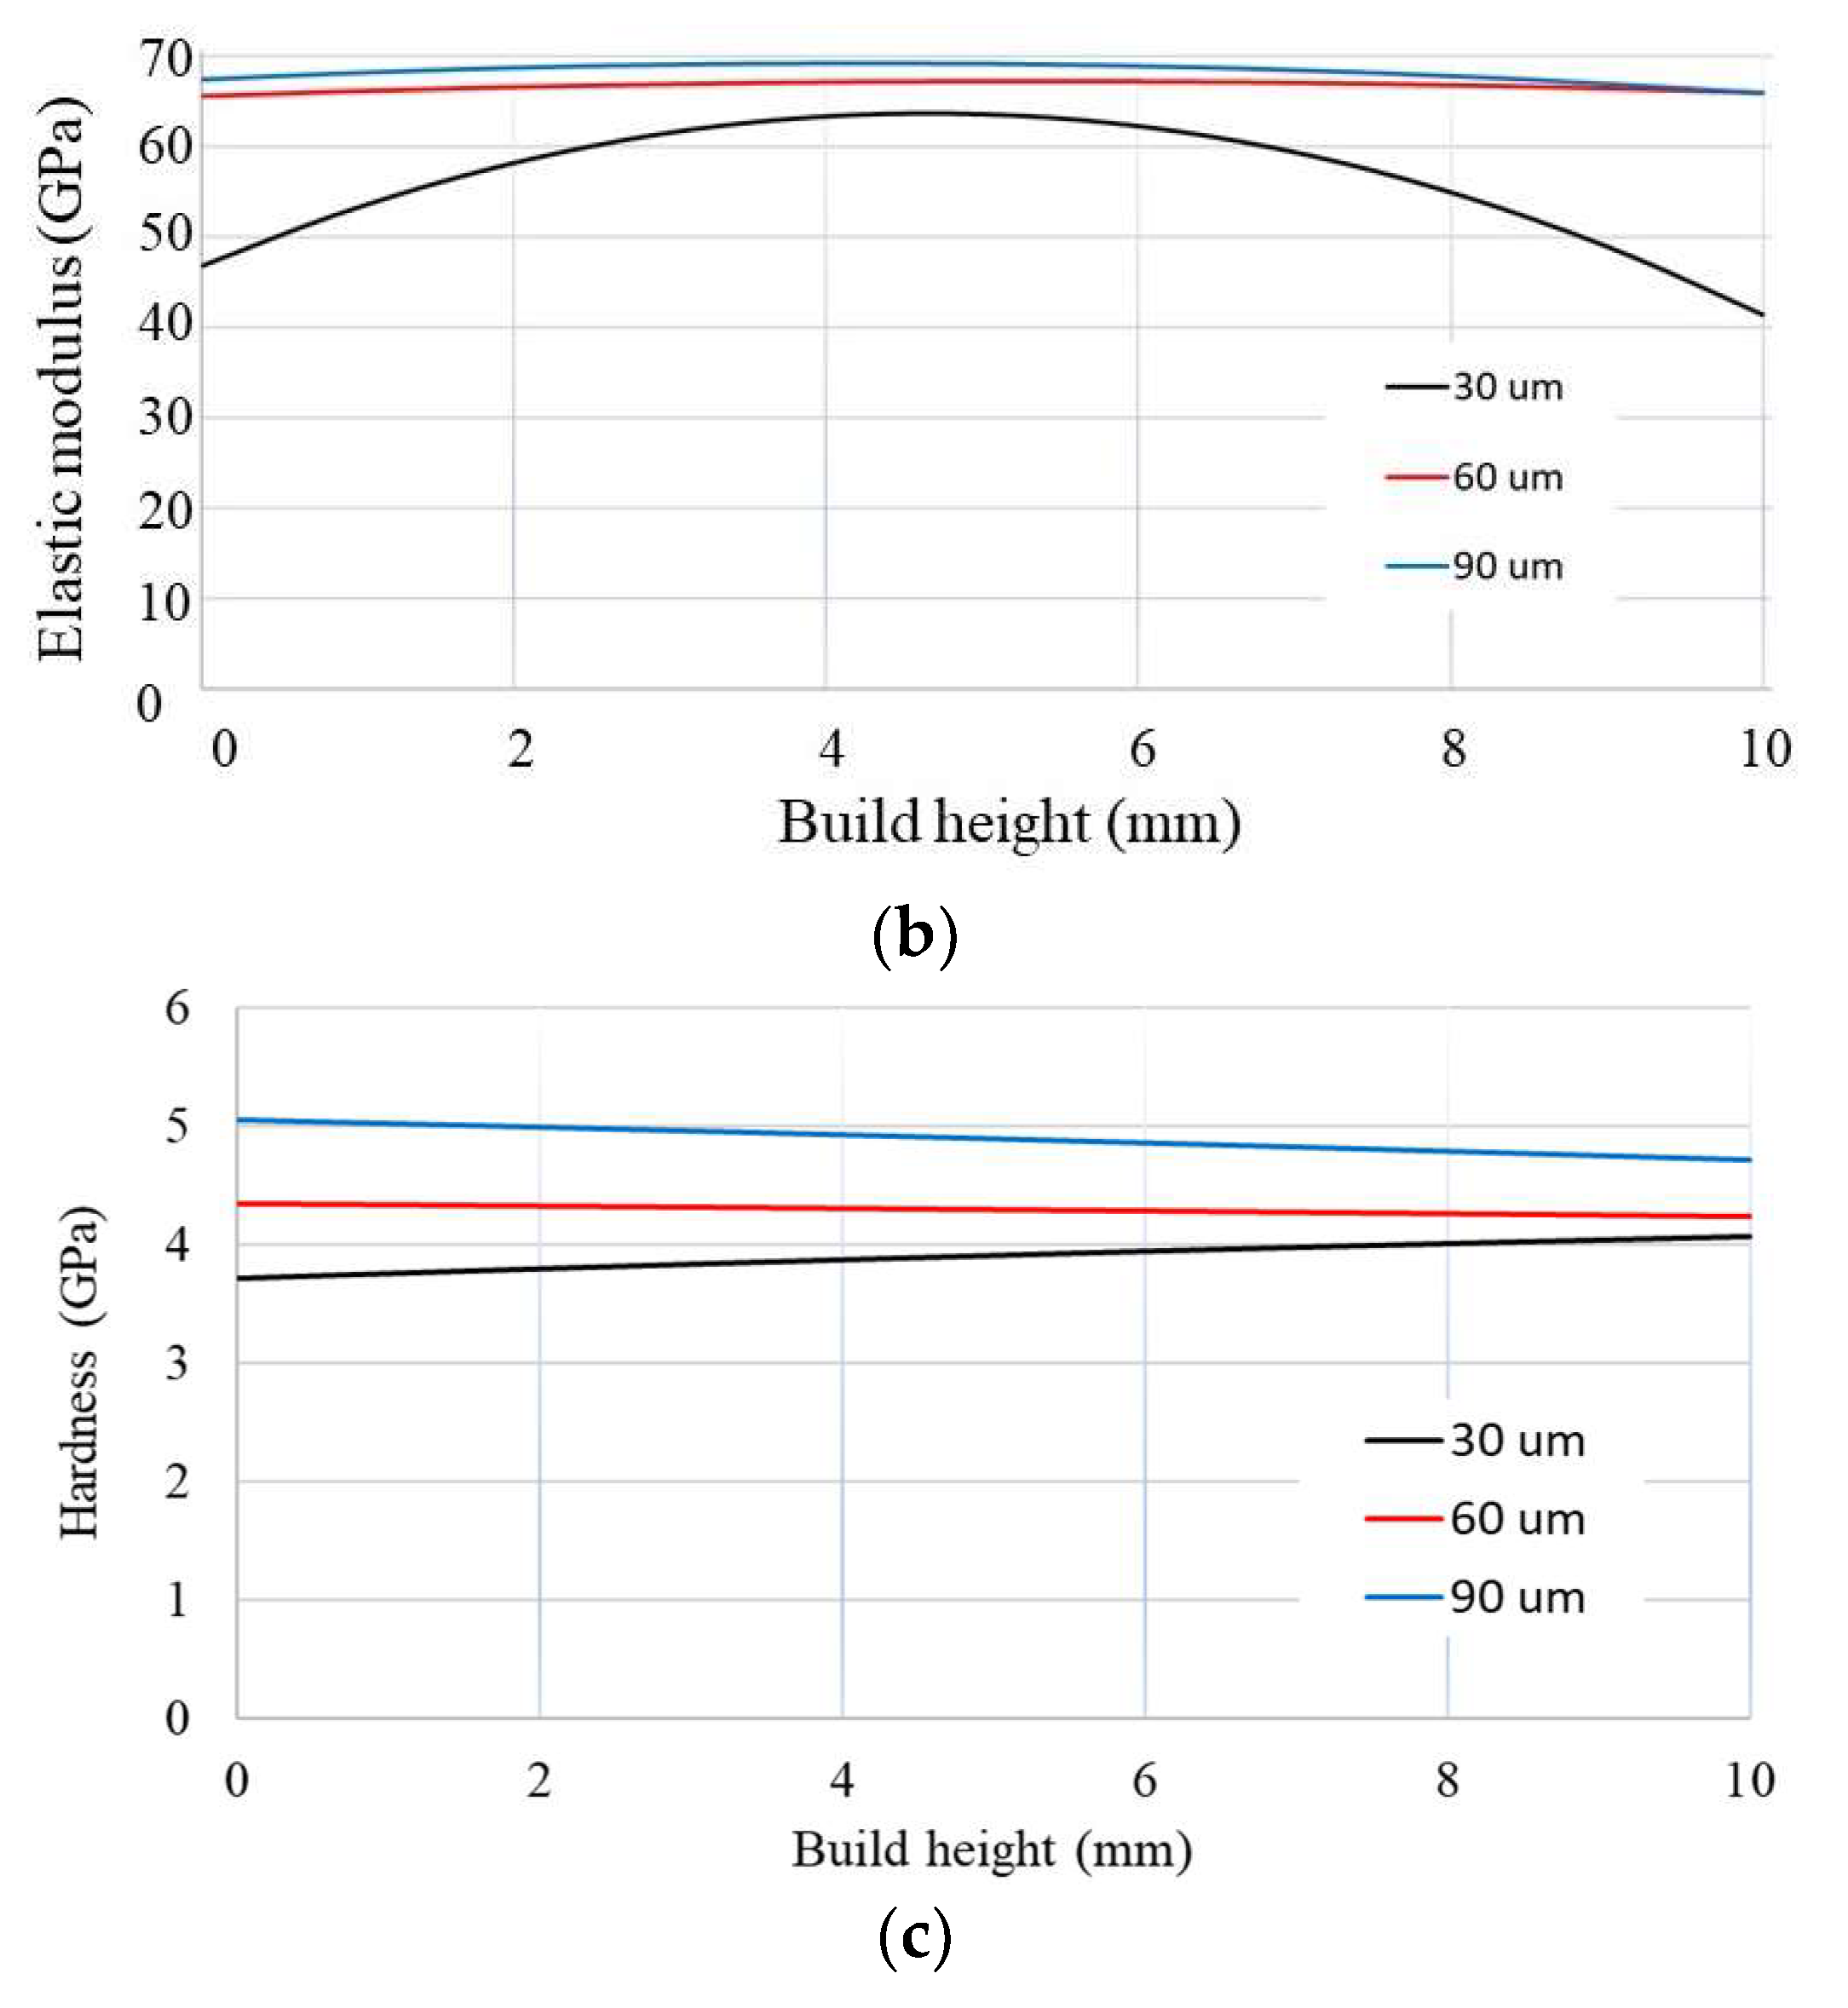
The reduced modulus of elasticity (Er) and hardness values were obtained in the build direction by using the nano-indentation method as shown in the sketch in Figure 3. The measured values agree well with those reported in the literature with a noticeable increase associated with the increase in the powder layer thickness; see Figure 10. This increase is also related to the increase in the layer surface temperature, which in turn creates a high temperature gradient leaving residual thermal stresses. An elastic modulus range of 40 to 70 GPa was measured for all the tested samples, as can be seen in Figure 10a,b. The samples printed with 30-micron LT showed reduced Er values both at the lower and upper layers; Figure 10b. This result can be caused by the thermal residual stresses generated at these regions due to the higher thermal gradient and heat dissipation to the cold surrounding material compared to the middle region where there is a sufficient amount of bulk material capable of absorbing heat and reducing the cooling rate. Moreover, for the middle region, fusing the following layers contributes to releasing some of these stresses. Stresses, in general, contribute to shifting the parent austenite phase towards the softer and lower-Er-value martensite phase [50,51].
The results suggest a post-process heat treatment is a significant option for consistency in the stress release and mechanical properties.

3.6. Microstructure Analysis

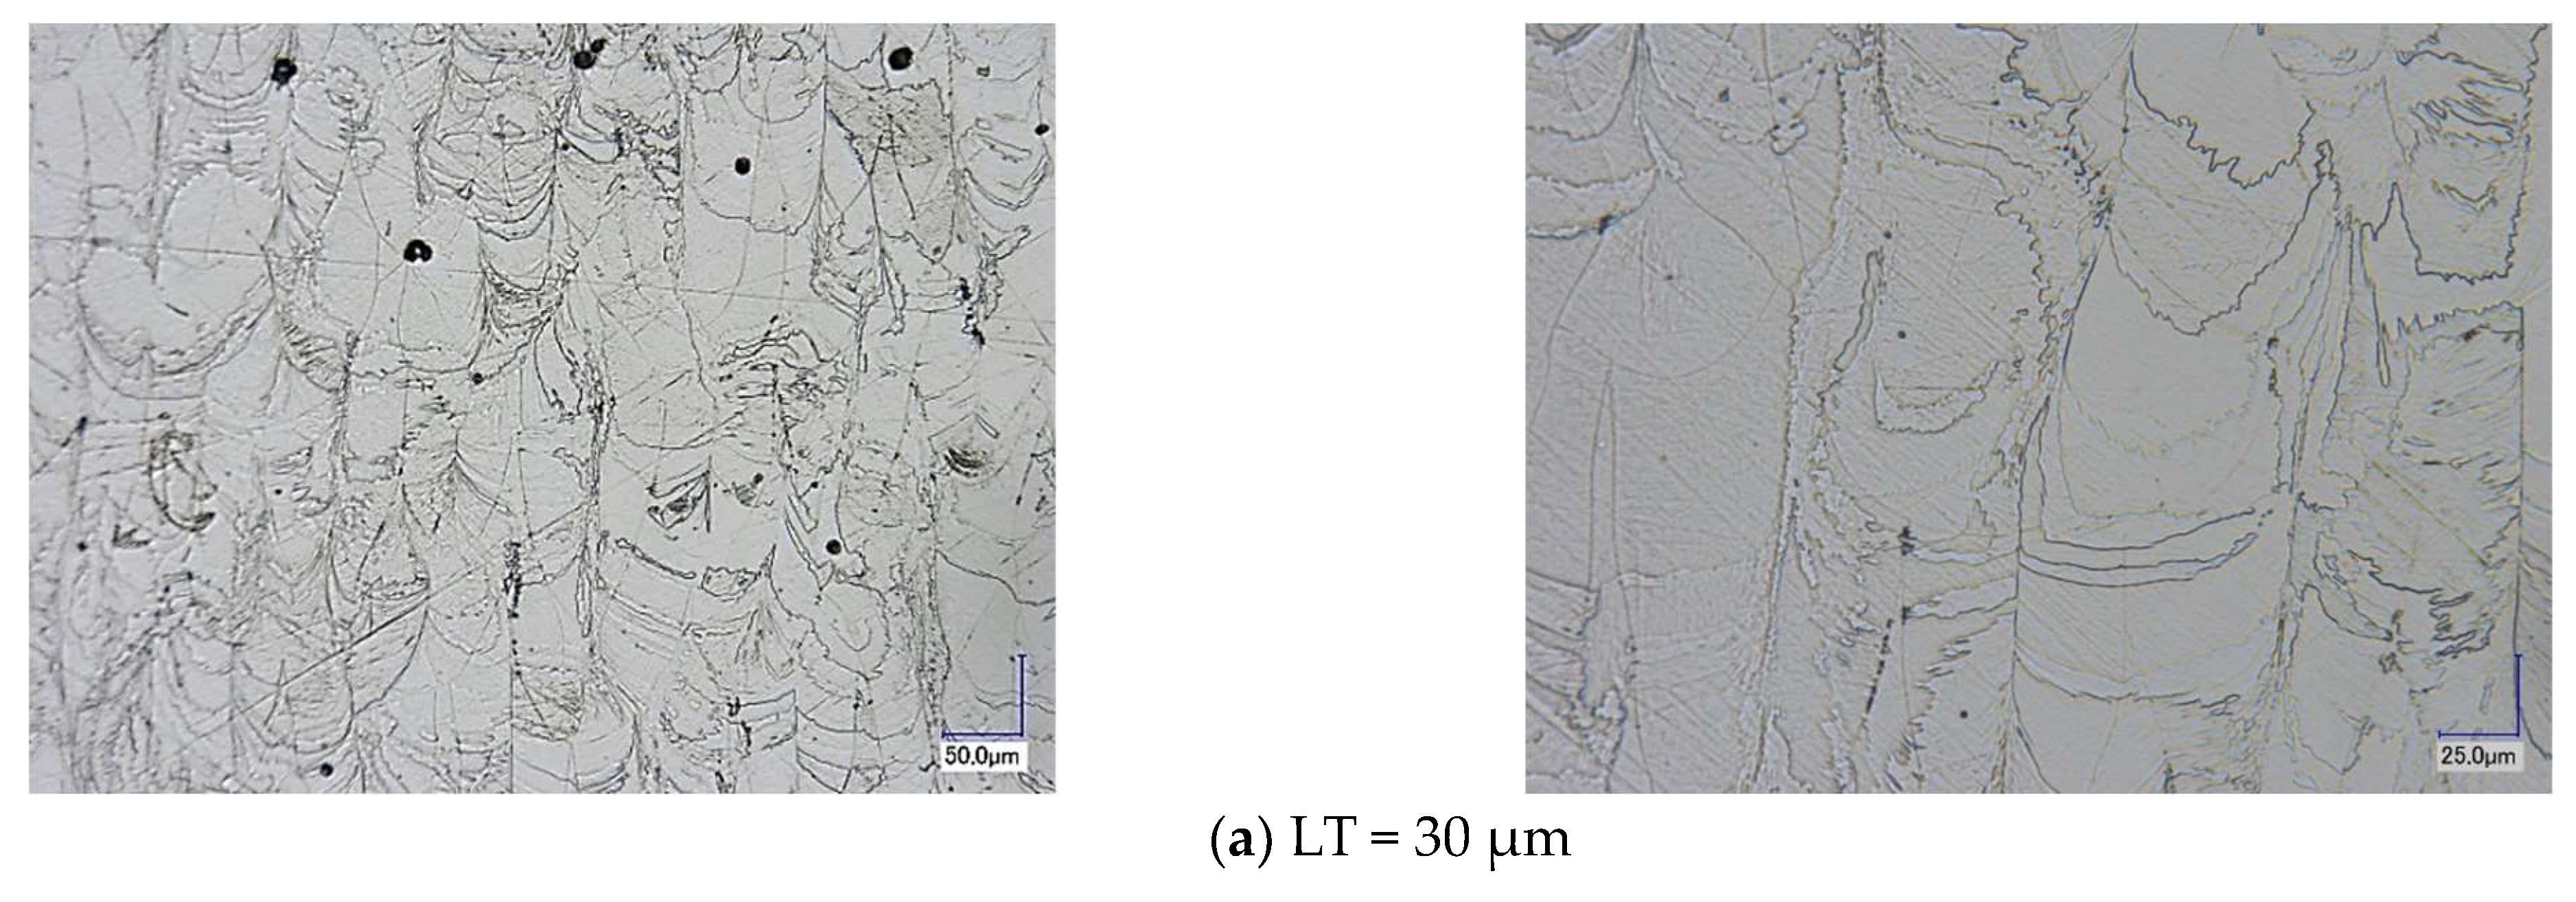
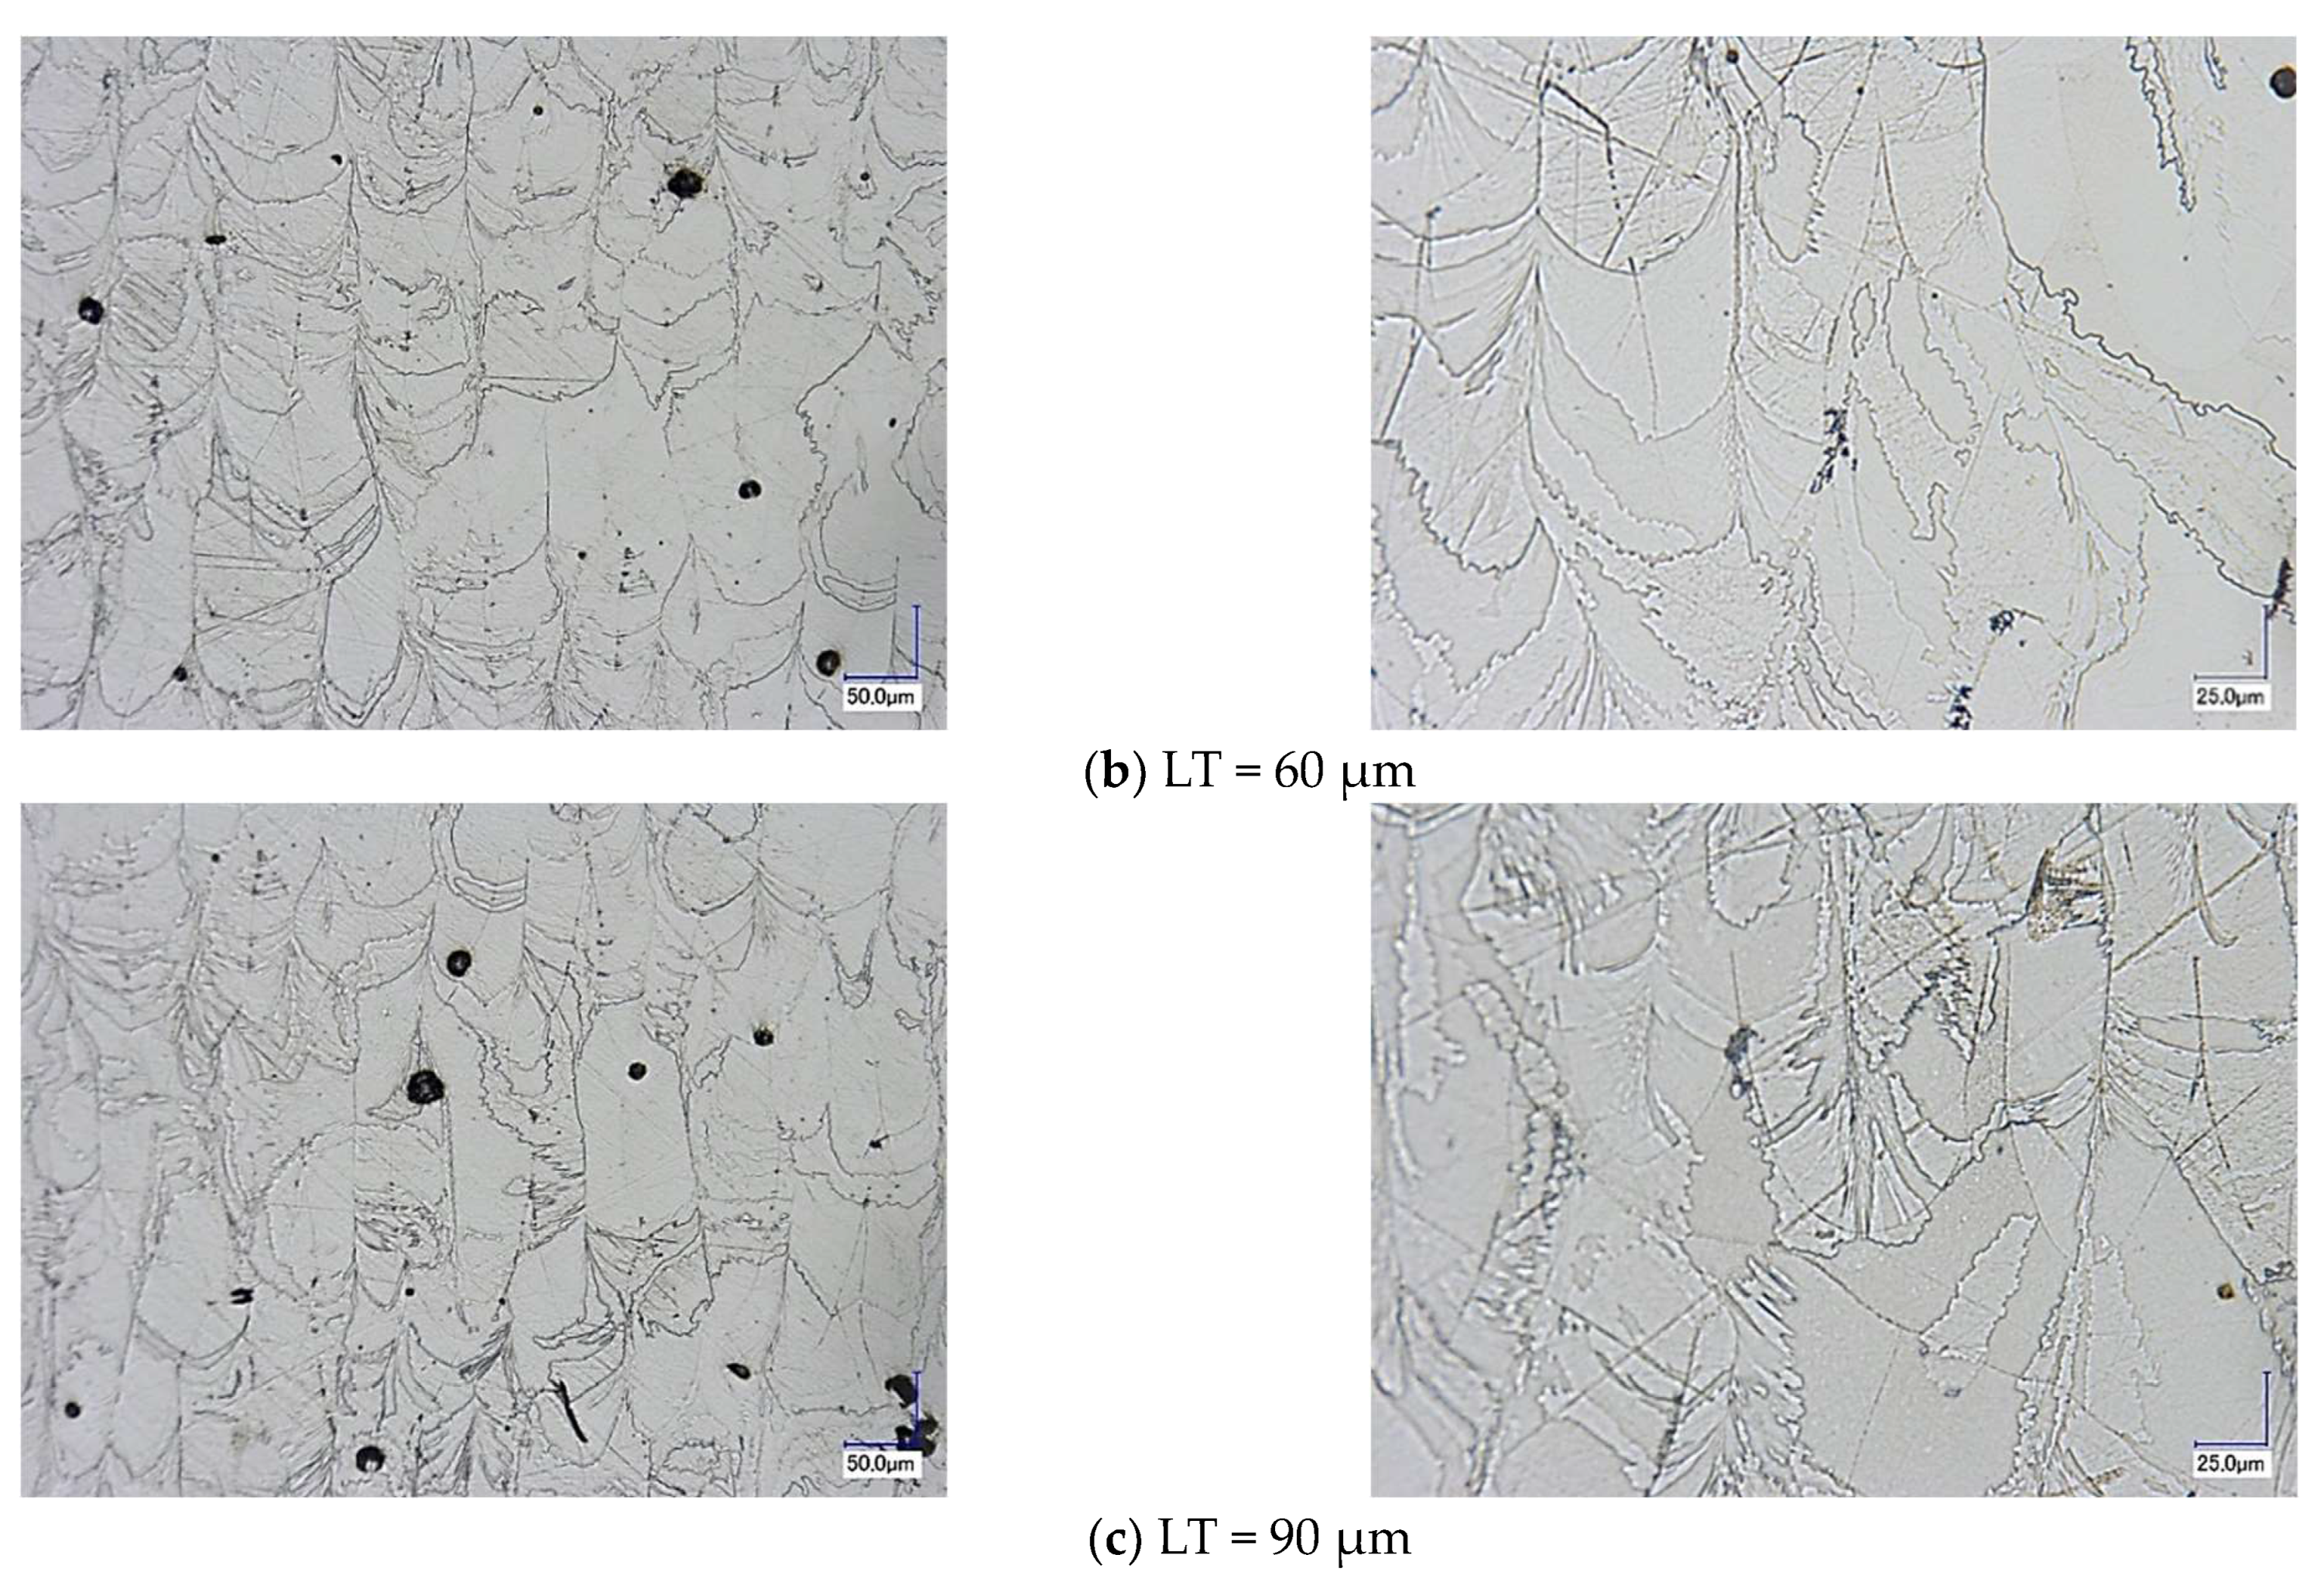
The optical micrographs obtained by using Keyence VHX2000, from Keyence Ltd., Northampton, UK, for all the test samples showed elongated austenitic grains, as can be seen in Figure 11 below. The figures revealed an austenitic microstructure at room temperature, agreeing with the results suggested by the DSC test. The figures show the trapped gas induced porosity, which increased relatively with increasing the LT in addition to a consistent granular structure and size with elongated grains always in the z-build direction. The similar grain size indicates that there is no significant effect observed when increasing the LT on the microstructure within the range of energy used to produce sample no. 2.

3.7. Cyclic Compression Testing

A Zwick 50 kN compression testing CNC machine was used to carry out this test in multiple loading–unloading cycles (5 to 10 cycles) for up to 8% maximum strain. The general trend of the samples’ performance was also very close and comparative, indicating the consistent mechanical properties of the different samples. In more detail, the parts produced with 60- and 90-micron layer thicknesses showed some increase in the compression stress with perfectly repeated cycles and no strain or work hardening during the loading and unloading cycles; see Figure 12a. In contrast, the parts printed by using the 30-micron layer thickness exhibit a work hardening mechanism for the first five cycles with an increased stress ratio of 3.8% between cycles 1 and 2, which then reduced to 0.8% between cycles 4 and 5, as can be seen in Figure 12b. This performance is caused by the relatively softer material of these samples as formerly mentioned and also explained by Engels et al. [52] and Pharr et al. [53].

4. Conclusions

In this study, the general concept and the main features of designing a sustainable additive manufacturing process were investigated. The most significant AM parts’ properties, including physical (surface quality and density), mechanical (elastic modulus and microstructure), and chemical (phase formation and chemical composition), were obtained. The results indicate that comparative and acceptable values of the previously mentioned properties can still be achieved by applying high build layer thickness values and saving build time, labour, and consumables. Moreover, this study opens the door for future research which can be focused on specific applications and more detailed characterisation like the biocompatibility of the produced AM implants and the effects of changing the building parameters on the corrosion, wear resistance, superelasticity, and shape memory.
In this section, all the output measures explained in the previous sections are listed in a dedicated table, Table 6, in addition to the charts shown in Figure 13 for a better visual comparison and understanding of these results, their impact in additive manufacturing, and the total cost. The elastic modulus was measured and is listed here since it is a crucial mechanical property that characterises the material’s ability to deform elastically and it is important to compare these values for the different build conditions.
As an output conclusion of this study, the following points can be addressed:
  • Build time. It can be noted that the increase in the layer thickness resulted in build time savings of 50% and 66.4% when the LTs were 60 and 90 microns compared to 30 microns, respectively.
  • Energy consumption. The above time savings impacted the total energy consumption by similar ratios with reductions from 61 kW to 30.7 and 20.5 kW when LT values of 60 and 90 microns with the optional features of a chiller and pre-heating element were used, respectively. Reductions in the net machine energy consumption from 36.5 kW to 18.4 and 12.25 kW could be obtained if no utility feature was employed.
  • Argon assist gas. Also, due to the build time savings, the gas consumption is expected to be reduced from 625 litres to 315 or 210 litres for similar LT values.
On the other hand, the following were also found:
  • The measured outputs showed no reduction in AM part quality and very comparative results.
  • The average surface roughness, for example, exhibits negligible differences in the surface quality, indicating the same amount of post-processing and finishing is required with no additional cost.
  • The exact same microstructure and grain crystallisation were observed for the parts produced with different layer thicknesses.
  • A very limited reduction in the parts’ relative density was obtained. This is expected and well known in L-PBF technology. More optimisation efforts can improve the parts’ density.
  • There was a noticeable increase in the parts’ modulus of elasticity and hardness as a result of the increased thermal residual stresses accompanying the increase in the layer thickness and layer build surface temperature. This is not a robust defect for most mechanical parts compared to the amount of energy saving. In case the latter result is of high importance, then a subsequent heat treatment must enhance the final mechanical properties.

Author Contributions

Conceptualization, M.A.O., P.H., H.A., D.B. (Declan Bourke), D.B. (Dermot Brabazon); methodology, M.A.O.; software, M.A.O., P.H., H.A.; validation, M.A.O., D.B. (Dermot Brabazon); formal analysis, M.A.O., P.H., H.A.; investigation, M.A.O., P.H., H.A., Bourke D; resources, M.A.O., P.H., D.B. (Declan Bourke), D.B. (Dermot Brabazon); data curation, M.A.O., P.H., H.A.; writing—original draft preparation, M.A.O., P.H., D.B. (Declan Bourke); writing—review and editing, M.A.O., H.A., D.B. (Dermot Brabazon); visualization, M.A.O., H.A., D.B. (Dermot Brabazon); supervision, M.A.O.; project administration, M.A.O.; funding acquisition, M.A.O., D.B. (Dermot Brabazon). All authors have read and agreed to the published version of the manuscript.

Funding

This research was funded by Science Foundation Ireland (SFI) grant number 16/RC/3872.

Data Availability Statement

The original contributions presented in the study are included in the article, further inquiries can be directed to the corresponding author.

Acknowledgments

This publication has emanated from research supported by a research grant from Science Foundation Ireland (SFI) under grant number 16/RC/3872 and is co-funded under the European Regional Development Fund.

Conflicts of Interest

Author Paul Healy and Declan Bourke were employed by the company Fort Wayne Metals Ireland Ltd. The remaining authors declare that the research was conducted in the absence of any commercial or financial relationships that could be construed as a potential conflict of interest.

References

  1. Šuba, R. Sustainability Aspects of Parts Additive Manufacturing from Metal Powder. Res. Pap. Fac. Mater. Sci. Technol. Slovak Univ. Technol. 2022, 30, 37–44. [Google Scholar] [CrossRef]
  2. Kokare, S.; Oliveira, J.P.; Godina, R. A LCA and LCC analysis of pure subtractive manufacturing, wire arc additive manufacturing, and selective laser melting approaches. J. Manuf. Process. 2023, 101, 67–85. [Google Scholar] [CrossRef]
  3. Mostafaei, A.; Zhao, C.; He, Y.; Ghiaasiaan, S.R.; Shi, B.; Shao, S.; Shamsaei, N.; Wu, Z.; Kouraytem, N.; Sun, T.; et al. Defects and anomalies in powder bed fusion metal additive manufacturing. Curr. Opin. Solid State Mater. Sci. 2022, 26, 100974. [Google Scholar]
  4. AMPOWER. Management Summary Report 2023; AMPOWER GmbH & Co. KG: Hamburg, Germany, 2023. [Google Scholar]
  5. Huckstepp, A. Surface Roughness—A Guide to Metal Additive Manufacturing by Digital Alloys. 2023. Available online: https://manufactur3dmag.com/surface-roughness-a-guide-to-metal-additive-manufacturing-by-digital-alloys/?utm_content=cmp-true (accessed on 18 December 2023).
  6. Gonçalves, A.; Ferreira, B.; Leite, M.; Ribeiro, I. Environmental and Economic Sustainability Impacts of Metal Additive Manufacturing: A Study in the Industrial Machinery and Aeronautical Sectors. Sustain. Prod. Consum. 2023, 42, 292–308. [Google Scholar] [CrossRef]
  7. Mecheter, A.; Tarlochan, F.; Kucukvar, M. A Review of Conventional versus Additive Manufacturing for Metals: Life-Cycle Environmental and Economic Analysis. Sustainability 2023, 15, 12299. [Google Scholar] [CrossRef]
  8. Obeidi, M.A. Metal additive manufacturing by laser-powder bed fusion:Guidelines for process optimisation. Results Eng. 2022, 15, 100473. [Google Scholar] [CrossRef]
  9. Tang, M.; Pistorius, P.C.; Beuth, J.L. Prediction of lack-of-fusion porosity for powder bed fusion. Addit. Manuf. 2017, 14, 39–48. [Google Scholar] [CrossRef]
  10. Gordon, J.V.; Narra, S.P.; Cunningham, R.W.; Liu, H.; Chen, H.; Suter, R.M.; Beuth, J.L.; Rollett, A.D. Defect structure process maps for laser powder bed fusion additive manufacturing. Addit. Manuf. 2020, 36, 101552. [Google Scholar] [CrossRef]
  11. Bayat, M.; Thanki, A.; Mohanty, S.; Witvrouw, A.; Yang, S.; Thorborg, J.; Tiedje, N.S.; Hattel, J.H. Keyhole-induced porosities in Laser-based Powder Bed Fusion (L-PBF) of Ti6Al4V: High-fidelity modelling and experimental validation. Addit. Manuf. 2019, 30, 100835. [Google Scholar] [CrossRef]
  12. Gu, D.; Shen, Y. Balling phenomena in direct laser sintering of stainless steel powder: Metallurgical mechanisms and control methods. Mater. Des. 2009, 30, 2903–2910. [Google Scholar] [CrossRef]
  13. Chandrasekhar, S. Hydrodynamic and Hydromagnetic Stability; Courier Corporation: North Chelmsford, MA, USA, 2013. [Google Scholar]
  14. Yadroitsev, I.; Gusarov, A.; Yadroitsava, I.; Smurov, I. Single track formation in selective laser melting of metal powders. J. Mater. Process. Technol. 2010, 210, 1624–1631. [Google Scholar] [CrossRef]
  15. Sui, H.; Wang, X.; Wu, B.; Bao, Q.; Zhang, F.; Sun, H.; He, A.; Wang, P. Cooperative competition between melt-phase and void during micro-spallation and recompression. Int. J. Mech. Sci. 2024, 275, 109276. [Google Scholar] [CrossRef]
  16. Shahzamanian, M.; Xu, Z.; Wu, P. Scripts to Insert Cohesive Elements at the Interfaces between Matrix and Precipitates with Irregular Shapes in Representative Volume Elements in ABAQUS. Appl. Sci 2023, 13, 12281. [Google Scholar] [CrossRef]
  17. Kapoor, D. Nitinol for medical applications: A brief introduction to the properties and processing of nickel titanium shape memory alloys and their use in stents. Johns. Matthey Technol. Rev. 2017, 61, 66–76. [Google Scholar] [CrossRef]
  18. Mwangi, J.W.; Nguyen, L.T.; Bui, V.D.; Berger, T.; Zeidler, H.; Schubert, A. Nitinol manufacturing and micromachining: A review of processes and their suitability in processing medical-grade nitinol. J. Manuf. Process. 2019, 38, 355–369. [Google Scholar] [CrossRef]
  19. Sathishkumar, M.; Kumar, C.P.; Ganesh, S.S.S.; Venkatesh, M.; Radhika, N.; Vignesh, M.; Pazhani, A. Possibilities, performance and challenges of nitinol alloy fabricated by Directed Energy Deposition and Powder Bed Fusion for biomedical implants. J. Manuf. Process. 2023, 102, 885–909. [Google Scholar] [CrossRef]
  20. Kaya, E.; Kaya, I. A review on machining of NiTi shape memory alloys: The process and post process perspective. Int. J. Adv. Manuf. Technol. 2019, 100, 2045–2087. [Google Scholar] [CrossRef]
  21. Khalil, H.F.Y. Changes in the Mechanical Behavior of Nitinol Following Variations of Heat Treatment Duration and Temperature; Georgia Institute of Technology: Atlanta, GA, USA, 2009. [Google Scholar]
  22. Frenzel, J.; George, E.; Dlouhy, A.; Somsen, C.; Wagner, M.-X.; Eggeler, G. Influence of Ni on martensitic phase transformations in NiTi shape memory alloys. Acta Mater. 2010, 58, 3444–3458. [Google Scholar] [CrossRef]
  23. Zhan, Y.; He, L.; Lu, X.; Zhu, X.; Chen, Q. The Effect of Ageing Treatment on Shape-Setting and Shape Memory Effect of a NiTi SMA Corrugated Structure. Adv. Mater. Sci. Eng. 2020, 2020, 2846721. [Google Scholar] [CrossRef]
  24. Alagha, A.N.; Hussain, S.; Zaki, W. Additive manufacturing of shape memory alloys: A review with emphasis on powder bed systems. Mater. Des. 2021, 204, 109654. [Google Scholar] [CrossRef]
  25. Haberland, C.; Elahinia, M.; Walker, J.M.; Meier, H.; Frenzel, J. On the development of high quality NiTi shape memory and pseudoelastic parts by additive manufacturing. Smart Mater. Struct. 2014, 23, 104002. [Google Scholar] [CrossRef]
  26. Speirs, M.; Wang, X.; Van Baelen, S.; Ahadi, A.; Dadbakhsh, S.; Kruth, J.-P.; Van Humbeeck, J. On the transformation behavior of NiTi shape-memory alloy produced by SLM. Shape Mem. Superelasticity 2016, 2, 310–316. [Google Scholar] [CrossRef]
  27. Biffi, C.A.; Fiocchi, J.; Valenza, F.; Bassani, P.; Tuissi, A. Selective laser melting of NiTi shape memory alloy: Processability, microstructure, and superelasticity. Shape Mem. Superelasticity 2020, 6, 342–353. [Google Scholar] [CrossRef]
  28. Walker, J.M.; Haberland, C.; Andani, M.T.; Karaca, H.E.; Dean, D.; Elahinia, M. Process development and characterization of additively manufactured nickel–titanium shape memory parts. J. Intell. Mater. Syst. Struct. 2016, 27, 2653–2660. [Google Scholar] [CrossRef]
  29. Moghaddam, N.S.; Saghaian, S.E.; Amerinatanzi, A.; Ibrahim, H.; Li, P.; Toker, G.P.; Karaca, H.E.; Elahinia, M. Anisotropic tensile and actuation properties of NiTi fabricated with selective laser melting. Mater. Sci. Eng. A 2018, 724, 220–230. [Google Scholar] [CrossRef]
  30. Dadbakhsh, S.; Speirs, M.; Kruth, J.; Schrooten, J.; Luyten, J.; Van Humbeeck, J. Effect of SLM parameters on transformation temperatures of shape memory nickel titanium parts. Adv. Eng. Mater. 2014, 16, 1140–1146. [Google Scholar] [CrossRef]
  31. Tan, C.; Li, S.; Essa, K.; Jamshidi, P.; Zhou, K.; Ma, W.; Attallan, M.M. Laser Powder Bed Fusion of Ti-rich TiNi lattice structures: Process optimisation, geometrical integrity, and phase transformations. Int. J. Mach. Tools Manuf. 2019, 141, 19–29. [Google Scholar] [CrossRef]
  32. Moghaddam, N.S.; Saedi, S.; Amerinatanzi, A.; Hinojos, A.; Ramazani, A.; Kundin, J.; Mills, M.J.; Karaca, H.; Elahinia, M. Achieving superelasticity in additively manufactured NiTi in compression without post-process heat treatment. Sci. Rep. 2019, 9, 41. [Google Scholar] [CrossRef]
  33. ISO/ASTM 52900:2015; Additive Manufacturing—General Principles—Terminology. ISO: Geneva, Switzerland. 2015. Available online: https://www.iso.org/standard/69669.html (accessed on 24 June 2021).
  34. Obeidi, M.A.; Mussatto, A.; Groarke, R.; Vijayaraghavan, R.K.; Conway, A.; Kaschel, F.R.; McCarthy, E.; Clarkin, O.; O’Connor, R.; Brabazon, D. Comprehensive assessment of spatter material generated during selective laser melting of stainless steel. Mater. Today Commun. 2020, 25, 101294. [Google Scholar] [CrossRef]
  35. Obeidi, M.A.; Conway, A.; Mussatto, A.; Dogu, M.N.; Sreenilayam, S.P.; Ayub, H.; Ahad, I.U.; Brabazon, D. Effects of powder compression and laser re-melting on the microstructure and mechanical properties of additively manufactured parts in laser-powder bed fusion. Results Mater. 2022, 13, 100264. [Google Scholar] [CrossRef]
  36. Berumen, S.; Bechmann, F.; Lindner, S.; Kruth, J.-P.; Craeghs, T. Quality control of laser- and powder bed-based Additive Manufacturing (AM) technologies. Phys. Procedia 2010, 5, 617–622. [Google Scholar] [CrossRef]
  37. Obeidi, M.A.; McCarthy, E.; O’Connell, B.; Ahad, I.U.; Brabazon, D. Laser polishing of additive manufactured 316L stainless steel synthesized by selective laser melting. Materials 2019, 12, 991. [Google Scholar] [CrossRef] [PubMed]
  38. El Hassanin, A.; Obeidi, M.; Scherillo, F.; Brabazon, D. CO2 laser polishing of laser-powder bed fusion produced AlSi10Mg parts. Surf. Coating. Technol. 2021, 419, 127291. [Google Scholar] [CrossRef]
  39. Zhao, C.; Liang, H.; Luo, S.; Yang, J.; Wang, Z. The effect of energy input on reaction, phase transition and shape memory effect of NiTi alloy by selective laser melting. J. Alloys Compd. 2020, 817, 153288. [Google Scholar] [CrossRef]
  40. Oliveira, J.P.; Braz Fernandes, F.M.; Miranda, R.M.; Schell, N.; Ocaña, J.L. Effect of laser welding parameters on the austenite and martensite phase fractions of NiTi. Mater. Charact. 2016, 119, 148–151. [Google Scholar] [CrossRef]
  41. Ma, J.; Franco, B.; Tapia, G.; Karayagiz, K.; Johnson, L.; Liu, J.; Arroyave, R.; Karaman, I.; Elwany, A. Spatial control of functional response in 4D-printed active metallic structures. Sci. Rep. 2017, 7, 46707. [Google Scholar] [CrossRef] [PubMed]
  42. Hou, H.; Simsek, E.; Ma, T.; Johnson, N.S.; Qian, S.; Cissé, C.; Stasak, D.; Al Hasan, N.; Zhou, L.; Hwang, Y.; et al. Fatigue-resistant high-performance elastocaloric materials made by additive manufacturing. Science 2019, 366, 1116–1121. [Google Scholar] [CrossRef] [PubMed]
  43. Zamani, N.; Khamesee, M.B.; Khan, M.I. Novel laser processed shape memory alloy actuator design with an embedded strain gauge sensor using dual resistance measurements. Part I: Fabrication and model-based position estimation. Sens. Actuators A Phys. 2017, 263, 234–245. [Google Scholar] [CrossRef]
  44. Obeidi, M.A. Achieving high quality nitinol parts with minimised input thermal energy by optimised pulse wave laser powder bed fusion process. Results Mater. 2022, 14, 100279. [Google Scholar] [CrossRef]
  45. DebRoy, T.; Wei, H.L.; Zuback, J.S.; Mukherjee, T.; Elmer, J.W.; Milewski, J.O.; Beese, A.M.; Wilson-Heid, A.; De, A.; Zhang, W. Additive manufacturing of metallic components e process, structure and properties. Prog. Mater. Sci. 2018, 92, 112–224. [Google Scholar] [CrossRef]
  46. Obeidi, M.A.; Monu, M.; Hughes, C.; Bourke, D.; Dogu, M.N.; Francis, J.; Zhang, M.; Ahad, I.U.; Brabazon, D. Laser beam powder bed fusion of nitinol shape memory alloy (SMA). J. Mater. Res. Technol. 2021, 14, 2554–2570. [Google Scholar] [CrossRef]
  47. Wayman, C.M.; Duerig, T.W. An introduction to martensite and shape memory. In Engineering Aspects of Shape Memory Alloys; Duerig, T.W., Melton, K.N., Stöckel, D., Wayman, C.M., Eds.; Butterworth-Heinemann Ltd.: London, UK, 1990. [Google Scholar]
  48. Florian, G.; Gabor, A.R.; Nicolae, C.A.; Rotaru, A.; Stănică, N.; Bîzdoacă, N.G.; Rotaru, P. Thermomechanical, calorimetric and magnetic properties of a Ni–Ti shape-memory alloy wire. J. Therm. Anal. Calorim. 2020, 140, 527–544. [Google Scholar] [CrossRef]
  49. Agarwal, N.; Monu, M.C.; Selvam, K.T.; Obeidi, M.A.; Brabazon, D. Study of the effects of laser power and scanning speed on the microstructural morphologies and physical properties of L-PBF produced Ni52.39Ti47.61. J. Mater. Res. Technol. 2023, 27, 8334–8343. [Google Scholar] [CrossRef]
  50. Ramezannejad, A.; Xu, W.; Qian, M. Ni-free superelastic titanium alloys for medical and dental applications. In Titanium in Medical and Dental Applications; Woodhead Publishing Series in Biomaterials; Woodhead Publishing: Cambridge, UK, 2018; pp. 591–611. [Google Scholar] [CrossRef]
  51. Wadood, A. Brief Overview on Nitinol as Biomateriall. Adv. Mater. Sci. Eng. 2016, 2016, 4173138. [Google Scholar] [CrossRef]
  52. Engels, J.K.; Gao, S.; Amin, W.; Biswas, A.; Kostka, A.; Vajragupta, N.; Hartmaier, A. Indentation size effects in spherical nanoindentation analyzed by experiment and non-local crystal plasticity. Materialia 2018, 3, 21–30. [Google Scholar] [CrossRef]
  53. Pharr, G.M.; Herbert, E.G.; Gao, Y. The indentation size effect: A critical examination of experimental observations and mechanistic interpretations. Annu. Rev. Mater. Res. 2010, 40, 271–292. [Google Scholar] [CrossRef]
Figure 1. The main features of Aconity Mini build chamber: (1) laser beam collimator, (2) 3D scanner, (3) powder deposition (re-coater) mechanism, (4) excess powder collector, (5) argon gas stream, (6) build plate, (7) powder supply, (8) build chamber body, (9) argon gas inlet window, (10) argon gas outlet and (11) build chamber lid [8].
Designs 08 00045 g001
Figure 2. (a) A breakdown of the time consumed per each build layer, and (b) the total build time consumed for the different LTs.
Designs 08 00045 g002
Figure 3. Schematic of the nitinol cuboid test samples showing the different inspection locations.
Designs 08 00045 g003
Figure 4. The relative density of the three sets of test samples measured by using Archimedes’ principle.
Designs 08 00045 g004
Figure 5. The layer surface temperatures of sample no. 2 corresponding to Table 1 fused by using the same input parameters with different LT values.
Designs 08 00045 g005
Figure 6. (left) Optical micrograph showing the keyhole formed due to the high VED level, and (right) SEM image showing the lack of fusion defect. Both images are of samples built with 90 µm LT.
Designs 08 00045 g006
Figure 7. SEM micrographs of the produced samples surface morphology.
Designs 08 00045 g007aDesigns 08 00045 g007b
Figure 8. The EDX results of the samples of the three different LTs.
Designs 08 00045 g008
Figure 9. The phase transformation temperatures of the (a) raw powder and (b) produced sample materials.
Designs 08 00045 g009
Figure 10. Nano-indentation results showing the reduced elastic modulus (a) measured at a single indent, (b) measured through the entire build layers, and (c) the nano-hardness measured on the test samples of different layer thicknesses.
Designs 08 00045 g010aDesigns 08 00045 g010b
Figure 11. Optical micrographs taken in the z-plane build direction showing the large austenite grains.
Designs 08 00045 g011aDesigns 08 00045 g011b
Figure 12. (a) Loading–unloading compression testing of the produced samples, and (b) the first five cycles of the 30-micron LT sample.
Designs 08 00045 g012
Figure 13. The time and energy consumed during the 3D printing of the nitinol samples.
Designs 08 00045 g013
Table 1. The processing parameters and DoE model used in this study.
S
No.
Laser Power (W)Scanning Speed (mm/s)Laser Spot Size (µm)VED
0.03 µm LT (J/mm3)
VED
0.06 µm LT (J/mm3)
VED
0.09 µm LT (J/mm3)
11607506088.8944.4429.63
216011008060.6130.3020.20
320075080111.1155.5637.04
420011006075.7637.8825.25
51607508088.8944.4429.63
616011006060.6130.3020.20
720075060111.1155.5637.04
820011008075.7637.8825.25
Table 2. The time required for the build of the testing samples.
Layer
Thickness (µm)
Total no. of LayersTime/Layer
(s)
Total Build Time (s)Total Build Time (min)
3033322.667545125
6016622.72377263
9011122.78252942
Table 3. Surface profile values for sample no. 2 produced with different layer thicknesses.
LT (µm)VED (J/mm3)R. Density (%)Sa
(µm)
Sz
(µm)
3060.6099.455.0461.34
6030.3099.216.9374.06
9020.2099.027.1379.41
Table 4. The chemical composition of the NiTi samples produced by using different build layer thickness.
Elemental
(wt.%)
Build Layer Thickness (µm)
306090
Ti 44.5845.0845.14
Ni 55.4254.9254.86
Table 5. The enthalpies and peak temperatures of the produced NiTi samples during cooling and heating (DSC) cycles.
Sample TypeCooling CycleHeating Cycle
Peak (°C)Enthalpy (J/g)Peak (°C)Enthalpy (J/g)
Powder 116.7816.8
30 µm−67.014.0−30.113.9
60 µm−61.515.1−24.715.1
90 µm−38.615.9−8.216.0
Table 6. The most important measures obtained for the three different LT values.
Input/Output Terms30 µm60 µm90 µm
Build time (min)1256342
Machine energy (kW)36.4618.3812.25
Chiller energy (kW)12.56.34.2
Pre-heat energy (kW)12.086.094.06
Total energy consumption (kW)61.0430.7720.51
Total inert gas consumption (l)625315210
Relative density (%)99.4599.2199.02
Nickel content (at.%)55.4254.9254.86
Average surface roughness (µm)5.046.937.13
Elastic modulus (GPa)56.15±3.666.70±0.2668.30±0.53
Disclaimer/Publisher’s Note: The statements, opinions and data contained in all publications are solely those of the individual author(s) and contributor(s) and not of MDPI and/or the editor(s). MDPI and/or the editor(s) disclaim responsibility for any injury to people or property resulting from any ideas, methods, instructions or products referred to in the content.