Abstract
The friction clutch design strongly depends upon the frictional heat generated between contact surfaces during slipping at the beginning of the engagement. Firstly, the frictional heat generated reduces the performance of the clutch system and then leads to premature failure for contacting surfaces in some cases. The experimental effort in this work included manufacturing friction facing from functionally graded material (FGM) (aluminum and silicon carbide) for the clutch system. For this purpose, a special test rig was developed to investigate the thermal behavior of FGM and compare it with other frictional materials. The Taguchi L9 orthogonal design was selected to analyze the effect of the three factors (rotational, speed, torque, and the type of the frictional material) with three levels on the surface temperature of the contacting surfaces. A three-dimensional finite element model was built to validate the experimental results where the difference between them did not exceed 5.2%. The experimental results showed that the temperatures grew with the disc radius. Furthermore, the surfaces of the pressure plates and the flywheel were affected by frictional heat flow, and this effect increased when increasing the sliding speed. The lowest temperatures occurred when using FGM, which was lower than the other materials by 10%. This study presented an integrated approach consisting of design, manufacturing, and testing to study the complex frictional materials’ effect on the clutch system’s tribological performance.
1. Introduction
The frictional clutch system is one of the main systems in a modern vehicle powertrain based on manual or automated manual transmission. The friction clutch system has more than one task, but the main one is the power transmission from the driving side (engine) to the driven side (gearbox). The other tasks are absorbing the vibration from the engine and providing a smooth transition under different vehicle driving conditions [1]. The most significant problem in the clutch system is the high surface temperatures resulting from the excessive frictional heat generation, which is mainly due to the slipping that occurs between the clutch components. Consequently, the kinetic energy converts into a high amount of heat energy in a short period. The properties of friction materials play a vital role in the distribution of the temperatures generated due to the effect of frictional heat [2]. Thermal investigation is the primary concern of researchers and design engineers to find the optimal design of a clutch system under different working conditions. Thermal issues in the automotive clutches and brakes were examined using various techniques from many research works [3,4,5,6,7,8,9,10,11,12,13,14,15]. The properties of friction materials play a vital role in the distribution of the temperatures generated because of the effect of frictional heat. Therefore, the selection of new material such as functionally graded material FGM is an important factor. It is an excellent advanced material that will revolutionize the manufacturing world. The development of functionally graded materials (FGMs) revolutionized the manufacturing sectors of mechanical parts, especially in the automotive, aviation, and biomedical fields [16,17,18,19,20,21,22,23,24,25]. A gradual change in composition and structure over volume is an important characteristic feature of functionally graded material (FGM). Various processing methods are available to obtain functionally graded materials, including powder compacting, centrifugal, and stir casting [15].
The novelty point of this work is to develop an approach to manufacture and test a new friction material for a dry clutch from functionally graded material (FGM). Furthermore, the other aims are to study, analyze, and compare the thermal behavior of FGM with other frictional materials using experimental (developed test rig) and numerical approaches. The Taguchi method L9 array was applied to analyze the experimental tests in order to find the effect (contribution) of each input factor (torque, rotational speed, and type of friction material) on the performance of the clutch system. A three-dimensional Finite Element model was created to simulate the thermal performance of the clutch system using FGM.
2. Materials and Methodology
2.1. FGM
The first step of this work began with the manufacturing of an Al–Sic functionally graded material using powder metallurgy. Aluminum (Al) was used as a matrix, Sic was used as reinforcement, and powder metallurgy was used as the manufacturing method. The aluminum and silicon carbide mesh sizes were No. 200 and No. 220, respectively. Silicon carbide was used to increase the hardness and wear resistance of FGM. The different ratios of the materials that were used for each layer of the FGM sample are shown in Table 1. Pure aluminum was selected as a matrix material because it has high hardness and strength as its age progresses. The upper layer was subject to frictional impact because of direct contact with the pressure plate or flywheel. This first layer had a higher ratio of Sic, while the second layer contained a lower ratio of Sic, and the third layer was pure aluminum. The layer’s numbers and the dimensions of the demand product are depicted in Figure 1.

Table 1.
The properties of the materials in each layer of the FGM clutch disc.
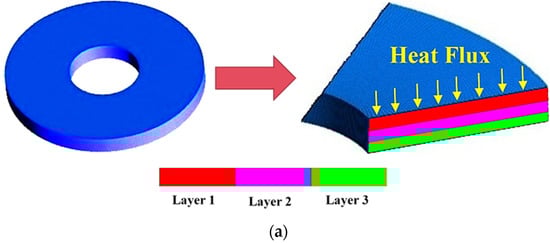
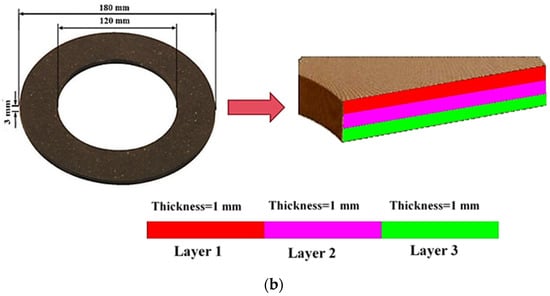
Figure 1.
Details of the frictional facing: (a) the layer arrangement and (b) the dimensions.
These aluminum and silicon carbide powders were ball milled (Figure 2a) for 1.5 h in a ball mill at a speed of 101 rpm using Tungsten balls. The ball-to-powder mass ratio was 10:1 [26]. A cold uniaxial press with a die punch arrangement was employed to compact a powder mixture. The powders were poured into the die and pressed in a cold pressing machine at a load of 1420 kN. Colloidal graphite was used as a lubricant to avoid sticking materials on the wall of the die. It was also used in order for the powder to flow freely. Figure 2b shows the details of the used die. The FGM specimens were sintered for 1 h at a temperature of 580 °C in a protected atmosphere furnace and cooled in the furnace for half an hour. The final test specimen is shown in Figure 3, and the manufacturing steps are represented in Figure 4.
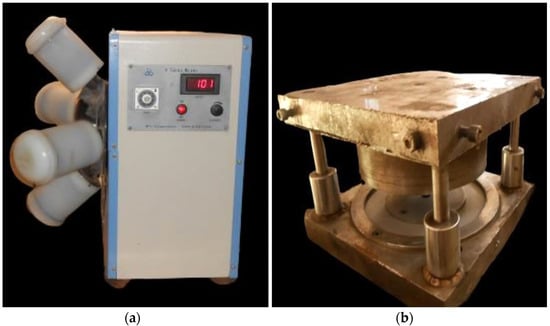
Figure 2.
The manufacturing devices: (a) the pressing machine and (b) the die.
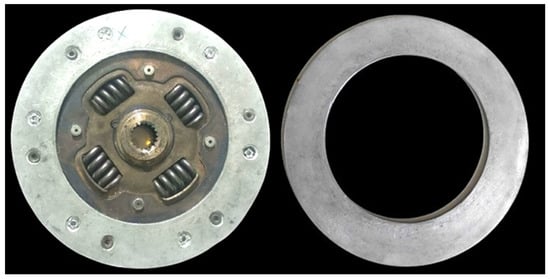
Figure 3.
The final product of the clutch disc using FGM.
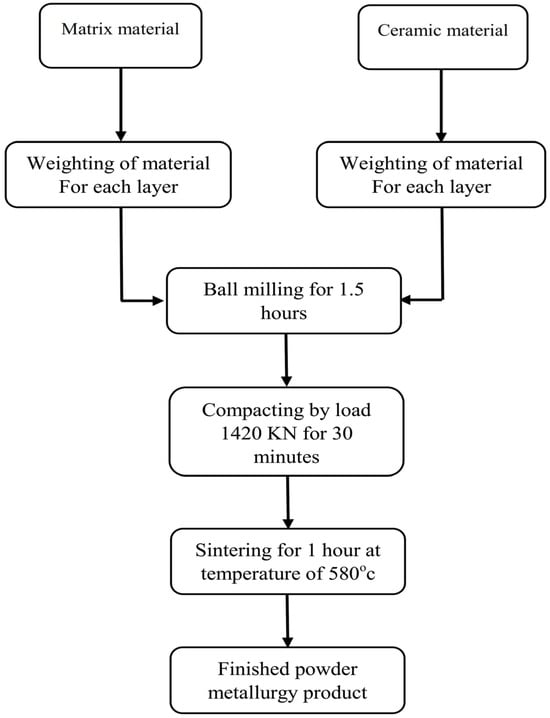
Figure 4.
The manufacturing steps of the FGM clutch disc.
A Micro Vickers hardness tester was used to measure the hardness of the functionally graded material. The indentation load was 4.90 N for 15 s. As seen in Table 2, the hardness values are excellent compared to those obtained for FGM (Al-Ni) in Al-Shafaie et al.’s work [27].
Table 2.
The average values of the hardness for the selected frictional materials.
Two other frictional materials (VH-03 and HD-005) were selected and commercially used in order for the frictional systems to compare their behavior with the FGM proposed in this work. These frictional materials comprise mainly glass fiber and copper, and the properties of these frictional materials and the properties of each layer can be seen in Table 3 and Table 4.
Table 3.
The material properties of the selected frictional materials.
Table 4.
The properties of the layers of FGM.
2.2. Experimental Procedure
In order to conduct the experimental tests designed, a certified test rig was developed by Jana et al. [28]. It mainly consists of three main parts: a driving part, a driven part, and a mechanical friction clutch system that couples both parts, as shown in Figure 5. The test rig has multiple sensors for measuring the clutch torque, pressures, and friction interface temperatures. The driving component consists of an electric motor (3-phase, 10 HP) at 1500 rpm that drives the clutch via hard-torsion coupling. Its speed is mechanically controlled using pulleys and belts. The driven part acts as a generator, providing controlled power application. In this system, a Peugeot disc brake is used as a generator, causing an appropriate counter torque depending on the delivery load. This device was placed in the postgraduate laboratory of the Department of Mechanical Engineering, College of Engineering, University of Baghdad, where all the tests were conducted [23]. Thermocouples were fixed on the flywheel and pressure plate and were distributed in different positions, as shown in Figure 6.
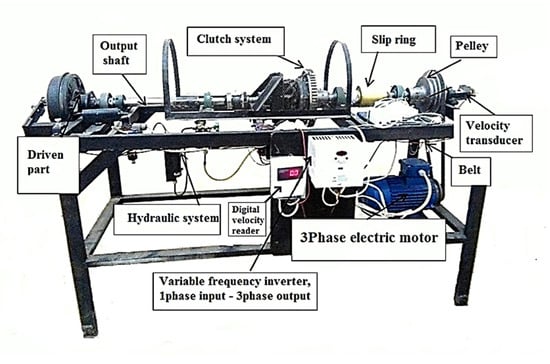
Figure 5.
The developed test rig of the dry clutch system.
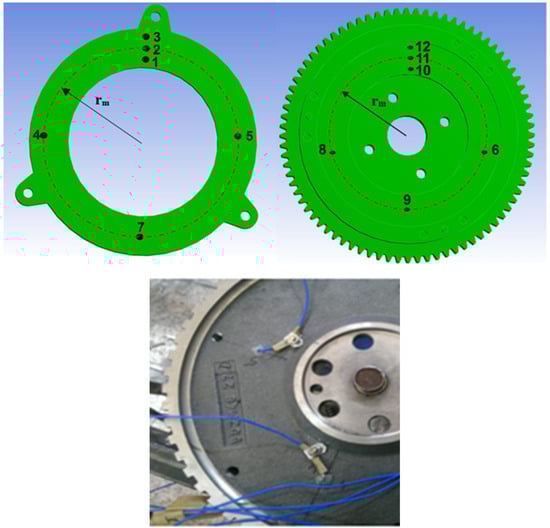
Figure 6.
The distribution of thermocouples on the flywheel and the pressure plate parts.
The experimental tests’ working conditions (three factors with three levels), using the Taguchi method, were designed so that results could be analyzed later on. Therefore, the contribution of each selected factor (rotational speed, torque, and material type) to the engagement process could be determined. Also, an evaluation of the thermal behavior and performance of the process was undertaken using FGM friction material. The slip time for all the tests was 30 (s). Table 5 shows the selected factors and their levels of experimental work, and Table 6 lists the working conditions of the nine cases based on the Taguchi method (l9 matrix).
Table 5.
The selected factors and their levels of experimental work.
Table 6.
The working conditions of the nine cases based on the Taguchi method (L9 matrix).
Welded thermocouples were calibrated in eight stages, using distilled water as a reference medium for measurement at atmospheric pressure. Firstly, the thermocouples sensed ice temperature, which reached 0 degrees, and were then used to measure the temperature of boiling water, which reached 100 degrees. After that, the temperature of the mentioned water changed in six situations ranging from 10 to 60 degrees. The data logger measured the temperatures at any time during the test. Subsequently, there were eight groups of points to draw the average calibrated line between true thermocouple temperature readings and the actual temperature. This line fit the spread data points using the definition of the least squares criterion, as appear in Figure 7, and is represented by the following equation:
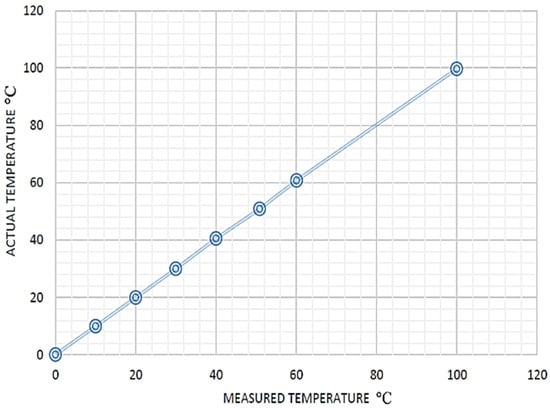
Figure 7.
Thermocouple calibration.
The experiments faced some problems, the most important of which was fluctuation in the temperature and torque readings, which were then controlled and solved by using very accurate measuring devices, namely the NI compact DAQ 9213 to measure temperature and the myRIO-1900 to measure torque.
2.3. Numerical Simulation
Contact with sliding surfaces generates frictional heat, which can be difficult to analyze. Friction and heat come from clutch parts sliding at various speeds. According to the first rule of thermodynamics, all of the kinetic energy is transformed into heat at the interfaces. Both conduction and convection can be used to release heat into the environment. Based on the foregoing, the following postulates guided the investigation [29]:
- The materials are isotropic, and the thermal characteristics of the materials do not depend on temperature.
- Both the actual and the nominal contact areas are the same size.
The following conversion is used to quantify the heat output [2]:
Additionally, the heat produced is equal to the sum of the heat produced by the pressure plate and the flywheel,
where Qgen.p is the heat generated by the pressure plate, Qgen.c—by the clutch disc, and Qgen.p—by the flywheel. When the radius of the clutch disk (r) is known, the sliding angular speed () r/s may be calculated. The time-dependent angular speed under the linear reduction assumption is as follows:
When at t = 0, the initial angular sliding speed is .
If Equation (3) is plugged into Equation (1), Equation (4) is obtained, which is the general form equation for any given load direction, as indicated here:
The transient thermal problem of the clutch system was solved numerically based on uniform pressure assumption. An Ansys/workbench 2022 was used to carry out the 3D simulation, and the main steps are represented in Figure 8. The optimal meshes of the clutch model and Grid Independence Test are shown in Figure 9. The FE 3D model had 913,478 nodes (204,956 elements), and the type of element was Hexa. The arithmetic method used in the model was Crank–Nicolson, unconditionally. The material characteristics of each layer are shown in Table 6. It was assumed that the heat transfer coefficient was a constant and equaled 40.89 W/m2 K.
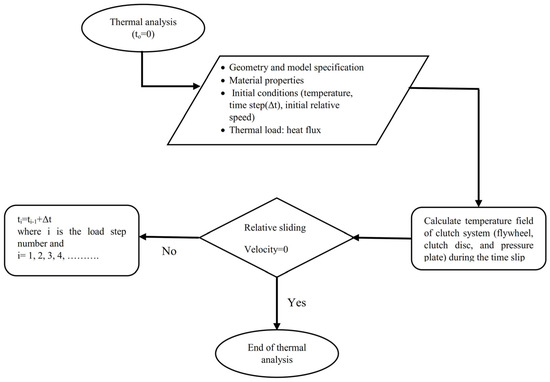
Figure 8.
The flowchart depicts the finite element solution of a thermoelastic problem.
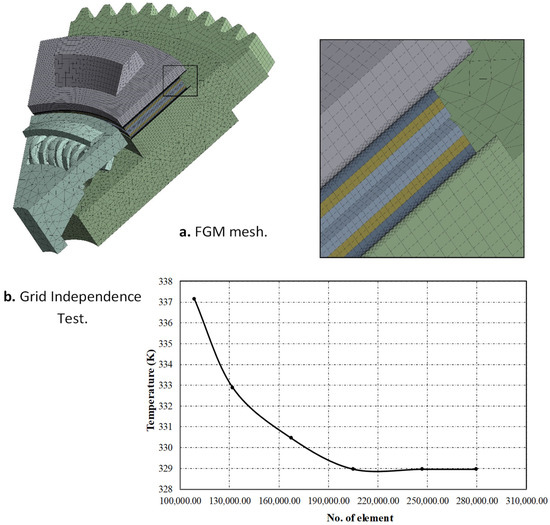
Figure 9.
(a) The optimal mesh of the clutch system using FGM and (b) the Grid Independence Test for mesh.
A heat conduction equation was then applied to the frictional clutch’s primary components [1],
where (α = k/ρ c). r, ϴ, and z are the cylindrical coordinates, and δ is the thickness of the contacting parts. The convection effect on the surfaces that were exposed to the working environment during the sliding time was taken into consideration. Due to the symmetry in the geometry and the boundary conditions of the clutch system in the z-axis, it was possible to simulate only the sector of the clutch disc to reduce the time consumption for calculation. The boundary conditions are depicted in Figure 10.
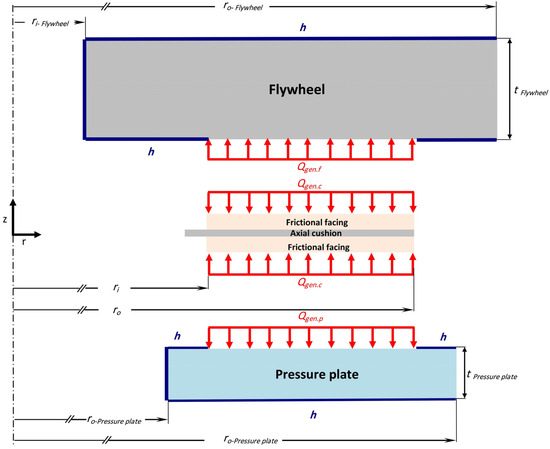
Figure 10.
The boundary conditions of the clutch system model.
- Flywheel: the conditions on the inner and outer disc radii are
- and at the back side of the flywheel, it is
- Pressure plate: the conditions at the inner and outer radii are
The initial temperature is
3. Results and Discussions
In this work, a designed experimental approach to study and evaluate the thermal behavior of different frictional-facing materials (FGM, HDS57, and VH-03) was adopted. The FGM was produced according to a systematic manufacturing process and then presented as an alternative promising frictional material. A 3D Finite Element Model was created to achieve a verification process in terms of the variation of temperature during the sliding process.
3.1. The Heat Transfers of the Pressure Plate and Flywheel
Figure 11, Figure 12, Figure 13, Figure 14, Figure 15 and Figure 16 depict the variation of temperatures at three positions on the pressure plate and flywheel during the engagement process, where the temperature difference did not exceed 3%. It can be seen that the pressure plate heated up faster than the flywheel during slippage, and it cooled down more slowly after engagement. The reason for such results is attributable to the low thermal capacity of the pressure plate compared to the flywheel; therefore, after some engagements, the temperature difference between them would significantly grow. The other reason is that the flywheel had some surfaces freely exposed toward the engine, which causes a larger convective heat transfer, which then reduces the heat level more than the pressure plate.
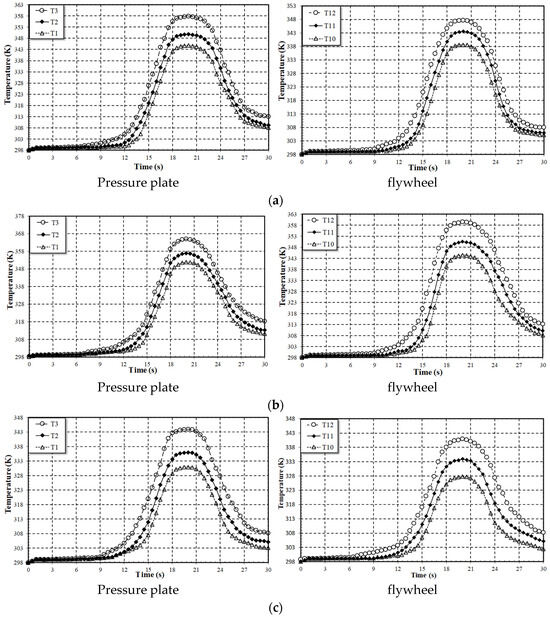
Figure 11.
Temperature distributions applied to different speeds (Torque = 4.5 kg·m). (a). Rotational speed = 680 (rpm) using VH-03. (b). Rotational speed = 860 (rpm) using HDS57. (c). Rotational speed = 1200 (rpm) using FGM.
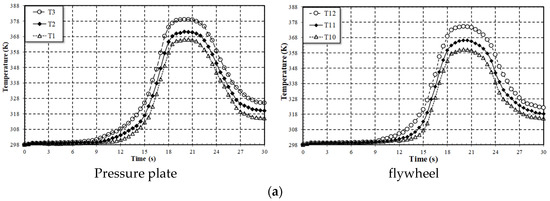
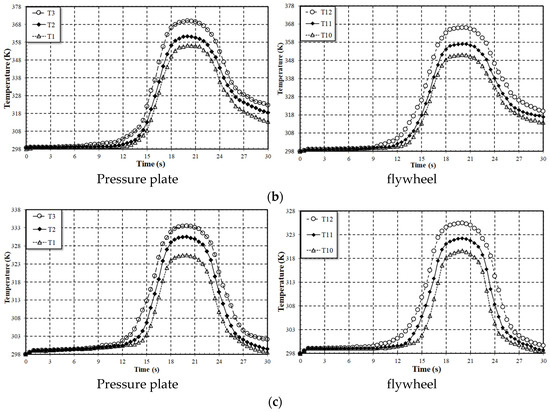
Figure 12.
Temperature distribution at a constant torque (3.5 kg·m) for different speed values. (a). Rotational speed = 680 (rpm) using HDS57. (b). Rotational speed = 860 (rpm) using FGM. (c). Rotational speed = 1200 (rpm) using VH-03.
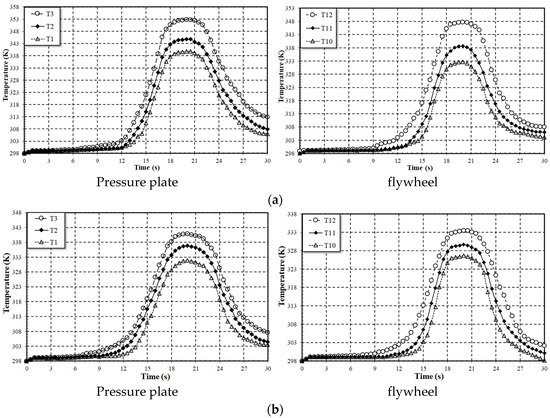
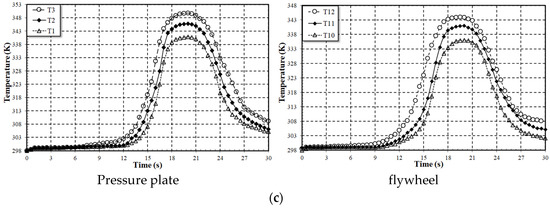
Figure 13.
Temperature distribution at a constant torque (2.5 kg·m) for different speed values. (a). Rotational speed = 680 (rpm) using FGM. (b). Rotational speed = 860 (rpm) using VH-03. (c). Rotational speed = 1200 (rpm) using HDS57.
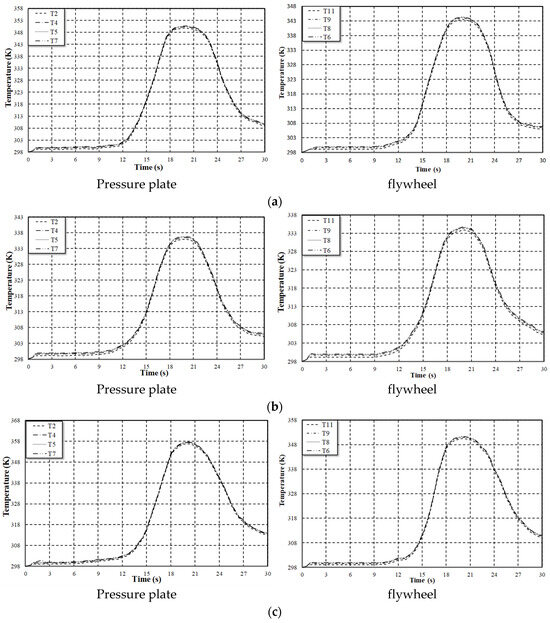
Figure 14.
Temperature distribution at a constant speed (680 rpm) when applying different torques. (a). Torque = 4.5 (kg·m) using VH-03. (b). Torque = 3.5 (kg·m) using HDS57. (c). Torque = 2.5 (kg·m) using FGM.
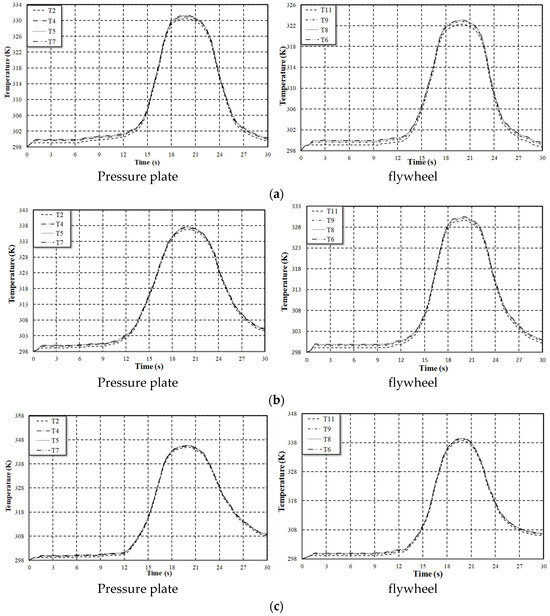
Figure 15.
Temperature distribution at a constant speed (860 rpm) when applying different torques. (a). Torque = 4.5 (kg·m) using HDS57. (b). Torque = 3.5 (kg·m) using FGM. (c). Torque = 2.5 (kg·m) using VH-03.
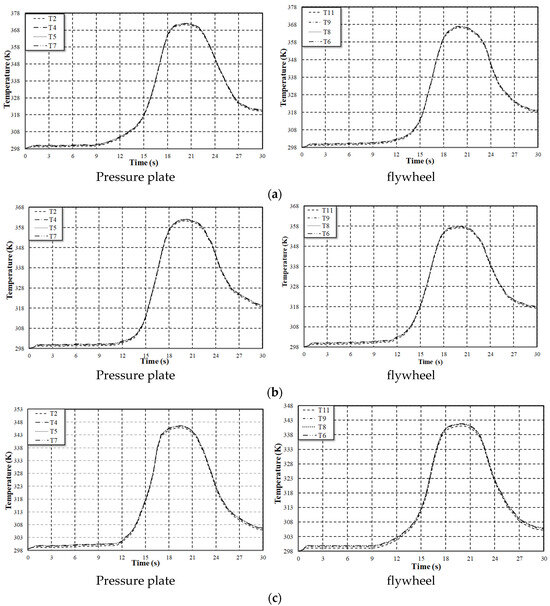
Figure 16.
Temperature distribution at a constant speed (1200 rpm) when applying different torques. (a). Torque = 4.5 (kg·m) using FGM. (b). Torque = 3.5 (kg·m) using VH-03. (c). Torque = 2.5 (kg·m) using HDS57.
3.2. Radial and Circular Effect on the Temperature
Figure 11, Figure 12 and Figure 13 show the temperature distribution along the surface of the frictional heat flow close to the three radii for the pressure plate and flywheel. The results demonstrated that the temperatures during the sliding phase increased with the disc radius. This fact proved that the disc’s outer edge was the highest hot and the inner edge was the lowest hot. All the curves of the figures above behaved similarly, albeit over a different temperature spectrum. The behavior observed from the experimental tests of the clutch system was the same pattern of behavior observed when applying the principle of uniform pressure to a brand-new clutch disc. Figure 12, Figure 13 and Figure 14 show the clutch disc in circular positions, none of which resulted in a significant difference in temperatures where the maximum difference did not exceed 0.56%.
3.3. The Effect of Rotational Speed
Figure 11, Figure 12 and Figure 13 illustrate the findings of three operational instances, specifically the variation of temperatures as a function of time for the various rotational speed values when the torque was constant. The curve patterns demonstrated that the frictional heat generation was raised in direct proportion to the slipping rotational speed. The figures showed that in case (a), the rate of the temperature rise was the lowest of the three scenarios considered. Since case (a) had the lowest slippage speed for the same torque, it also brought about the least amount of heat. By contrast, the temperature rose at a hotter rate because of the higher slipping speed in case (c).
This happens because a high amount of heat is generated at a faster engagement process (high rotational speed), and a low amount of heat is generated at a lower engagement process. However, more heat is generated because of the reduction in the contact area with each increasing of the rotational speed when all other parameters remain constant. In such cases, contact pressure is concentrated in the small zone of the nominal contact area, and in some cases, flash temperatures occur. As a result of these working circumstances, the wear rate is dramatically increased, reducing the efficiency and lifetime of the frictional clutch disc. It can be seen that the generated values of the frictional heat decreased with time from maximum values at ts = 0 to minimum values (zero) at the end of the heating phase (slipping time). The reason for obtaining these results is that the heat generated is directly proportional to the sliding speed. The sliding speed of the friction clutches started with a maximum value at the beginning of the heating phase and decreased to zero at the end of the heating phase.
3.4. The Effect of Torques
Figure 14, Figure 15 and Figure 16 show temperature evolution with time when applying different torques. The temperature level significantly increased when the torque increased for both the flywheel and the pressure plates; the rubbing surfaces therefore produced more heat. When the transmitted torque was high, the contact pressure was also high due to the direct relationship between them. The difficulty of rotating the parts at the beginning of the engagement occurred because the transmission torque was lower than the engine torque. This resulted in the transmission torque becoming insufficient to counteract the wheels’ negative torque, thereby causing a gradual increase in its value. At mid-time in the engagement phase, the transmitted torque exceeded the negative torque and the vehicle moves, and then the clutch speed approached the engine speed, which explains the temperature behavior and why the maximum value occurred at that point. The increasing rate of the temperature was closely related to the working conditions of input speed and resistant torque. At the same input torque, the higher the input speed ω, the higher the temperature-increasing rate. The higher the input torque and speed, the higher the temperature of the temperature-increasing rate.
3.5. The Effect of Material
Figure 17 shows the highest temperatures of the three frictional materials (HDS57, VH-03, and FGM) when applying a 4.5 kg.m torque and a rotational speed of 1200 rpm. The primary goal of thermal analysis is to predict temperature behavior during engagement. The highest temperature levels occurred when using the frictional facing of HDS57, followed by VH-03, and finally, FGM (Al–Sic). The reverse is true with heat dissipation, where the FGM had the maximum dissipation rate. The percentage reductions in the maximum temperatures were 10% and 14% when using FGM (Al–Sic) material instead of the VH03 and HDS57 friction materials, respectively. These results proved that FGM is superior to other frictional materials with regard to heat behavior. This is because FGM (Al–Sic) has better thermal properties. It should be understood that material having lower thermal conductivity thus generates important thermal gradients, consequently increasing the clutch disc’s surface temperature. In order to choose the material and know if it was profitable, one that provided better cooling was tested. It is necessary to remember that an optimal material was one that did not preserve heat. This could be provided by using functionally graded material.
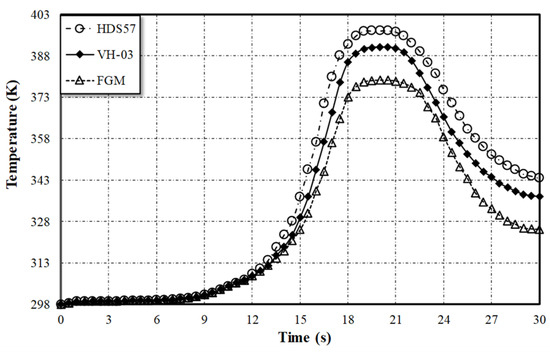
Figure 17.
A comparison of the maximum temperature distribution of speed (1200 rpm) and torque (4.5 Kg·m) for different materials.
The Taguchi method L9 was applied to statistically analyze the results obtained in order to determine the effect of input parameters on temperature values during the slipping period of the clutch, based on the nine experiments listed in Table 5, which have three parameters with three levels for each parameter. This statistical analysis for the results is significantly important because it clarifies the significance of the developed model, the contribution of each parameter, and the importance of each parameter. Because the values in the table above were not all collected under the same working conditions, the analysis of frictional materials does not accurately reflect the real situation depicted in Figure 15, which shows a comparison of materials under the same conditions.
However, the functionally graded materials that were studied were the best material that appeared in the statistical analysis. Figure 18 demonstrates the mean effect and the mean of SN ratios, and it is noticeable that none of the observations fell outside the parameters set by Minitab software 21.4.1, where the anticipated and observed values of torque and speed correspond. Based on the results of Table 6, the highest contribution was the torque (58.27%), followed by the rotational speed (40.11%), and the last one, the material type (1.02%).
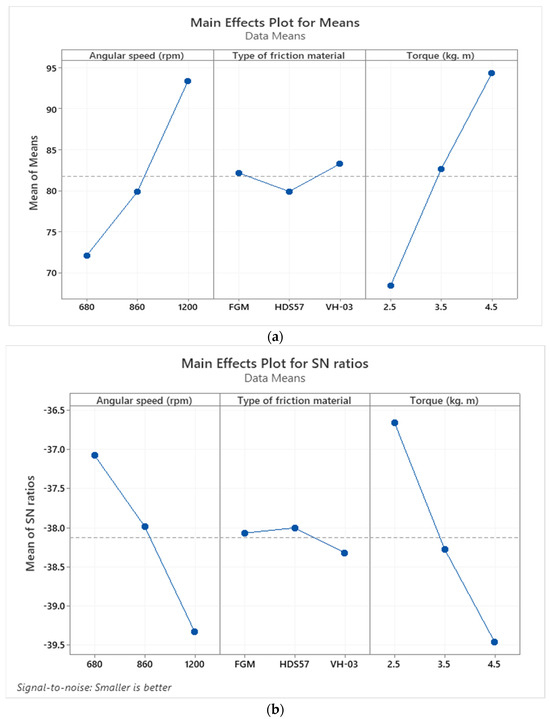
Figure 18.
The diagnostic plots of parameter effects: (a) Main effect plot of means and (b) the main effect of SN ratios.
Table 7 shows the Analysis of Variance (ANOVA), where the greatest F-values refer to the significance of the model parameters. In the p value field, values larger than 0.1 confirm a low significance of model factors. The R-sq and R-sq (adj) recorded high values of 0.9941 and 0.9765, respectively. This refers to an excellent agreement between actual and estimated values. Statistically, the most significant parameters are torque with less p-value and the highest contribution, followed by rotational speed.
Table 7.
The results for the Analysis of Variance (ANOVA).
A comparison was made between the numerical and experimental results of the FGM model only. Figure 19 shows the contour plot of temperature vs. angular speed and torque. It appears that the maximum value of three parameters together provides the upper range of temperatures.
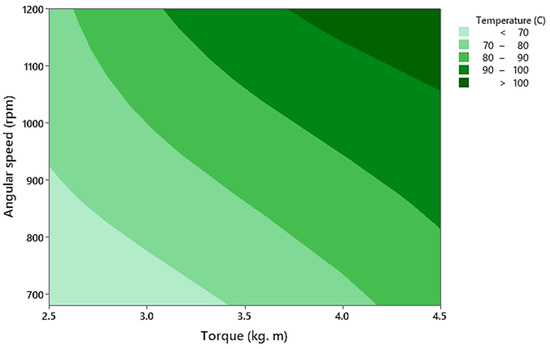
Figure 19.
The contour plot of temperature (°C) vs. angular speed (rpm) and torque (kg·m).
Figure 20 shows the history of the maximum surface temperature during the sliding process, according to numerical and experimental approaches, and a match ratio that reached more than 94.8%. Deviations from the experimental curve appeared, and this is mainly due to the fact that, in numerical analysis, it is assumed that the exchange of heat occurs between the lining and its surroundings on the borders of contact; hence, lower temperatures occur at the lining of these sites. This is also due to the violent fluctuations of the frictional torque at the end of the engagement process. From an engineering application perspective, the validity of the experimental approach was validated with a numerical model. Figure 21 represents a sample of the numerical results, which is the counter temperature distribution of FGM in the cross-section. The parameters of analysis were 1200 rpm speed and 4.5 kg·m.
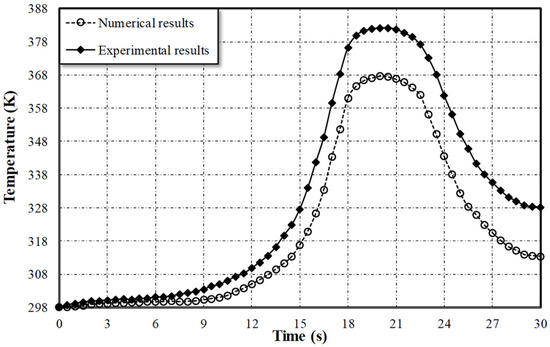
Figure 20.
A comparison between numerical and experimental results.
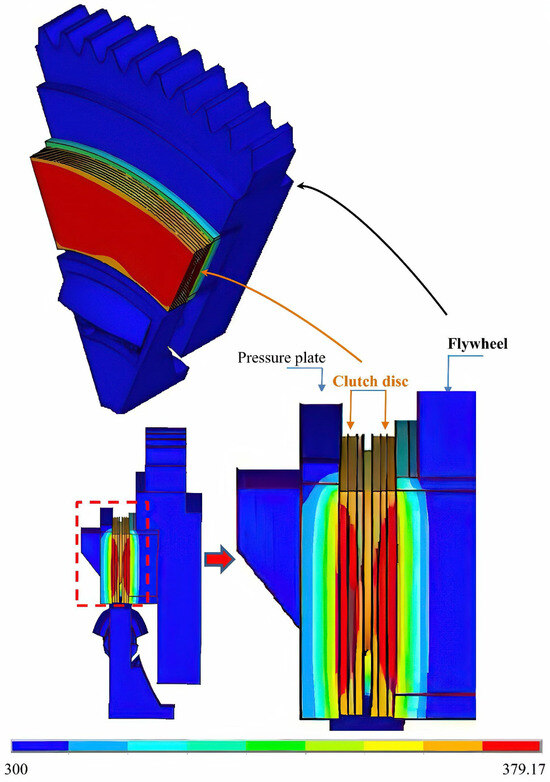
Figure 21.
Temperature distributions using an FE model of the friction clutch system.
4. Conclusions and Remarks
The thermal behavior and performance of dry friction clutches were deeply investigated in this research paper using a developed standard test rig. The thermal performance of a new frictional-facing material made from an FGM (Al–Sic) was examined. A comparison was made between the behavior of the FGM with other frictional materials (HDS57 and VH-03). The most significant findings of the results can be summarized as follows:
- The results proved that the heat flow was proportional to the disc radius during the sliding time when the lowest temperatures were recorded at the inner disc radius and the highest were recorded at the outer disc radius, with a difference of 5.3%.
- The new FGM (Al–Sic) material has superior thermal behavior compared with the other materials (VH03 and HDS57). The reduction in surface temperatures reached 10% and 14% due to a high heat dissipation feature according to its thermal properties. This proves that FGM is most suitable for use in a dry clutch system.
- Temperature variations were significantly affected by torque, firstly, and secondly, the sliding speed. In general, the maximum temperature approximately occurred in the middle of the sliding period and then decreased to a minimum temperature at the end of the sliding period.
- The results showed that the change in temperature values with radial direction is much higher than in the circumference direction; therefore, the latter is not important, because the maximum difference does not exceed 0.56%.
- The thermal behavior of a clutch disc depends on the choice of several factors:
- Friction material;
- Rotation speed;
- Loading or transmission torque;
- Boundary conditions and loading.
- To estimate the highest temperature that will occur during the sliding phase, the temperature field of the contact surfaces during the start of the engagement operation must be studied. As a result, the clutch system’s stability under a certain thermal condition can be assessed. Automotive experts view this study as crucial to determining the friction clutch’s optimal design and calculating the lifespan of the contacting elements of the clutch system.
This work included manufacturing the friction lining from functionally graded materials, experimentally testing it, and comparing it with other composite materials to evaluate its thermal behavior. For future work, the study of other types of functionally graded materials can be expanded, and different proportions can be studied via manufacturing and testing them experimentally. Also, this study can be used in various friction clutch system configurations, such as those with radially or circumferentially dispersed grooves, in order to investigate their effects on the thermal behavior of sliding systems using both experimental and numerical methods for FGMs.
Author Contributions
Methodology, Investigation, Writing—Review and Editing—Funding Acquisition, N.A.J., I.Y.H.; Validation, Funding Acquisition, Writing—Review and Editing, O.I.A.; Formal Analysis, Writing—Review and Editing, Funding Acquisition, Resources, M.N.M. All authors have read and agreed to the published version of the manuscript.
Funding
This research received no external funding.
Data Availability Statement
The study did not report any data.
Conflicts of Interest
The authors declare no conflict of interest.
Nomenclature
| c | Specific heat (J kg−1 m−1) |
| h | Heat transfer coefficient (W m−2 K−1) |
| K | Thermal conductivity (W m−1 K−1) |
| Q | Total heat generation (W) |
| q | Nominal value of the specific power of friction (W m−2) |
| P | Pressure (Pa) |
| r | Radius (m) |
| ri | Inner radius (m) |
| ro | Outer radius (m) |
| rm | Mean radius |
| t | Time (s) |
| ts | Slip time (s) |
| Thickness of clutch disc (m) | |
| Thickness of axial cushion | |
| Temperature (k) | |
| Ta | Ambient temperature |
| Initial temperature (k) | |
| Greek Symbols | |
| Temperature rise (k) | |
| Temperature rise scaling factor (k) | |
| ρ | Density of metals |
| Thermal diffusivity (m2 s−1) | |
| µ | Friction coefficient |
| Abbreviations | |
| FGM | Functionally graded material |
| HDS57 | A rigid woven friction material manufactured with draft yarn and aramid fibers |
| VH-03 | A woven material with glass fiber, which is reinforced with copper |
References
- Laith, A.; Sabri, N.S.; Adolfo, S.; Muhsin, J.J.; Azher, M.A.; Oday, I.A. Three-Dimensional Finite Element Analysis of Contact Problem in Dry Friction Clutches. Lubricants 2021, 9, 115. [Google Scholar]
- Nasr, A.J.; Ihasn, Y.; Hussian; Oday, I.A. Numerical simulation of dry friction clutch thermal behavior with different friction materials. In AIP Conference Proceedings 2651; AIP Publishing: Melville, NY, USA, 2023; Volume 2651, pp. 1–9. [Google Scholar]
- Majeed, M.H.; Kadhim, D.E.; Schlattmann, J. Numerical analysis of the thermal problem in dry friction clutch based on the interactive design approach. Int. J. Interact. Des. Manuf. 2020, 14, 1091–1101. [Google Scholar] [CrossRef]
- Gkinis, T.; Rahnejat, R.R.H.; O’mahony, M. Heat generation and transfer in automotive dry clutch engagement. J. Zhejiang Univ. Sci. A. Appl. Phys. Eng. 2018, 19, 175–188. [Google Scholar] [CrossRef]
- Nasr, A.J.; Ihsan, Y.H.; Abdullah, O.I. Thermal and thermoelastic problems in dry friction clutch: A comprehensive review. Heat Transf. 2021, 50, 7855–7878. [Google Scholar]
- Xiong, C.; Man, C.; Yu, L. Analytical model and material equivalent methods for steady state heat partition coefficient between two contact discs in multi-disc clutch. Automob. Eng. 2019, 234, 857–871. [Google Scholar] [CrossRef]
- Çakmak, T.; Kılıç, M. Clutch transient heat transfer simulation for hill start vehicle test condition. In Proceedings of the 13th International Conference on Heat Transfer, Fluid Mechanics and Thermodynamics, Portoroz, Slovenia, 17–19 July 2017; pp. 847–851. [Google Scholar]
- Abdullah, O.I.; Schlattmann, J. Thermal behavior of friction clutch disc based on uniform pressure and uniform wear assumptions. Friction 2016, 4, 228–237. [Google Scholar] [CrossRef]
- Abdullah, O.I.; Schlattmanna, J. Thermoelastic analysis of grooved friction clutches using finite element method. Tribol. Trans. 2017, 60, 1011–1102. [Google Scholar] [CrossRef]
- Alawi, A.; Aziz, A.; Yousif, E.; Muneer, A.; Jassim, A.H. An Investigation into the Behavior of Disc Brake Wear. Al-Khwarizmi Eng. J. 2007, 3, 49–66. [Google Scholar]
- Sahu, M. Finite Element Analysis of Single Plate Clutch by using Ansys. Int. J. Res. Appl. Sci. Eng. Technol. 2018, 6, 1337–1346. [Google Scholar] [CrossRef]
- Mouffak, E.; Bouchetara, M. Transient thermal behavior of automotive dry clutch discs by using Ansys software. Mechanika 2016, 22, 562–570. [Google Scholar] [CrossRef]
- Pica, G.; Cervone, C.; Senatore, A.; Lupo, M.; Vasca, F. Dry dual clutch torque model with temperature and slip speed effects. Intell. Ind. Syst. 2016, 2, 133–147. [Google Scholar] [CrossRef]
- Fatin, E.G. Thermal Modeling and Simulation of Dry Friction Clutches in Heavy-Duty Trucks. Master’s Thesis, Istanbul Technical University, İstanbul, Türkiye, 2015. [Google Scholar]
- Wang, H.; Wang, B.; Pi, D.; Wang, E.; Wang, X. Two-Layer Structure Control of an Automatic Mechanical Transmission Clutch During Hill Start for Heavy-Duty Vehicles. IEEE Access 2020, 8, 49617–49628. [Google Scholar] [CrossRef]
- Surya, M.S.; Prasanthi, G. Tribological Behaviour of Aluminum Silicon Carbide Functionally Graded Material. Tribol. Ind. 2018, 40, 247–253. [Google Scholar] [CrossRef]
- Zhou, W.; Zhang, R.; Ai, S.; He, R.; Pei, Y.; Fang, D. Load distribution in threads of porous metal–ceramic functionally graded composite joints subjected to thermomechanical loading. Compos. Struct. 2015, 134, 680–688. [Google Scholar] [CrossRef]
- Zhou, W.; Ai, S.; Chen, M.; Zhang, R.; He, R.; Pei, Y.; Fang, D. Preparation and thermodynamic analysis of the porous ZrO2/(ZrO2 + Ni) functionally graded bolted joint. Compos. Part B Eng. 2015, 82, 13–22. [Google Scholar] [CrossRef]
- Stojanovic, N.; Abdullah, O.I.; Rakisheva, Z.B.; Lattieff, F.A.; Hashim, E.T. The Effect of Applied Pressure Function on Thermo-Elastic Problem in the Dry Friction Clutches. J. Fail. Anal. Preven. 2020, 20, 2145–2152. [Google Scholar] [CrossRef]
- Abdullah, O.I.; Schlattmann, J.; Jobair, H.; Beliardouh, N.E.; Kaleli, H. Thermal stress analysis of dry friction clutches. Ind. Lubr. Tribol. 2018, 72, 189–194. [Google Scholar] [CrossRef]
- Baskar, P. Stress and Thermal Analysis of Clutch Plate. Int. J. Mech. Eng. Technol. 2018, 9, 611–618. [Google Scholar]
- Faidhallah, M.H. Numerical and Finite Element Contact Temperature Analysis of Friction Material ’s Type Effect on a Thermal Transient Behavior of a Single-Disc Dry Clutch. Tribologia 2017, 1, 35–43. [Google Scholar]
- Topczewska, K.; Schlattmann, J.; Abdullah, O.I. Temperature and Thermal Stresses Distributions in a Dry Friction Clutch. J. Theor. Appl. Mech. 2020, 58, 351–360. [Google Scholar] [CrossRef]
- Chyad, F.; Akram, J.; Sabreen, A. Physical and Morphological Properties of Hard-Soft Ferrite Functionally Graded Materials. Al-Khwarizmi Eng. J. 2018, 14, 99–107. [Google Scholar] [CrossRef]
- Ebhota, W.S.; Karun, A.S.; Inambao, F.L. Principles and Baseline Knowledge of Functionally Graded Aluminium Matrix Materials (FGAMMs): Fabrication Techniques and Applications. Int. J. Eng. Res. Afr. 2016, 26, 47–67. [Google Scholar] [CrossRef]
- Mulugundam, S.S.; Prasanthi, G. Manufacturing and Mechanical Behavior of (Al/SiC) Functionally Graded Material using Powder Metallurgy Technique. Int. J. Innov. Technol. Explor. Eng. 2019, 8, 1835–1839. [Google Scholar]
- Al-Shafaie, S.H.; Nabaa, S.R.; Massoud, A.H. Preparation and Investigation Mechanical Properties of Functionally Graded Materials of Aluminum-Nickel Alloys. J. Mech. Eng. Res. Dev. 2021, 44, 102–109. [Google Scholar]
- Jenan, S.; Sherzaa, I.Y.; Hussain, O.I. Abdullah, Experimental investigation of transient thermal characteristics of a dry friction clutch using alternative friction materials under different operating conditions. Heat Transfer. 2022, 51, 3920–3950. [Google Scholar]
- Abdullah, O.I.; Schlattmann, J. Finite element analysis of temperature field in automotive dry friction clutch. Tribol. Ind. 2012, 34, 206–216. [Google Scholar]
Disclaimer/Publisher’s Note: The statements, opinions and data contained in all publications are solely those of the individual author(s) and contributor(s) and not of MDPI and/or the editor(s). MDPI and/or the editor(s) disclaim responsibility for any injury to people or property resulting from any ideas, methods, instructions or products referred to in the content. |
© 2023 by the authors. Licensee MDPI, Basel, Switzerland. This article is an open access article distributed under the terms and conditions of the Creative Commons Attribution (CC BY) license (https://creativecommons.org/licenses/by/4.0/).