Abstract
To investigate the performance of transcritical CO2 quasi-secondary compression cycle with ejector (TCIEJ) for heat pump water heaters, the thermodynamic model of TCIEJ is established based on the pinch point, and TCEX, TCEJ, and TCI are selected as comparisons. The effects of changing high pressure and ambient temperature on the heating COP and compressor exhaust temperature are analyzed, and the influence of cooling water inlet and outlet temperature and vapor injection pressure on TCIEJ is further analyzed. The results show that there are optimal high pressures that make the heating COP of the four heat pump cycles reach the maximum value, of which TCIEJ has the best performance. At an ambient temperature of −15 °C, the maximum heating COP of TCIEJ increased by about 20.5%, 14.9%, and 7.9% compared with TCEX, TCEJ, and TCI. With the increase in ambient temperature, the optimal high pressure continues to increase, and the corresponding maximum heating COP gradually increases. Selecting the geometric mean of high pressure and evaporation pressure as the optimal vapor injection pressure for TCIEJ, the error is small compared to the actual optimal vapor injection pressure. With the increase in ambient temperature and cooling water outlet temperature, the optimal high pressure of TCIEJ continues to increase, and the correlation formula of optimal high pressure is fitted according to the simulation results.
1. Introduction
The widely used hydrofluorocarbon (HFC) refrigerants are a powerful synthetic greenhouse gas with a global warming potential (GWP) from tens to tens of thousands of times that of CO2. As the problem of global warming becomes more and more serious, reducing greenhouse gas emissions is urgent. The Kigali Amendment signed in 2016 aims to limit greenhouse gas HFCs, and the elimination of refrigerants such as R134a and R410A has become inevitable. The natural working medium, CO2, has been studied and applied by people because of its excellent characteristics of zero ODP (ozone depletion potential) and low GWP [1]. Compared to heat pumps using the conventional working medium, the temperature drop curve of the transcritical CO2 heat pump in the heat release process and the temperature rise curve of the water can form a good matching relationship [2], which not only improves the heat exchange efficiency but also makes it have great advantages in the production of high-temperature hot water [3].
Although the application of CO2 refrigerant in heat pump water heaters has great advantages, the throttling loss of the transcritical CO2 cycle is too large, resulting in a greatly reduced system performance, which has become an important reason for restricting the development of CO2 heat pumps. Some scholars proposed ways to reduce throttling loss and improve system performance by adding an internal regenerator (IHX) [4] or introducing an expander [5] or ejector [6] instead of a throttle valve. Cao et al. [7] established a theoretical model to compare the heating performance of systems with and without IHX, and the results showed that the influence of IHX on COP correlated with the cooling water inlet temperature and gave an optimal length of IHX. Zhu et al. [8] conducted a study on a heat pump system with an ejector for the production of hot water up to 90 °C, and the results showed that the COP of the heat pump system with an ejector was 10.3% higher than that of the corresponding basic cycle. Wang et al. [9] further introduced IHX in the cycle with the ejector, and the analysis showed that the COP of the system increased by 7.38%.
When operating in cold regions, transcritical CO2 heat pumps also face problems such as excessive compressor discharge temperature and a sharp degradation in system performance. Some scholars have proposed solutions such as variable speed compressors, auxiliary heating cycles, two-stage compression cycles, and quasi-secondary compression cycles [10]. Among them, the quasi-secondary compression cycle improves the compression process in the second half of the compressor via vapor injection and increases the enthalpy of the compressor. This effectively reduces the compressor exhaust temperature and improves the COP and operational reliability of the system [11]. Beak et al. [12,13] studied the CO2 heat pump system with and without vapor injection, and the results showed that the vapor injection system could obtain higher COP and heat generation under low-temperature conditions.
If the ejector is introduced into the quasi-secondary heat pump system, the efficiency of the system can be further improved in theory. Studies by Xu et al. [14,15] have shown that when operating at low temperatures, the performance of the heat pump can be further improved by combining the ejector with an energy-efficient steam injection EVI scroll compressor. Bai et al. [16,17] studied an intermediate vapor injection heat pump circulation system using an ejector to increase efficiency, showing that the ejector can effectively recover the expansion work and improve the performance of the intermediate vapor injection system. The research of Li et al. [18] shows that the performance of a vapor injection system with an ejector can be increased by about 40% under low-temperature conditions compared with the basic CO2 transcritical refrigeration system, and the compressor exhaust temperature can be reduced by about 40 °C.
Introducing the ejector into the TCI instead of the throttle valve constitutes the TCIEJ, which reduces the throttle loss and can effectively reduce the compressor exhaust temperature and maintain good system performance under cold ambient temperatures. At present, most of the relevant research is limited to the influence of internal parameters such as high pressure and make-up volume on system performance. In order to study the influence of external parameters such as cooling water inlet and outlet temperature, flow rate, and ambient temperature on system performance, a thermodynamic model based on pinch points was established. TCEX, TCEJ, and TCI were selected as comparisons to analyze the influence of high pressure and ambient temperature on system performance, exhaust temperature of compression, and other parameters, and the correlation formula of the optimal high pressure is fitted according to the simulation data.
2. System Introduction
2.1. Transcritical CO2 Cycle with Expander (TCEX)
The schematic and pressure–enthalpy diagrams of the TCEX are depicted in Figure 1a,b, respectively. The system is mainly composed of a compressor, gas cooler, expander, and evaporator. The working process is as follows: the high-temperature and high-pressure CO2 gas discharged via the compressor enters the gas cooler isobaric cooling; Then, the CO2 working medium discharged via the gas cooler expands and depressurizes via the expander and recovers the expansion work; Subsequently, CO2 liquid enters the evaporator to absorb heat to a saturated gas state; Finally, the saturated CO2 gas enters the compressor to compress to the high-temperature and high-pressure state, and thus, a cycle is completed.
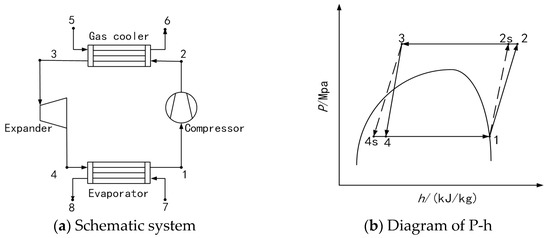
Figure 1.
TCEX.
2.2. Transcritical CO2 Cycle with Ejector (TCEJ)
The schematic and pressure–enthalpy diagrams of the TCEJ are shown in Figure 2a,b, respectively. The system is mainly composed of a compressor, gas cooler, ejector, evaporator, and gas–liquid separator. The working process is as follows: the high-temperature and high-pressure CO2 gas discharged via the compressor enters the gas cooler isobaric cooling; Then, the CO2 working medium enters the ejector as the motive fluid through the main nozzle, mixes, and spreads with the injected fluid from the evaporator in the ejector; Subsequently, CO2 working medium enters the gas–liquid separator for gas–liquid separation; The separated saturated CO2 liquid enters the evaporator to absorb heat after throttling and depressurization through the throttle valve, and then enters the ejector as the induced fluid; The separated saturated CO2 gas enters the compressor and is compressed to a high temperature and pressure, and thus, a cycle is completed.
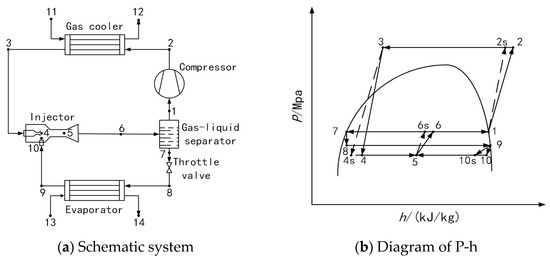
Figure 2.
TCEJ.
2.3. Transcritical CO2 Quasi-Secondary Compression Cycle (TCI)
The schematic and pressure–enthalpy diagrams of the TCI are depicted in Figure 3a,b, respectively, and the system is mainly composed of a vapor injection compressor, a gas cooler, an evaporator, a gas–liquid separator, a subcooler, and a throttle valve. The working process is as follows: the high-temperature and high-pressure CO2 gas discharged via the compressor enters the gas cooler isobaric cooling; Then, the CO2 working medium is divided into two strands; One is cooled by throttle valve 1 and enters the compressor as a supplementary gas after absorbing heat via the subcooler; The other stream is further cooled by the subcooler and enters the evaporator to absorb heat; The saturated gaseous CO2 discharged via evaporator enters the compressor, mixes with the supplementary gas after the first stage of compression, and then discharges the compressor after the secondary compression to a high temperature and high pressure, and thus, a cycle is completed.
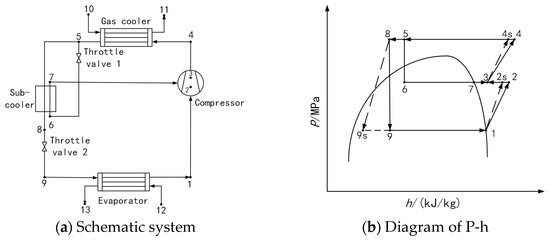
Figure 3.
TCI.
2.4. Transcritical CO2 Quasi-Secondary Compression Cycle with Ejector (TCIEJ)
The schematic and pressure–enthalpy diagrams of the TCIEJ are shown in Figure 4a,b, respectively, and the system is mainly composed of a vapor injection compressor, gas cooler, ejector, evaporator, gas–liquid separator, subcooler, and two throttle valves. The working process is as follows: the high temperature and high pressure CO2 gas discharged via the compressor enters the gas cooler isobaric cooling and heat release, and then the CO2 working medium is divided into two strands; A stream is cooled down by throttle valve 1 and enters the compressor as a supplementary gas after absorbing heat via the subcooler; The other stream is further cooled by the subcooler and then enters the ejector as an induced fluid, mixes and expands with the induced fluid from the evaporator in the ejector, and then enters the gas–liquid separator for gas–liquid separation; The separated saturated CO2 liquid passes through throttle valve 2 and undergoes throttling and depressurization, and then enters the evaporator to absorb heat to a saturated gaseous state; The saturated gaseous CO2 discharged via the evaporator enters the ejector as the induced fluid; The separated saturated CO2 gas enters the compressor, mixes with the vapor injection gas after the first stage of compression, and then discharges the compressor after the second stage compression to a high temperature and high pressure, and thus, a cycle is completed.
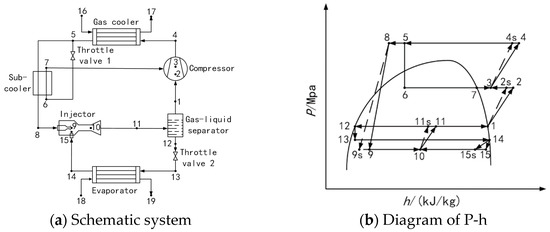
Figure 4.
TCIEJ.
3. Thermodynamic Model of the System
Since the specific heat of CO2 changes nonlinearly, there is a point in the gas cooler where the heat transfer temperature difference between cooling water and CO2 is the smallest, called the pinch point [19], as shown in Figure 5. If a complex model based on the structural parameters of the heat exchanger is introduced, it will be difficult to ensure the rationality and versatility of the model [20]. Therefore, the temperature difference in the pinch point is used as a known condition to build the model. There are also heat exchange pinch points in evaporators and subcoolers, which are generally fixed at the inlet or outlet. In practical applications, the ambient temperature and cooling water inlet and outlet temperatures have a great influence on the system’s performance. Therefore, a thermodynamic model must be established based on the heat transfer pinch point to study the influence of external conditions such as cooling water inlet and outlet temperatures and ambient temperature.
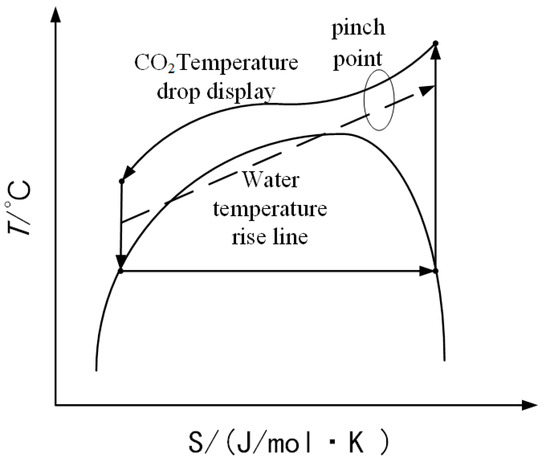
Figure 5.
Schematic diagram of the pinch point of the gas cooler.
Being different from the conventional thermodynamic model, the model based on the pinch point is that the working fluid outlet temperature of the gas cooler is taken as an unknown quantity. Combined with the conservation of energy, the CO2 temperature of the gas cooling outlet is calculated according to the pinch point temperature difference and the cooling water inlet and outlet temperature. Before building a thermodynamic model, the following assumptions are first made:
- (1)
- The CO2 vapor entering the compressor is saturated gas;
- (2)
- The compression process of the compressor is an adiabatic non-isentropic process;
- (3)
- The gas leaving the gas–liquid separator and the evaporator is in a saturated gaseous state;
- (4)
- During the vapor injection process, the vapor injection pressure is equal to the CO2 working medium pressure after the compression of the first stage of the compressor;
- (5)
- The CO2 working medium flows in a one-dimensional steady state in the ejector, ignoring the kinetic energy of the working fluid in the ejector;
- (6)
- The mixing process in the ejector is an isobaric mixing process, and its mixing pressure is 0.03 MPa lower than the evaporation pressure of the cycle 9;
- (7)
- The flow loss and pressure drop of the CO2 working medium in the gas cooler, subcooler, evaporator, and pipeline are ignored.
3.1. TCIEJ Thermodynamic Model Based on Pinch Points
In TCIEJ, it is assumed that the mass flow rate of the working fluid, the refrigeration fluid, the vapor injection fluid, the cooling water, and the air side fluid are m1, m2, m3, mw, and ma. The numeric subscript of the enthalpy value h represents the corresponding state point in the enthalpy diagram, and the number subscript followed by s represents the corresponding state point after the isentropic process.
3.1.1. Compressor Model
The compressor consumes as much power as follows:
3.1.2. Gas Cooler
In the gas cooler, the heat absorption of the cooling water is equal to the heat release of the CO2 working fluid. The equation is as follows:
3.1.3. Subcooler
The heat exchange of the two streams in the subcooler is equal, and the equation is as follows:
3.1.4. Ejector Model
The ejection coefficient μ of the ejector is defined as the mass flow ratio of the working fluid and the refrigeration fluid. The calculation formula of μ is as follows:
The process in the main nozzle is an adiabatic process, and the specific enthalpy of the working fluid at the outlet is calculated as follows:
In the formula, ηmn is the isentropic efficiency of the main nozzle.
The process in the secondary nozzle is an adiabatic process, and the specific enthalpy of the refrigeration fluid at the outlet is calculated as follows:
In the formula, ηsn is the isentropic efficiency of the secondary nozzle.
The mixing process of the mixing section is an isobaric process. The specific enthalpy of a mixed fluid at the outlet is calculated as follows:
In the formula, u10 is the fluid velocity at the outlet of the mixing section, m/s.
In the diffuse section of the ejector, the kinetic energy of the working fluid is converted back into pressure energy, and its specific enthalpy at the outlet of the diffuser section is calculated as follows:
According to the efficiency of the diffused section, the specific enthalpy of the isentropic process of the fluid at the ejector outlet is calculated as follows:
In the formula, ηd is the isentropic efficiency of the diffused section of the ejector.
During operation, the injection coefficient of the ejector meets the relationship between the dryness at the outlet as follows [21]:
In the formula, X11 represents the dryness at the ejector outlet.
3.1.5. Throttle Valves
The enthalpy values of working fluid before and after retention are equal, and the thermodynamic models of throttle valve 1 and throttle valve 2 are as follows:
3.1.6. Evaporators
In the evaporator, the heat dissipation of the air is equal to the heat absorption of the working fluid being initiated, and the equation is as follows:
3.1.7. The System Performance Index
As an important parameter for evaluating system performance, the heating COP calculation formula is as follows:
The thermodynamic model of the other three cycles is basically the same as that of TCIEJ, simply removing the corresponding component model on the basis of the TCIEJ model. It is important to note that the compressor power consumption in the TCEX cycle needs to subtract the work recovered by the expander(Wcom − Wex). The thermodynamic model of the expander in TCEJ is calculated as follows:
3.2. Calculation Conditions and Processes
Referring to the existing literature, the isentropic efficiency of the main nozzle of the ejector ηmn = 0.8, the isthenic efficiency of the secondary nozzle ηsn = 0.8, and the isentropic efficiency of the diffused section ηd = 0.8 [17,22]. The vapor injection pressure is calculated from the geometric average of the high pressure and the evaporation pressure [23], that is, Ps = (Pe* × Pk)0.5, (where Pe is the evaporation pressure, and Pk is the high pressure). In the TCEX simulation calculation process, the isentropic efficiency of the expander ηex = 0.6. In the simulation calculation of all cycles, the mass flow rate m1 = 1 kg/s is taken, and the isentropic efficiency of the compressor is calculated from the formula ηcom = 1.003 − 0.121 × (Po/Pi) (where Po is the compressor outlet pressure, and Pi is the compressor inlet pressure) [24].
In TCIJ, the temperature difference in the evaporator pinch point (i.e., T14 − T18) is 5 °C, the temperature difference between the inlet and outlet of the air side (i.e., T18 − T19) is 10 °C, the pinch point temperature difference in the gas cooler ΔTp = 5 °C, and the pinch point temperature difference in the subcooler (i.e., T8 − T7) is also 5 °C. Other cycles are assumed to be the same as those of TCIEJ’s evaporator, gas cooler, and subcooler. The refpropm physical software database is invoked using C++ language programming, and relevant programs for simulation calculation are written. In the simulation calculation of TCIJ, it is necessary to meet the set conditions through two iterations during the simulation process, and the calculation flow chart is shown in Figure 6.
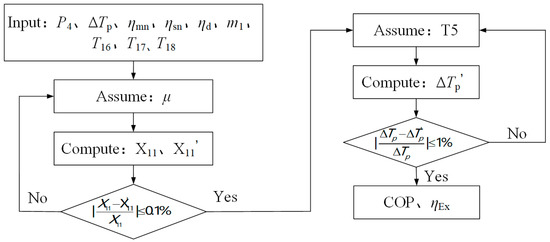
Figure 6.
TCIEJ’s system calculation flow chart.
4. Results and Analysis
The given ambient temperature (inlet temperature on the air side in the evaporator) is −15 °C, the cooling water inlet temperature is 25 °C, and the cooling water outlet temperature is 60 °C. When studying the effects of different parameters, it is sufficient to change the relevant parameters.
4.1. Effect of High Pressure
As seen from Figure 7, with the increase in high pressure, the CO2 temperature at the outlet of the gas cooler first decreases rapidly and then remains unchanged at 30 °C. When the outlet temperature of CO2 in the gas cooler is first reduced to 30 °C, the corresponding high pressure is defined as the critical high pressure. When the high pressure is lower than the critical high pressure, the temperature difference between the outlet temperature of CO2 in the gas cooler and cooling water inlet temperature (cold junction temperature difference) is greater than 5 °C, and the heat transfer pinch point is located inside the gas cooler. When the high pressure exceeds the critical high pressure, the outlet temperature of CO2 in the gas cooler is reduced to 30 °C, and the cold junction temperature difference is equal to 5 °C. At this time, the heat transfer pinch point is moved to the cold end of the gas cooler, and the outlet temperature of CO2 in the gas cooler will not continue to decrease due to the limitation of the heat transfer pinch point.
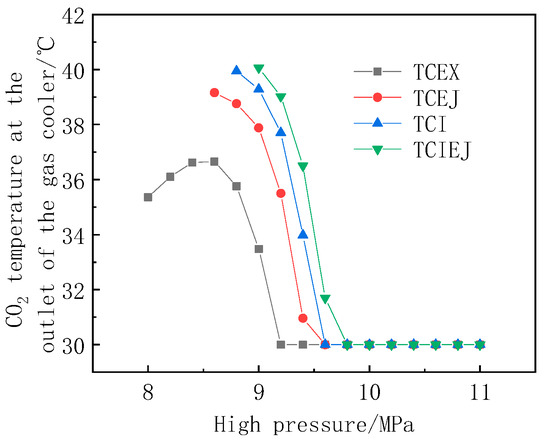
Figure 7.
Change in CO2 temperature at the outlet of the gas cooler with high pressure.
Figure 8 shows the trend of compressor discharge temperature as a function of high pressure for the four cycles. With the increase in high pressure, the exhaust temperature of the compressor in all four cycles increases rapidly. TCEX has the highest compressor exhaust temperature, and the exhaust temperature of TCEJ and TCI are significantly reduced, which indicates that the introduction of ejectors or the use of vapor injection technology can effectively reduce the compressor exhaust temperature. TCIEJ further introduces an ejector based on the TCI, so the exhaust temperature is the lowest. And the exhaust temperature can be controlled at 100 °C even if the high pressure reaches 11.0 MPa. The minimum high pressures of TCEJ, TCI, and TCIEJ that can operate normally are about 8.6 MPa, 8.8 MPa, and 8.9 MPa. When considering the cooling water inlet and outlet temperatures, the high pressure is lower than the respective minimum value, the compressor exhaust temperature drops to about 65 °C. Limiting the pinch point temperature, the outlet temperature of the cooling water will not reach 60 °C, so TCEJ, TCI, and TCIEJ have their own minimum operating high pressure.
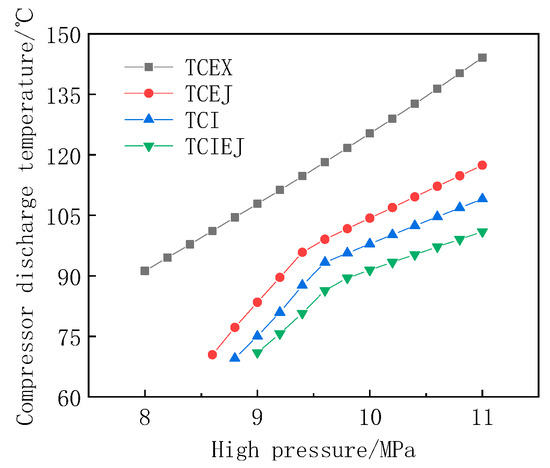
Figure 8.
Variation in compressor discharge temperature with high pressure.
Figure 9 shows the trend of the heating COP of four cycles with high pressure. With the increase in high pressure, the heating COP of the four cycles first increases rapidly, reaches their respective peaks, and then begins to decrease. There is an optimal high pressure that makes heating COP reach the maximum. This is consistent with the trend of Bai’s study [16,17], and the COP value under the same working conditions is also basically consistent. When the high pressure is lower than the critical high pressure, with the increase in high pressure, the compressor exhaust temperature increases, and the CO2 temperature at the outlet of the gas cooler decreases, so the heat release of CO2 in the gas cooler increases. And the compressor pressure ratio increases, the compressor isotropy efficiency decreases, and the compressor power consumption increases. At this time, the increment of heat generation is greater than the increment of compressor power consumption, so the system heating COP will increase rapidly. After reaching the critical high pressure, with the increase in high pressure, the heating CO2 temperature at the outlet of the gas cooler is kept unchanged at 30 °C, resulting in an increase in heat production that is less than the increase in the power consumption of the compressor, so the system heating COP begins to gradually decrease.
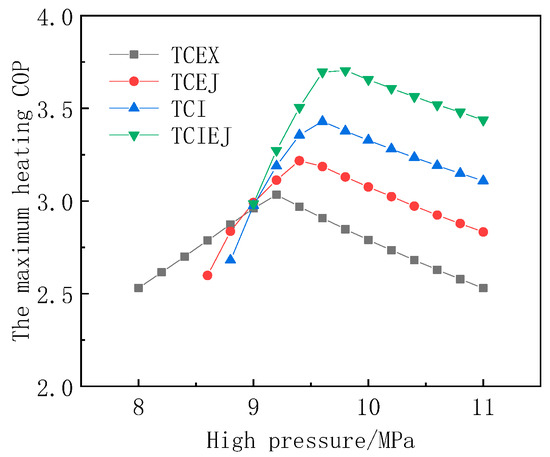
Figure 9.
The maximum heating COP change with high pressure.
Therefore, the critical high pressure is the optimal high pressure, and the peak of heating COP is a compromise between the increase in heat production and the increase in the power consumption of the compressor. Under the given simulation conditions, TCIEJ has the best system performance at optimal high pressure, with a heating COP of about 3.70, and the maximum heating COP of TCEX, TCEJ, and TCI is about 3.03, 3.22, and 3.43. The maximum heating COP of TCIEJ increased by about 20.5%, 14.9%, and 7.9% compared to the other three cycles. When the high pressure is greater than 9.0 MPa, the performance of TCEJ is better than that of TCEX. This is because when the ambient temperature is low, the compressor pressure ratio is relatively large, resulting in a greatly reduced compressor efficiency. But the introduction of the ejector increases the suction pressure of the compressor and reduces the compressor pressure ratio. Therefore, the compressor performance is improved, and the cycle performance is improved.
4.2. Influence of Ambient Temperature
Figure 10 shows the trend of optimal high pressure with ambient temperature for the four cycles. Considering the temperatures of the inlet and outlet of the cooling water and the temperature difference in the pinch point, the optimal high pressure increases with the increase in the ambient temperature. Among them, the optimal high pressure of TCIEJ is the largest because the introduction of vapor injection technology and ejector reduces the compressor exhaust temperature. In order to meet the demand for 60 °C effluent, higher pressure is required to increase the compressor discharge temperature, so the optimal high pressure of TCIEJ is relatively high.
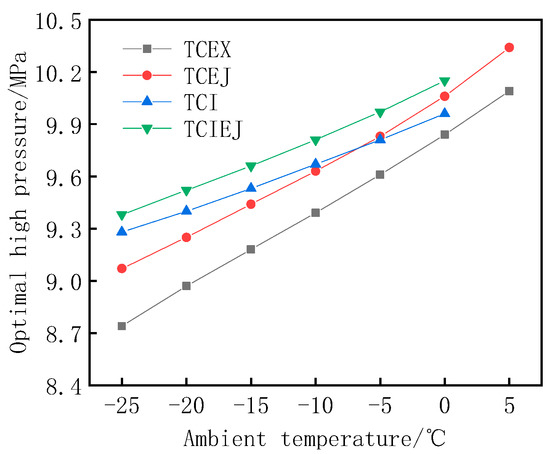
Figure 10.
The optimal high pressure of the system changes with the ambient temperature.
When the ambient temperature is −25 °C, the optimal high pressure of TCIEJ is 9.38 MPa, which is 7.3% higher than that of TCEX of 8.74 MPa. The optimal high pressures of TCEJ and TCI at an ambient temperature of −25 °C are 9.07 MPa and 9.28 MPa, respectively, which are 3.8% and 6.2% higher than TCEX. As the ambient temperature gradually increases, the optimal high pressure of TCEX and TCEJ rises faster than that of TCI and TCIEJ, and when the ambient temperature reaches −5 °C, the optimal high pressure of TCEJ gradually exceeds TCI.
Figure 11 shows the trend of compressor discharge temperature as a function of ambient temperature when the system is operating at the optimal high pressure corresponding to each ambient temperature. The compressor exhaust temperature of all four systems decreases as the ambient temperature increases. And this is consistent with the trend of Li’s study, and the values are basically consistent. Among them, TCEX has the highest compressor exhaust temperature; when the ambient temperature is −25 °C, the exhaust temperature is as high as 150 °C. Due to the introduction of injectors in TCEJ, the exhaust temperature is reduced to about 130 °C; The advantage of the vapor injection technology in TCI is greater, and the exhaust temperature is reduced to about 105 °C. TCIEJ combines the advantages of vapor injection technology and ejectors, so the exhaust temperature is the lowest, which is reduced to about 100 °C, about 33.3% lower than that of TCEX.
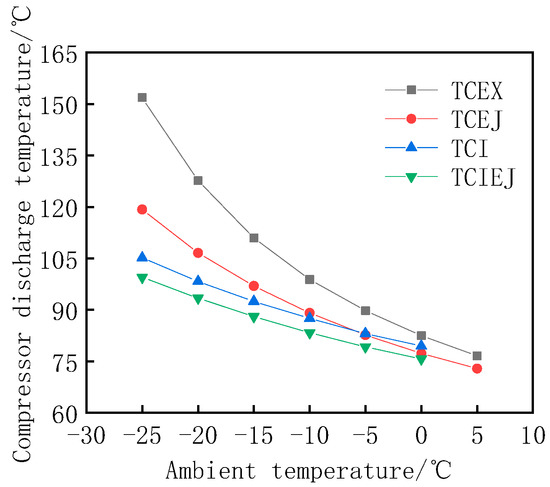
Figure 11.
Variation in compressor discharge temperature with ambient temperature.
With the gradual increase in ambient temperature, the compressor exhaust temperature of TCEX decreases rapidly, and the gap of exhaust temperature with the other three cycles gradually decreases. When the ambient temperature rises to 0 °C, the gap between the compressor exhaust temperature of the four cycles is only 7 °C. Due to the vapor injection of the compressor in TCI and TCIEJ, the compressor exhaust temperature is effectively reduced, and when the ambient temperature reaches 0 °C, the compressor exhaust temperature is too low. This time, the cooling water outlet temperature cannot reach 60 °C, and the system cannot operate normally. Therefore, the vapor injection technology is more suitable for low-temperature environments, which can effectively reduce the compressor exhaust temperature and improve the performance of the system in cold environments.
From Figure 12, it can be seen that the maximum heating COP of the four cycles at different ambient temperatures gradually increases with the increase in ambient temperature. Among the four heat pump cycles, TCIEJ has the best system performance and has a large advantage at different ambient temperatures, with a heating COP of 3.13 even at −25 °C. When the ambient temperature is low, TCI benefits from the advantages of vapor injection technology, and the performance is significantly better than TCEJ and TCEX, among which TCEX has the lowest performance. When the ambient temperature is −25 °C, the maximum heating COP of TCI, TCEJ, and TCEX are 2.91, 2.57, and 2.28. With the increase in ambient temperature, the advantages of vapor injection technology in TCI gradually decrease; when the ambient temperature rises to about −2.5 °C, the performance of TCEJ and TCEX gradually exceeds TCI. With the further increase in ambient temperature, the advantages of the expander are more obvious, and the performance of TCEX gradually exceeds TCEJ at about 0 °C.
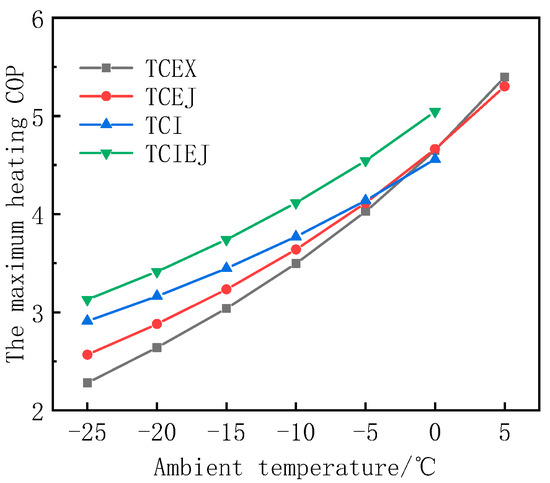
Figure 12.
The maximum heating COP of the system changes with ambient temperature.
4.3. Effect of TCIEJ Vapor Injection Pressure
Figure 13 illustrates the trend of the system heating COP with vapor injection pressure under different high pressures. It can be seen from Figure 13 that with the gradual increase in the vapor injection pressure, the system heating COP shows a trend of first increasing and then decreasing. There is an optimal vapor injection pressure that makes the system heating COP the largest, and when the higher the high pressure, the lower the corresponding optimal vapor injection pressure.
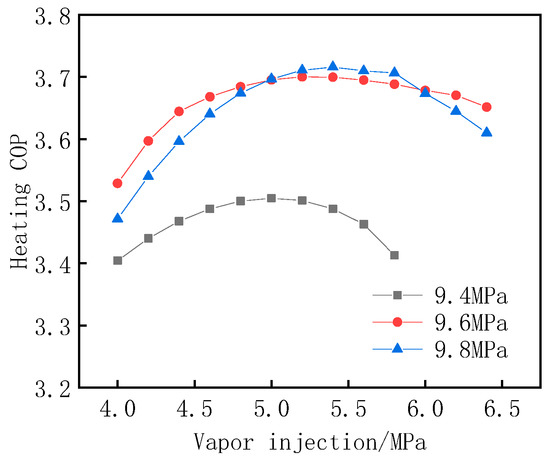
Figure 13.
Change in heating COP with vapor injection pressure.
Figure 14 shows the changing trend of vapor injection pressure with high pressure. The calculated value of the system vapor injection pressure is the geometric average of high pressure and evaporation pressure, and the actual optimal value is the actual optimal vapor injection pressure under each high pressure obtained via intermediate pressure iteration. It can be seen from Figure 14 that when the high pressure is high or low, the optimal vapor injection pressure calculated by the formula is quite different from the actual optimal vapor injection pressure. When the high pressure is 9.0 MPa, the calculated value is 13.0% higher than the actual optimal value. It can be seen from Figure 9 that under the given simulation conditions, the optimal high pressure is between 9.6 and 9.8 MPa, and the average gap between the calculated value and the actual optimal value is only about 1.4%.
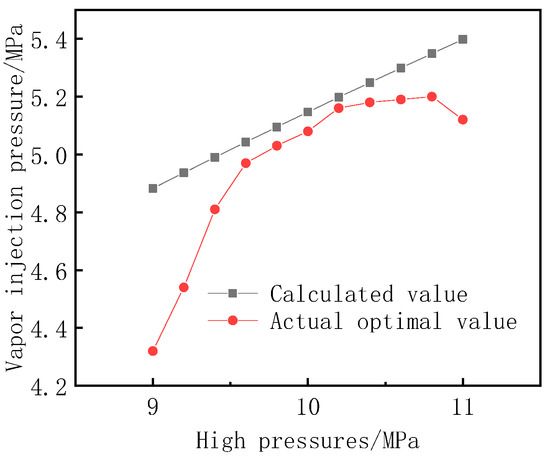
Figure 14.
Change in vapor injection pressure with high pressure.
Figure 15 shows the variation trend of the calculated value and the actual optimal value of the system heating COP with high pressure. It can be seen from the figure that the calculated value of heating COP and the actual optimal value show a trend of first increasing and then decreasing. And the gap between the two values is not large, and the average gap is only 0.4% when the high-pressure changes between 9.0 and 11.0 MPa. When the high pressure is 9.0 MPa, the heating COP calculated by the formula is 2.5% lower than the actual optimal value. Near the optimal high pressure (9.6~9.8 MPa), the average difference is only 0.1%, so it is very good to use the geometric mean of high pressure and evaporation pressure as the optimal vapor injection pressure of the system.
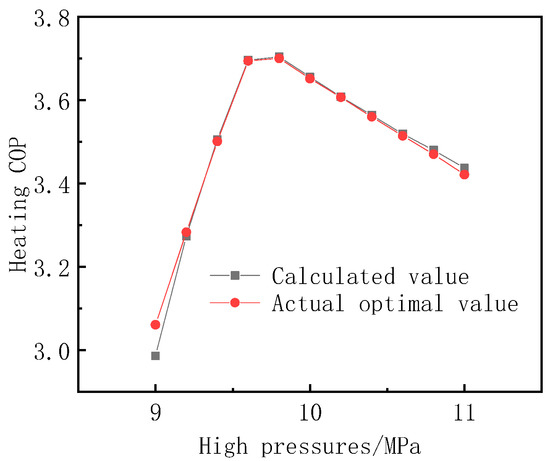
Figure 15.
Heating COP as a function of high pressure.
4.4. Influence of Cooling Water Inlet and Outlet Temperature for TCIEJ
Figure 16 shows the trend of TCIEJ’s optimal high pressure at different cooling water inlet temperatures with cooling water inlet temperatures. It can be seen from the figure that the corresponding optimal high pressure increases as the cooling water inlet temperature increases. This is because the temperature of the cooling water inlet increases, and the outlet temperature of CO2 in the gas cooler continues to rise, resulting in a decrease in the heat release of the gas cooler. In order to meet the temperature demand of domestic hot water, it is necessary to make up for the loss of heat release via a higher compressor exhaust temperature. So, the optimal high pressure continues to increase. When the cooling water inlet temperature increases from 15 °C to 30 °C, the optimal high pressure increases from 9.21 MPa to 9.91 MPa, increasing by about 7.6%.
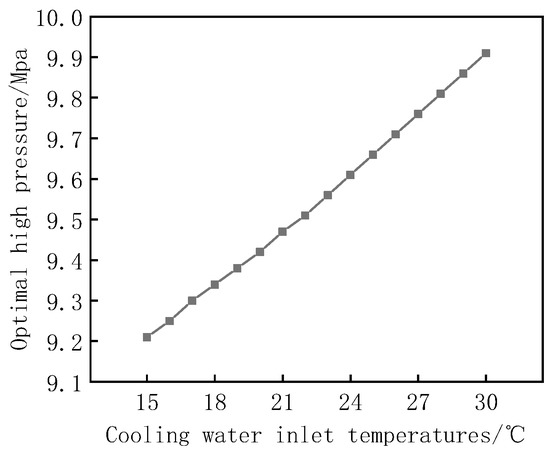
Figure 16.
Variation in optimal high pressure with cooling water inlet temperature.
Figure 17 shows the trend of maximum heating COP with cooling water inlet temperature when TCIEJ operates under the optimal high pressure corresponding to different cooling water inlet temperatures. It can be seen from the figure that the maximum heating COP corresponding to each cooling water inlet temperature decreases with the increase in the inlet temperature of the cooling water. This is because the cooling water inlet temperature rises, and the outlet temperature of CO2 in the gas cooler is constantly increased due to the limitation of the heat exchange pinch point, so the maximum heating COP of the system is constantly decreasing. When the cooling water inlet temperature is increased from 15 °C to 30 °C, the maximum heating COP of the system drops from 4.14 to 3.50, which is reduced by about 15.5%. It can be seen that when the cooling water outlet temperature is constant, reducing the cooling water inlet temperature can improve the system performance but, at the same time, increase the power consumption of the system.
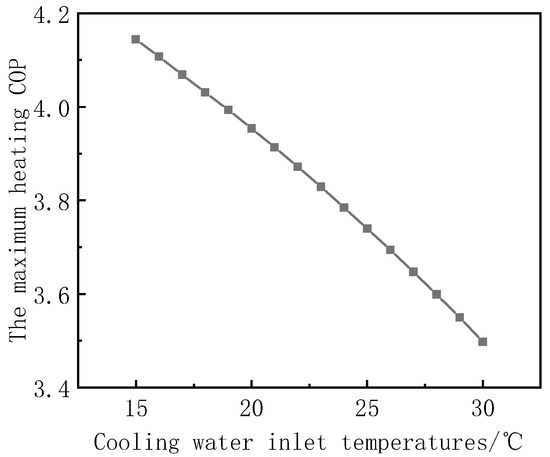
Figure 17.
Change in the maximum heating COP with cooling water inlet temperature.
Figure 18 depicts the trend of TCIEJ’s optimal high pressure at different cooling water outlet temperatures as a function of cooling water outlet temperature. It can be seen from Figure 18 that the corresponding optimal high pressure increases as the cooling water outlet temperature increases. When the outlet temperature of the cooling water rises, it is limited by the pinch point and needs to be increased by increasing the compressor exhaust temperature to maintain normal operation, so the optimal high pressure will increase. When the outlet temperature of the cooling water is increased from 45 °C to 60 °C, the optimal high pressure increases from 8.48 MPa to 9.66 MPa, an increase of about 13.69%.
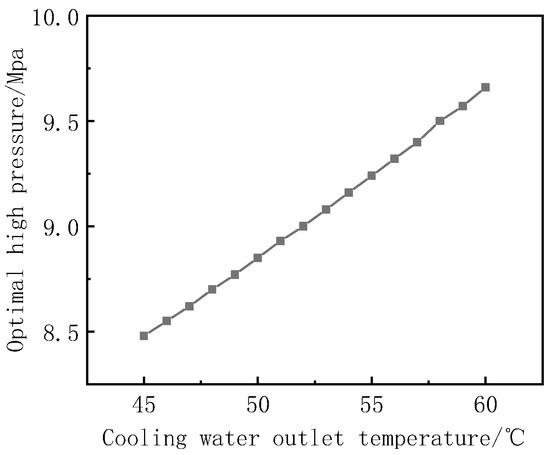
Figure 18.
Change in optimal high pressure with cooling water outlet temperature.
Figure 19 shows the trend of the maximum heating COP with the outlet temperature of the cooling water when TCIEJ is operating under the optimal high pressure corresponding to different cooling water outlet temperatures. It can be seen from Figure 19 that the maximum heating COP corresponding to the cooling water outlet temperature decreases with the increase in the cooling water inlet temperature. This is because the temperature of the cooling water outlet increases, the optimal high pressure continues to increase, and the compressor power consumption and the gas cooler heat release are increased. And the compressor power consumption increases faster, so the maximum heating COP of the system will decrease. When the cooling water outlet temperature increased from 45 °C to 60 °C, the maximum heating COP of the system decreased from 4.08 to 3.74, a reduction of about 8.3%. It can be seen that when the cooling water inlet temperature remains unchanged, setting a lower outlet temperature under the premise of meeting the demand for domestic hot water can effectively improve the system’s energy and save electric energy.
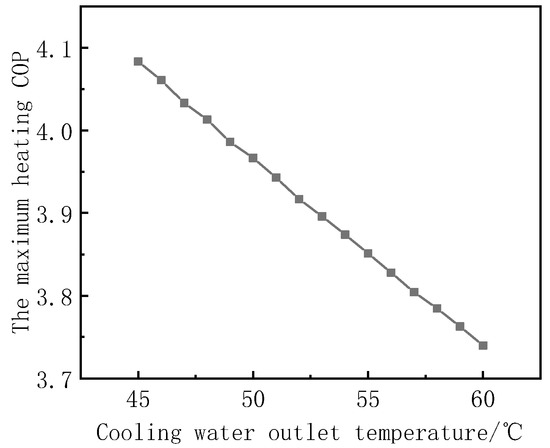
Figure 19.
Variation in the maximum heating COP with cooling water outlet temperature.
4.5. TCIEJ’s Optimal High Pressure
If the system is guaranteed to operate at optimal high pressure, the system performance can be optimized, so it is necessary to explore the influence of each factor on the optimal high pressure of the system. Taking the TCIEJ thermodynamic model based on pinch point as an example, the change in the cooling water inlet and outlet temperatures will affect the outlet temperature of CO2 in the gas cooler and further affect the optimal high pressure. Changes in ambient temperature affect parameters such as evaporation temperature, intermediate pressure, vapor injection temperature, and compressor entropy efficiency, which then affect the optimal high pressure. Generally, the inlet water temperature on the user side is a fixed value, so it focuses on exploring the influence of the change in cooling water outlet temperature and ambient temperature on the optimal high pressure of TCIEJ.
Figure 20 shows the trend of TCIEJ’s optimal high pressure (optimum high pressure at each operating point) with ambient temperature and cooling water outlet temperature. With the increase in ambient temperature and cooling water outlet temperature, the optimal high pressure of the system continues to increase. And the change in cooling water outlet temperature has a greater impact on the optimal high pressure of the system.
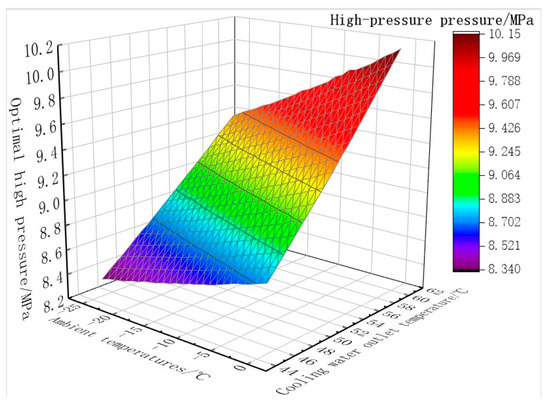
Figure 20.
Variation in optimal high pressure with ambient temperature and cooling water outlet temperature.
Based on the data in Figure 20, the correlation between the optimal high pressure of TCIEJ and the cooling water outlet temperature and ambient temperature is expressed as follows:
In the formula, Pk is TCIEJ’s optimal high pressure, MPa; te is the ambient temperature, °C; and tw is the outlet temperature of the cooling water, °C.
The applicable conditions of the correlation formula are as follows: ambient temperature is −25~0 °C, and cooling water outlet temperature is 45~60 °C. The R square of the correlation formula is 0.99188, indicating that the fitting degree of the correlation formula is high. The correlation of TCIEJ’s optimal high pressure has a certain reference value for the optimal control of the operating conditions of the system and also has important reference significance for the design of the optimal high pressure of the TCIEJ system.
5. Conclusions
Based on the pinch point, the thermodynamic models of TEX, TCEJ, TCI, and TCIEJ were established, and the high pressure and ambient temperature were theoretically analyzed and calculated. The conclusions obtained were as follows:
- There are optimal high pressures that make the heating COP of the four heat pump systems reach the maximum value, of which TCIEJ has the best performance. The maximum heating COP of TCIEJ at −15 °C is about 3.70, which is about 20.5%, 14.9%, and 7.9% higher than that of TCEX, TCEJ, and TCI.
- With the increase in ambient temperature, the optimal high pressure continues to increase, the corresponding maximum heating COP gradually increases, and the compressor exhaust temperature continues to decrease. TCIEJ’s performance is the best of the four cycles, and the advantage is greater at lower ambient temperatures, with the maximum heating COP reaching 3.13 even at −25 °C ambient temperatures.
- There are optimal vapor injection pressures that make the heating COP maximum, and the higher the high pressure, the lower the corresponding optimal vapor injection pressure. The geometric mean of high pressure and evaporation pressure is a very good choice as the optimal vapor injection pressure of TCIEJ, and the error between the maximum heating COP calculated by geometric mean and the actual maximum heating COP is very small.
- The performance of TCIEJ decreases with the increase in cooling water inlet and outlet temperatures. When the cooling water inlet temperature increased from 15 °C to 30 °C, the maximum heating COP of TCIEJ decreased from 4.14 to 3.50, which was reduced by about 15.5%; When the cooling water outlet temperature increased from 45 °C to 60 °C, the maximum heating COP of TCIEJ decreased from 4.08 to 3.74, which was reduced by about 8.3%.
- With the increase in ambient temperature and cooling water outlet temperature, the optimal high pressure of TCIEJ continues to increase, and the change in cooling water outlet temperature has a greater impact on the optimal high pressure of the system. When the ambient temperature is −25~0 °C, and the cooling water outlet temperature is 45~60 °C, the correlation formula of the optimal high pressure of TCIEJ is Pk = 0.02268* × te + 0.08149 two + 5.01004.
- For the analysis results of this paper, further experimental studies are needed to verify the rationality and accuracy of the results.
Author Contributions
Data curation, J.Y.; writing—original draft preparation, X.Z.; material collection, L.W.; literature collection, Y.H.; data reduction, Y.D. All authors have read and agreed to the published version of the manuscript.
Funding
The authors acknowledge the support by the 2021 Graduate Research and Innovation Project of Tianjin, China under Grant 2021YJSS337, the Science and Technology Commissioner Program of Tianjin, China under Grant 22YDTPJC00020, and the Municipal Education Commission Project of Tianjin, China under Grant 2019KJ113.
Data Availability Statement
Data available on request due to restrictions, e.g., privacy or ethical reasons. The data presented in this study are available on request from the corresponding author.
Conflicts of Interest
The authors declare no conflict of interest.
Nomenclature
| COP | coefficient of performance |
| h | specific enthalpy, kJ/kg |
| m1 | motive fluid mass flow rate, kg/s |
| m2 | supplementary gas mass flow rate, kg/s |
| m3 | refrigeration mass flow rate, kg/s |
| mw | cooling water mass flow rate, kg/s |
| ma | air mass flow rate, kg/s |
| Qh | heating capacity, kW |
| Qc | refrigeration capacity, kW |
| u10 | fluid velocity at the outlet of the mixing section, m/s |
| Wcom | the compressor consumes power. |
| Wex | the expander recovery work |
| X11 | dryness of ejector outlet |
| Greek symbols | |
| μ | ejection coefficient |
| ηmn | the isentropic efficiency of the main nozzle |
| ηsn | the isentropic efficiency of the secondary nozzle. |
| ηd | isentropic efficiency of the diffused section of the ejector |
References
- Gustav, L. Revival of carbon dioxide as a refrigerant. Int. J. Refrig. 1994, 17, 292–301. [Google Scholar]
- Ji, W.; Martin, B.; Michael, E. A comprehensive review and analysis on CO2 heat pump water heaters. Energy Convers. Manag. X 2022, 15, 100277. [Google Scholar]
- Paniagua, L.; Álvaro, J.; Martín, R.; Fernández, G.; Carlier, N. Comparison of Transcritical CO2 and Conventional Refrigerant Heat Pump Water Heaters for Domestic Applications. Energies 2019, 12, 479. [Google Scholar] [CrossRef]
- Wang, D.; Yu, B.; Hu, J.; Chen, L.; Shi, J.; Chen, J. Heating performance characteristics of CO2 heat pump system for electrical vehicle in a cold climate. Int. J. Refrig. 2018, 85, 27–41. [Google Scholar] [CrossRef]
- Ferrara, G.; Ferrari, L.; Fiaschi, D.; Galoppi, G.; Karellas, S.; Secchi, R.; Tempesti, D. Energy recovery by means of a radial piston expander in a CO2 refrigeration system. Int. J. Refrig. 2016, 72, 147–155. [Google Scholar] [CrossRef]
- Liu, F.; Groll, E.A.; Ren, J. Comprehensive experimental performance analyses of an ejector expansion transcritical CO2 system. Appl. Therm. Eng. 2016, 98, 1061–1069. [Google Scholar] [CrossRef]
- Cao, F.; Wang, Y.; Ye, Z. Theoretical analysis of internal heat exchanger in transcritical CO2 heat pump systems and its experimental verification-ScienceDirect. Int. J. Refrig. 2019, 106, 506–516. [Google Scholar] [CrossRef]
- Zhu, Y.; Huang, Y.; Li, C.; Zhang, F.; Jiang, P.-X. Experimental investigation on the performance of transcritical CO2 ejector–expansion heat pump water heater system. Energy Convers. Manag. 2018, 167, 147–155. [Google Scholar] [CrossRef]
- Wang, Y.; Yin, Y.; Cao, F. Comprehensive evaluation of the transcritical CO2 ejector-expansion heat pump water heater. Int. J. Refrig. 2022, 145, 276–289. [Google Scholar] [CrossRef]
- Heo, J.; Min, W.J.; Kim, Y. Effects of flash tank vapor injection on the heating performance of an inverter-driven heat pump for cold regions. Int. J. Refrig. 2010, 33, 848–855. [Google Scholar] [CrossRef]
- Qi, Y.; Liu, N.; Zhang, Y. Research progress of enhanced make-up technology applied to air source heat pump. J. Refrig. 2015, 36, 74–80. [Google Scholar]
- Baek, C.; Heo, J.; Jung, J.; Cho, H.; Kim, Y. Performance characteristics of a two-stage CO2 heat pump water heater adopting a sub-cooler vapor injection cycle at various operating conditions. Energy 2014, 77, 570–578. [Google Scholar] [CrossRef]
- Baek, C.; Heo, J.; Jung, J.; Lee, E.; Kim, Y. Effects of vapor injection techniques on the heating performance of a CO2 heat pump at low ambient temperatures. Int. J. Refrig. 2014, 43, 26–35. [Google Scholar] [CrossRef]
- Xu, S.; Ma, G. Research on air-source heat pump coupled with economized vapor injection scroll compressor and ejector. Int. J. Refrig. 2011, 34, 1587–1595. [Google Scholar] [CrossRef]
- Xu, S.; Ma, G. Exergy analysis for quasi two-stage compression heat pump system coupled with ejector. Exp. Therm. Fluid Sci. 2011, 35, 700–705. [Google Scholar]
- Bai, T.; Yan, G.; Yu, J. Thermodynamic analysis of intermediate vapor injection heat pump circulation system using ejector to increase efficiency. In Proceedings of the 21st National Conference of Engineering Thermophysics Professional Committee of Higher Education Association, Yangzhou, Jiangsu Province, China; 2015; pp. 2–9. [Google Scholar]
- Bai, T.; Yan, G.; Yu, J. Thermodynamic analyses on an ejector enhanced CO2 transcritical heat pump cycle with vapor-injection. Int. J. Refrig. 2015, 58, 22–34. [Google Scholar] [CrossRef]
- Li, M.; Zhan, H.; Wang, P.; Liu, X.; Li, H. A CO2 transcritical refrigeration system with ejector and economizer. CIESC J. 2021, 72 (Suppl. 1), 146–152. [Google Scholar]
- Chen, Y.G. Pinch point analysis and design considerations of CO2 gas cooler for heat pump water heaters. Int. J. Refrig. 2016, 136–146. [Google Scholar] [CrossRef]
- Wang, L.; Liang, X.; Shao, L.; Zhang, C. High pressure control equation of CO2 heat pump hot water system with constraints. J. Refrig. 2018, 39, 20–27. [Google Scholar]
- Li, H.; Cao, F.; Bu, X.; Wang, L.; Wang, X. Performance characteristics of R1234yf ejector-expansion refrigeration cycle. Appl. Energy 2014, 121, 96–103. [Google Scholar] [CrossRef]
- Zhang, Z.Y.; Ma, Y.T.; Wang, H.L.; Li, M.X. Theoretical evaluation on effect of internal heat exchanger in ejector expansion transcritical CO2 refrigeration cycle. Appl. Therm. Eng. 2013, 50, 932–938. [Google Scholar] [CrossRef]
- Yari, M. Performance analysis and optimization of a new two-stage ejector-expansion transcritical CO2 refrigeration cycle. Int. J. Therm. Sci. 2009, 48, 1997–2005. [Google Scholar] [CrossRef]
- Liao, S.M.; Zhao, T.S.; Jakobsen, A. A correlation of optimal heat rejection pressures in transcritical carbon dioxide cycles. Appl. Therm. Eng. 2000, 20, 831–841. [Google Scholar] [CrossRef]


Disclaimer/Publisher’s Note: The statements, opinions and data contained in all publications are solely those of the individual author(s) and contributor(s) and not of MDPI and/or the editor(s). MDPI and/or the editor(s) disclaim responsibility for any injury to people or property resulting from any ideas, methods, instructions or products referred to in the content. |
© 2023 by the authors. Licensee MDPI, Basel, Switzerland. This article is an open access article distributed under the terms and conditions of the Creative Commons Attribution (CC BY) license (https://creativecommons.org/licenses/by/4.0/).