Abstract
In professional practice, the design and verification of Reinforced Concrete (RC) and Prestressed Reinforced Concrete (PRC) structures are performed using a simplified calculation provided by the Eurocodes that limits resistance but that also includes a certain level of structural safety. Some aspects that directly affect the simplified methods involve the use of linear constitutive laws of materials. The use of non-linear laws is evident in the exploitation of reservoirs of strength and deformations of plastic materials in the Ultimate Limit State. The purpose of this research is to evaluate the increase in resistance to bending actions during the plasticization of the beam of existing bridges to support the decision-making process of the engineer in the assessment of existing structures. To achieve this, two codes (MEG Ductility, MEG Fiber Sections) were developed to provide the moment–curvature diagram of RC and PRC sections using non-linear bonds, and in this paper, the study of RC sections is reported. Furthermore, through a push-down analysis, two RC and PRC viaducts have been analyzed using the moment–curvature characteristics obtained from the realized codes and by varying the non-linear constitutive bonds. The results of this study provide valuable insights into the behavior of RC structures under bending actions and demonstrate the importance of considering non-linear material laws for accurate structural assessments. The findings contribute to the enhancement of the decision-making process of engineers when dealing with existing infrastructures.
1. Introduction
The growth of the economy in postwar Europe led to improved living standards and the need for new infrastructure. The connection between cities and countries was a core aspect that necessitated improvements and renovations; therefore, the network of roads and highways spread quickly.
In parallel, the rise of prestressed concrete in the first half of the 20th century represented an innovative technology that took hold in civil structures. This technology has now wide application in girder bridges, which constitute most of the European road bridges [1,2].
As a result of the number of ordinary and prestressed concrete structures that were built in the 1960s and 1970s, many require routine verification [3,4,5,6] and maintenance for proper compliance with the current Eurocode 2 (EC2) regulations [7].
Therefore, many bridges must be assessed to fulfil the current standards, which have evolved in time, increasing the severity and the loads [8,9,10,11,12]. Often, the economic aspect plays a key role along with structural safety in the decision-making process in the management of existing infrastructures [3,13].
The current standard, based on the EC2 [7] and Italian bridge Guidelines (LG22) [14], contains several simplifications that could lead to the underestimation of the resistance of verified sections, which can be critical to ensuring the operability of a structure.
In some cases, it is possible to refer to calculations that consider the non-linearity of materials to take full advantage of the strength provided by steel and concrete [15].
In the following sections, we analyze the improvement in the resistance achieved by exploiting the non-linearity of materials such as concrete and steel to make use of them in practical civil engineering applications [16]. In doing so, the performance of materials in the plastic field is studied to understand the magnitude of this method and to define the most appropriate methodology to be followed [17].
2. Materials and Methods
Following the current Italian Standards for Construction (NTC2018) [18], referring to the European Eurocode 2 [7] standard on which they are based, the proposed constitutive laws for steel and concrete are analyzed.
2.1. Concrete Law according to the NTC2018 Standard
Macroscopic mechanical properties can be described with homogeneous and iso-tropic models with different tensile—compressive behavior. Therefore, the standard re-ports a constitutive bond treatment in the case of a uniaxial tension state, distinguishing tensile and compressive cases.
The models proposed by the NTC2018 standard in Figure 1 are defined according to the compressive strength fcd and the ultimate deformation εcu.

Figure 1.
NTC 2018 [18] concrete constitutive laws: rectangular–parabolic (a), triangular–parabolic (b) and (c) rectangular “stress-block”.
Specifically, for strength classes of C50/60 and below, the following are assigned:
- εc2 = 0.2%
- εc3 = 0.175%
- εc4 = 0.07%
- εcu = 0.35%
For strength classes above C50/60, the following are assigned:
- εc2 = 0.2% + 0.0085% (fck − 50)0.53
- εc3 = 0.175% + 0.055% [(fck − 50)/40]
- εc4 = 0.2 εcu
- εcu = 0.26% + 3.5% [(90 − fck)/100]4
2.2. Steel Law according to the NTC2018 Standard
Experimental tensile tests on steel denote the elastic behavior up to yield strength, with consecutive plastic phases differing according to the type of steel. In the case of cold-worked steels used for prestressed tendons, shown in Figure 2, once they have passed the elastic limit, there is a hardening branch. In contrast, in heat-treated steel used in ordinary reinforcement, depicted in Figure 3, there is a plastic stage before the hardening behavior. Failure occurs in both cases with prior narrowing of the cross-section.
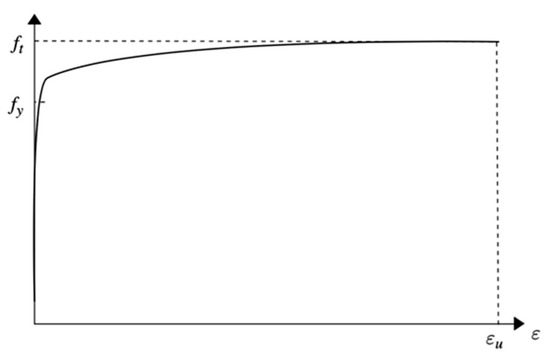
Figure 2.
Cold-worked steel [19].
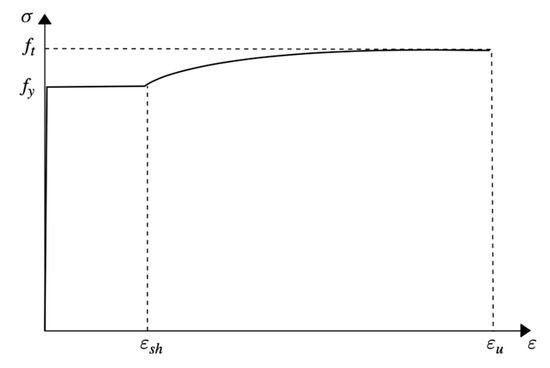
Figure 3.
Heat-worked steel [19].
Steel constitutive law is simplified with bilinear segments, depicting two features of steel: the yielding point (fy-εy) and the rupture point (ft-εu). In the case of steel, the hardening ratio is defined as an index of the hardening capacity, which varies from 1.05 to 1.35, depending on the type of steel [7].
There are basically two constitutive laws of steel given by NTC 2018 Figure 4a,b. Both constitutive laws have identical linear behavior until plasticization; thereafter, the behavior is different.
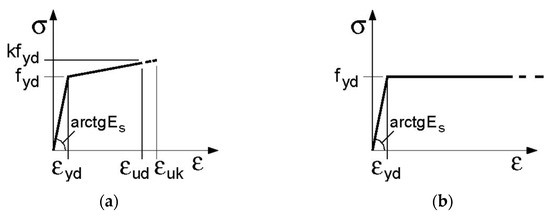
Figure 4.
NTC2018 [18] steel constitutive laws: bilinear with work-hardening (a) and elastic–perfectly plastic indefinite (b).
In the second case, shown in Figure 4b, exceeding the elastic limit results in a perfectly plastic branch.
Regarding the types of steel used in civil construction, NTC 2018 indicates two steel grades: B450A and B450C. Both types must have a minimum yield strength of 450 MPa. The hardening ratio for the two steels:
- k ≥ 1.05 for B450A steel
- 1.15 ≤ k ≤ 1.35 for B450C steel
The standard permits the use of only the second law for ultimate limit state verification. It is known that this approximation reduces the strength provided by steel.
3. Material Non-Linearity
Since studies on materials began, specifically those on concrete and steel, multiple experiments have been performed by various researchers who have contributed, through the publication of these studies in scientific journals and university books, to the expansion of knowledge on the same materials and to the understanding of their non-linear behavior by obtaining constitutive models [20,21,22,23,24,25,26,27].
3.1. Non-Linear Concrete Laws
The first model based on studies and experimental tests that was performed on reinforced concrete beams was that of Bolong and Zhenxiang (1981) [20] Figure 5. This model differs from others in being able to consider contact stresses occurring due to progressive crack closure. It should be noted, however, that the present model was formulated by referring to alternating deformation cycles of nondecreasing amplitude.
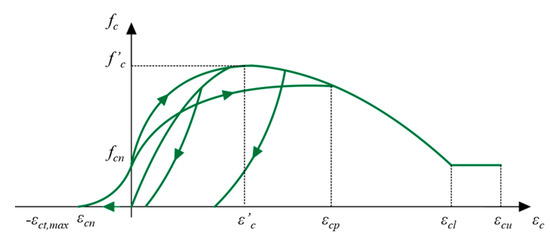
Figure 5.
Bolong and Zhenxiang model [20].
The model has been divided into two main curves called the load curve and the unload curve; their formulations are described in the Bolong and Zhenxiang study.
A very simple model to describe the compressive behavior of concrete is the one presented by Kent and Park, modified by Scott et al. (Kent and Park, 1971; Scott et al., 1982) [21] (Figure 6).
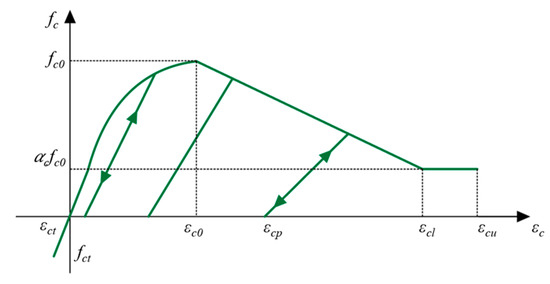
Figure 6.
Kent and Park concrete model [21].
In particular, the relationships that define the monotone envelope curve, regarding compression and traction, are described in the Kent and Park study [21].
Mander et al. (1988) [22] proposed a constitutive bond for rectangular and circular sections subjected to monotonically and cyclically applied loads; this model is shown in Figure 7.
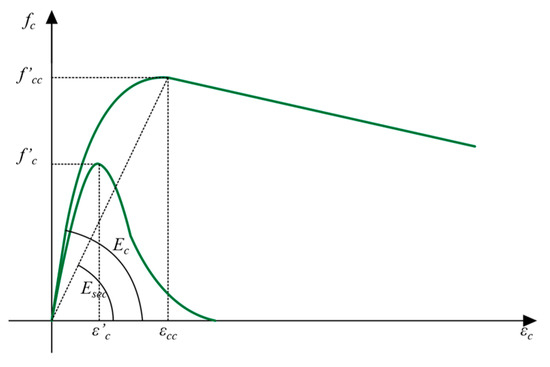
Figure 7.
Mander et al. model [22].
3.2. Non-Linear Steel Laws
In addition to the models proposed by the NTC 2018 standard, such as the elasto-perfectly plastic model and the elasto-plastic model with hardening, various models have been developed by various professors and researchers over the past decades. These models were obtained by tensile tests performed on steel reinforcing bar samples.
The first non-linear steel model was the Menegotto and Pinto model (1973) [23] (Figure 8). This model is based on the Giuffrè and Pinto law (1970) [24] which is a result of studies carried out by Capecchi et al. (1980) [25], Ciampi et al. (1982) [26] and Filippou et al. (1983) [27]. The constitutive law of steel shown in Figure 8 is defined by dimensionless parameters, and their relationships are described in [23].
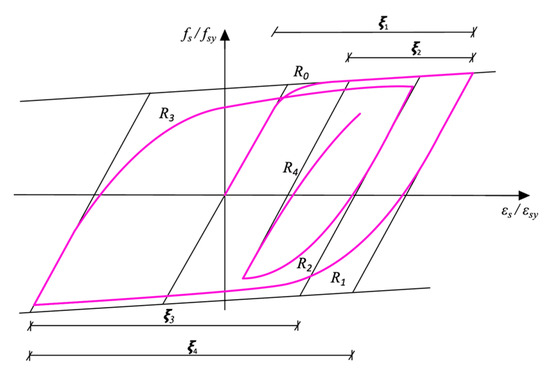
Figure 8.
Menegotto and Pinto model [23].
The second steel constitutive law presented is that of Capecchi et al. (1980) [25], which represents an example of a simplified model that, despite the simplifications adopted, still maintains an excellent degree of accuracy. This model [25], shown in Figure 9, is based on the determination of parameters that define the curves:
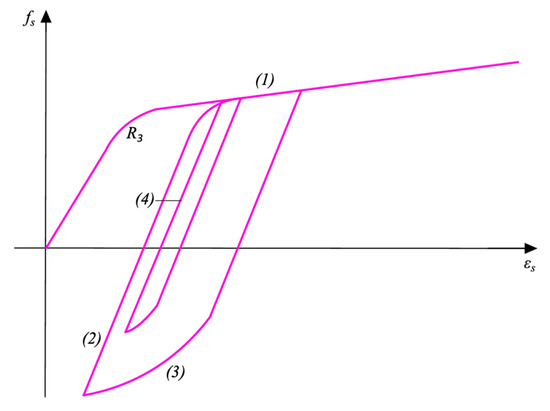
Figure 9.
Capecchi et al. model [25].
- curve (1): skeleton curve, monotonic development curve;
- curve (2): upper curve, descending curve originating from the minimum value of εs;
- curve (3): lower curve, descending curve originating from the maximum value of εs;
- curve (4): current curve, originating from the recent point of load reversal.
3.3. Limitations
However, the use of non-linear constitutive laws for analyses aimed at obtaining the maximum bending resistance offered by the structural element involves several limitations and problems.
In the case of the verification of existing bridges, it is no longer sufficient to derive only geometric and material information from as-builts; instead, in-depth in situ investigations must be carried out. These inspections include, for instance:
- -
- Visual inspections to ascertain the actual state of maintenance of the structure;
- -
- Pacometer investigations aimed at identifying the location, direction and diameter of reinforcing bars;
- -
- Georadar investigations to check the presence and position of prestressing cables;
- -
- Direct tensile tests on ordinary reinforcing steel and harmonic steel to derive the stress–strain diagram or nondestructive surface hardness tests to derive the characteristic strength;
- -
- Uniaxial compression tests on concrete to derive the stress–strain diagram or nondestructive tests such as pull-out, ultrasonic and sclerometric tests (SonReb method) to determine its characteristic strength.
For direct tensile tests, it is not enough to obtain the yield stress and the corresponding deformation, but it is also necessary to obtain the maximum load, the load at failure and the corresponding deformations. The need for more evidence on the structure relates to obtaining a higher level of knowledge about the structure to move from knowledge factors FC = 1.35 to FC = 1.00, according to the LG22 Guidelines. In situ investigations entail higher costs and more time to perform the verifications as well as the need to sometimes limit traffic on the bridge or temporarily close it to perform the tests.
The section is considered to be intact, and this is a limitation, because where the deck has a section with a lack of reinforcement cover or worn reinforcement bars, it is not possible to use non-linear constitutive bonds. As can be seen later in the paper, there are also problems related to computational time.
4. MEG Ductility Code Development
4.1. Basic Assumptions
This software has been created to solve reinforced concrete beams with rectangular and T-shaped cross-sections and to calculate their resistant bending moment in the case of pure bending or the combination of compression and bending. The possibility of considering prestressing reinforcement makes it possible to verify prestressed concrete bridge sections. The code was written in Python using the theoretical formulations taken from Professor G. C. Marano [28].
The possibility of making changes to the code allows the software to be more adaptable and to consider the non-linearity of materials by choosing the parameters that govern the models of concrete and steel. In particular, steel non-linearity is taken into account by the hardening ratio k, in Equation (1).
The main assumptions adopted are:
- There is conservation of plain sections;
- There is a perfect steel–concrete bond;
- The stresses in the concrete and ordinary reinforcement are derived from the constitutive laws of materials;
- The tensile strength of concrete is negligible;
- The yielding moment Myd is equal to the ultimate moment without hardening.
4.2. Code Development
As the code works [29] by section-failure fields, in the case of pure bending, the cross-section is classified depending on the amount of reinforcement, according to the fields in Figure 10, where:
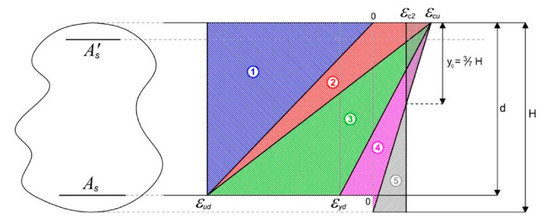
Figure 10.
Failure field for reinforcement concrete sections [28].
- Field 2 represents weakly reinforced cross-sections;
- Field 3 represents a normally reinforced c.s.;
- Field 4 represents a strongly reinforced c.s.
The definition of the current field is achieved by calculation of the mechanical percentage of tensioned and compressed reinforcement in Equations (2) and (3).
Both field limits are obtained by Equations (4) and (5).
The neutral axis (ξ) and the steel stress (σs) are obtained by the specific deformation given in Equation (6).
In the case of bending and compression, the field classification becomes wider due to the different types of failure in compression. The consideration of fields 1 and 5 needs the evaluation of other field limits.
In this case, to take into account the axial load, field limits have been defined. They consider bending behavior by the mechanical percentage of tensioned and compressed reinforcement. This software can also evaluate the section ductility by the curvature ratio in Equation (7).
For a better understanding of the analysis process of this code, the flowchart followed for field 3 in pure bending is shown as an example in Figure 11.
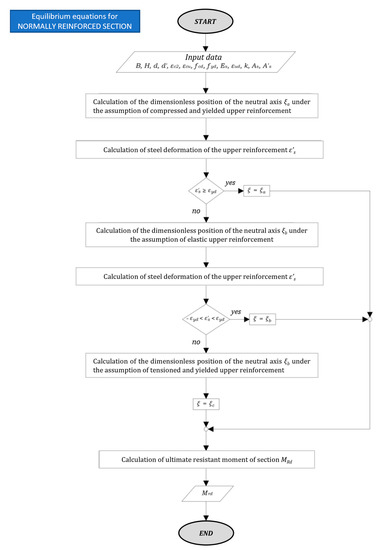
Figure 11.
MEG Ductility workflow followed for field 3 [28].
4.3. User Interface
Upon completion of the code, a user interface was created to make the code usable by users via a desktop application. Figure 12 shows the graphic interface in version 1.0 of the MEG Ductility software.
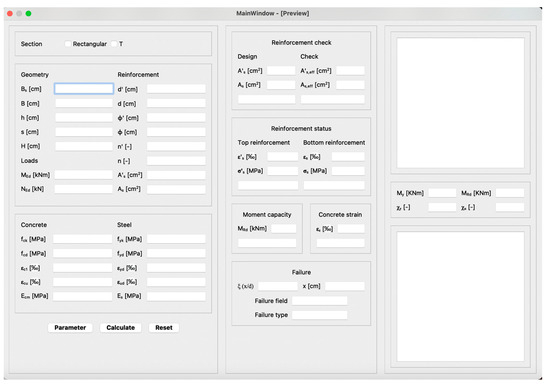
Figure 12.
MEG Ductility software user interface.
4.4. MEG Ductility Code Validation
The validation of the MEG Ductility software is performed by two commercial software packages: VcaSlu software [30] and Biaxial from ReLUIS [31]. To perform the validation, the same materials were used with the same values of ultimate limit parameters for their constitutive laws. Both VcaSlu and Biaxial use a rectangular–parabolic formulation for concrete, whereas for steel, VcaSlu uses a perfectly elastic–plastic constitutive tendency while Biaxial uses a bilinear with hardening one in order to consider steel non-linearity by the hardening ratio.
The validation test is conducted with a rectangular section presenting the geometric and reinforcement data shown in Table 1, and the results of the resistant bending moment and curvature are reported in Table 2 and Figure 13.

Table 1.
Sectional parameters for the rectangular section used to carry the test.

Table 2.
Validation results for the simple bending test.
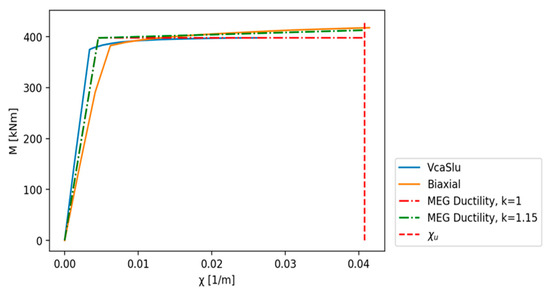
Figure 13.
Comparison between final output results in terms of resistant bending moment.
It can be noticed that for the elastic limit state, the results obtained with the MEG ductility software agree, with the validation software. For the Ultimate Limit State, the resisting bending moment obtained by the Biaxial software presents the same value as the MEG ductility software; thus, it is possible to consider the MEG Ductility software as validated.
5. MEG Fiber Section Code Development
5.1. Code Development
This software, developed in Python, has the feature of solving fiber cross-sections. The fiber method, as shown in Figure 14, involves dividing a section into several sub-elements called “fibers”, which have certain mechanical properties.
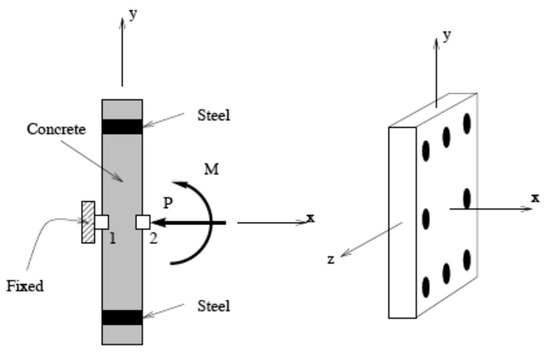
Figure 14.
Zero-length element for fiber section analysis.
Opensees [32], a framework for structural analysis, is used to implement the cross-section verification.
For the development of this software, the main functions inherent to beam elements, loads and the type of analysis performed were used. The possible types of this analysis are in force control (Figure 15) or displacement control (Figure 16). For this type of code, a displacement-controlled analysis was preferred as it allows the behavior of the fibers to be observed even after the critical peak, as depicted in Figure 16.
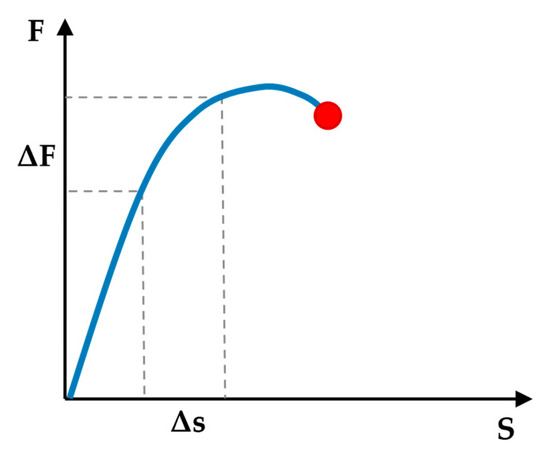
Figure 15.
Force-controlled analysis [17].
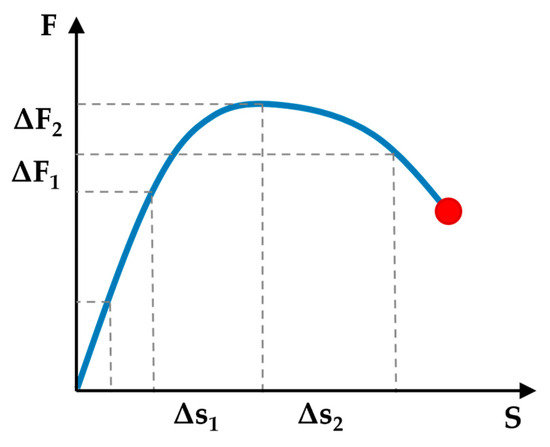
Figure 16.
Displacement-controlled analysis [17].
To make this analysis possible, it was necessary to define an integration method [33,34]. In this specific case, as it was possible to modify the fiber mesh, it was necessary to implement an algorithm that would choose the appropriate integration method for the individual case by trial and error.
Regarding the materials to be assigned to fibers, it is possible to refer to libraries previously developed by several researchers and made available on Opensees. In particular, this code adopts Concrete01 as the concrete law, as shown in Figure 17. For ordinary steel, the ReinforcingSteel law was implemented, and for strands, the Steel01 law was used, as shown in Figure 18 and Figure 19, respectively.
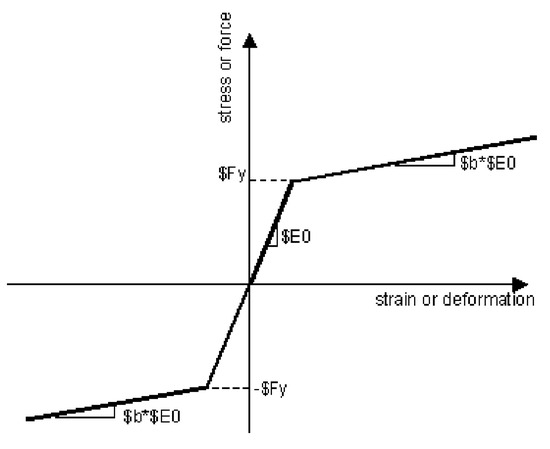
Figure 17.
Concrete01 law [21].
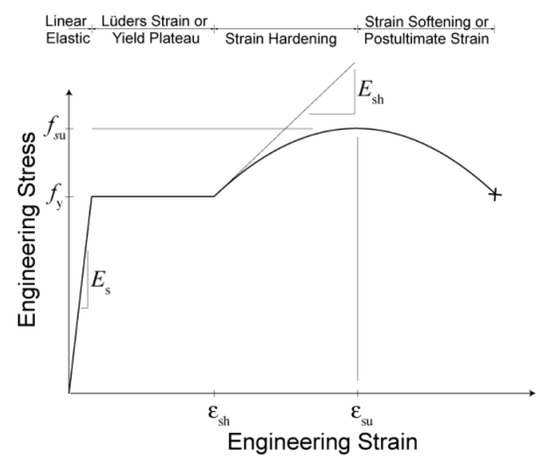
Figure 18.
ReinforcingSteel constitutive law [35].
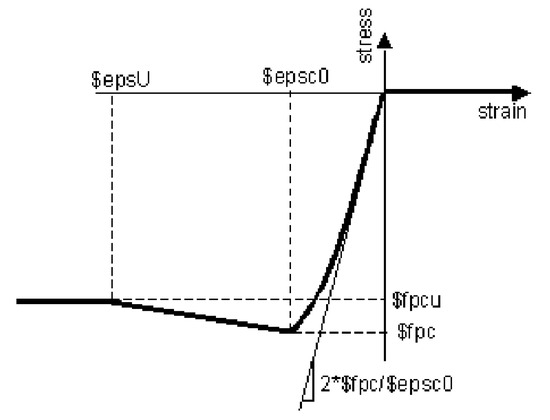
Figure 19.
Steel01 law [36].
5.2. Discussion of Results from the MEG Ductility Software
The output generated by the code as a result of the analysis concerns the stress–strain state of the section during the entire analysis and the momentum–curvature diagram, as shown in the example in Figure 20.
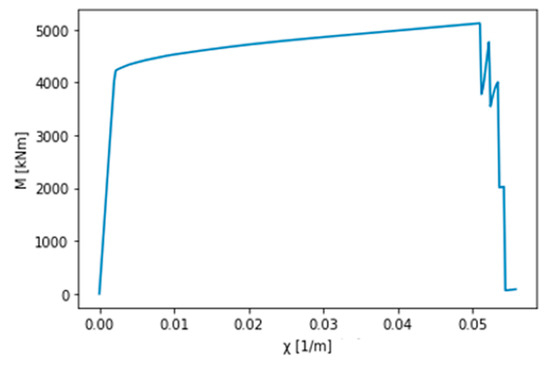
Figure 20.
Example moment–curvature diagram.
5.3. MEG Fiber Section Code Validation
The validation of this code was carried out using the commercial software previously presented during the validation of the MEG Ductility software. The cross-section used is also the same as for the previous validation.
The analysis of the validation section was carried out, and the results are reported in Table 3. Figure 21 shows the comparison between the results obtained with the commercial software and the MEG Fiber Sections code, distinguishing between the constitutive bond of ordinary steel and prestressing steel in order to evaluate the influence of using different material constitutive laws [33] in the overall structural response of the prestressed reinforced concrete deck.

Table 3.
Validation results for the simple bending test.
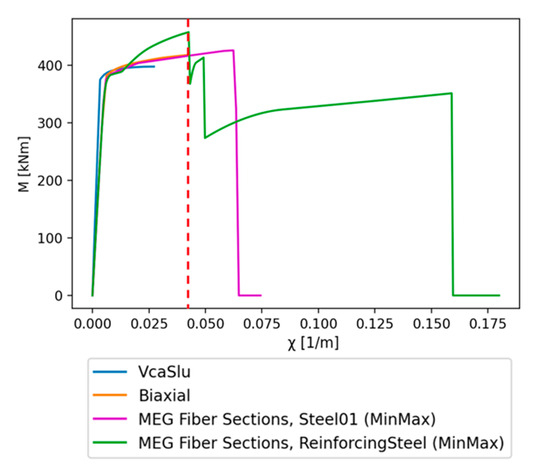
Figure 21.
Bending moment diagram for MEG Fiber Sections software validation.
A closer look at this graph is provided in Figure 22. Zooming in makes it possible to observe how the curves of the different software present similar values of moment and curvature at the elastic limit.
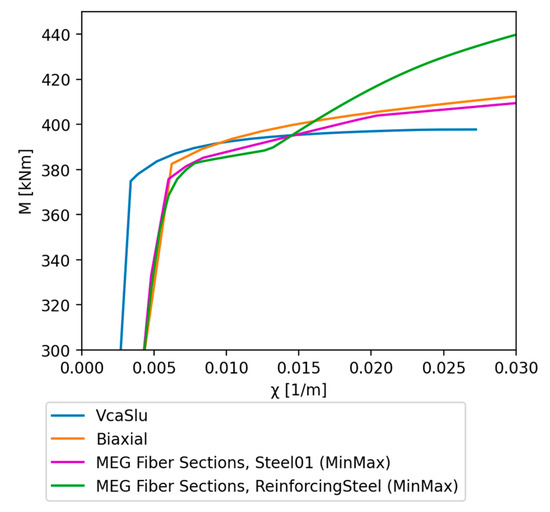
Figure 22.
Bending moment diagram for MEG Fiber Sections software validation shown in Figure 21, zoomed in on the elastic limit section.
The ultimate moment has some variations from the supporting software of around 10–15%. These variations depend strongly on the constitutive bond and the formulations they implement. This dependence is also affected by the ultimate curvatures, which present high values due to the ability of the analysis conducted in displacement control to perceive pressure losses. For the constitutive bond, in Steel01, an ultimate curvature not very distant from that obtained with Biaxial is observed, while for the second constitutive bond, a progression of the response with two load shots is observed until complete collapse.
Following the results obtained, the MEG Fiber Sections software can be considered validated.
6. Bending Analysis
Considering the failure field in Figure 10, an analysis is performed on ten rectangular sections with height H = 60 cm and width B = 30 cm as the mechanics percentage of reinforcement varies: two in field 2 (ω(2) = 0.01–0.03), five in field 3 (ω(3) = 0.06–0.1–0.2–0.3–0.4) and three in field 4 (ω(4) = 0.6–0.7–0.8). In accordance with the constitutive laws implemented on the MEG Ductility software, the non-linearity of the steel is considered by a hardening factor k equal to 1.15.
Once the failure field has been fixed [28], based on the value of the mechanical percentage of tensile reinforcement in Equation (2), the test involves varying the mechanical percentage of compressed reinforcement in Equation (3) from zero to the value of ω.
From the analysis the moment–curvature diagrams, (M-χ) values were obtained containing the moment and curvature values of the plasticization and ultimate limit, as shown in Figure 23, Figure 24, Figure 25 and Figure 26, by varying the mechanical percentage of the tense and compressed reinforcement in Equations (2) and (3).
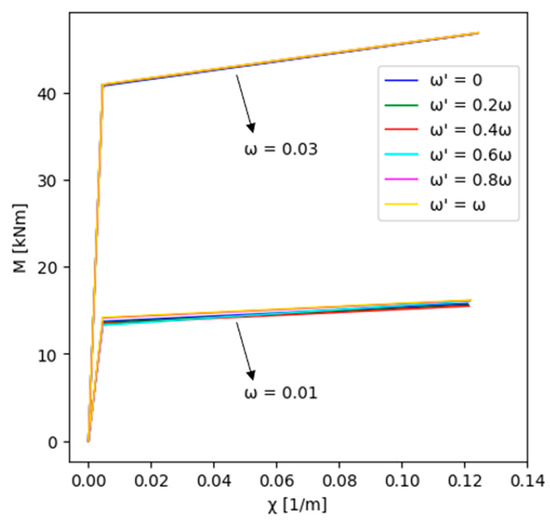
Figure 23.
Moment–curvature diagram sections in field 2.
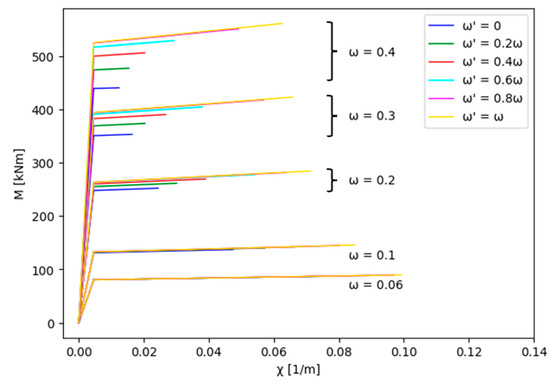
Figure 24.
Moment–curvature diagram sections in field 3.
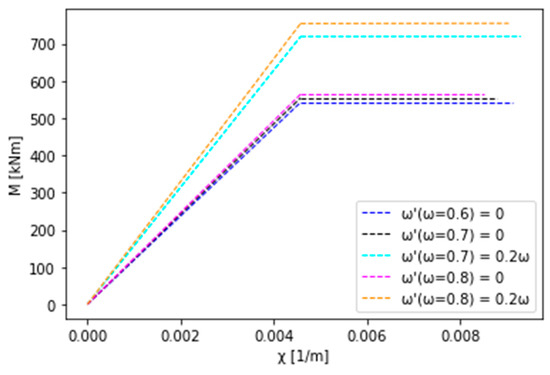
Figure 25.
Moment–curvature diagram sections in field 4.
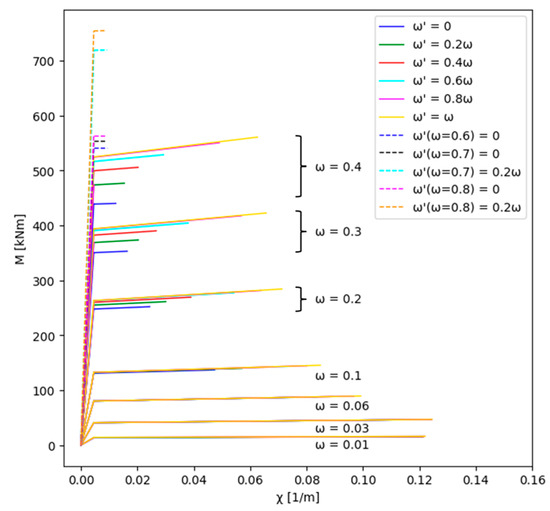
Figure 26.
Moment–curvature diagram comparison.
In the case of sections in field 2 (Figure 23), it is possible to observe a wide ductility; on the other hand, for sections in field 4 (Figure 25), which is characterized by a lower ductility, the ductility can rise as the compressed reinforcement increases. Moreover, the resistant bending moment is greater [37]. The same field is difficult to maintain, as the growth of the compressed reinforcement permits the section to switch to field 3, constraining the tests of this field to a low level of compressed reinforcement. Field 3 (Figure 24) is balanced compared with fields 2 and 4, and it shows great ductility and resistant bending moment due to the optimal amount of reinforcement.
Using Equations (7) and (8) [38], it is possible to compare theoretical ductility, represented by the dashed lines, with the real ductility obtained with the MEG Ductility software, represented by the continuous lines, as shown in Figure 27, which depicts the variation of the reinforcement ratio µx [28] from Equation (9) and the mechanical percentage of tensile reinforcement.
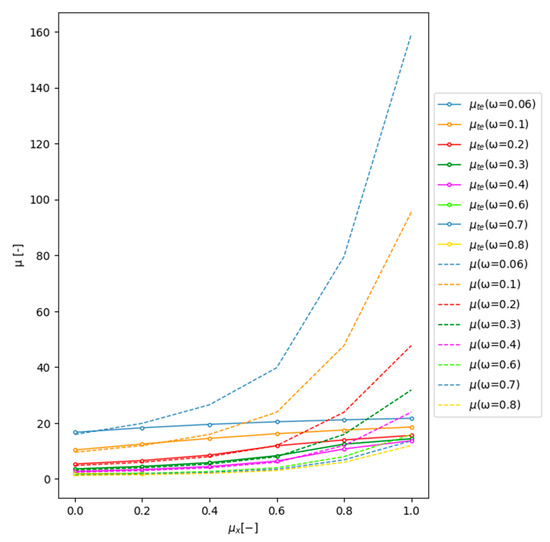
Figure 27.
μx–μ diagram showing the variation of the compressed reinforcement.
Once the concrete and steel deformations are fixed, the theoretical formulation in Equation (8), defined by the equilibrium in translation, depends on the tensile and compressed mechanical percentage of reinforcement; this means that the ductility increases with the compressed quantity of reinforcement and can reach high values in field 2 with a low quantity of compressed reinforcement.
In the other hand, practical calculations carried by the MEG Ductility software provide the same behavior but with a less evident growth of the μx–μ curve. The reason for this difference is found in the equation used for calculating the ultimate sectional curvature, shown in Equation (7), where the slow decrease in the neutral axis at the ultimate state, due to the increasing compressed reinforcement, involves the slow growth of the ductility curve.
7. Reinforced Concrete Section Fiber Analysis—Case Study 1
A concrete girder bridge from the Italian infrastructural heritage [3] was chosen to provide a practical application of a sectional analysis with the MEG Ductility software in order to assess the magnitude of the increase in resistant moment through non-linear constitutive bonds versus linear ones. The bridge beam presents an I-shaped cross-section, as shown in Figure 28.
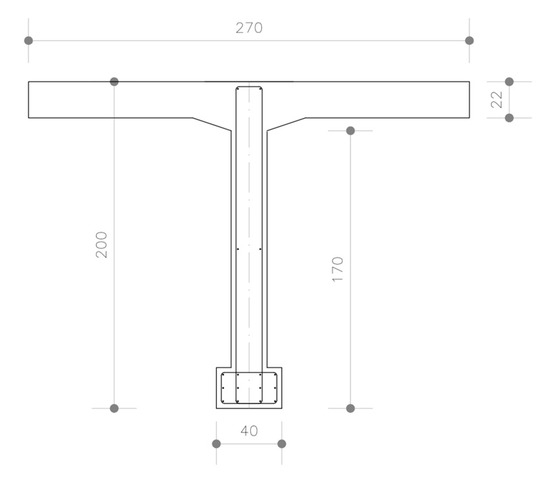
Figure 28.
Cross-section of a reinforced concrete internal beam.
To simplify the calculation and to be able to use the MEG Ductility software, the beam cross-section is converted into a T cross-section by removing the tensile concrete bulb and calculating an equivalent bar position (Figure 29). The material properties of this section are shown in Table 4.
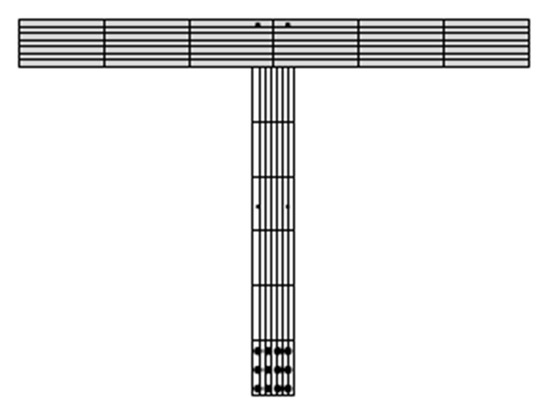
Figure 29.
Cross-section of a simplified reinforced concrete internal beam.

Table 4.
Sectional properties for the reinforced concrete section fiber test.
As reported in Table 5 and Figure 30, the increase in the resistant bending moment is almost equal to 816.4 kNm, which represents an increase of 10%.

Table 5.
Prestress cross-section bending test results.
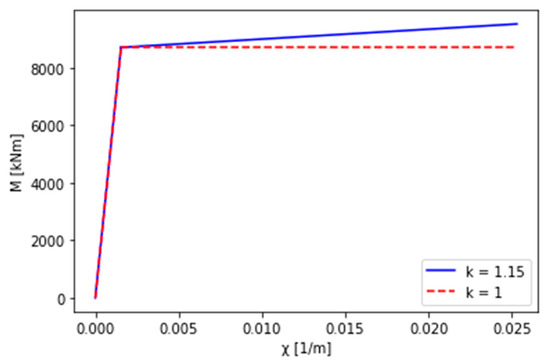
Figure 30.
Comparison of results obtained by analysis with k = 1 and k = 1.15.
8. Prestress Section Fiber Analysis—Case Study 2
The following finite element analysis [34,39] concerns the evaluation of the resistant bending moment of a prestressed bridge beam cross-section [40,41,42] to evaluate the magnitude of the increase in resistant moment through non-linear constitutive bonds versus linear bonds [43]. This section was taken from a bridge that belongs to the Italian infrastructural assets. The deck is made of prestressed reinforced concrete and consists of a span in simple support.
The cross-section of the edge beam (Figure 31) was analyzed with the MEG Fiber Sections software to assess its strength in terms of moment–curvature. This section has a lower bulb that was removed, as shown in Figure 32, in order to carry out the calculation, as both programs work with T-sections and not I-sections. This simplification is possible because this part of the section is located at the soffit and consists of tensioned concrete that does not generate any tensile contribution.
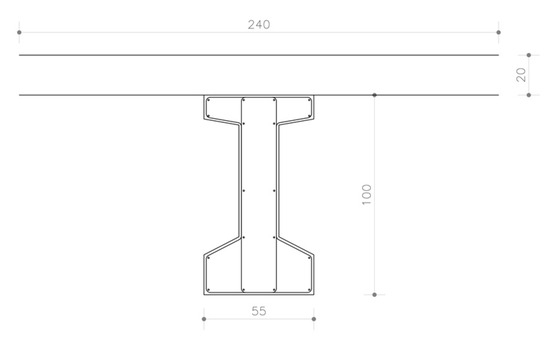
Figure 31.
Cross-section of an internal prestressed concrete deck beam.
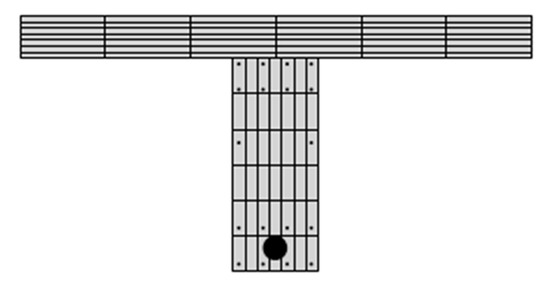
Figure 32.
Cross-section of a simplified prestressed concrete internal beam.
The material properties regarding the concrete and ordinary steel in this section are shown in Table 6. Prestressing steel properties and equivalent cable data [44,45] are reported in Table 7 and Table 8, respectively.

Table 6.
Ordinary steel and concrete data.

Table 7.
Prestressing steel data.

Table 8.
Equivalent cable data.
The results of the analysis performed with this code were compared with the ones obtained by the commercial software VCASlu (Table 9 and Figure 33) in order to perform a comparison with an ordinary software implementing a linear analysis.

Table 9.
Prestress cross-section bending test results.
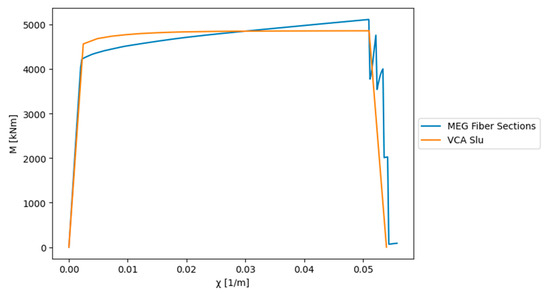
Figure 33.
Comparison between moment–curvature diagrams of a prestressed concrete deck beam.
As a result of this test, it is possible to see an increase in the resistant moment of approximately 250 kNm, which is 5.2% more than the one obtained by a linear analysis.
9. Push-Down Analysis
9.1. Introduction to Push-Down Analysis
The collapse push-down analysis is a non-linear displacement-controlled or load-controlled analysis [33,34,39,46,47] that can be performed at concentrated or diffuse plasticity [17]. In this specific case, the analysis was carried out using the Midas Civil software with concentrated plasticity and displacement control by statically imposing a monotonically increasing vertical displacement at the midpoint of a beam, thus being able to obtain, at each step, the force that the rest of the structure is able to provide at the same point; the resultant curves obtained from this analysis are the so-called force–displacement capacity curves, also known as push-down curves [29,48].
The increasing load over time was defined by means of a moving tracer command, which determines the most unfavourable travelling load configuration for a specific beam.
The sectional characteristics in terms of moment–curvature, obtained by means of the MEG Fiber Sections software, are inserted within Midas Civil by means of the General Section Designer GSD command (Figure 34) which allows the moment–curvature diagram of the sections to be defined for three points, namely yield strength, ultimate limit and decrease in bearing capacity [49]. These values are entered to define the plastic hinges concentrated in the main beam-traverse nodes on the decks that will be activated during the push-down analysis.
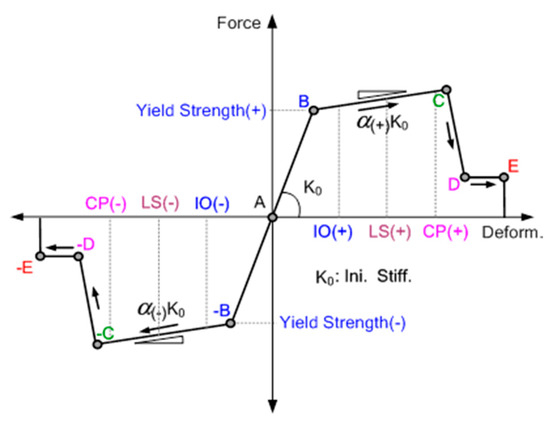
Figure 34.
GSD module for entering sectional parameters in terms of moment bending.
The entire process is summarized in a workflow (Figure 35). This type of non-linear analysis is justified only if the true state of the deck elements can be established by inspection and by investigations for the mechanical characterization of the materials. The use of non-linear constitutive bonds allows the real strength of materials to be exploited, which is available only if the state of the structure is optimal. This presents a limitation that must be taken into account.
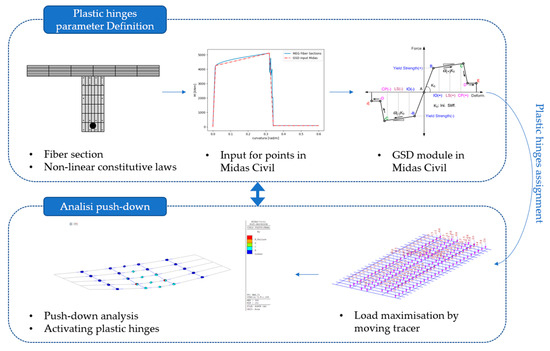
Figure 35.
Push-down workflow.
9.2. Introduction to Case Studies
The case studies for a more detailed study concern two motorway viaducts that differ in terms of geometry and reinforcement. The two decks, one of ordinary reinforced concrete (case study 1; Figure 36, Figure 37 and Figure 38) and one of prestressed concrete [50,51] (case study 2; Figure 39, Figure 40 and Figure 41), have the geometries shown in Table 10.
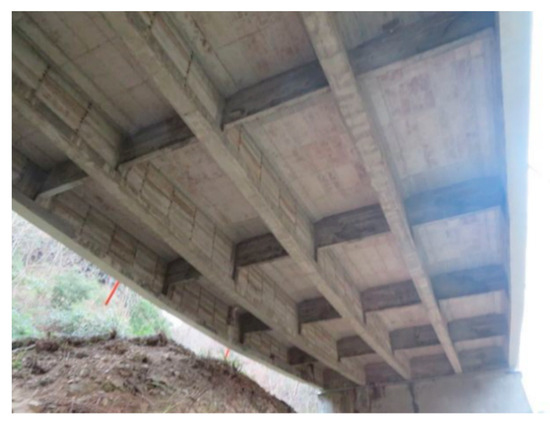
Figure 36.
Viaduct case study 1—view of the girder layout of the RC ordinary reinforced concrete deck.

Table 10.
Deck geometry data.
The following are images that describe the geometry of the two analyzed decks.
- Case study 1—Reinforced concrete viaduct:
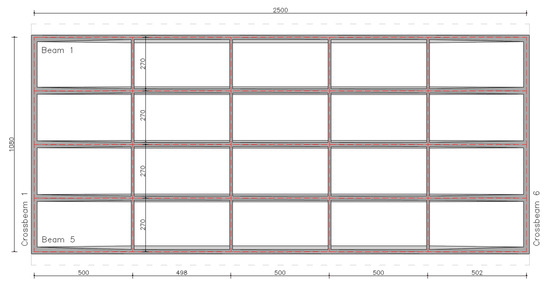
Figure 37.
Girder layout of the RC case study 1.
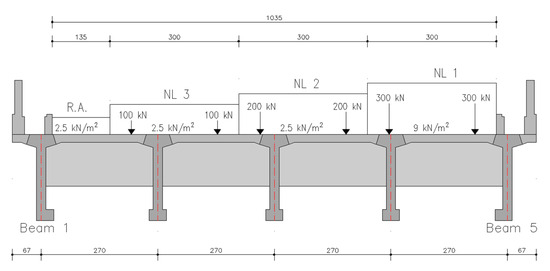
Figure 38.
Deck section and worst-case scenario for LM1 to maximize actions on the external edge girders of the RC case study 2.
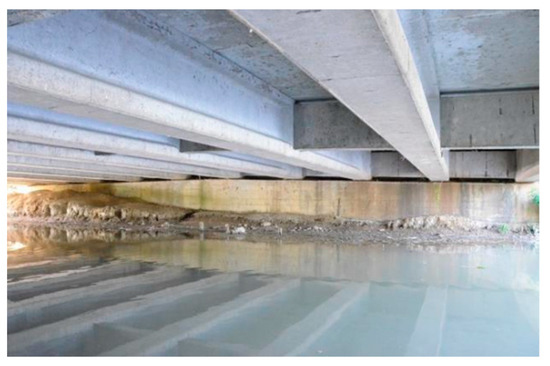
Figure 39.
Viaduct case study 2—view of the girder layout of the PRC prestressed reinforced concrete deck.
- Case study 2—Prestressed reinforced concrete viaduct:
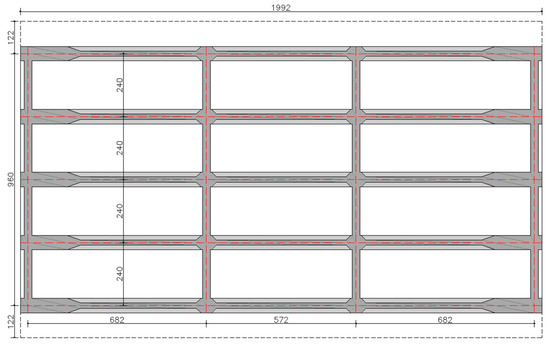
Figure 40.
Girder layout of the RC case study 2.
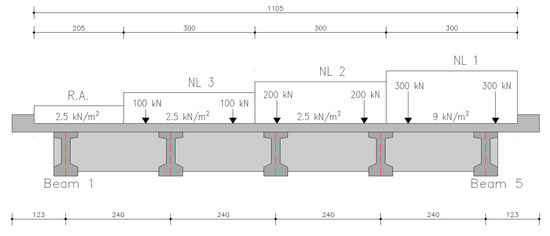
Figure 41.
Deck section and worst-case scenario for LM1 to maximize actions on the external edge girders of the PRC case study 2.
Of these decks, the cross-sections of beams and transoms were considered, implementing simplifications such as an equivalent cable for the prestressed case and removal of the tensioned lower bulb in order to return to the “T” beam case. The simplified sections were inserted into the fiber code, as shown in the example in Figure 29 and Figure 32, and the moment–curvature characteristics at the elastic and ultimate limit state were obtained (Figure 42 and Figure 43).
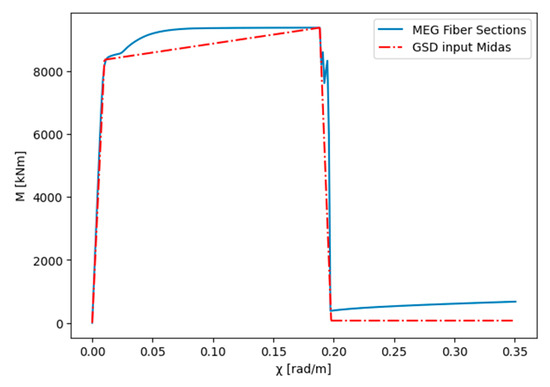
Figure 42.
Case study 1: Comparison of moment–curvature diagrams of the plastic hinge of a reinforced concrete deck beam.
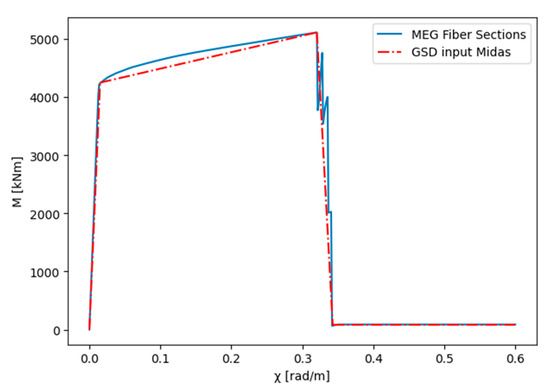
Figure 43.
Case study 2: Comparison of moment–curvature diagrams of the plastic hinge of a prestressed concrete girder.
The two decks were modelled using the Midas Civil software and were loaded by inserting the deck’s own weight, g1; the carried weight g2, consisting of barriers, pavement and kerbs; and traffic load according to Load Model no. 1 (LM1). The models are shown in Figure 44 and Figure 45.

Figure 44.
Representation of the structural model of the RC bridge case study 1.

Figure 45.
Representation of the structural model of the PRC bridge case study 2.
9.3. Push-Down Process
The increasing load over time, constituting the travelling load in the most unfavourable configuration for the external beam, was defined by means of the moving tracer command (Figure 46 and Figure 47), which determines the tracer for a specific beam.
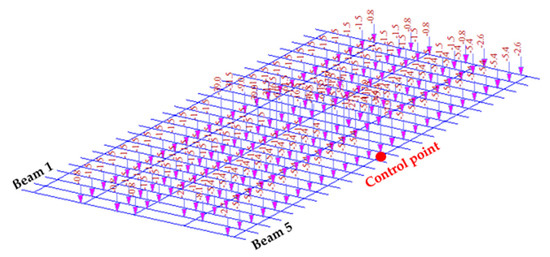
Figure 46.
Moving tracer for the RC deck case study 1.
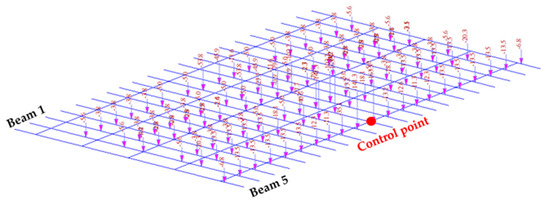
Figure 47.
Moving tracer for the PRC deck case study 2.
By means of the Global Control command, the static loads of a structural dead weight and weight-bearing load are assigned as G1 and G2, respectively, with a coefficient of 1.35, as stated in the regulations and in the Highway Guide. These loads are named:
- SW: self weight;
- SW_slab: self weight of the slab;
- DL_Barr: structural permanent load of the metal safety barriers;
- DL_Pavim: structural permanent load of the road pavement;
- DL_Cord + Vel: structural permanent load of kerbs and curbs.
The number of load steps by which the analysis is carried out has been set to 100 so that the exact points of interest such as first plasticization and global collapse can be perceived. The traffic load that maximizes the positive moment in the y-direction for the edge beam No. 5 is multiplied by an amplification coefficient of 1.35, as specified in the LG20 standard for the adaptation load combination.
The collapse analysis is carried out under displacement control by imposing a vertical displacement of 1 m downwards at the beam centerline node 5 (Figure 46 and Figure 47).
This type of analysis requires a high computational order, depending on the number of steps and their increment with which the test is carried out.
The plastic hinges are arranged at the beam-to-beam intersection, except at the support beams, since the deck is simply supported and has a rotational degree of freedom at the supports. Figure 48 and Figure 49 show the arrangement of the plastic hinges.
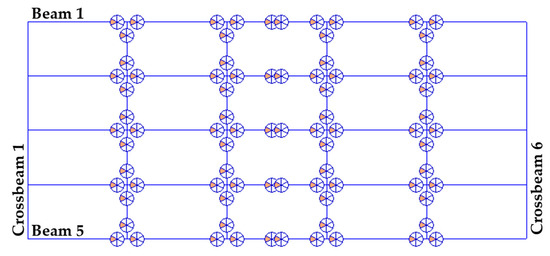
Figure 48.
Disposition of plastic hinges in RC bridge case study 1.
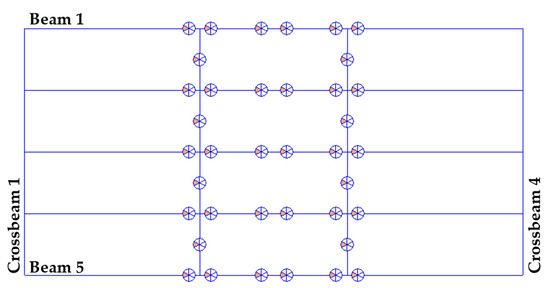
Figure 49.
Disposition of plastic hinges in PRC bridge case study 2.
Once the useful parameters have been set in order to perform a push-down analysis, the analysis is started, and the data obtained for the individual decks are observed.
10. Results and Discussion
10.1. Push-Down Analysis for Reinforced Concrete Deck (Case Study 1)
The test results are shown in terms of load-displacement (Figure 50) and step-load factor (Figure 51).
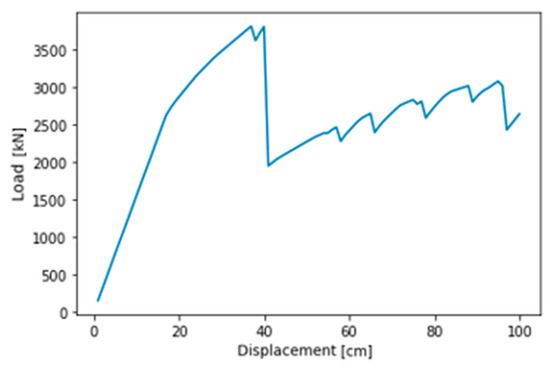
Figure 50.
Case study 1: Concrete deck push-down curve in terms of load-displacement.
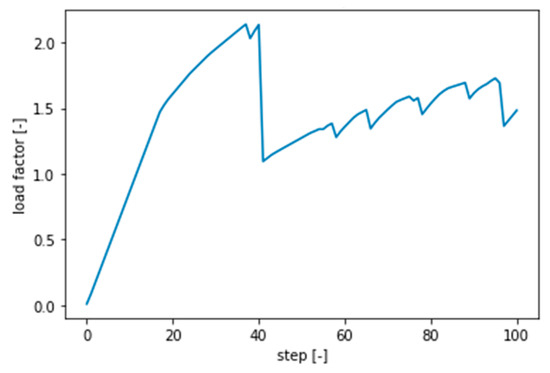
Figure 51.
Case study 1: Concrete deck push-down curve in terms of step-load factor.
From the above graph, it is possible to observe how the test proceeds with a constant load increase up to a load factor value of 1.47, beyond which a non-linear trend is observed. The step in question is number 17, in which the activation of the first plastic hinge is observed in correspondence with the center of beam number 5 (Figure 52). Continuing the test, the progressive activation of the plastic hinges in the centerline of the innermost beams is observed in Figure 53, Figure 54 and Figure 55 until collapse [52,53] (Figure 56).
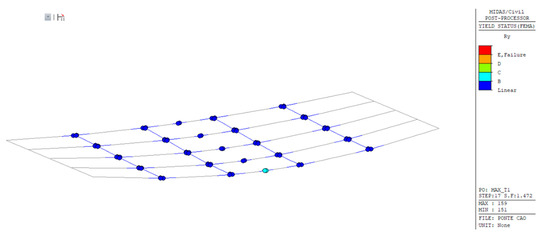
Figure 52.
Case study 1: Step 17, reaching the elastic limit of the hinge of centerline beam 5.
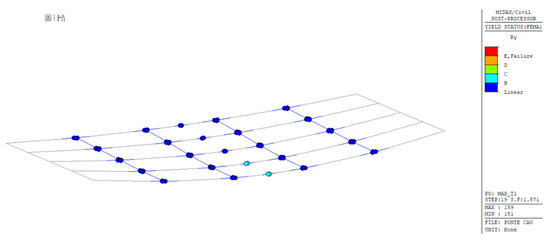
Figure 53.
Case study 1: Step 19, reaching the elastic limit of the hinge of centerline beam 4.
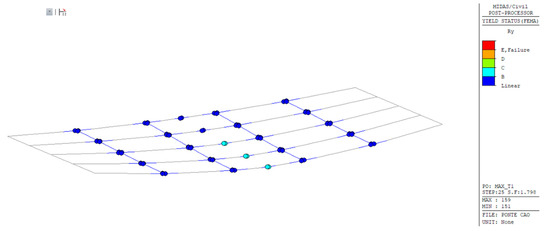
Figure 54.
Case study 1: Step 25, reaching the elastic limit of the hinge of centerline beam 3.
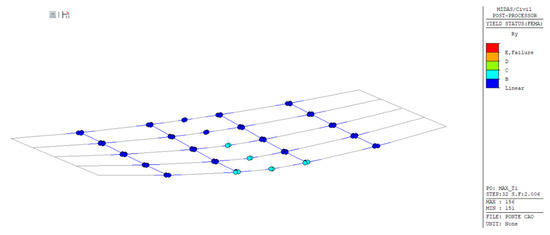
Figure 55.
Case study 1: Step 32, reaching the elastic limit of the hinge of beam-joist node 3 and 4.
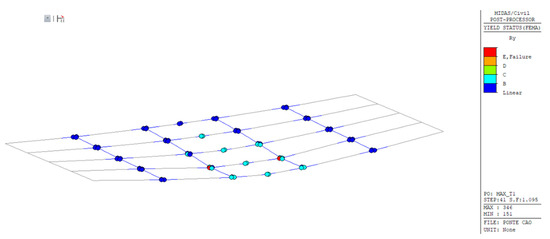
Figure 56.
Case study 1: Step 41, collapse of beam 4 at beam-traverse node 3 and 4.
To observe the redistribution process [4,49,54] of the loads following the progressive activation of the plastic hinges, the shear diagram at the extremity sections of crossbeam 3 as the step changes are shown in Figure 57, Figure 58, Figure 59 and Figure 60.
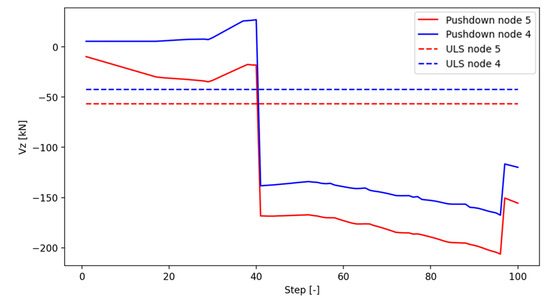
Figure 57.
Case study 1: Shear at the step change in crossbeam 3—section between beams 4 and 5.
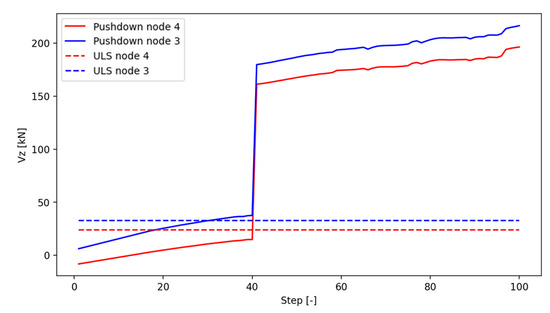
Figure 58.
Case study 1: Shear at the step change in crossbeam 3—section between beams 3 and 4.
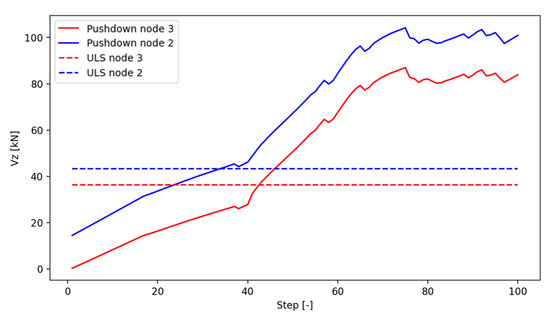
Figure 59.
Case study 1: Shear at the step change in crossbeam 3—section between beams 2 and 3.
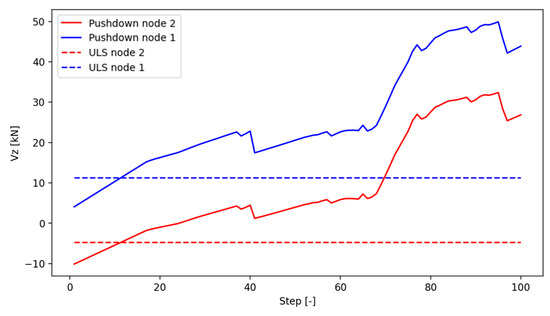
Figure 60.
Case study 1: Shear at the step change in crossbeam 3—section between beams 1 and 2.
The presence of a large number of crossbeams, considering the span of 25 m, represents an important source of redundancy since there is a redistribution of the effective loads, allowing the deck to develop as many plastic hinges as possible and thus delay the collapse.
10.2. Push-Down Analysis for Prestressed Concrete Deck (Case Study 2)
The results of the test carried out on the prestressed concrete deck, by applying prestressing as an equivalent load, are shown in terms of load displacement (Figure 61) and step-load factor (Figure 62).
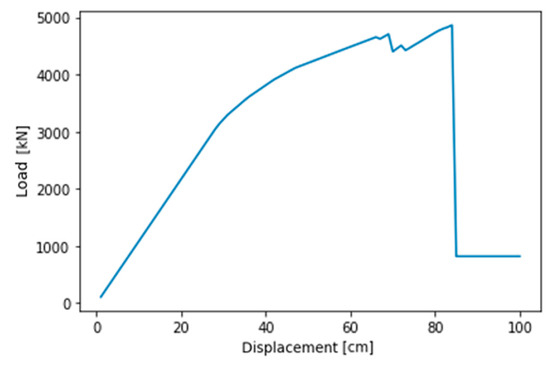
Figure 61.
Case study 2: Prestressed concrete deck push-down curve in terms of load displacement.
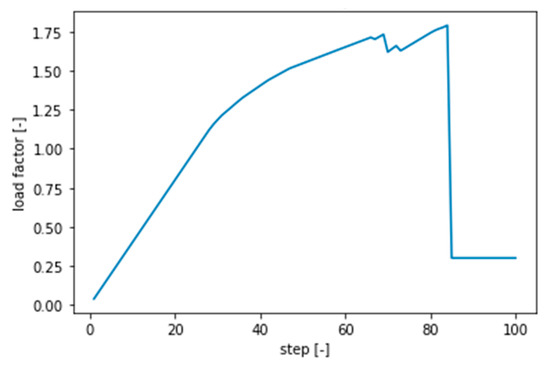
Figure 62.
Case study 2: Prestressed concrete deck push-down curve in terms of step-load factor.
As previously described, a linear behavior is observed up to a load-factor value of 1.18, beyond which a non-linear trend is observed. The step in question is step 29, i.e., the step in which the activation of the first plastic hinge is observed at the centerline of beam No. 5 (Figure 63). By continuing to increase the load, there is a progressive activation of the plastic hinges in the center of the innermost beams Figure 64, Figure 65, Figure 66 and Figure 67 until collapse [55] (Figure 68).
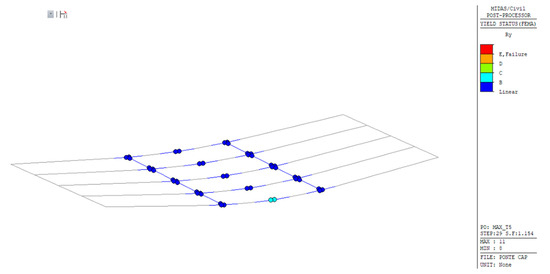
Figure 63.
Case study 2: Step 29, reaching the elastic limit of the beam 5 centreline hinge.
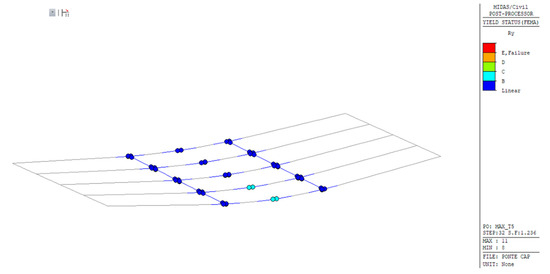
Figure 64.
Case study 2: Step 32, reaching the elastic limit of the beam 4 centerline hinge.
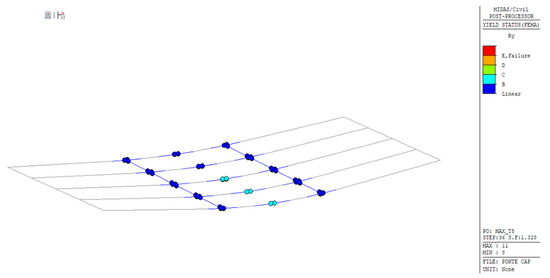
Figure 65.
Case study 2: Step 36, reaching the elastic limit of the beam 3 centerline hinge.
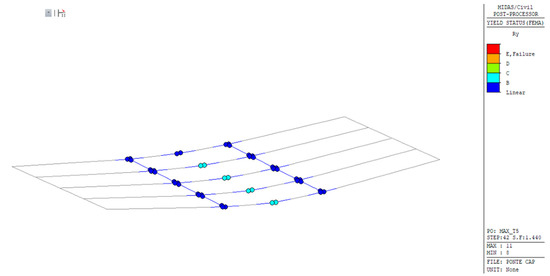
Figure 66.
Case study 2: Step 42, reaching the elastic limit of the beam 2 centerline hinge.
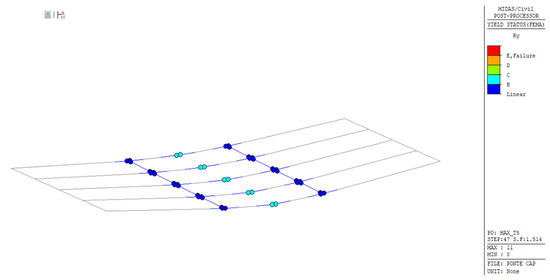
Figure 67.
Case study 2: Step 47, reaching the elastic limit of the beam 1 centerline hinge.
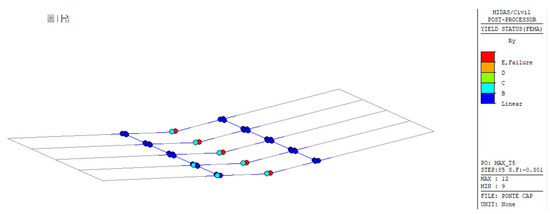
Figure 68.
Case study 2: Global collapse of the prestressed concrete deck at step 85.
The number of crossbeams has a fundamental importance in the study of the global structural response of the deck. In the case of the PRC viaduct, given the presence of four crossbeams only (of which two are in the span), the behavior is different from that of the RC bridge since, in this case, there is no significant redistribution [56] given from the crossbeams in the plasticization steps, as shown in Figure 69, Figure 70, Figure 71 and Figure 72. This leads to a global collapse of the deck without a local collapse of individual elements [57].
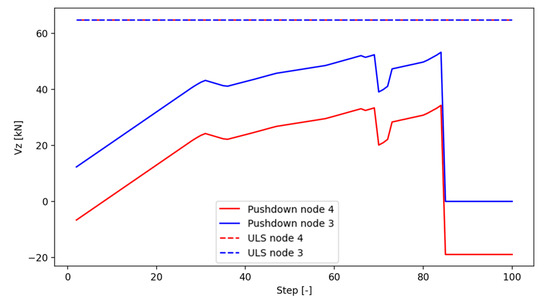
Figure 69.
Case study 2: Shear at the step change in crossbeam 2—section between beams 4 and 5.
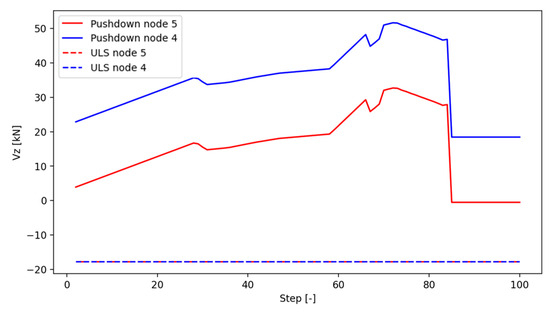
Figure 70.
Case study 2: Shear at the step change in crossbeam 2—section between beams 3 and 4.
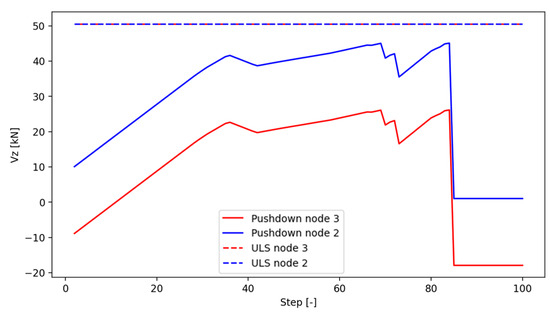
Figure 71.
Case study 2: Shear at the step change in crossbeam 2—section between beams 2 and 3.
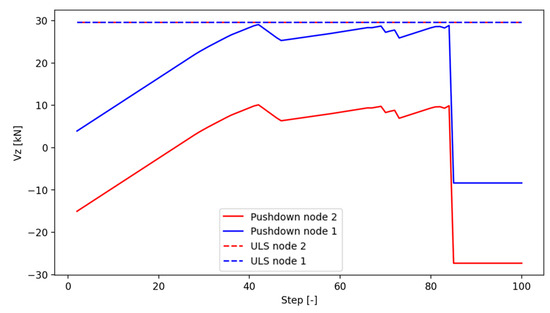
Figure 72.
Case study 2: Shear at the step change in crossbeam 2—section between beams 1 and 2.
A linear analysis always allows the superposition of effects to be used, and it also allows the stress characteristics to be obtained for use in the design phase, giving a considerable advantage on the practical side. A non-linear analysis, on the other hand, makes it possible to obtain the behavior of the structure [58] throughout the loading process that leads to failure.
10.3. Recommendations
The current study can be interpreted as a first step in the research on material non-linearity that is synergistically combined with push-down analysis. Future research could consider additional constitutive bonds of concrete and steel. Moreover, it is possible to further exploit the mechanical properties of reinforced concrete sections by considering the confinement given by stirrups.
The sectional and global concentrated plasticity analyses proposed in this paper could be extended to numerical models of bridges using more complex diffuse plasticity modeling techniques to evaluate the actual behavior of the structure. By neglecting aspects concerning the calibration of the hinge, which require the experience of the operator, more accurate results can be obtained through the distributed plasticity method at the expense of a higher computational burden and difficulty. Diffuse plasticity can also be implemented in the push-down analysis in order to observe where plastic hinges form.
A possible future direction is to not only consider the sections as intact but also to consider the damage, the materials aspect, the main forms of concrete deterioration and also the corrosion of steel reinforcement, using a revised fiber code, and to evaluate the differences in the case of the section provided by the original design.
11. Conclusions
In this research, non-linear sectional and global analyses have been carried out to explore the effects of the plastic properties of materials, aiming to observe the improvement in the resistance of existing structures.
Using the MEG Ductility software, by means of the implementation of the hardening ratio to introduce simplified steel non-linearity, it has been possible to observe an increase in the resisting moment at failure in fields 3 and 4 at the Ultimate Limit State, consistent with findings in the related literature.
A novel aspect of this study is the challenging nature of maintaining the latter range. As the compressed reinforcement increases, the section’s behavior rapidly switches to range 3. Moreover, there is a divergence in ductility compared with theoretical values. Both reference formulations (see Equations (7) and (8)), based on equilibrium at translation and rotation, exhibit clear differences as μs increases. This research shows that the increase in bending resistance is also evident in the analysis of a reinforced concrete bridge section using the MEG Ductility software, resulting in an ultimate moment 10% larger than that obtained through linear analysis.
The fiber code realized in the Opensees field allows the analysis of a prestressed concrete section with non-linear constitutive laws of materials. The results obtained through this approach demonstrated a 5.2% increase compared with the linear analysis, which is significant even in absolute terms.
The use of a non-linear push-down static analysis, applied to the prestressed concrete and reinforced concrete bridges, enables the application of the non-linear constitutive laws of steel and concrete, which more accurately represents the real behavior of the materials. The prestressed bridge exhibited load values 75% higher than the maximum vehicular load (LG20) for the ULS-setting combination (1.35·QLM1). Similarly, the other case study involving the reinforced concrete bridge reported an increase of up to 100%.
The shear diagram highlights the importance of the number and spacing of crossbeams in redistributing actions. For the prestressed concrete bridge, the shear diagram showed a regular redistribution of action as the load changes. In contrast, the ordinary concrete bridge experienced an abrupt change at a given load.
The number of crossbeams played a critical role in this behavior: fewer and farther-apart crossbeams caused immediate redistribution, whereas a greater number allowed for a more regular redistribution of the load following local collapses.
Author Contributions
Conceptualization, M.G., M.M., E.D.L., L.A.B.G. and G.C.M.; Methodology, M.G., M.M., L.A.B.G. and G.C.M.; Software, M.G., M.M., L.A.B.G. and G.C.M.; Validation, M.G., M.M., L.A.B.G. and G.C.M.; Formal analysis, M.G., M.M., L.A.B.G. and G.C.M.; Investigation, M.G., M.M., L.A.B.G., D.M. and G.C.M.; Resources, M.M., L.A.B.G., D.M. and G.C.M.; Data curation, M.G., M.M., L.A.B.G. and G.C.M.; Writing—original draft, M.G., M.M., R.A., L.A.B.G. and G.C.M.; Writing—review & editing, M.G., M.M., R.A., E.D.L., L.A.B.G., D.M. and G.C.M.; Visualization, M.G., M.M., R.A., E.D.L. and L.A.B.G.; Supervision, M.M., R.A., L.A.B.G., D.M. and G.C.M. Project administration, M.M. and G.C.M.; Funding acquisition, G.C.M. All authors have read and agreed to the published version of the manuscript.
Funding
This research received no external funding.
Data Availability Statement
The data presented in this study are available on request from the corresponding author.
Acknowledgments
The authors and other members of the project team gratefully acknowledge the Consorzio Inter-universitario ReLUIS “Linee Guida Ponti” project in agreement with the Consiglio Superiore dei Lavori Pubblici and ReLUIS—CUP G55F21001010001.
Conflicts of Interest
The authors declare no conflict of interest.
References
- Superti, D. I Ponti in Cemento Armato a Travata Rettilinea; Franco Angeli Editore: Milano, Italy, 1969. [Google Scholar]
- Melchers, R.E. Assessment of existing Structures-approaches and research needs. J. Struct. Eng. 2001, 127, 406–411. [Google Scholar] [CrossRef]
- Felitti, M.; Oliveto, F.; Pelle, D.; Valvola, F. Valutazione Dei Ponti e Viadotti Esistenti Soggetti a Rischio Strutturale in Condizioni Statiche, Sismiche e Di Degrado; Maggioli Editore: Bruxelles, Belgium, 2023; ISBN 8891666157. [Google Scholar]
- Formisano, A.; Felitti, M.; Oliveto, F.; Mendicino, L. The Robustness of Reinforced Concrete Tied Arch Bridges: A Case Study. J. Fib 2023, 1–11. [Google Scholar] [CrossRef]
- Wang, N. Reliability-Based Condition Assessment of Existing Highway Bridges; Georgia Institute of Technology: Atlanta, GA, USA, 2010. [Google Scholar]
- Miluccio, G.; Losanno, D.; Parisi, F.; Cosenza, E. Traffic-Load Fragility Models for Prestressed Concrete Girder Decks of Existing Italian Highway Bridges; Elsevier: Amsterdam, The Netherlands, 2021. [Google Scholar] [CrossRef]
- EN 1992-1-1 (2005); Eurocode 2: Design of Concrete Structures. European Committee for Standardization: Brussels, Belgium, 2005.
- D’Amato, M.; Laterza, M.; Casamassima, V.M. Seismic Performance Evaluation of Multi-Span Existing Masonry Arch Bridge. Open Civ. Eng. J. 2017, 11, 1191–1207. [Google Scholar] [CrossRef]
- Pelà, L.; Aprile, A.; Benedetti, A. Seismic Assessment of Masonry Arch Bridges. Eng. Struct. 2009, 31, 1777–1788. [Google Scholar] [CrossRef]
- Enright, M.P.; Frangopol, D.M. Condition prediction of deteriorating concrete bridges using Bayesian updating. J. Struct. Eng. 1999, 125, 1118–1125. [Google Scholar] [CrossRef]
- Derseh, S.A.; Mohammed, T.A. Bridge Structures under Progressive Collapse: A Comprehensive State-of-Theart-Review; Elsevier: Amsterdam, The Netherlands, 2023. [Google Scholar] [CrossRef]
- Biondini, F.; Frangopol, D.M. Bridge Maintenance, Safety, Management, Resilience and Sustainability; CRC Press: Boca Raton, FL, USA, 2012; ISBN 13: 978-0-203-08565-3. [Google Scholar]
- Kheyroddin, A.; Mortezaei, A. Nonlinear Finite Element Analysis of Reinforced Concrete Bridges. J. Transp. Res. 2007, 3, 1–8. [Google Scholar]
- Ministero delle Infrastrutture e dei Trasporti. Linee Guida per La Classificazione e Gestione Del Rischio, La Valutazione Della Sicurezza Ed Il Monitoraggio Dei Ponti Esistenti; Ministero delle Infrastrutture e dei Trasporti: Rome, Italy, 2022.
- Carpinteri, A. Analisi Non-Lineare Delle Strutture; Pitagora Editrice: Bologna, Italy, 1997. [Google Scholar]
- Dudziak, S. Numerically Efficient Three-Dimensional Model for Non-Linear Finite Element Analysis of Reinforced Concrete Structures. Materials 2021, 14, 1578. [Google Scholar] [CrossRef] [PubMed]
- Bontempi, F. Analisi Strutturale Non Lineare: Modellazione, Algoritmi, Aspetti Critici; Analisi Strutturale Edificio: Rome, Italy, 2020. [Google Scholar]
- Ministero delle Infrastrutture e dei Trasporti. Aggiornamento Delle Norme Tecniche per Le Costruzioni NTC2018; Ministero delle Infrastrutture e dei Trasporti: Rome, Italy, 2018.
- Ramberg, W.; Osgood, W.R. Description of Stress–Strain Curves by Three Parameters; National Advisory Committee for Aeronautics: Washington, DC, USA, 1943. [Google Scholar]
- Bolong, Z.; Zhenxiang, D. Nonlinear Analysis of Reinforced Concrete; Tongji University Press: Shanghai, China, 1985. [Google Scholar]
- Kent, D.; Park, R. Flexural Members with Confined Concrete. J. Struct. Div. ASCE 1971, 97, 1969–1990. [Google Scholar] [CrossRef]
- Mander, J.B.; Priestley, M.J.N.; Park, R. Theoretical Stress-Strain Model for Confined Concrete. J. Struct. Eng. 1988, 114, 1804–1826. [Google Scholar] [CrossRef]
- Menegotto, M.; Pinto, P.E. Method of analysis for cyclically loaded reinforced concrete plane frames including changes in geometry and non-elastic behavior of elements under combined normal forced and bending. In Proceedings of the IABSE Symposium on Resistance and Ultimate Deformability of Structures Acted on by Well Defined Repeated Loads, Lisboa, Portugal, 13–14 September 1973. [Google Scholar]
- Giuffè, A.; Pinto, P.E. Il Comportamento Del Cemento Armato per Sollecitazioni Cicliche Di Forte Intensità. G. Genio Civ. 1970, 202, 1970. [Google Scholar]
- Capecchi, D.; Ciampi, V.; Vestroni, F. Un Modello per Elementi Di Trave in Cemento Armato Soggetto a Carichi Ripetuti; Pubblicazione n° 32; Istituto di Scienza delle Costruzioni: L’Aquila, Italy, 1980. [Google Scholar]
- Ciampi, V.; Eligehausen, R.; Bertero, V.; Popov, E.P. Analytical Model for Concrete Anchorages of Reinforcing Bars under Generalized Excitations; Report UCB/EERC-82/23; University of California: Los Angeles, CA, USA, 1982. [Google Scholar]
- Filippou, F.C.; Popov, E.P.; Bertero, V.V. Effects of Bond Deterioration on Hysteretic Behavior of Reinforced Concrete Joints; Report UCB/EERC-83/19; University of California: Los Angeles, CA, USA, 1983. [Google Scholar]
- Marano, G.C. Stati Limite Ultimi per Tensioni Normali; Corso di Tecnica delle Costruzioni, Politecnico di Torino: Torino, Italy, 2020. [Google Scholar]
- Givonetti, M.; Mairone, M.; Asso, R.; Bohorquez Grateron, L.A.; Masera, D.; Marano, G.C. Non-linear analysis of RC and PRC structures towards a maximum exploitation of the plastic reserves of the materials. In Building for the Future: Durable, Sustainable, Resilient; Ilki, A., Ed.; Springer Nature: Basel, Switzerland, 2023; pp. 209–218. ISBN 978-3-031-32518-2. [Google Scholar] [CrossRef]
- Gelfi Homepage. Available online: https://gelfi.unibs.it/software/programmi_studenti.html (accessed on 9 February 2023).
- ReLUIS Homepage. Available online: https://www.reluis.it/it/progettazione/software/biaxial.html (accessed on 9 February 2023).
- Opensees Homepage. Available online: https://opensees.berkeley.edu (accessed on 5 May 2023).
- Cavallari, G. Pushover Analysis of An Existing Reinforced Concrete Bridge: The Jamboree Road Overcrossing in Irvine, California; Università di Bologna: Bologna, Italy, 2011. [Google Scholar]
- Ottosen, N.S. Nonlinear Finite Element Analysis of Concrete Structures; Springer: Berlin/Heidelberg, Germany, 1980; ISBN 87-550-0649-3. [Google Scholar]
- Opensees Homepage. Available online: https://opensees.berkeley.edu/wiki/index.php/Reinforcing_Steel_Material (accessed on 5 May 2023).
- Opensees Homepage. Available online: https://opensees.berkeley.edu/wiki/index.php/Steel01_Material (accessed on 5 May 2023).
- Corrado, M.; Ventura, G.; Carpinteri, A. Experimental Evidences of Flexural to Shear to Crushing Failure Mode Transition in Reinforced Concrete Beams without Stirrups. Eng. Struct. 2022, 271, 114848. [Google Scholar] [CrossRef]
- Cosenza, E.; Manfredi, G.; Pecce, M. Strutture in Cemento Armato: Basi Della Progettazione; Terza Edizione Hoepli: Milan, Italy, 2019. [Google Scholar]
- Razaqpur, A.G.; Nofal, M. Nonlinear Analysis of Prestressed Concrete Box Girder Bridges under Flexure; Department of Civil Engineering, Carleton University: Ottawa, ON, Canada, 1989. [Google Scholar]
- Hambly, E.C. Bridge Deck Behaviour; CRC Press: London, UK, 2014. [Google Scholar]
- Corven, J. Post-Tensioned Box Girder Design Manual; Federal Highway Administration, Office of Infrastructure—Bridges and Structures: Washington, DC, USA, 2015.
- Leonhardt, F.; Monnig, E. Casi Speciali Di Dimensionamento Nelle Costruzioni in c.a. e c.a.p.; Edizioni di Scienza e Tecnica: Milano, Italy, 1979. [Google Scholar]
- Conte, M. Lo stato della ricerca sulla valutazione del rischio e la verifica della sicurezza dei ponti e dei viadotti. In Proceedings of the Il Sistema Di Gestione Dei Ponti Esistenti: L’esperienza Di ASPI, Padova, Italy, 2 September 2021. [Google Scholar]
- Menn, C. Prestressed Concrete Bridges; Birkhauser Verlag: Basel, Switzerland, 1986. [Google Scholar]
- Leonhardt, F. Il Precompresso Calcolo—Verifiche Tecnologie; Edizioni di Scienza e Tecnica: Milano, Italy, 1980. [Google Scholar]
- Fawad, M.; Koris, K.; Salamak, M.; Gerges, M.; Bednarski, L.; Sienko, R. Nonlinear Modelling of a Bridge: A Case Study-Based Damage Evaluation and Proposal of Structural Health Monitoring (SHM) System. J. Pan 2022, 68, 569–584. [Google Scholar]
- Givonetti, M. Residual Strength and Ductility of Existing RC and PRC Girder Bridges Using Non-Linear Analyzes. Master’s Thesis, Politecnico di Torino, Turin, Italy, 2022. [Google Scholar]
- Fallon, C.T.; Quiel, S.E.; Naito, C.J. Uniform Pushdown Approach for Quantifying Building-Frame Robustness and the Consequence of Disproportionate Collapse. J. Perform. Constr. Facil. 2016, 30, 04016060. [Google Scholar] [CrossRef]
- Thuy, V.T.T.; Quyen, V.T.B. Nonlinear Analysis for Proposing Limit State Criteria of Reinforced Concrete Road Bridge Superstructures. J. Pan 2023, 49, 495–512. [Google Scholar]
- Harding, J.E.; Parke, G.A.; Ryall, M.J. Bridge Management; E & F N Spon Ltd.: London, UK, 1990; ISBN 0-419-16050-7. [Google Scholar]
- Fritz, L. I Ponti Dimensionamento—Tipologia Costruzione; Springer Verlag: Berlin, Germany, 1979; Volume VI, ISBN 88-7028-004-7. [Google Scholar]
- Kim, T.; Kim, J.; Park, J. Investigation of Progressive Collapse-Resisting Capability of Steel Moment Frames Using Push-Down Analysis. J. Perform. Constr. Facil. 2009, 23, 327–335. [Google Scholar] [CrossRef]
- Khandelwal, K.; El-Tawil, S. Pushdown Resistance as a Measure of Robustness in Progressive Collapse Analysis. Eng. Struct. 2011, 33, 2653–2661. [Google Scholar] [CrossRef]
- Kim, S.; Nowak, A.S. Load Distribution and Impact Factors For I-Girder Bridges. J. Bridge Eng. 1997, 2, 97–104. [Google Scholar] [CrossRef]
- Powell, G. Progressive collapse: Case studies using nonlinear analysis. In Proceedings of the Structures Congress and Exposition, New York, NY, USA, 20–24 April 2005; pp. 1–14. [Google Scholar] [CrossRef]
- CNR—Advisory Committee on Technical Recommendations for Construction. Guide to Design of Structures for Robustness; CNR: Rome, Italy, 2021. [Google Scholar]
- Fiorillo, G.; Ghosn, M. Structural Redundancy, Robustness, and Disproportionate Collapse Analysis of Highway Bridge Superstructures. J. Struct. Eng. 2022, 148, 04022075. [Google Scholar] [CrossRef]
- Huang, S.N.; Lu, X.Z.; Ye, L.P.; Liu, Y.K. Nonlinear Finite Element Analysis for a Prestressed Continuous Rigid Frame Concrete Bridge; Springer: Berlin/Heidelberg, Germany, 2007. [Google Scholar]
Disclaimer/Publisher’s Note: The statements, opinions and data contained in all publications are solely those of the individual author(s) and contributor(s) and not of MDPI and/or the editor(s). MDPI and/or the editor(s) disclaim responsibility for any injury to people or property resulting from any ideas, methods, instructions or products referred to in the content. |
© 2023 by the authors. Licensee MDPI, Basel, Switzerland. This article is an open access article distributed under the terms and conditions of the Creative Commons Attribution (CC BY) license (https://creativecommons.org/licenses/by/4.0/).