Article

Caffeine–Acrylic Resin DLP-Manufactured Composite as a Modern Biomaterial

by
Dorota Tomczak
1,
Radosław Wichniarek
2,* and
Wiesław Kuczko
2
1
Faculty of Chemical Technology, Poznan University of Technology, Berdychowo 4, 60-965 Poznan, Poland
2
Faculty of Mechanical Engineering, Poznan University of Technology, Piotrowo 3, 60-138 Poznan, Poland
*
Author to whom correspondence should be addressed.
Designs 2023, 7(2), 49; https://doi.org/10.3390/designs7020049
Submission received: 27 February 2023 / Revised: 20 March 2023 / Accepted: 24 March 2023 / Published: 26 March 2023
(This article belongs to the Special Issue Additive Manufacturing – Process Optimisation)

Abstract

:
Materials based on photocurable resins and pharmaceutically active agents (APIs) are gaining interest as a composite drug delivery system. In this study, a composite of caffeine with acrylic resin was obtained using an additive manufacturing method of digital light processing (DLP) as a potential material for transdermal drug delivery. The mechanical properties of the composites and the ability to release caffeine from the resin volume in an aqueous environment were investigated. The amount of caffeine in the resulting samples before and after release was evaluated using a gravimetric method. The global thresholding method was also evaluated for its applicability in examining caffeine release from the composite. It was shown that as the caffeine content increased, the strength properties worsened and the ability to release the drug from the composite increased, which was caused by negligible interfacial interactions between the hydrophilic filler and the hydrophobic matrix. The global thresholding method resulted in similar caffeine release rate values compared to the gravimetric method but only for samples in which the caffeine was mainly located near the sample surface. The distribution of caffeine throughout the sample volume made it impossible to assess the caffeine content of the sample using global thresholding.

1. Introduction

Additive manufacturing (AM) machines have been available on the market for many years. AM has already found their application in many industries, and new ideas for implementation and improvement are constantly emerging. The literature has numerous examples of how additive manufacturing is used in the medical field, such as the creation of implants, orthoses, prostheses, and preoperative and intraoperative tools. One very promising and relatively new approach to additive manufacturing is the concept of drug printing. Such medicaments, customized individually for each patient, would be the reverse of the current situation, where patients are fitted to the drug manufacturer dose. El Aita I. et al. [1] indicate that the therapy can be optimized and side effects can be decreased by tailoring the dose to the patient’s age, weight, and medical history. According to Herrada-Manchón H. et al. [2], oral dosages produced by AM can come in enticing and delectable forms that are simple to handle and consume. This may enhance medication compliance and help young children cope emotionally with the sickness.
Additive manufacturing applies to a whole range of different manufacturing methods which share the fact that the products made with them are created layer-by-layer. AM is carried out directly on the basis of data on the three-dimensional geometry of the product and without the use of dedicated technological equipment. The most popular methods of AM in pharmaceutical applications include: selective laser sintering (SLS) [3], fused deposition modeling (FDM) [4], three-dimensional printing (3DP) [5], and stereolithography (SLA) [6].
The oldest commercially available additive manufacturing method is SLA. The method is based on the solidification of a resin polymer in process called photopolymerization. SLA uses a point light source which is a laser with a wavelength adapted to the needs of curing the selected resin [7]. A variation of SLA is digital light projection (DLP) which is mainly distinguished by another type of light source, which is the projector [8]. Both methods provide great versatility in pharmaceutical applications. Active pharmaceutical ingredients (APIs) can be mixed in the liquid form of the resin as well as coated with finished SLA/DLP products. Compared to other methods of additive manufacturing, the SLA/DLP process is characterized by high dimensions and shape accuracy of digital geometry. Both methods are suitable for working with thermally stable as well as thermally labile drugs [9].
One of the limitations and at the same time challenges in the use of resin additive manufacturing methods include the problem of toxicity and compatibility of resins with the human body. The photocurable photopolymer should not be harmful to humans but also should not be reactive to APIs [10,11]. What is more, multi-component formulation production is highly constrained, particularly at greater drug loadings [10].
Wang J. et al. [9] have studied the suitability of manufacturing drug loaded tablets by SLA. They claimed that it is possible to use a concentration up to 5.9% (w/w) in the case of mixtures of photocurable monomers such as polyethylene glycol diacrylate (PEGDA) with paracetamol and 4-aminosalicylic acid. They were able to create tablets that were homogeneous in size and displayed the same hue as the original photopolymer solution. Robles-Martinez P. et al. [12] proved that it is possible to use resin AM to produce a tablet containing as many as six different APIs (paracetamol, aspirin, naproxen, prednisolone, chloramphenicol, caffeine). The authors stated that all formulations were suitable for AM, but more research is required to identify the best printer settings for each formulation in order to achieve precise dimensions, and therefore dosing, as well as to create certain drug release patterns as necessary.
Despite the wide range of work performed in the development of biomedical products using additive manufacturing methods such as SLA or DLP, the obtaining of pharmaceutical printed products is still limited mainly due to the incompatibility of the introduced additives to photocurable resins. The active pharmaceutical ingredients should be compatible enough with the polymer matrix material to make it possible to obtain polymer-drug composites, ensure their functional properties, and at the same time allow appropriate drug delivery to the patient. The use of transdermal microneedle systems is one of the methods of drug delivery. The frequently used PEGDA material was used to produce a microneedle system by DLP process and was tested in vitro and ex vivo using human skin showing release characteristics when exposed to external inputs such as temperature and pH [13]. Furthermore, a study by Lim S. H. et al. [14] shows a microneedle patch fabricated from PEGDA and vinyl pyrrolidone with an optimal quantitative ratio of constituent monomers loaded with acetyl-hexapeptide 3 for application to facial skin as an anti-ageing product. The selection of the matrix and manufacturing parameters was dictated by the influence of the materials on the active substance, mechanical properties of the product, water absorption and swelling associated with drug release, and the effect on resin cross-linking. PEGDA, due to its hydrophilic character, allowed the loading of hydrophilic drugs at concentrations greater than 1% [9], which is much more difficult for hydrophobic matrices.
Approximately 60% of developed pharmaceuticals are hydrophilic substances [15], which is a barrier to the manufacture of composite systems with a drug based on hydrophobic materials due to the lack of solubility of the drug in the matrix or negligible interfacial interactions, making it difficult to manufacture the final products without their properties deteriorating. Several studies on the preparation of composites in which the polar character of the constituent substances was important are known. Himawan A. et al. [16] developed a hydrogel film with theophylline based on poly(vinyl acetate), polyvinylpyrrolidone, and citric acid. They showed that the hydrophilic character of the drug limited its release from the film because of its high affinity for the matrix components. A solid lipid nanoparticle formulation of a hydrophilic neuroprotective analogue of cyclic guanosine monophosphate, a hydrophobic polyester-based composite film, obtained by Li h. et al. [17] enabled the system to reach the retina, potentially increasing the efficiency of drug delivery. In special cases, the simultaneous delivery of a hydrophilic and a hydrophobic drug is required to optimize treatment. The preparation of this type of system was described by Arpita R. et al. [18], who obtained a combination of hydrophobic ibuprofen and hydrophilic tetracycline hydrochloride in a hydrogel based on β-cyclodextrin, poly(hydroxypropyl methacrylate), poly(acrylic acid), and PEGDA, which has a matrix of dual polar character due to the appropriate choice of monomers. The resulting composite was tested in vitro and in vivo, confirming its effectiveness in releasing hydrophilic and hydrophobic active ingredients from the matrix.
The advantage of composite systems with different polarity of the API filler and polymeric matrix is the significant reduction of the reactivity between the drug filler and the matrix and the enhanced release of the drug from the system due to the reduction of interfacial interactions. The aim of this work was to obtain advanced composites with a caffeine filler known for its pain-relieving properties, helping to treat obesity or apnea or aiding in the treatment of neurological diseases like Alzheimer’s [19]. Caffeine represented hydrophilic drugs loaded in a hydrophobic photopolymer matrix which manufactured by the use of additive manufacturing DLP method constitute a potential material for transdermal systems, i.e., devices for transdermal drug delivery. The hydrophilic filler content in the hydrophobic matrix was expected to reach values comparable to those of hydrophilic matrix-based systems. The use of constituents of different polarity was intended to improve drug release from the system, which is a problem for fully hydrophilic systems.
In order to evaluate the properties relevant to drug delivery through the skin, the strength properties of the samples were investigated along with the drug release rate in an aqueous environment that simulates contact with the human body. Evaluation of the global thresholding method as a method to determine the degree of caffeine release from the crosslinked acrylic resin structure is an innovative aspect of this work. The obtained samples are the first documented example of printed products made of caffeine and photocurable hydrophobic acrylic resin contributing modern knowledge of bio-composite-systems with a hydrophilic filler in the form of API and a hydrophobic matrix made of one of the most commonly used photopolymers in DLP.

2. Materials and Methods

2.1. Materials

Aqua Clear Resin acrylic resin (Phrozen Technology, Hsinchu, Taiwan) was used to make the samples. The resin consists of listed components: acrylate oligomer, 4-(1-oxo-2-propenyl)-morpholine, bis(1,2,2,6,6-pentamethyl-4-piperidyl) sebacate, and diphenyl(2,4,6-trimethyl benzoyl) phosphine oxide. The properties of the Aqua Clear Resin are shown in Table 1.
Furthermore, caffeine with the sum formula C8H10N4O2 and a purity grade of 99% (Pol-Aura, Olsztyn, Poland) was used to make the composite samples. The properties of caffeine relevant to formulation with acrylic resin and its application in DLP manufacturing are given in Table 2. The solubility of caffeine in alcohol was determined by the authors in preliminary studies.

2.2. Pretreatment Processes

The caffeine was mechanically grinded in a mortar for 5 min. Then, 2.5 g of caffeine was added to 10 mL of alcohol and annealed at 50 °C for 2 h to better disperse the substance in the resin. Due to the annealing temperature and the considerable exceeding of the maximum amount of caffeine soluble in alcohol, a saturated solution of alcohol with caffeine with precipitate was obtained. The mixture prepared in this way was added to 50 g of resin and stirred in an MR Hei-Tec Heidilph magnetic stirrer for 10 min at a rotational speed of 1000 rpm obtaining a 4% (w/w) solution of caffeine in resin and alcohol.

2.3. Composites DLP Manufacturing

Manufacturing of the samples was performed using a 2 × 10 × 100 mm geometrical model. One sample series resulted in 3 samples, which were positioned side by side at a distance of 3 mm adjacent to the table with the largest plane. Each sample had technological chamfers to make it easier to remove the samples from the table and to recognize the position during manufacturing, which made it possible to later compare samples from different series. Nine resin samples designated from 0.1 to 0.9 were made as part of a reference series designated as (0). After that, 4 series of caffeineresin composite samples designated as (1), (2), (3) and (4) were made, resulting in 12 samples designated from 1 to 12. The manufacturing parameters are listed in Table 3. The samples were cleaned in alcohol in a UW-01 Creality machine (Shenzen Creality 3D Technologyu Co., Ltd., Shenzen, China) in quick mode for 4 min and then dried with coupled air. The samples prepared in this way were further cured in XYZ UV Curing Chamber (New Kinpo Group, New Taipei City, Taiwan) for 10 min.

2.4. Mechanical Testing

The obtained samples were tested in static tensile test on Zwick/Roell Z020 machine with the load capacity of 20 kN. During the tensile test, the tensile rate was 1 mm/min in accordance with ISO 527. The mechanical parameters of tensile strength (σm), relative elongation (A) and Young’s modulus (E) were determined.

2.5. Caffeine Release Test

2.5.1. Gravimetric Method

To evaluate the caffeine release from the composite system, the prepared samples were weighed (m0) and dried in a drying apparatus at 50 °C for 24 h. Each sample was then weighed again (m1) and placed in a beaker with 100 mL of distilled water and annealed at 37 °C for 12 h, simulating release conditions similar to contact with the human body. After caffeine release, the samples were weighed (m2) and again annealed at 50 °C for 24 h to remove water. After the final drying treatment, the samples were weighed (m3). Evaluation of the reduction in caffeine mass during the release process was performed by calculating the caffeine release rate (CR) from the following Formula (1):
CR = ( m 1 m 3 ) m 1 × 100   %

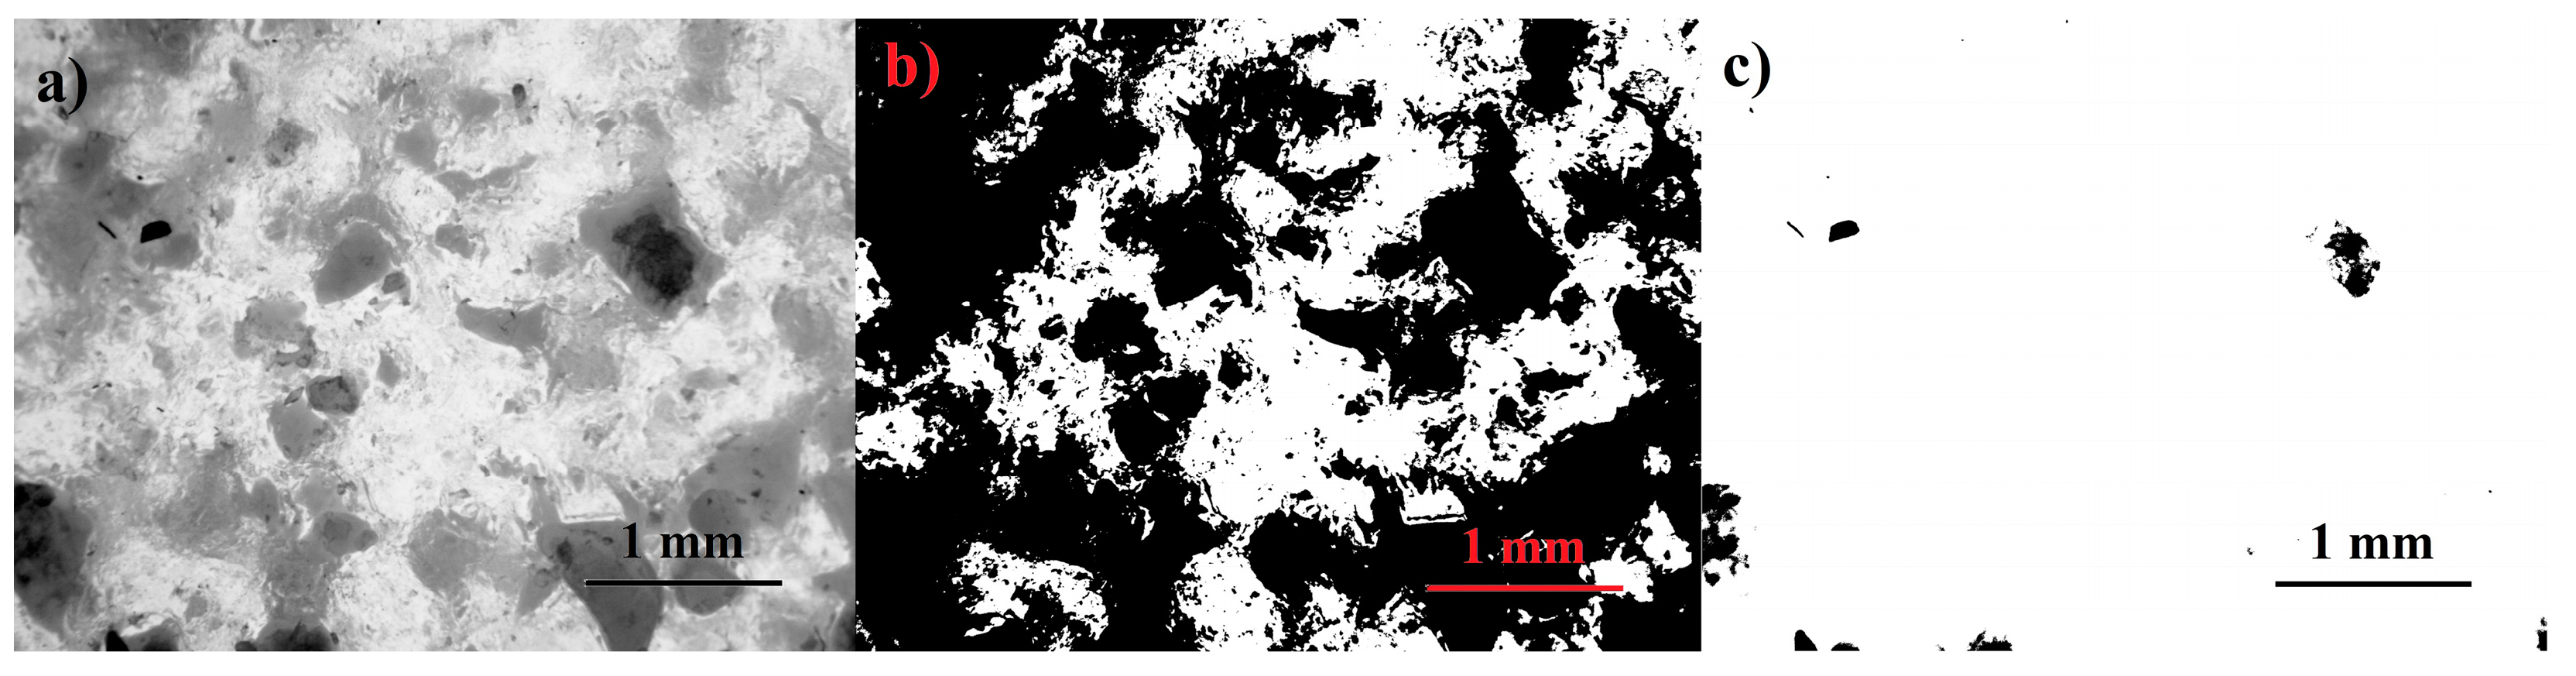
2.5.2. Global Threshold Method

Before the release process, microscopic images of the samples were taken with an Optika SZO-5 stereo microscope (OPTIKA S.r.l., Ponteranica, Italy) using a UCMOS05100KPA ToupTek camera (ToupTek Photonics, Hangzhou, China). Surface images were used to determine the approximate caffeine concentration of the sample by global image thresholding. Images of the sample structure were greyscale binarized with a fixed threshold of 200 and 50 for the caffeine located closest to the sample surface and inside the structure, respectively. The operations performed were due to the presence of black color for particles located on the surface of the sample and grey tones for particles located under the resin layer (in the volume of the material) for the original images. The result of the thresholding was histograms with the number of pixels, the counting of which made it possible to determine the percentage of caffeine in the sample. Sample images before and after thresholding are shown in Figure 1.
The caffeine content of the samples after release was determined based on the initial caffeine weight determined by thresholding (mK), and the difference in weight of the samples was determined by the weight method, as included in Equation (2) below:
CTCR = ( m 1 m 3 ) mK × 100   %
where CTCR is the coefficient of caffeine release, which is based on initial caffeine mass obtained from global threshold.

3. Results and Discussion

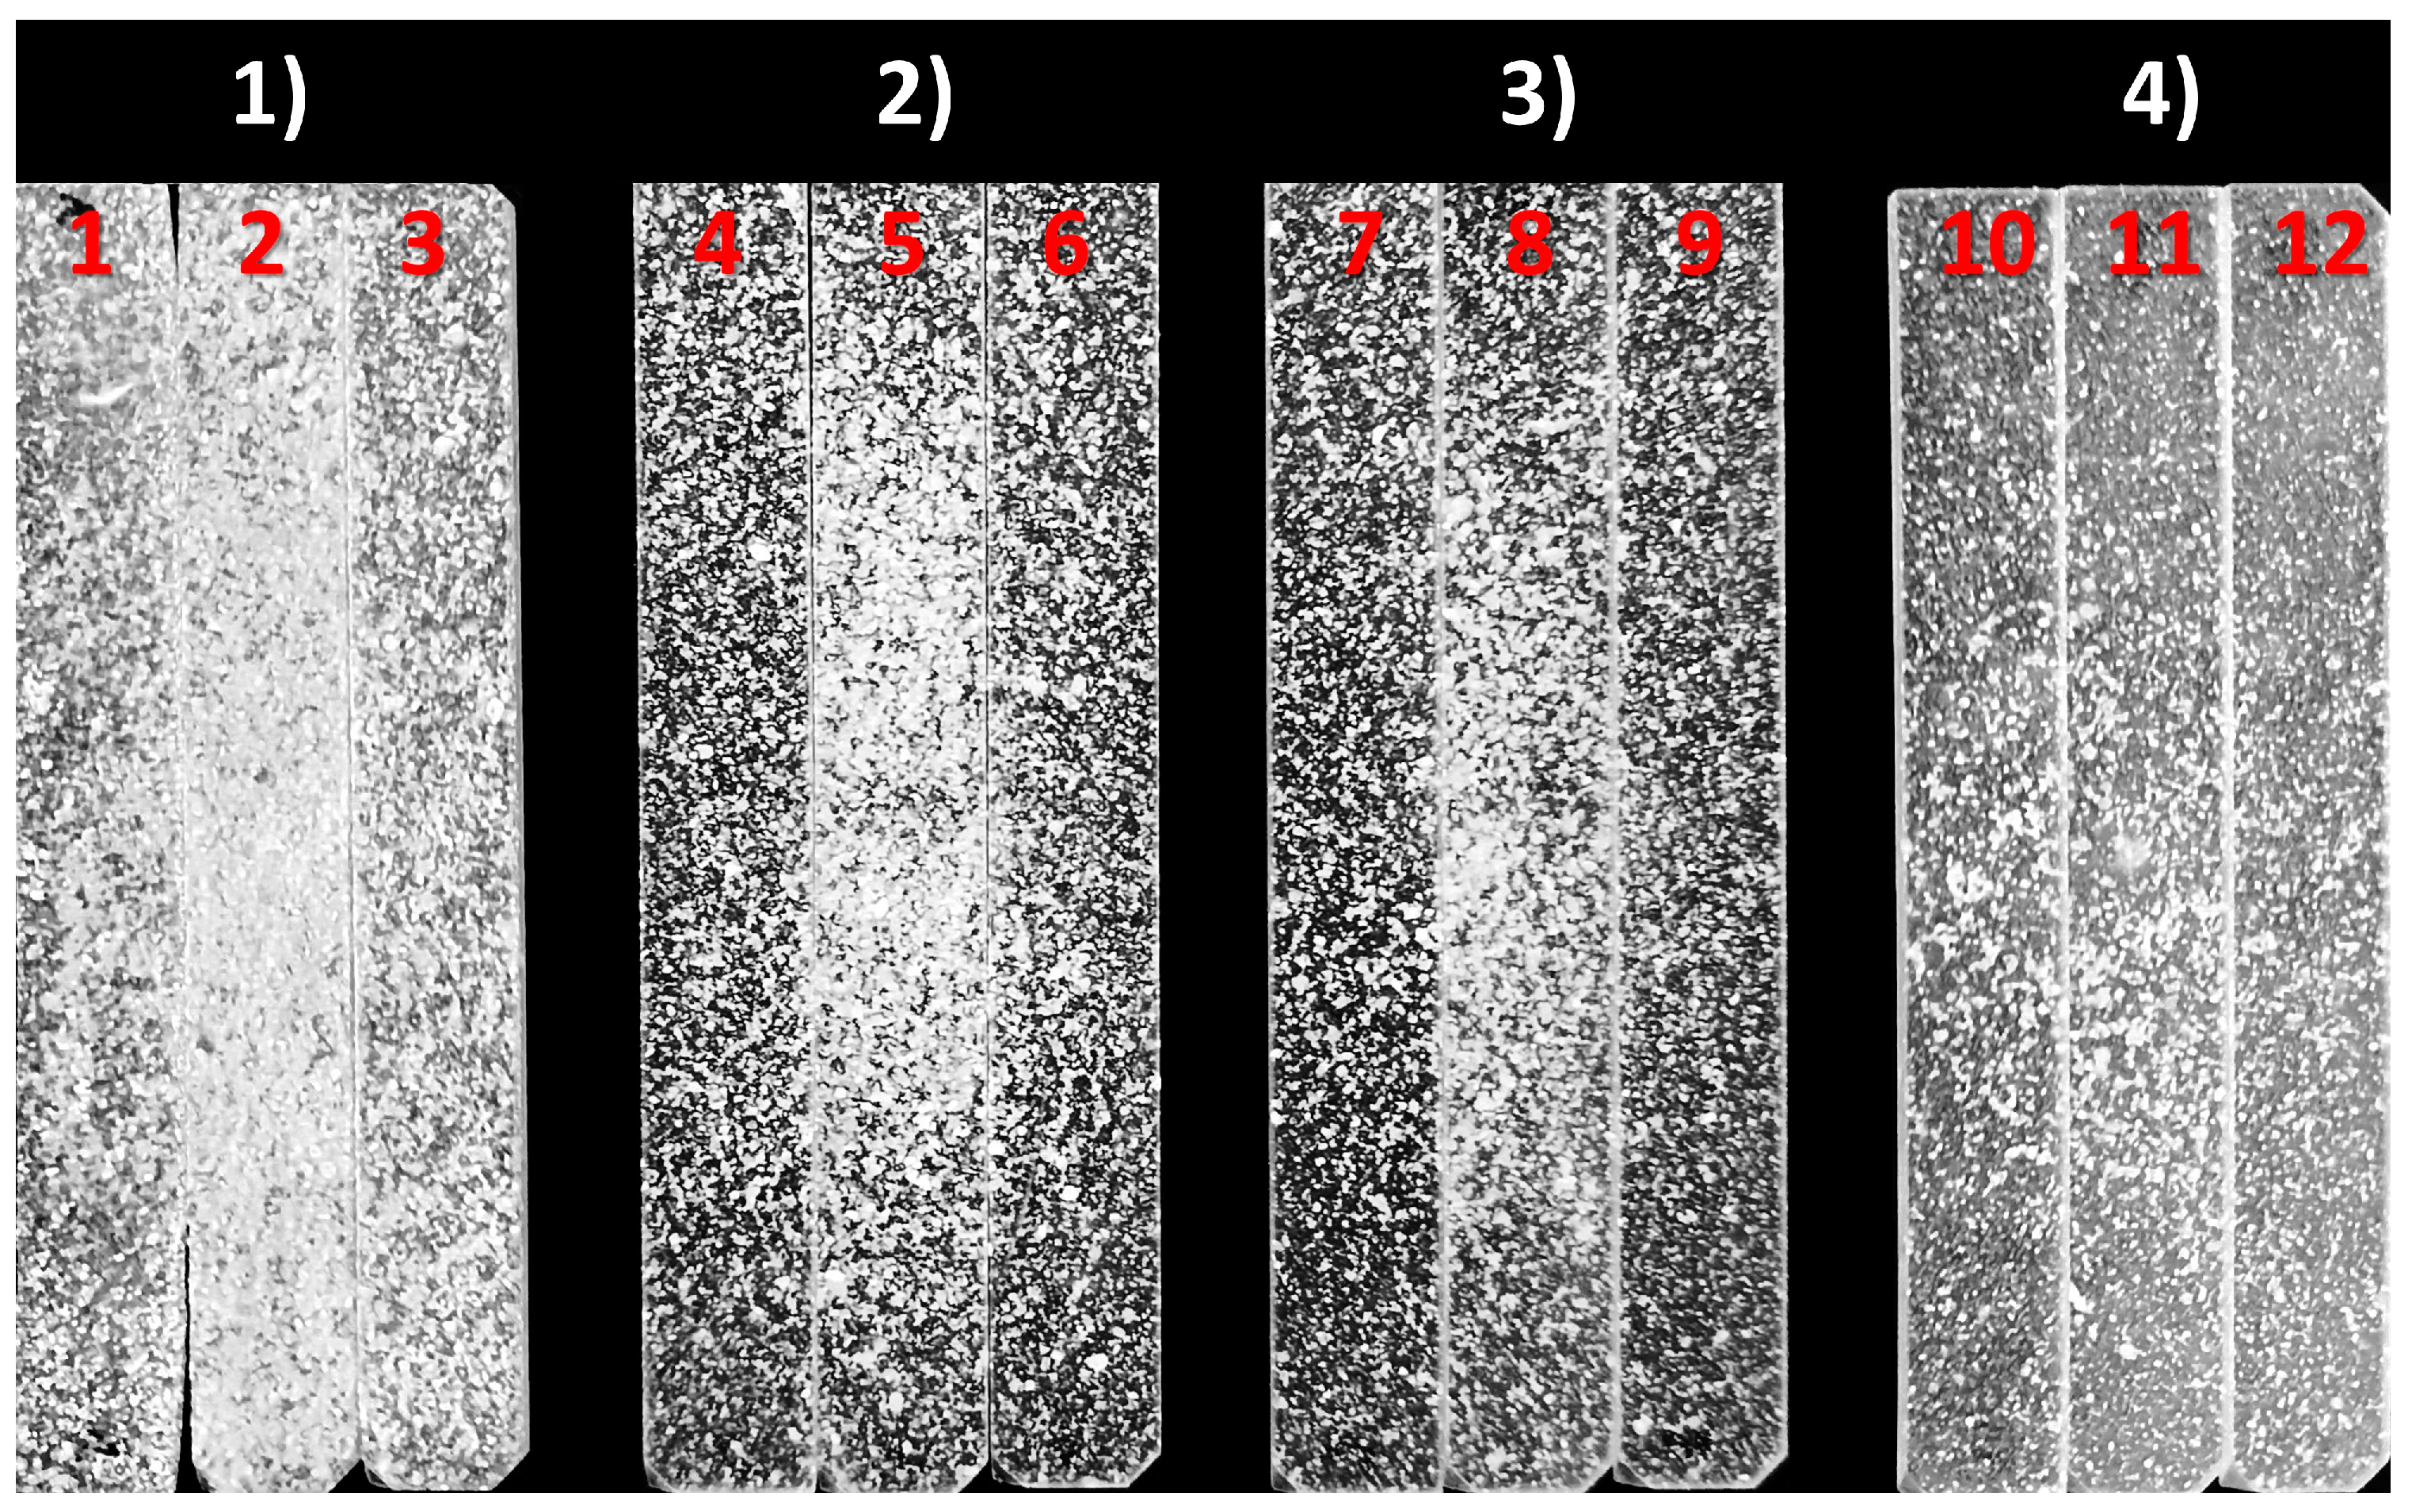
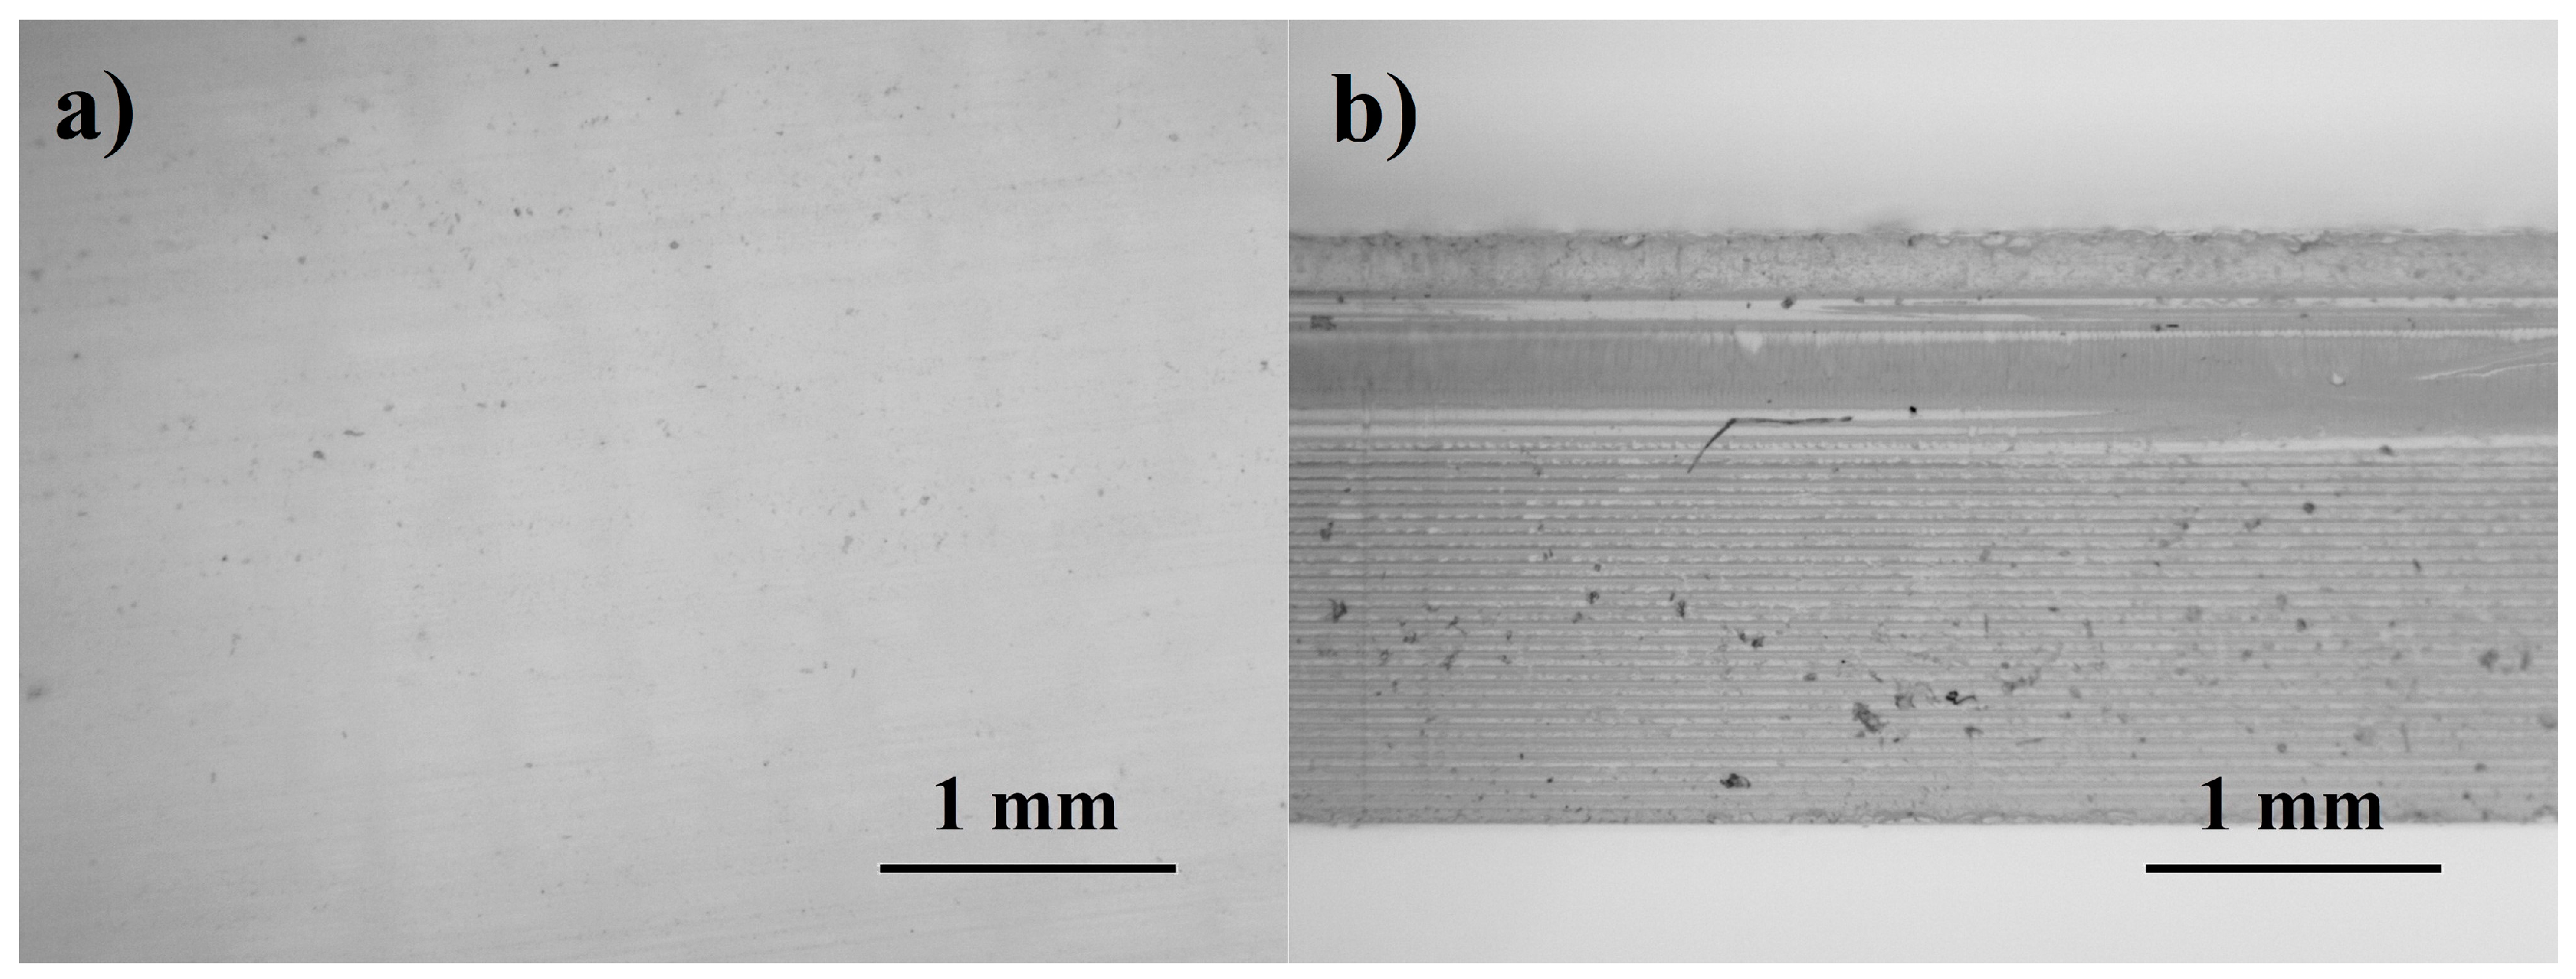
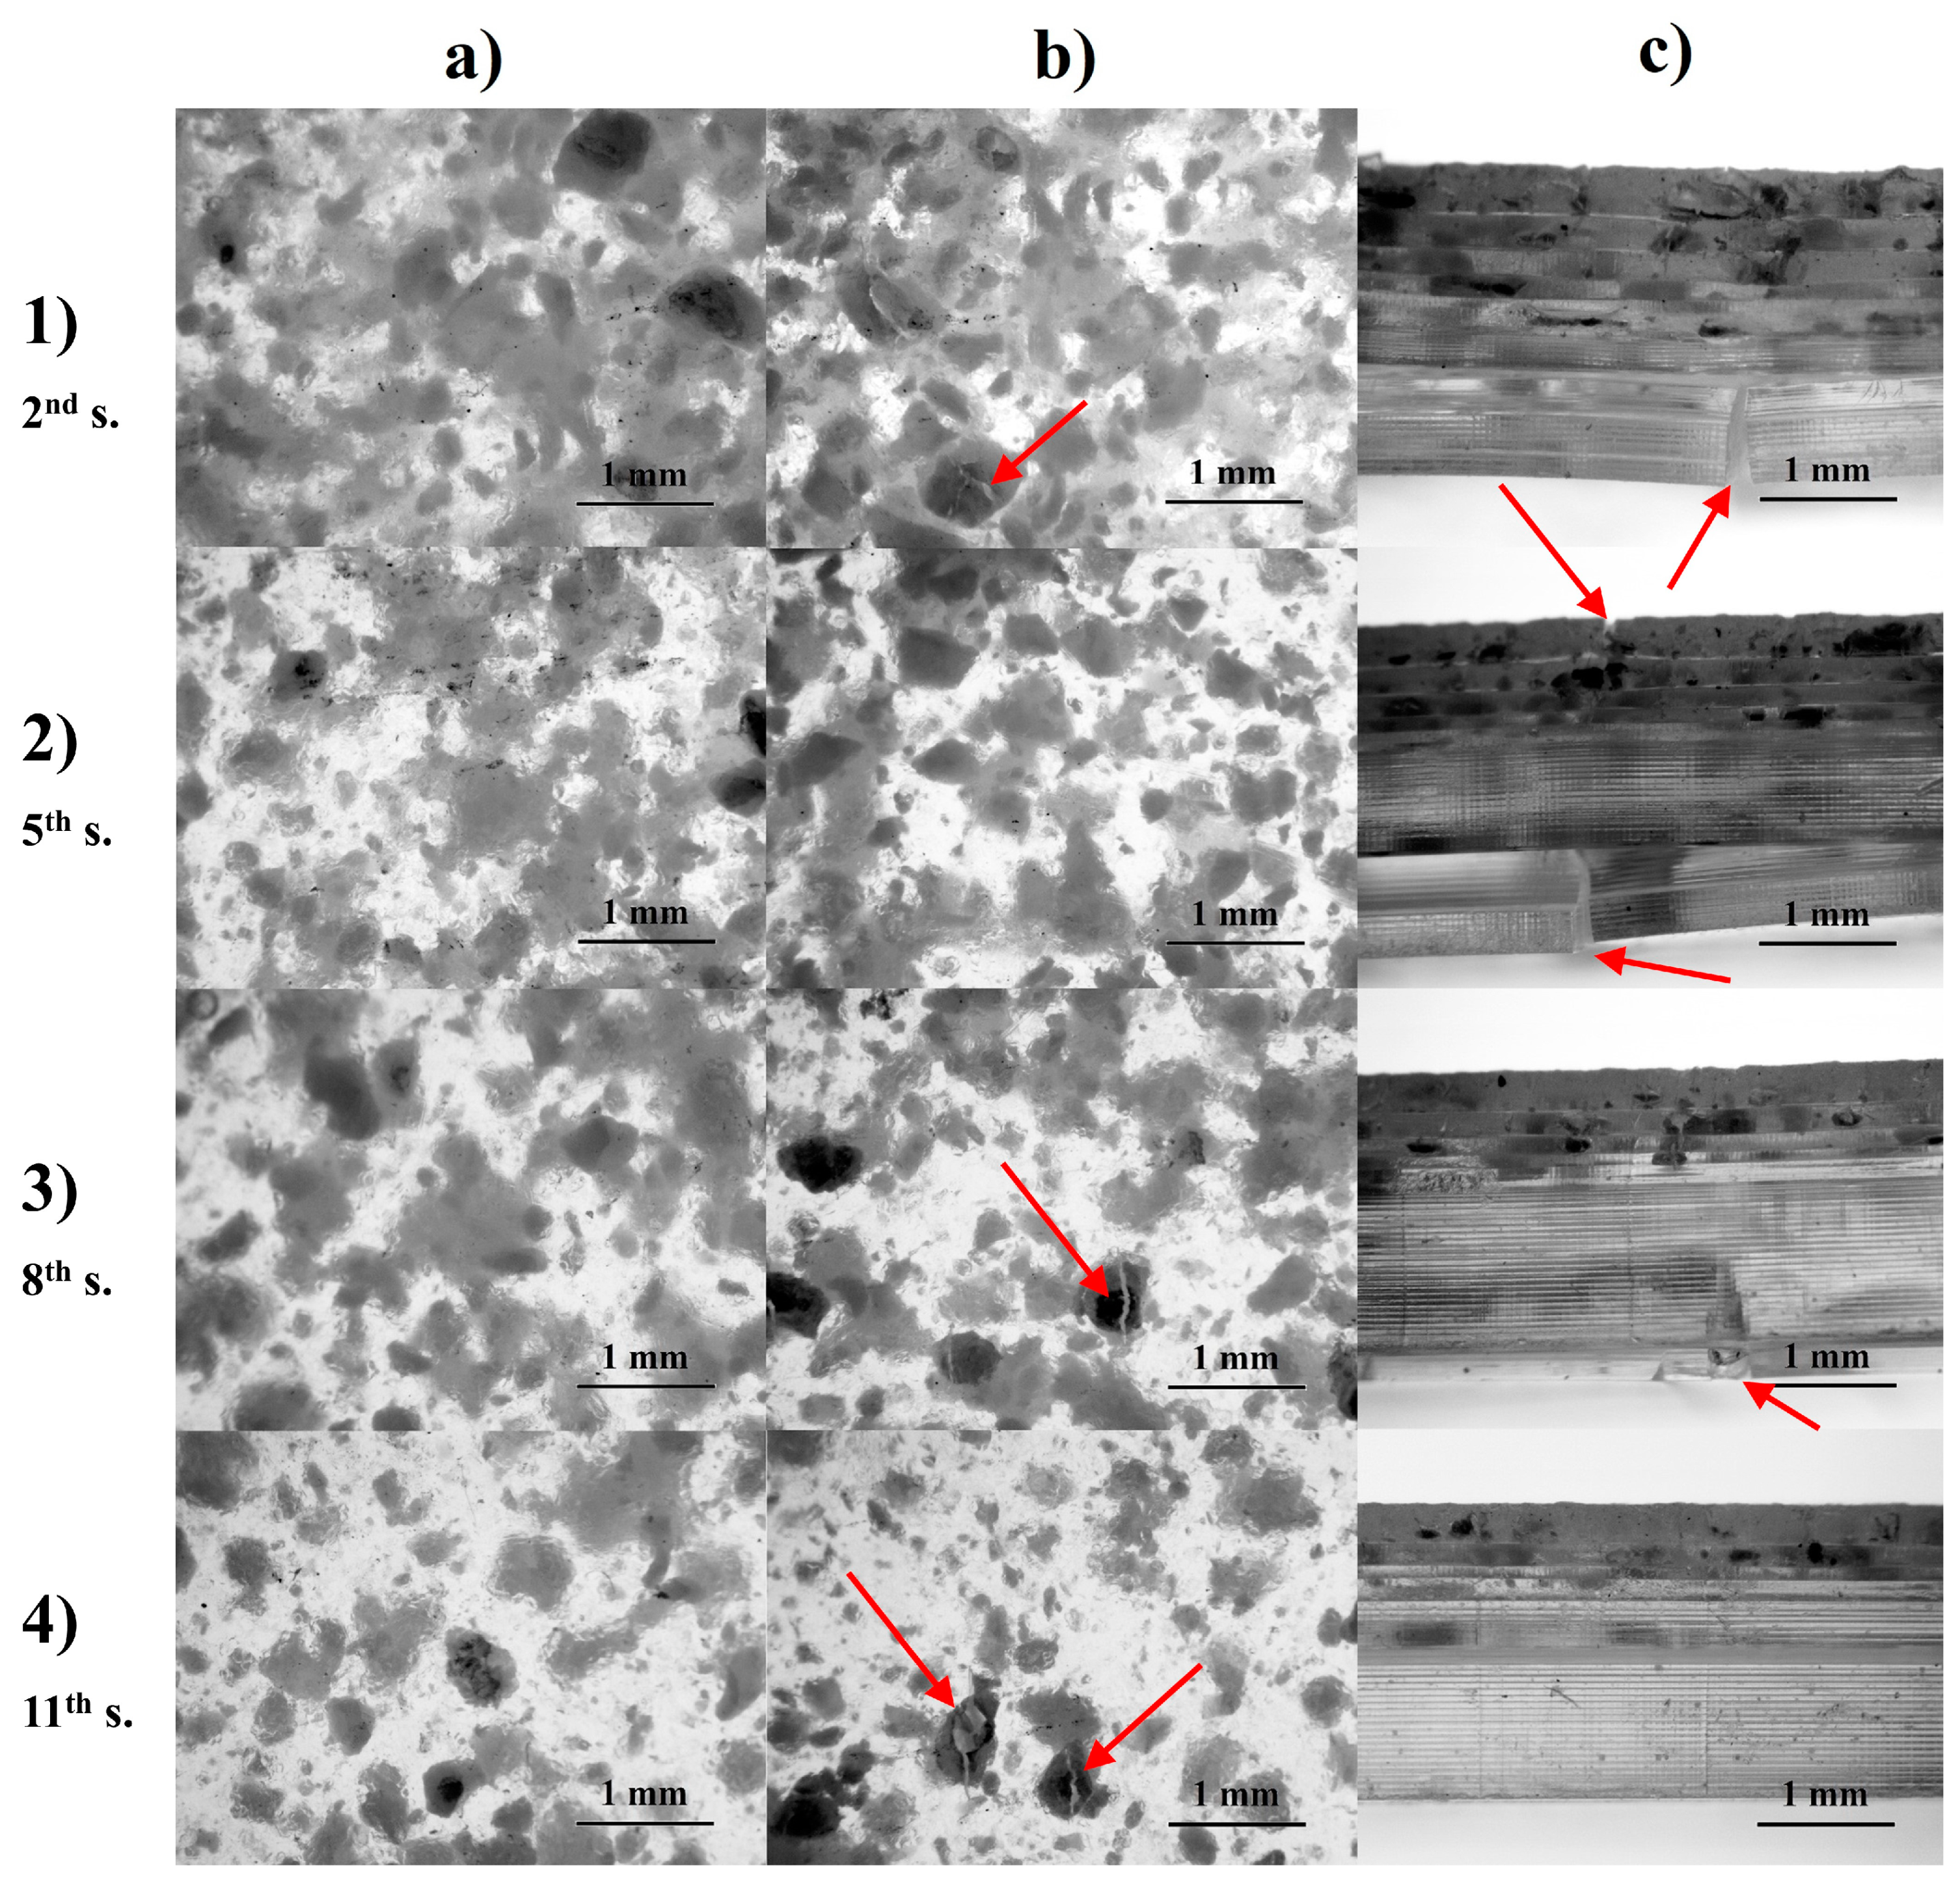
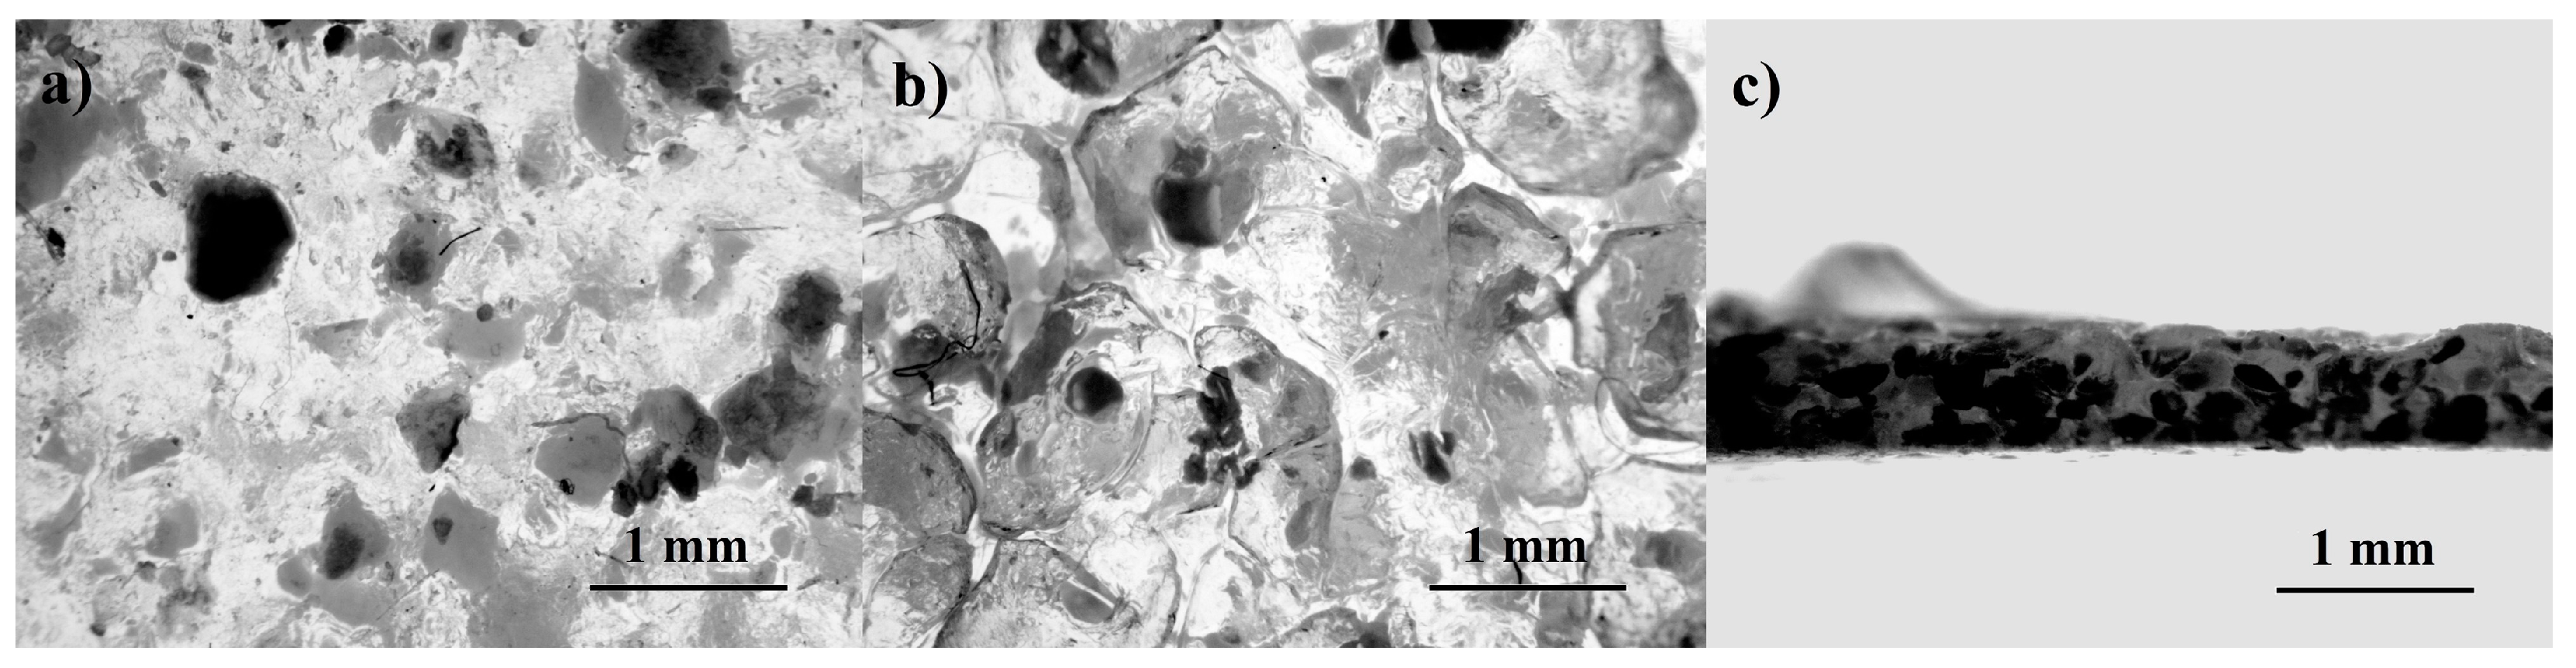
3.1. Evaluation of Manufacturing Process and Samples

Caffeineresin composite samples are shown in Figure 2. Immediately after manufacturing, all samples were flexible and easily bent in the hands, which was not the case with pure resin prints. Samples printed with Aqua Clear Resin with the same geometry immediately after manufacturing were stiff. This could result from the presence of alcohol in the structure, which, being a caffeine solvent, is also a solvent for the acrylic resin. The addition of alcohol may have disrupted the photopolymerization process by preventing the structure from fully crosslinking, extending the photopolymerization time [22].
During the (1) series manufacturing, the first sample peeled off the work table and adhered to the film in the resin tank, which was caused by too much caffeine in the resin resulted in too weak adhesion of the sample to the work table. Despite this, the printing process for the composite samples using the printing parameters suggested by the resin manufacturer proceeded without any major problems for the other samples. The caffeine content of about 4% is therefore probably the limiting content of the caffeine filler that can be added to the resin without the appearance of defects in the samples resulting from peeling off the table. The dimensions of the samples, except for sample 1, were satisfactory and ranged from 2.06 to 2.08 and from 10.00 to 10.02 for thickness and width, respectively.
According to Figure 2, it can be seen that the distribution of caffeine along the length of the sample is not uniform; there is less caffeine at the ends of the sample than in the central part. With each successive manufacturing process, there is less and less caffeine in the samples; moreover, the centre sample in each batch contains more caffeine than the outer samples. Furthermore, the less undissolved caffeine in the form of agglomerates in the resin, the more homogeneous its distribution is, as can be seen for samples 10, 11, and 12. Between manufacturing processes sedimentation of caffeine could be seen in the resin tank so that its concentration in the samples is inhomogeneous not only on the surface but throughout the whole volume.

3.2. Mechanical Testing

The tensile properties of the samples are shown in Table 4. The values of tensile strength and Young’s modulus have about 10% measurement error, while elongation has as much as 25% error. This may be explained by differences in the properties of the middle sample relative to the outer samples printed within 1 series, which can also be seen in the case of the caffeine content of the composite samples, for which the middle sample contained more caffeine than the outer samples. Despite this, the results are similar to those obtained for other commercially available resins [23].
The caffeine content of the samples affects the strength properties of the composites by decreasing the strength and increasing the Young’s modulus as the caffeine content increases. Among the reasons for this is the lack of interfacial adhesion between caffeine and resin due to the hydrophilic nature of the filler and the hydrophobic nature of the matrix, which causes a disruption in stress transfer in the structure [24]. Samples printed in the fourth series, 10, 11, and 12, have tensile strengths in the range of 16–18 MPa and Young’s modulus on the order of 830–950 MPa, so they have similar properties to pure resin samples. Thus, it can be seen that the caffeine content corresponding to samples 10–12 is a limit for the preservation of the initial mechanical properties of the samples. Sample 1 deviates in properties from the other samples due to its peeling off the table during manufacturing. Lying on the resin tank foil, the sample did not grow in thickness for a constant distance from the UV source, resulting in multiple exposures of the same layer of material so that its stiffness increased by about 30%, while the stiffness of composite samples was usually lower than that of pure resin samples.
The relative elongation values of the samples, due to the very large measurement error for resin samples, are difficult to evaluate, but a certain dependence can be seen. All composite samples exhibit lower elongation than pure resin samples. Again, the reasons can be found in the lack of interfacial adhesion between caffeine and resin and the addition of alcohol, which during manufacturing probably disturbed the photopolymerization process causing defects in the crosslinked structure of the acrylic resin reducing its strength properties [22,25].

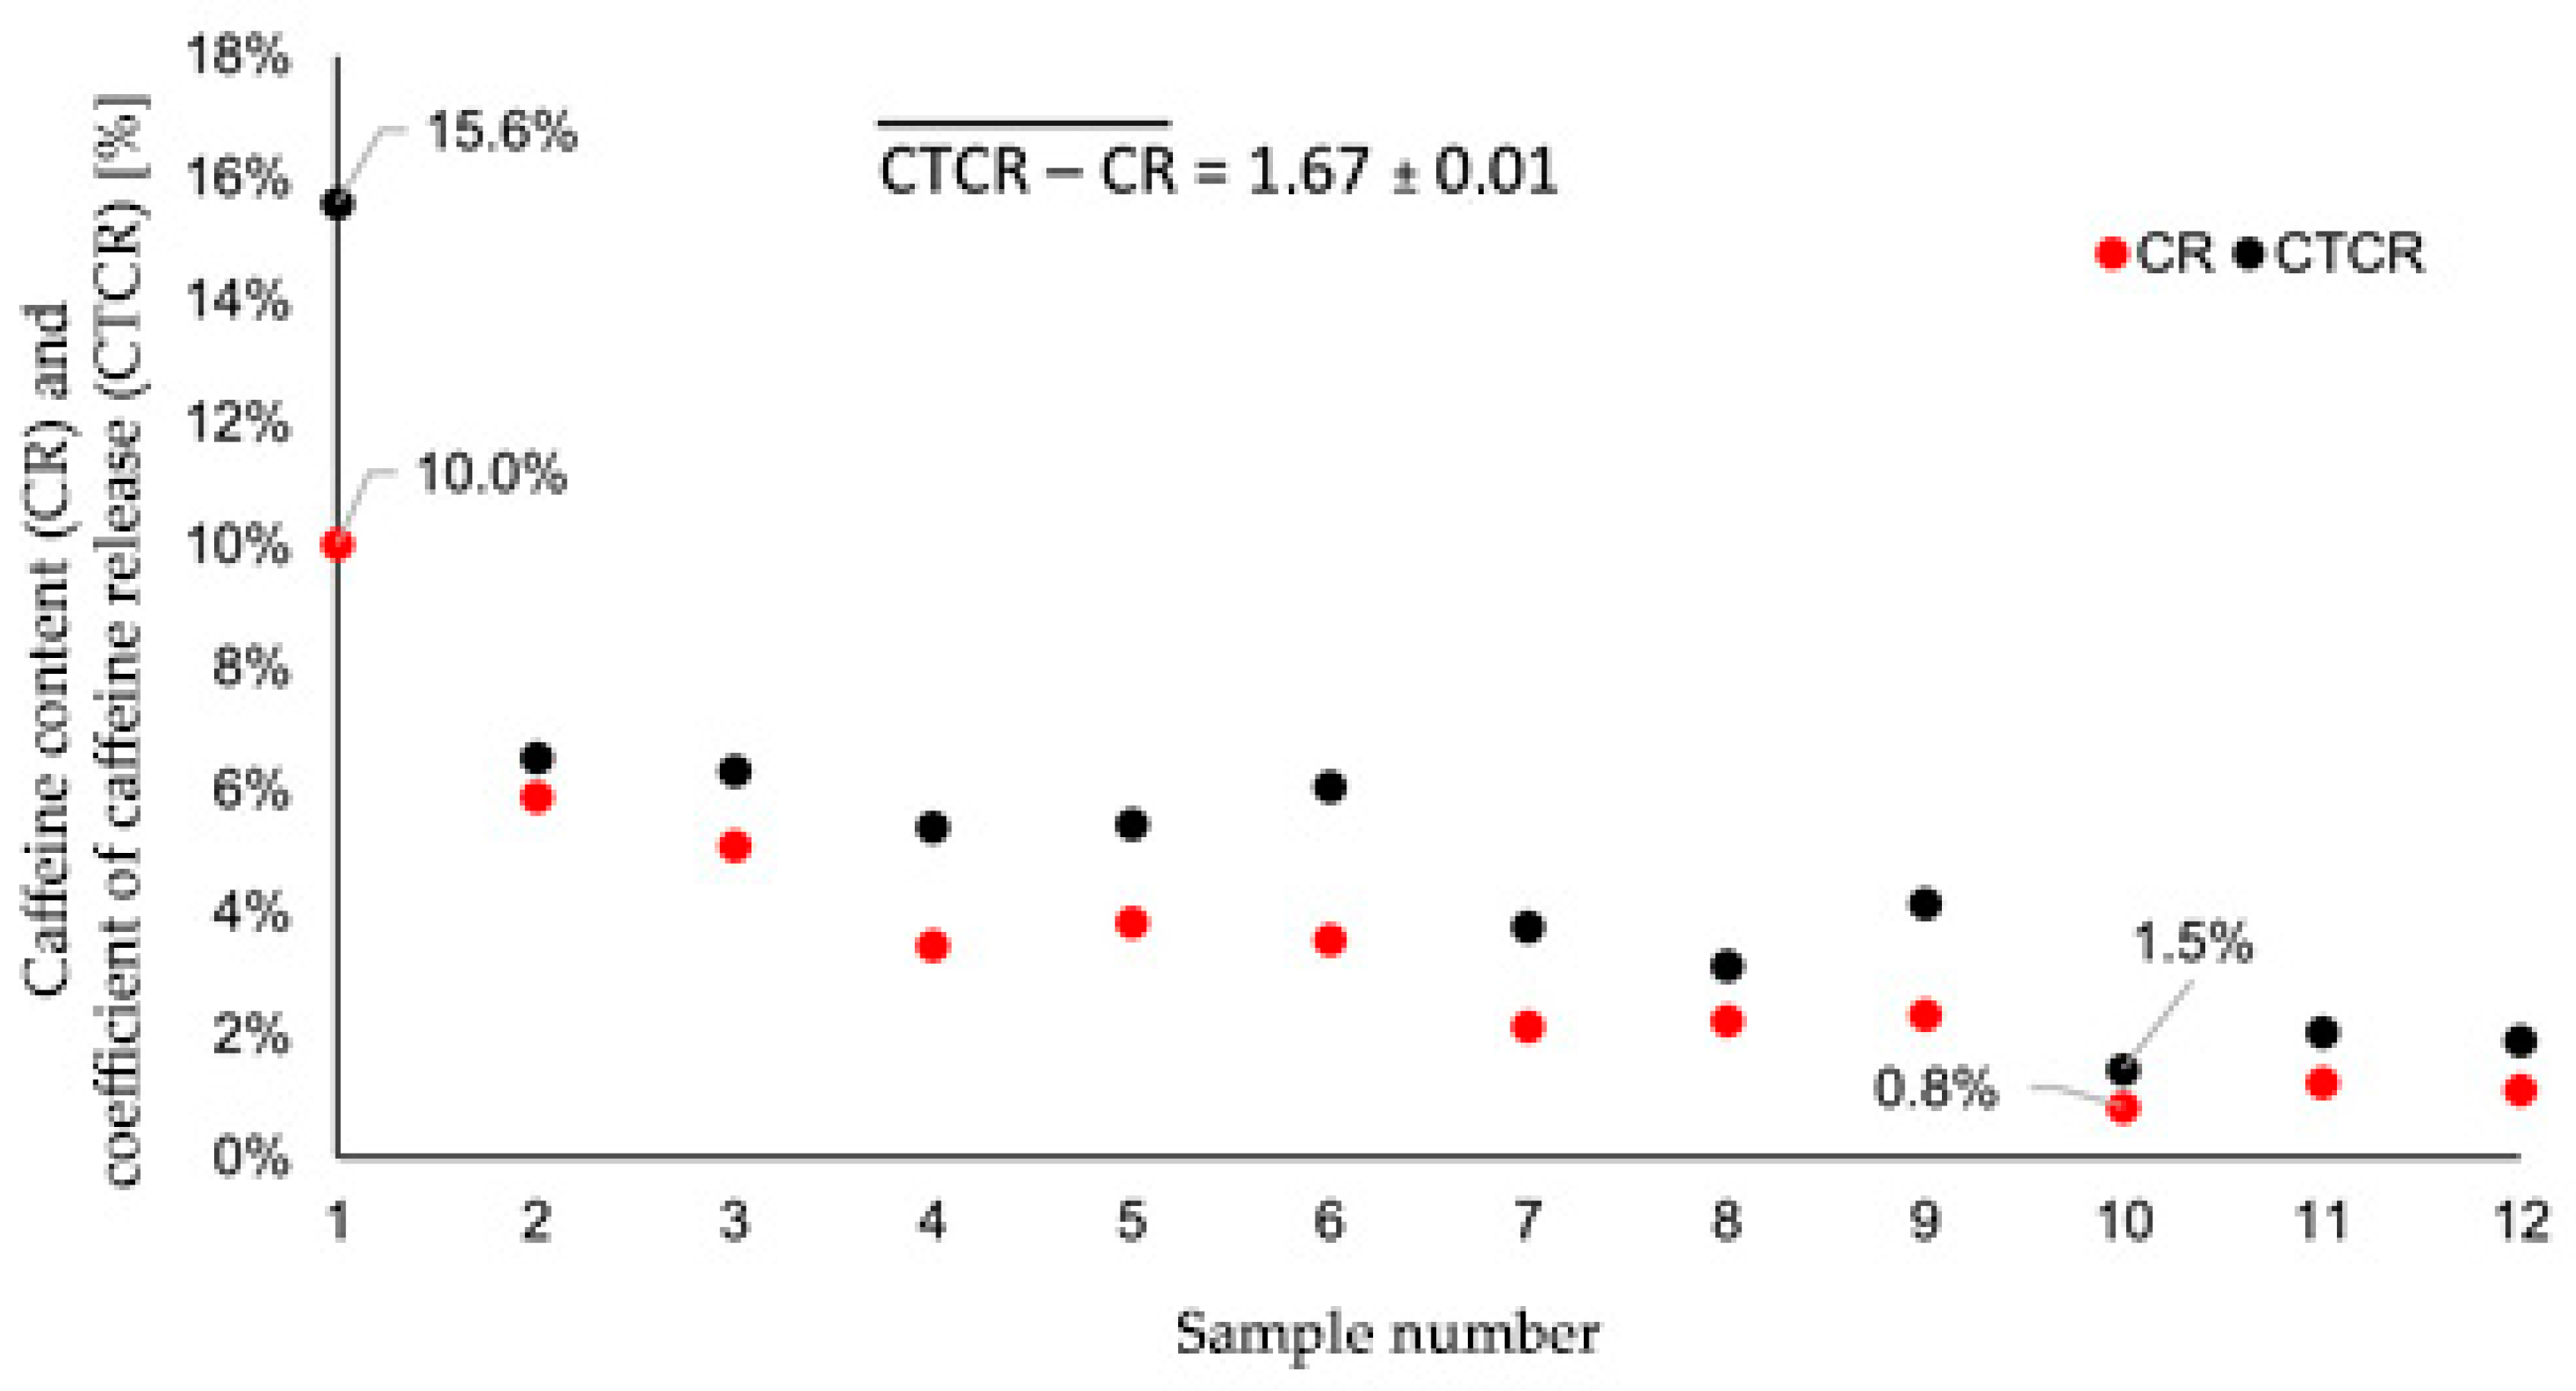
3.3. Caffeine Release

3.3.1. Gravimetric Analysis

Due to the great difficulty of precisely determining the initial and final caffeine content of the printed samples before and after the release test, a gravimetric method was used to determine the CR rate, which is limited to calculating the weight difference of the whole samples rather than the weight difference of the caffeine itself. The results of the weight measurements of the samples are given in Table 5.
The initial mass of the samples is 1.88–1.98 g depending on the series. Due to the highest caffeine content, which reduces the density of the structure as a result of the lack of interfacial interactions in the filler-matrix system, the lower initial mass is found in samples of the (1) series. Sample 1 as described earlier has the lowest mass as a result of the smallest number of printed layers.
The value of the calculated CR helps determine the system’s ability to release caffeine at 37 °C for 12 h in an aqueous environment. The largest CR values can be observed for samples 1, 2 and 3, on the order of 5–10%, while the smallest for 10, 11 and 12, on the order of 1%. This is probably due to the decrease in the amount of caffeine present in the samples with each series. The less caffeine there is in the sample, the denser the structure is, making it more difficult for polar water molecules to penetrate the structure, reaching the caffeine particles and allowing them to dissolve and diffuse through the resin volume. Presumably, the more caffeine there is in the composite, the more disrupted the resin structure is, and more pores are between the caffeine and resin, improving the accessibility of the caffeine particles to water and allowing for easier release of caffeine from the system. In the case of CR, the values of the coefficient are similar for the middle sample and the outer samples in series (3) and (4), while for series (1) and (2), a slightly higher coefficient can be observed for the middle samples. The differences in the concentration and distribution of caffeine in the sample seen in Figure 1 are therefore relevant to the caffeine release process.

3.3.2. Global Threshold Analysis

Microscopic images of the surfaces of all composite samples were used to determine the degree of caffeine release based on global thresholding. Table 6 shows the numerical results obtained.
The total caffeine percentage mK determined by thresholding decreases with each series and reaches values that are larger for the middle samples than for the outer samples within each series, which agrees with previous observations. The CTCR coefficient values differ from the CR values and are larger for all samples. As a general rule, no significant improvement in release can be seen for the middle samples relative to the outer samples when the release is evaluated on the basis of the CTCR coefficient.
The global thresholding method refers to operations based on a 2D image [26] and has other limitations such as choosing the right threshold, the quality of the initial image, ignoring the relationships between pixels [27,28,29] important due to the research performed. The sample is a 3D element and the distribution of caffeine over the height of the sample is not homogeneous, as can be seen by comparing the pure resin reference sample shown in Figure 3 with the composite samples shown in Figure 4. There is more caffeine in the surface layers of the composite samples than in the bottom layers, adjacent to the work table during manufacturing. The reason for this is the sedimentation mentioned above, whereby the undissolved caffeine macromolecules sank to the bottom during manufacturing. The vertical up-and-down movement of the working table was unable to ensure sufficient mixing of the resin-caffeine solution during manufacturing.
In relation to the volumetric distribution of caffeine particles in the resin, the global thresholding method has some limitations. If the caffeine particles occur one below the other, they are visible as one particle in the surface image by which, after binarization of the image, the two particles are read by the software as one set of pixels. In addition, the arrangement of the particles also matters—for example, a flake-shaped particle angled will be determined to be smaller in volume. Therefore, global thresholding is an indicative method to assess caffeine release.
Figure 4b,c show numerous cracks in the samples in both the top layers, where more caffeine was present, and the bottom layers. Cracks were not present anywhere in the samples before release and probably appeared as a result of the accelerated release of caffeine at elevated temperatures. Furthermore, the caffeine, as an opaque medium, may have acted as a barrier to UV radiation, so the resin surrounding the caffeine may have been underexposed causing a reduction in the strength of the structure at these locations.
As the amount of caffeine in the sample decreases, a change in the trend of cracks can be seen; for the samples in the fourth series, cracks occurred mainly on the surface of the sample and not mainly in the bottom layers as before, as represented by the photos of sample 11. This is probably related to the presence of the largest caffeine agglomerates just on the surface due to sedimentation in previous sample series. Furthermore, the particles inside samples 10, 11, and 12 were small enough not to cause the samples to crack at the base during release. It is noteworthy that the samples with the smallest caffeine content underwent the smallest deformation during release and visually most closely resemble the reference sample in Figure 3.
The cracks in samples resulting from the caffeine release had a significant effect on the sample surface microscopic images, what made it impossible to assess the after release caffeine content using the global thresholding method. For this reason, the difference in the masses of the samples before and after release determined by the gravimetric method was used to calculate the CTCR coefficient rather than the caffeine mass after release determined from thresholding.
Based on the results of CTCR and CR, it can be evaluated whether the thresholding method can give results comparable to the gravimetric method. The values of the individual coefficients are presented in the graph in Figure 5. The CTCR coefficient obtains similar values to CR for most samples except for the first sample, which, due to the incorrect manufacturing process, was characterized by the worst structure properties: roughness, delamination, numerous caffeine particles protruding beyond the resin surface, insufficient thickness and under-crosslinked structure, which can be seen in Figure 6 in the form of numerous cavities and cracks in the sample surface layer. The quality of sample 1 determines the limiting value of caffeine that can be added to the resin to carry out the correct manufacturing process. Caffeine concentration of 4% or higher resulted in none of the samples in the series were printed correctly. In the case of sample 1, where caffeine was present throughout the sample, the mK value determined by global thresholding was underestimated due to the presence of particles in the entire volume of the structure, which are less visible in microscopic images of the structure, making the CTCR ratio as much as 5.6 percentage points higher than the CR ratio.
In the remaining samples with the proper geometry, based on Figure 4c, the caffeine particles in the sample are estimated to occur at a depth of around 0.5–1 mm from the surface. This contributed to the small differences in CTCR versus CR values due to the distribution of caffeine at shallow depth, a situation similar to the occurrence of caffeine only at the surface of the sample, which reduced the influence of particle distribution in space, increasing the correctness of the global thresholding method.

4. Conclusions

The present study succeeded in obtaining bio-composite samples made of photocurable acrylic resin and caffeine. On the basis of visual and strength tests, it can be concluded that the maximum weight content of caffeine in the resin to produce samples with acceptable performance is approximately 4%, which met the assumptions. A very important aspect of samples with undissolved filler particles is their dispersion in the matrix material, which in the case of the samples obtained was increasingly favourable as the concentration of caffeine decreased. Nevertheless, the manufacturing process of the composite samples was successful for a filler content not exceeding 4%, which meets the authors’ goals.
The static tensile testing of the samples shows that the strength properties of the composites deteriorate with an increase in filler content, which is in line with the literature knowledge on the weakening of composites with a decrease in interactions between the hydrophilic filler and hydrophobic matrix, as was the case with the samples obtained.
However, weak interfacial interactions proved beneficial from the perspective of caffeine release from the system as expected. According to the release studies conducted, the effect of the amount of caffeine on the course of release can be observed. The more caffeine in the sample, probably, the easier it is for the caffeine to escape from the photopolymer structure due to disruption of the resin crosslinking process, which also affects the strength properties of the samples. The dynamic release of caffeine by increasing the temperature of the water during the release caused cracking of the samples in both the top and bottom layers of the sample, while increasing the caffeine content and the larger particle size intensifies this effect.
The global thresholding method proved to be helpful in evaluating the caffeine content of the samples before the release study, but it cannot replace the gravimetric method, which was proven by the significant differences in the caffeine content results of the composites obtained from the thresholding method and the gravimetric method. In the case of composites where particles are mainly distributed near the surface thanks to the thresholding method similar release results can be determined but for samples where particle dispersion runs throughout the volume of the samples, the results obtained were unreliable. Despite this, the thresholding method can be considered helpful for evaluating the presence of macromolecules in composites with limited filler solubility in the matrix, as was the case with caffeine and acrylic resin.
The DLP process is a promising method for obtaining composite systems of hydrophilic pharmaceutically active substances with hydrophobic resins used in additive manufacturing methods. This method, despite some limitations, is a potential method for obtaining composite transdermal systems, especially as a result of the high precision of the obtained parts. Thus, it is important to conduct further work on improving the technique for obtaining bio-composites with constituent materials of different polarity.

Author Contributions

Conceptualization, D.T. and W.K.; Methodology, D.T. and R.W.; Validation, R.W.; Formal analysis, D.T.; Investigation, D.T.; Resources, R.W. and W.K.; Writing—original draft, D.T.; Writing—review and editing, D.T. and R.W.; Funding acquisition, W.K. All authors have read and agreed to the published version of the manuscript.

Funding

This research was funded by statutory activity financed by the Polish Ministry of Science and Higher Education, grant number (0613/SBAD/4770).

Data Availability Statement

Not applicable.

Conflicts of Interest

The authors declare no conflict of interest.

References

  1. El Aita, I.; Ponsar, H.; Quodbach, J. A critical review on 3D-printed dosage forms. Curr. Pharm. Des. 2018, 24, 4957–4978. [Google Scholar] [CrossRef] [PubMed]
  2. Herrada-Manchón, H.; Rodríguez-González, D.; Alejandro Fernández, M.; Suñé-Pou, M.; Pérez-Lozano, P.; García-Montoya, E.; Aguilar, E. 3D printed gummies: Personalized drug dosage in a safe and appealing way. Int. J. Pharm. 2020, 587, 119687. [Google Scholar] [CrossRef] [PubMed]
  3. Charoo, N.A.; Barakh Ali, S.F.; Mohamed, E.M.; Kuttolamadom, M.A.; Ozkan, T.; Khan, M.A.; Rahman, Z. Selective Laser Sintering 3D Printing—An Overview of the Technology and Pharmaceutical Applications. Drug Dev. Ind. Pharm. 2020, 46, 869–877. [Google Scholar] [CrossRef]
  4. Scoutaris, N.; Ross, S.A.; Douroumis, D. 3D Printed “Starmix” Drug Loaded Dosage Forms for Paediatric Applications. Pharm. Res. 2018, 35, 34. [Google Scholar] [CrossRef]
  5. Yu, D.G.; Yang, X.L.; Huang, W.D.; Liu, J.; Wang, Y.G.; Xu, H. Tablets with Material Gradients Fabricated by Three-Dimensional Printing. J. Pharm. Sci. 2007, 96, 2446–2456. [Google Scholar] [CrossRef] [PubMed]
  6. Goole, J.; Amighi, K. 3D printing in pharmaceutics: A new tool for designing customized drug delivery systems. Int. J. Pharm. 2016, 499, 376–394. [Google Scholar] [CrossRef]
  7. Melchels, F.P.W.; Feijen, J.; Grijpma, D.W. A review on stereolithography and its applications in biomedical engineering. Biomaterials 2010, 31, 6121–6130. [Google Scholar] [CrossRef] [PubMed] [Green Version]
  8. Maines, E.M.; Porwal, M.K.; Ellison, C.J.; Reineke, T.M. Sustainable advances in SLA/DLP 3D printing materials and processes. Green Chem. 2021, 23, 6863–6897. [Google Scholar] [CrossRef]
  9. Wang, J.; Goyanes, A.; Gaisford, S.; Basit, A.W. Stereolithographic (SLA) 3D printing of oral modified-release dosage forms. Int. J. Pharm. 2016, 503, 207–212. [Google Scholar] [CrossRef]
  10. Palo, M.; Holländer, J.; Suominen, J.; Yliruusi, J.; Sandler, N. 3D printed drug delivery devices: Perspectives and technical challenges. Expert Rev. Med. Devices 2017, 14, 685–696. [Google Scholar] [CrossRef]
  11. Kadry, H.; Wadnap, S.; Xu, C.; Ahsan, F. Digital light processing (DLP) 3D-printing technology and photoreactive polymers in fabrication of modified-release tablets. Eur. J. Pharm. Sci. 2019, 135, 60–67. [Google Scholar] [CrossRef] [PubMed]
  12. Robles-Martinez, P.; Xu, X.; Trenfield, S.J.; Awad, A.; Goyanes, A.; Telford, R.; Basti, A.W.; Gaisford, S. 3D Printing of a Multi-Layered Polypill Containing Six Drugs Using a Novel Stereolithographic Method. Pharmaceutics 2019, 11, 274. [Google Scholar] [CrossRef] [PubMed] [Green Version]
  13. Kundu, A.; Arnett, P.; Bagde, A.; Azim, N.; Kouagou, E.; Singh, M.; Rajaraman, S. DLP 3D Printed “Intelligent” Microneedle Array (iμNA) for Stimuli Responsive Release of Drugs and Its in Vitro and ex Vivo Characterization. J. Microelectromechanical Syst. 2020, 29, 685–691. [Google Scholar] [CrossRef]
  14. Lim, S.H.; Kathuria, H.; Amir, M.H.B.; Zhang, X.; Duong, H.T.T.; Chi-Lui Ho, P.; Kang, L. High resolution photopolymer for 3D printing of personalised microneedle for transdermal delivery of anti-wrinkle small peptide. J. Control. Release 2021, 329, 907–918. [Google Scholar] [CrossRef]
  15. Badruddoza, A.Z.M.; Godfrin, P.D.; Myerson, A.S.; Trout, B.L.; Doyle, P.S. Core–Shell Composite Hydrogels for Controlled Nanocrystal Formation and Release of Hydrophobic Active Pharmaceutical Ingredients. Adv. Healthc. Mater. 2016, 5, 1960–1968. [Google Scholar] [CrossRef] [PubMed]
  16. Himawan, A.; Anjani, Q.K.; Detamornrat, U.; Vora, L.K.; Permana, A.D.; Ghanma, R.; Naser, Y.; Rahmawanty, D.; Scott, C.J.; Donnelly, R.F. Multifunctional low temperature-cured PVA/PVP/citric acid-based hydrogel forming microarray patches: Physicochemical characteristics and hydrophilic drug interaction. Eur. Polym. J. 2023, 186, 111836. [Google Scholar] [CrossRef]
  17. Huang, L.; Himawan, E.; Belhadj, S.; Oswaldo Pérez García, R.; Durand, F.P.; Schipper, N.; Buzgo, M.; Simaite, A.; Marigo, V. Efficient Delivery of Hydrophilic Small Molecules to Retinal Cell Lines Using Gel Core-Containing Solid Lipid Nanoparticles. Pharmaceutics 2022, 14, 74. [Google Scholar] [CrossRef]
  18. Roy, A.; Ray, P.G.; Bose, A.; Dhara, S.; Pal, S. pH-Responsive Copolymeric Network Gel Using Methacrylated β-Cyclodextrin for Controlled Codelivery of Hydrophilic and Hydrophobic Drugs. ACS Appl. Bio Mater. 2022, 5, 3530–3543. [Google Scholar] [CrossRef]
  19. Chandran, R.; Tohit, M.R.E.; Stanslas, J.; Salim, N.; Mazlelaa, T.M.T. Investigation and Optimization of Hydrogel Microneedles for Transdermal Delivery of Caffeine. Tissue Eng. Part C Methods 2022, 10, 545–556. [Google Scholar] [CrossRef]
  20. Safety Data Sheet for Aqua Clear Resin by Phrozen. Available online: https://drive.google.com/file/d/1NR46rNJ1z3yM8TRqyZ5TOedubqhtr4II/view (accessed on 27 February 2023).
  21. Safety Data Sheet for Caffeine. Available online: https://www.sigmaaldrich.com/PL/en/product/sial/c0750 (accessed on 27 February 2023).
  22. Ye, Q.; Spencer, P.; Wang, Y.; Misra, A. Relationship of solvent to the photopolymerization process, properties, and structure in model dentin adhesives. J. Biomed. Mater. Res. Part A 2007, 80, 342–350. [Google Scholar] [CrossRef] [Green Version]
  23. Bochnia, J. A Study of the Mechanical Properties of Naturally Aged Photopolymers Printed Using the PJM Technology. Materials 2023, 16, 400. [Google Scholar] [CrossRef]
  24. Zeng, Q.H.; Xu, W.; Yu, A.B.; Paul, D.R. Quantification of the Interface Interactions in Polymer Nanocomposites. Mater. Sci. Forum 2010, 654–656, 2608–2611. [Google Scholar] [CrossRef]
  25. Hu, K.; Kong, W.; Fu, X.; Zhou, C.; Lei, L. Resistivity optimization and properties of silver nanoparticles-filled alcohol-soluble conductive coating based on acrylic resin. High Perform. Polym. 2015, 27, 930–938. [Google Scholar] [CrossRef]
  26. Padmasini, N.; Umamaheswari, R.; Sikkandar, M.Y. Chapter 10-State-of-the-Art of Level-Set Methods in Segmentation and Registration of Spectral Domain Optical Coherence Tomographic Retinal Images. In Soft Computing Based Medical Image Analysis, 1st ed.; Dey, N., Ashour, A.S., Shi, F., Balas, V.E., Eds.; Academic Press: Cambridge, MA, USA, 2018; pp. 163–181. [Google Scholar] [CrossRef]
  27. Davies, E.R. The Role of thresholding. In Computer Vision, 5th ed.; Davies, E.R., Ed.; Academic Press: Cambridge, MA, USA, 2018. [Google Scholar] [CrossRef]
  28. Rashidi, B.; Rashidi, B. Implementation of a High Speed Technique for Character Segmentation of License Plate Based on Thresholding Algorithm. Int. J. Image Graph. Signal Process. 2012, 4, 9–18. [Google Scholar] [CrossRef] [Green Version]
  29. Chaubey, A.K. Comparison of the local and global thresholding methods in image segmentation. J. Res. Rev. 2016, 2, 1–4. [Google Scholar]
Figure 1. Images of 2nd sample (a) raw image from stereo microscope observations, (b) image after binarization with threshold of 50, and (c) image after binarization with threshold of 200.
Designs 07 00049 g001
Figure 2. An illustrative image of 12 composite samples from series: (1), (2), (3), (4).
Designs 07 00049 g002
Figure 3. Images of the surface (a) and side (b) of the resin sample.
Designs 07 00049 g003
Figure 4. Images of the 2nd, 5th, 8th, and 11th composite sample (a) surfaces before releasing, (b) surfaces after releasing, and (c) sides after releasing. Red arrows indicate cracks.
Designs 07 00049 g004
Figure 5. Graph of caffeine content and coefficient of caffeine release of the samples.
Designs 07 00049 g005
Figure 6. Images of 1st sample (a) surface before releasing, (b) surface after releasing, (c) side after releasing.
Designs 07 00049 g006
Table 1. Aqua Clear Resin properties [20].
ParameterValue
Density1.11 g/cm3
Melting pointBelow 25 °C—liquid state
at operating temperature
Solubility in alcohol+
Table 2. Caffeine properties.
ParameterValue
Density1.23 g/cm3 [21]
Melting point234–236.5 °C [21]
Maximum solubility in alcohol0.02 g/mL in 75 °C
Table 3. DLP manufacturing parameters.
ParameterValue
Layer height0.05 mm
Bottom exposure time35 s
Transition layer count (TL)6
Bottom layer count6
Exposure time10.5 s
Transition typelinear
Rest time before lift0 s
Rest time after lift0 s
Rest time after retract4 s
Bottom lift distance6 mm
Lifting distance6 mm
Bottom lift speed150 mm/min
Bottom retract speed150 mm/min
Bottom layer compensationa = 0 mm, b = −0.04 mm
Table 4. Mechanical parameters of resin and composite samples.
SeriesSampleσm (MPa)E (MPa)εB (%)
(0)0.1–0.918.2 ± 1.9834 ± 10116.1 ± 4.0
(1)112.611002.1
27.95035.6
38.54389.6
(2)410.750710.7
510.353010.3
69.948010.0
(3)713.97039.6
812.96828.8
912.361211.9
(4)1018.69589.00
1115.68317.0
1216.38577.0
Table 5. Masses of composite samples: initial—m0, after drying—m1, after release—m2, and subsequent drying—m3.
SeriesSamplem0 (g)m1 (g)m2 (g)m3 (g)CR (%)
10.570.530.580.4810.0
(1)21.901.882.021.765.9
31.881.862.011.765.1
41.961.942.121.873.5
(2)51.971.952.131.873.8
61.951.922.101.863.6
71.971.952.131.902.2
(3)81.981.962.131.912.3
91.961.942.121.892.4
101.981.962.141.940.8
(4)111.981.962.131.931.2
121.961.942.111.921.1
Table 6. Percentage of caffeine on the surface and in the volume of the sample, and caffeine mass determined from thresholding.
SeriesSampleSurface
Caffeine—
IKS (%)
Internal
Caffeine—
IKI (%)
All Caffeine—IK =
IKS + IKI (%)
mK =
m1 × IK (g)
CTCR (%)
11.263.064.20.3415.6
(1)20.689.690.21.696.5
30.180.480.51.506.3
40.164.064.11.245.4
(2)50.569.870.31.375.4
60.258.558.81.136.1
70.057.457.41.123.8
(3)80.071.471.41.403.2
90.256.857.01.104.1
100.457.057.41.121.5
(4)110.260.160.31.182.1
120.158.058.11.131.9
Disclaimer/Publisher’s Note: The statements, opinions and data contained in all publications are solely those of the individual author(s) and contributor(s) and not of MDPI and/or the editor(s). MDPI and/or the editor(s) disclaim responsibility for any injury to people or property resulting from any ideas, methods, instructions or products referred to in the content.

