

Influence of the Distribution and Level of Post-Tensioning Force on the Punching Shear of Flat Slabs

Abstract
:1. Introduction and Background
2. Experimental Program
3. Material Properties
4. Test Set-Up and Loading Protocol
5. Test Results and Discussion
5.1. Failure Modes
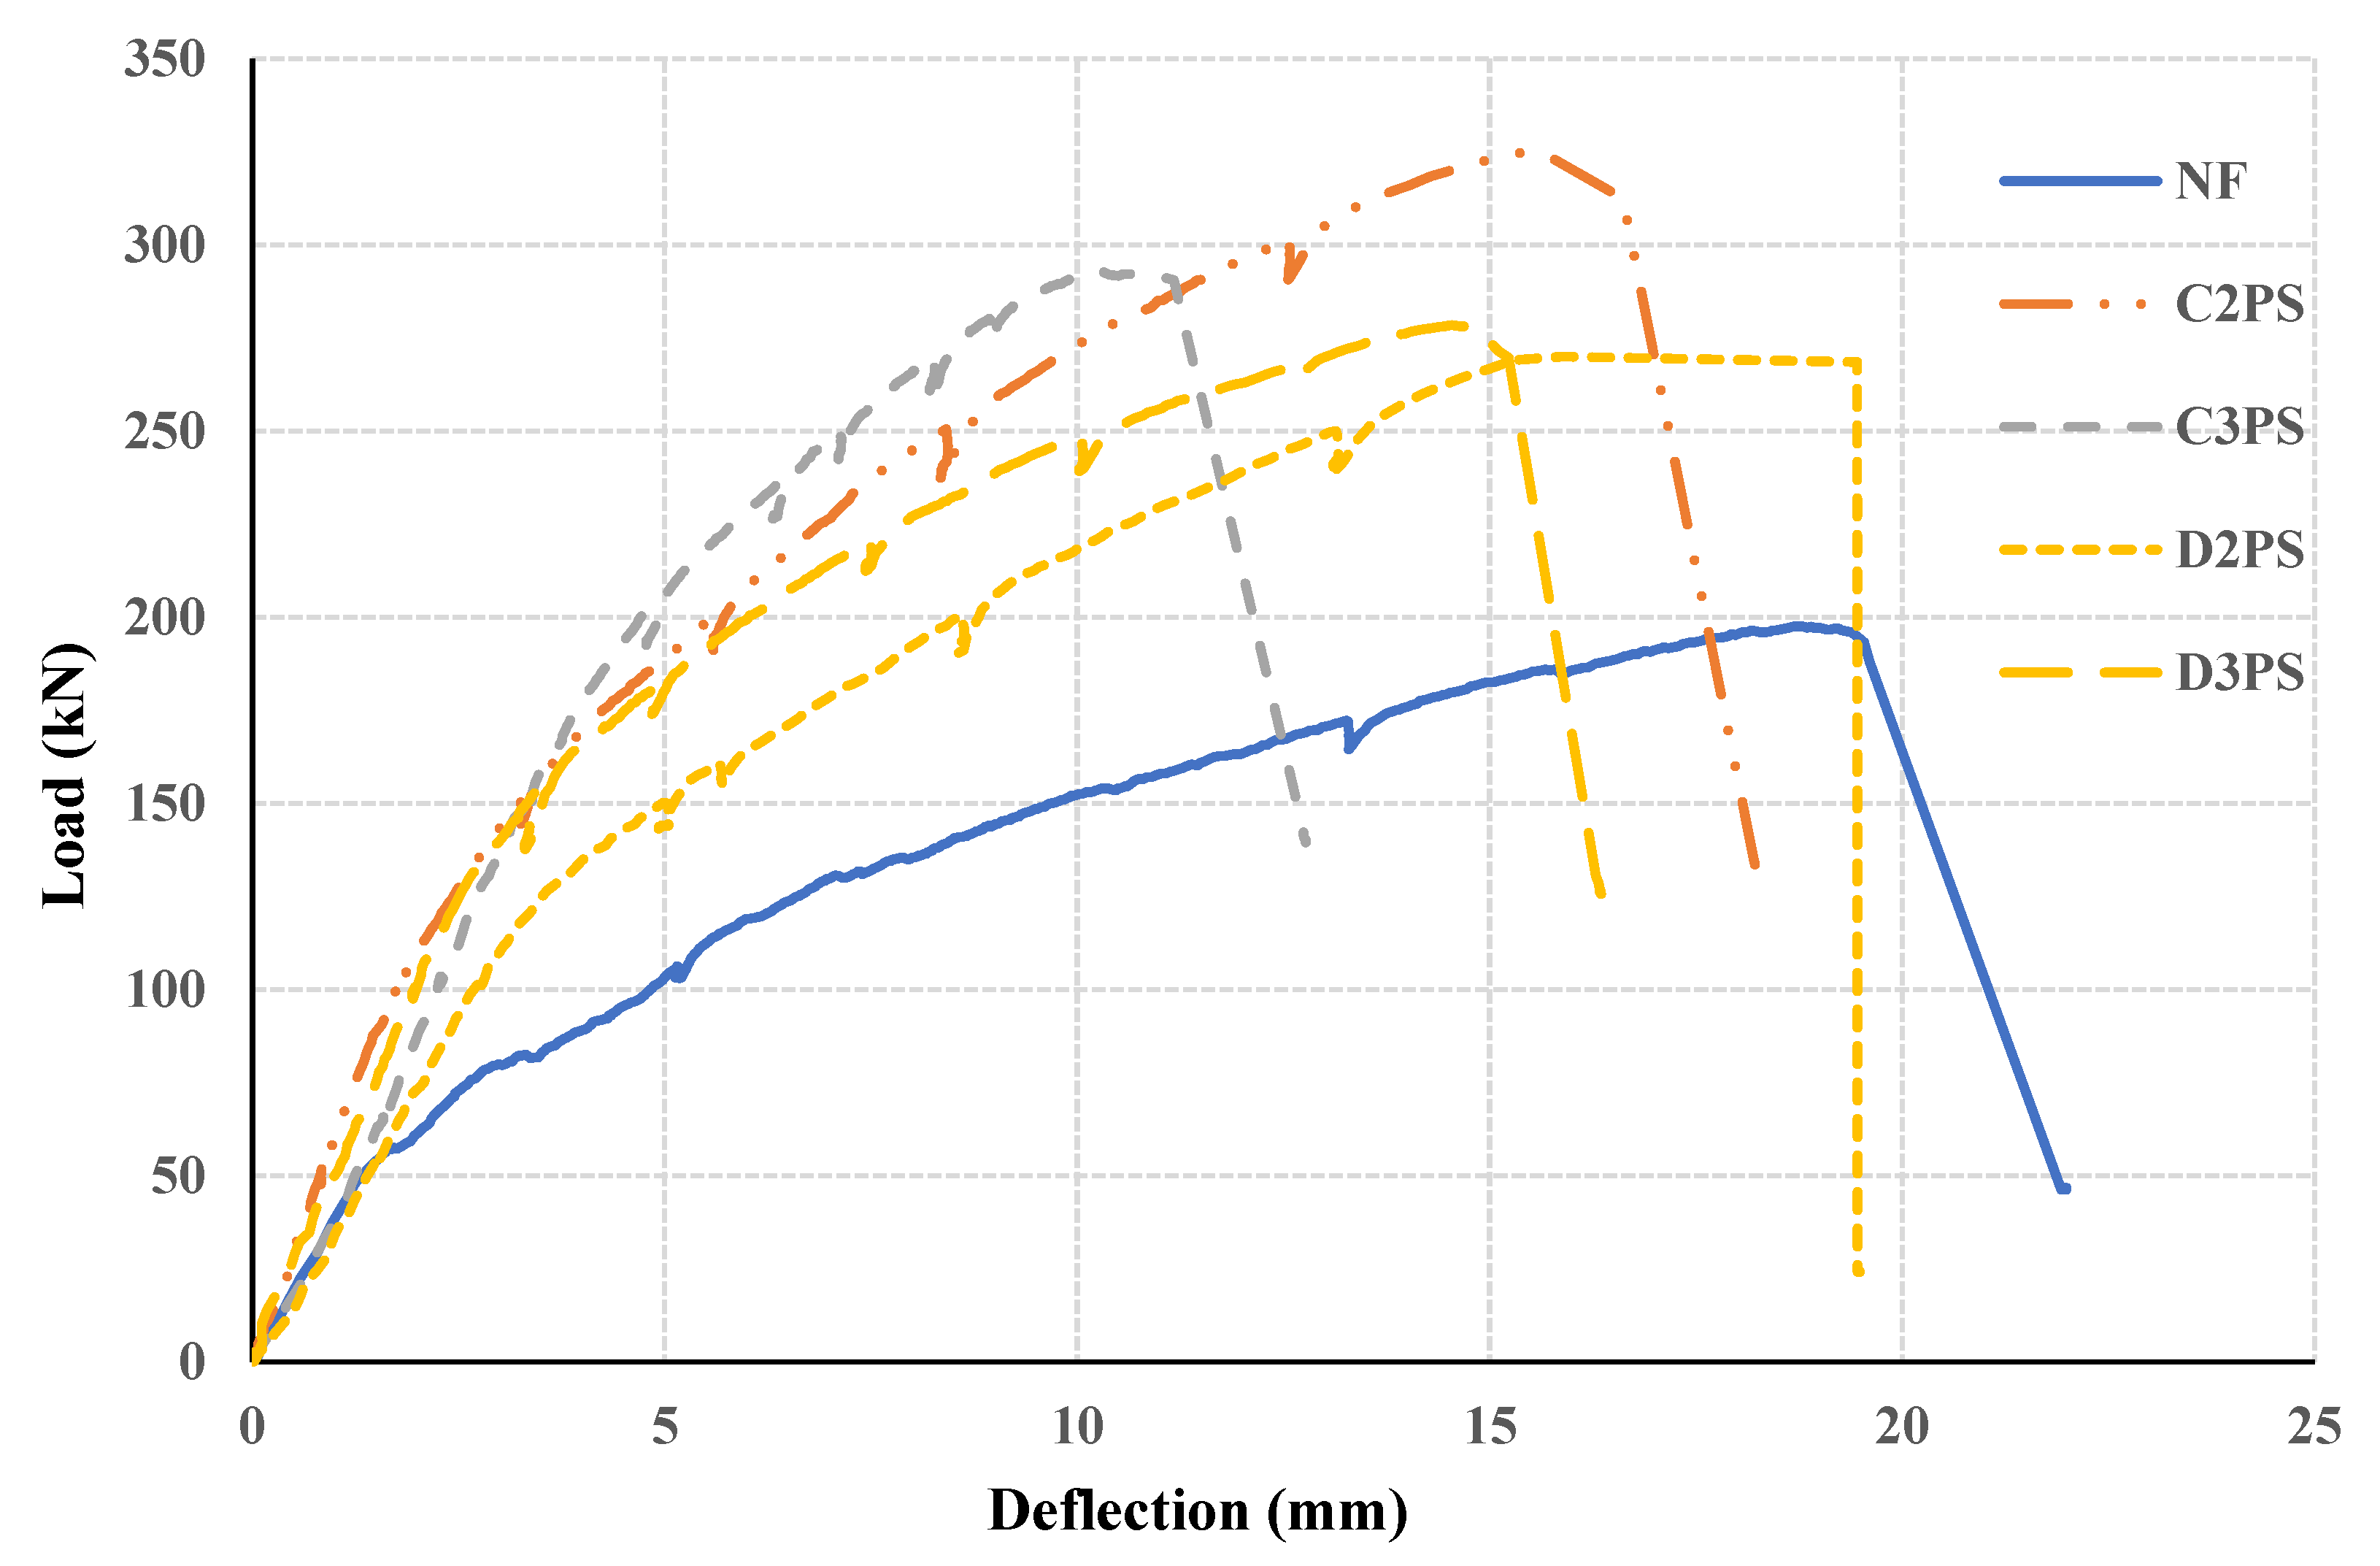
5.2. Load–Deflection Response
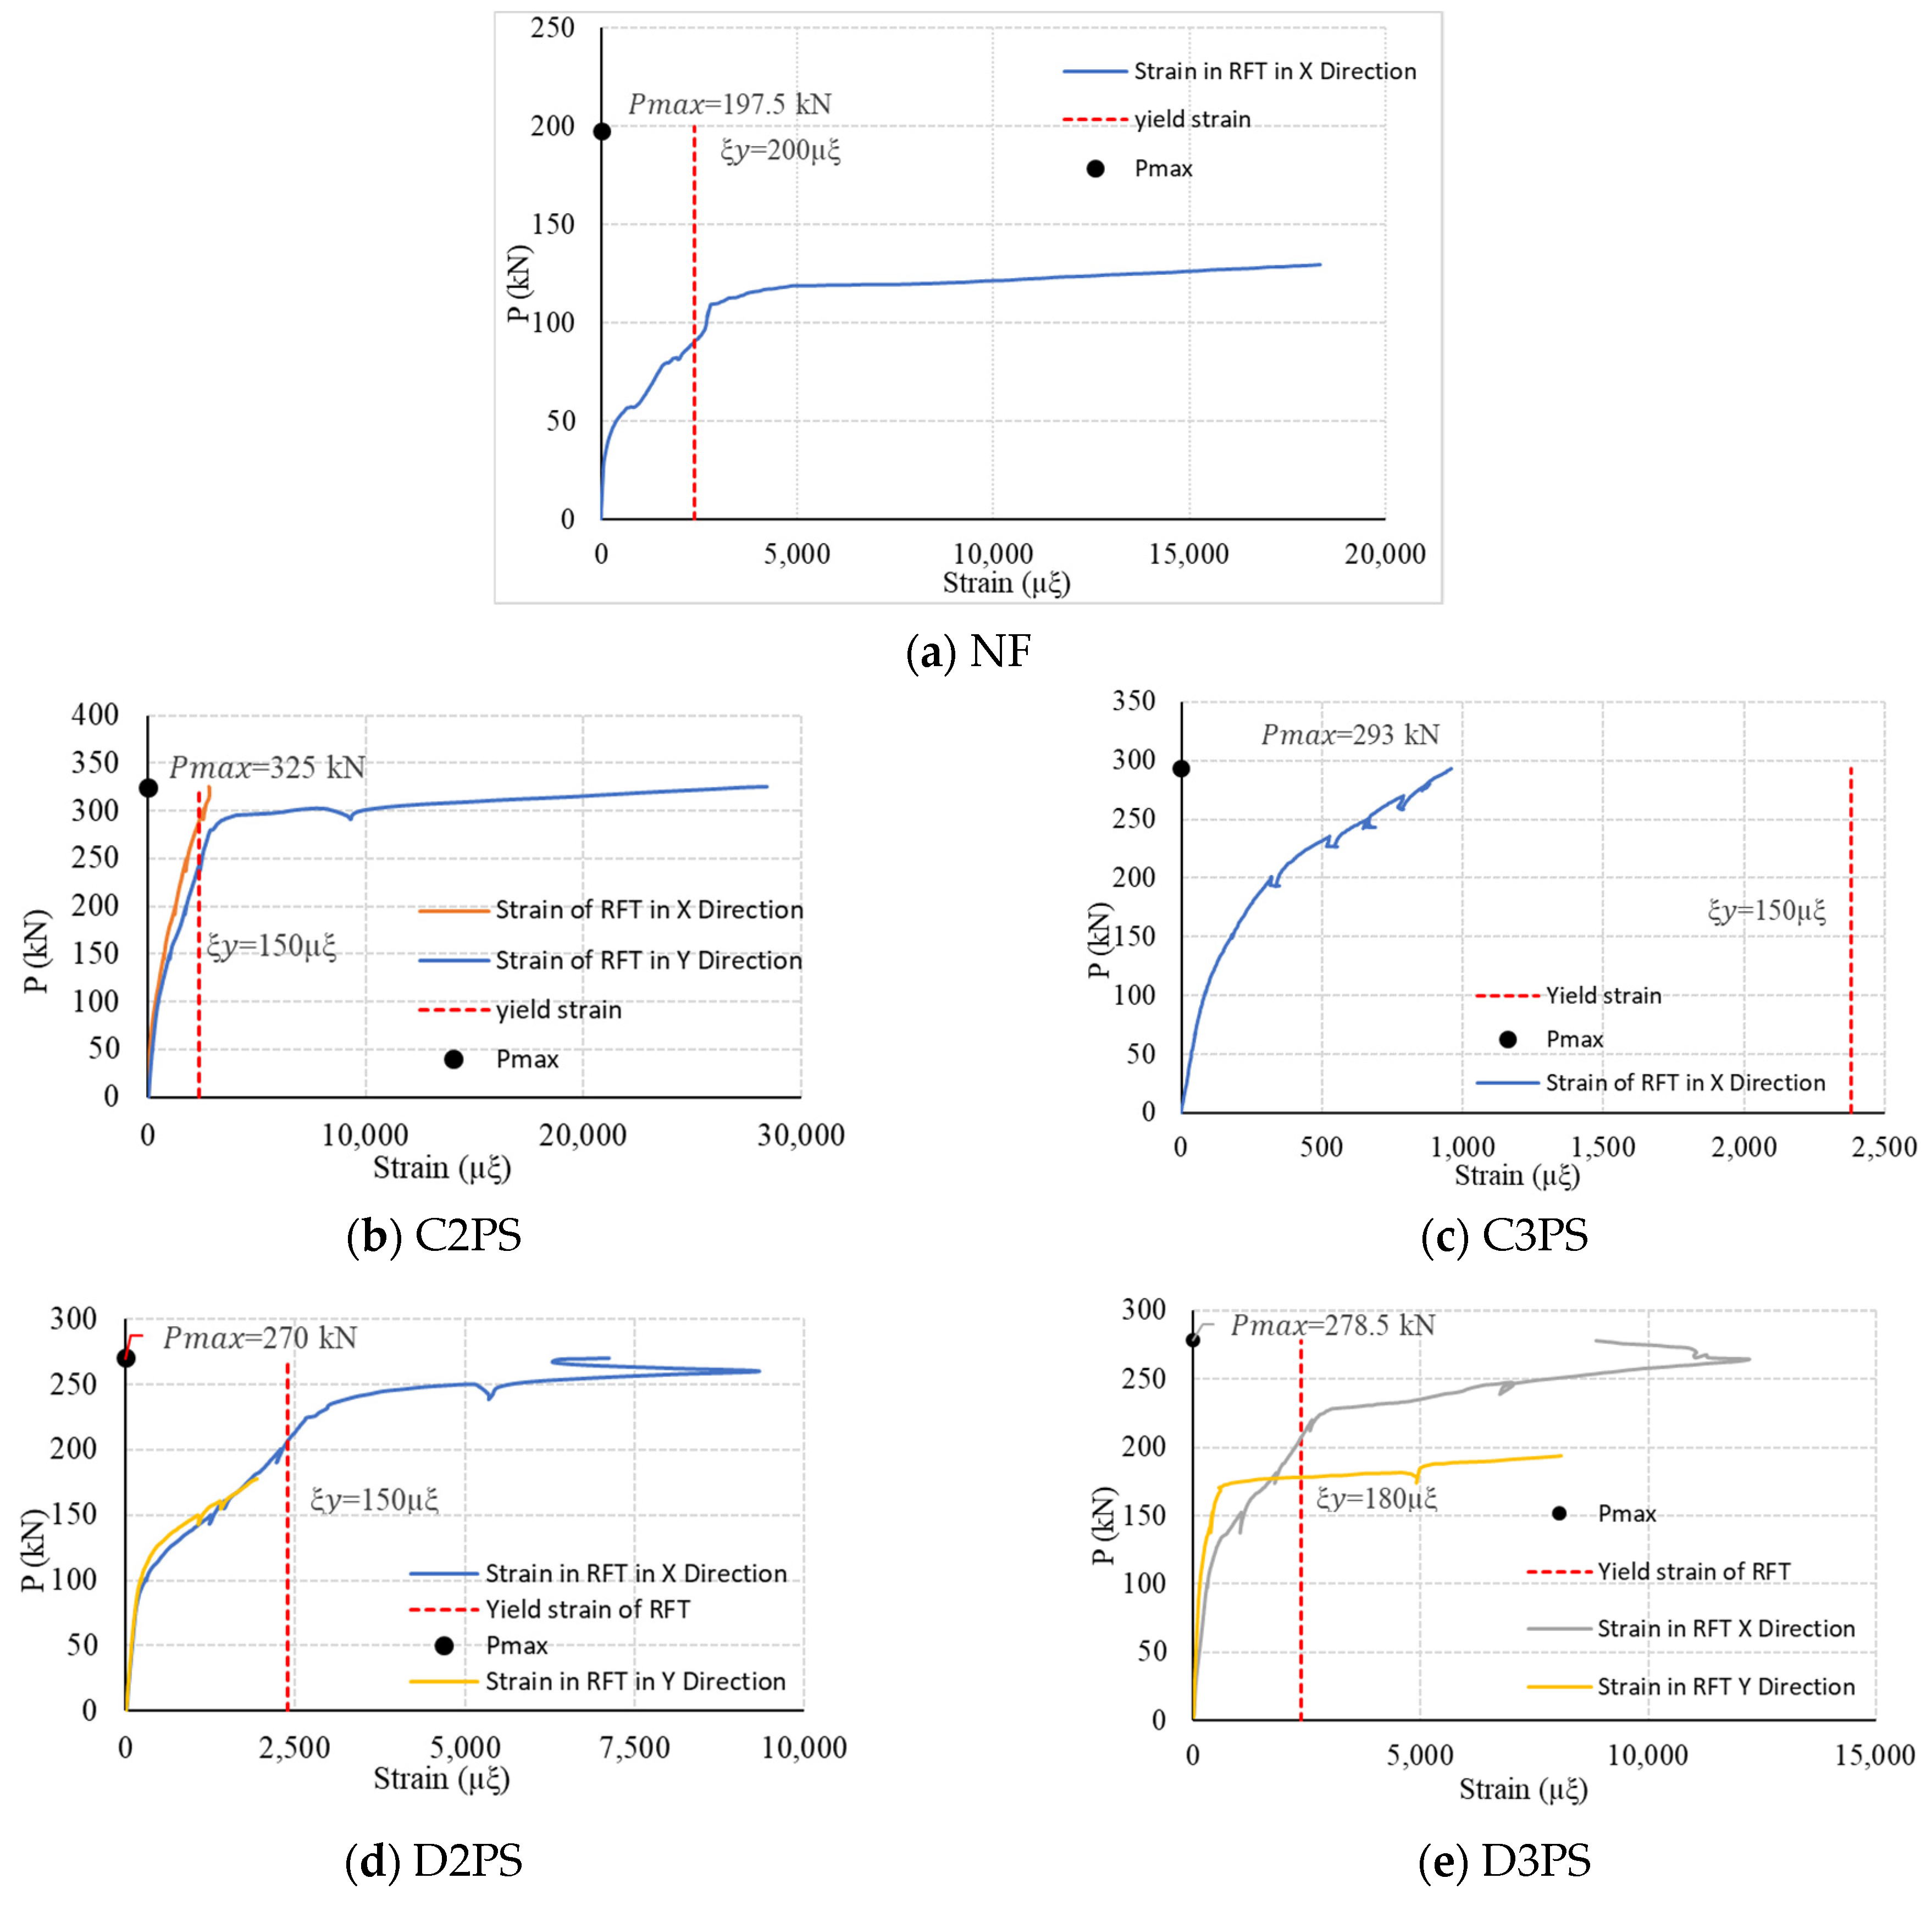
5.3. Strains in Mild Steel
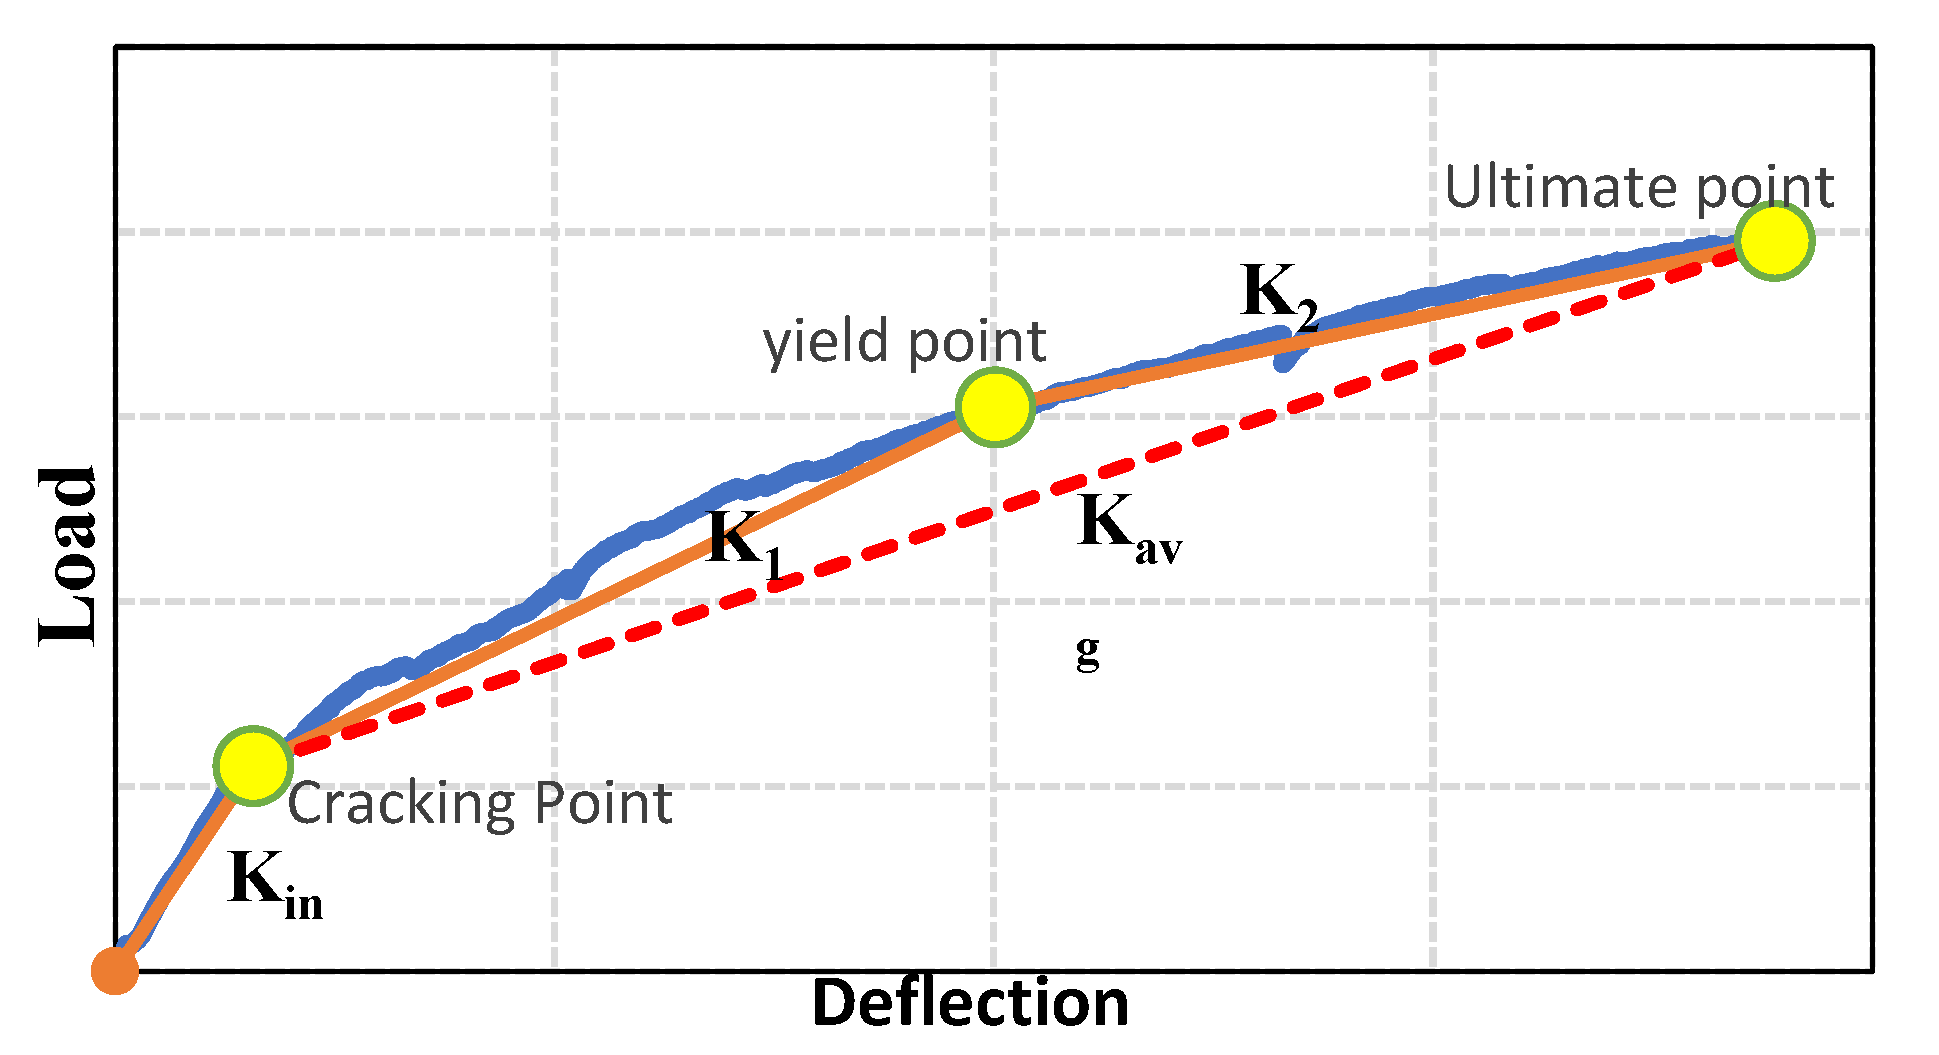
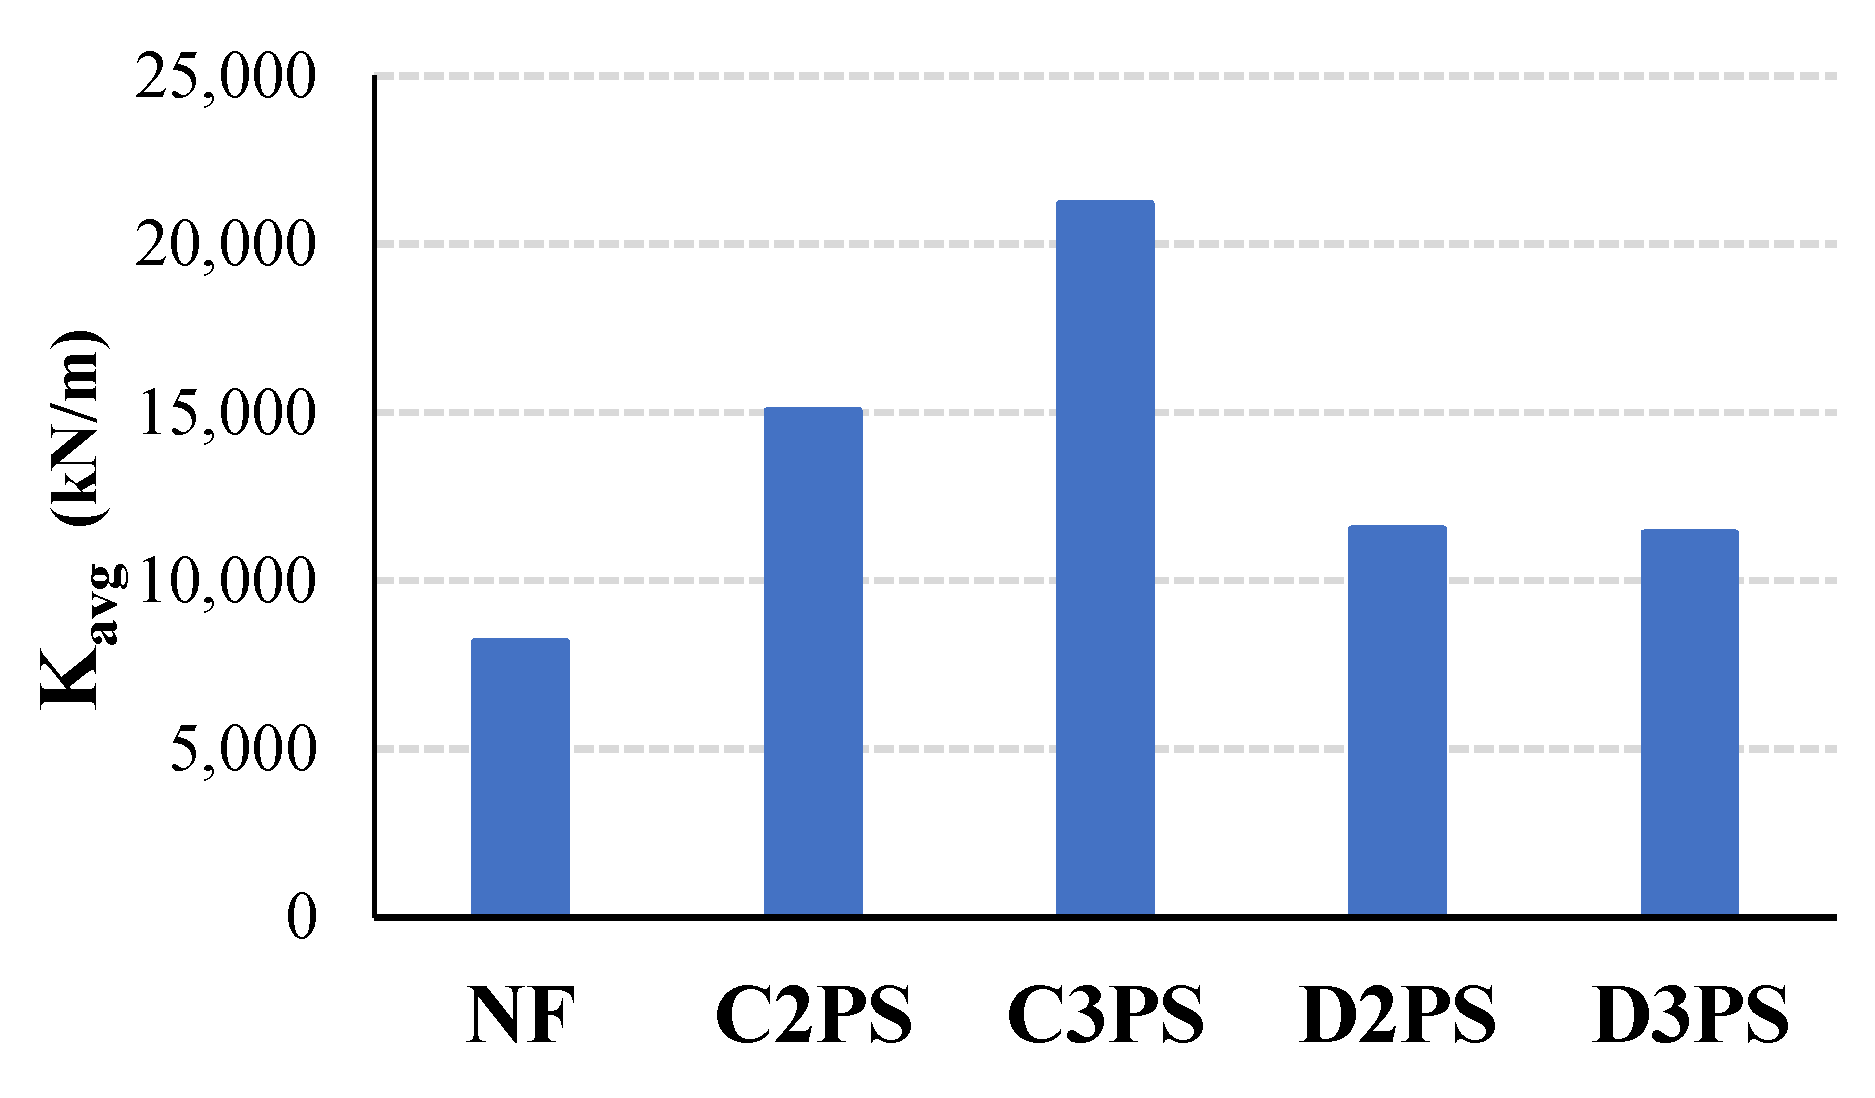
5.4. Stiffness
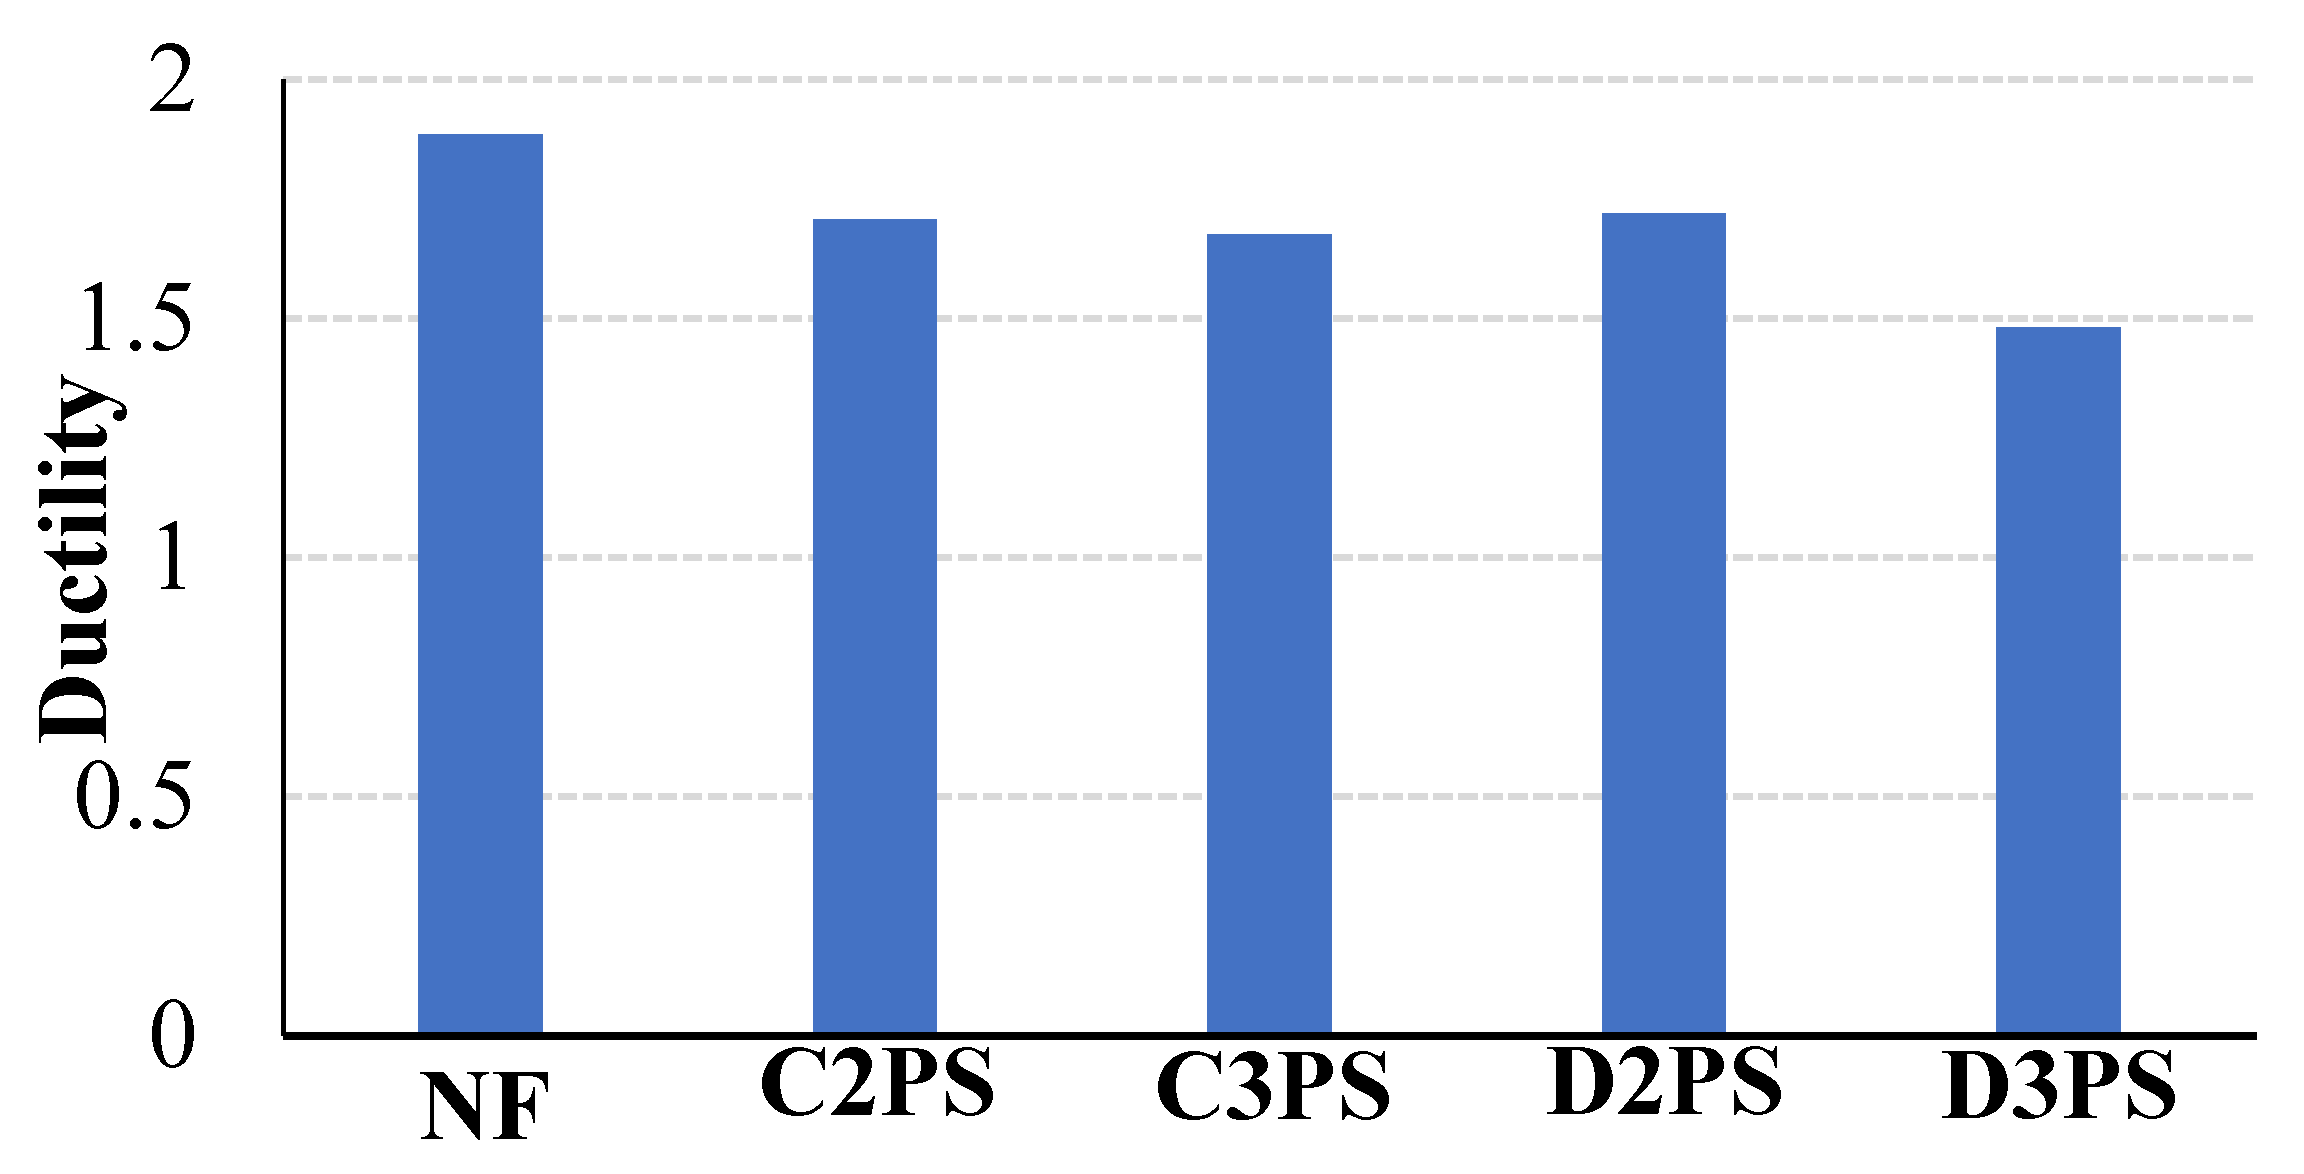
5.5. Ductility
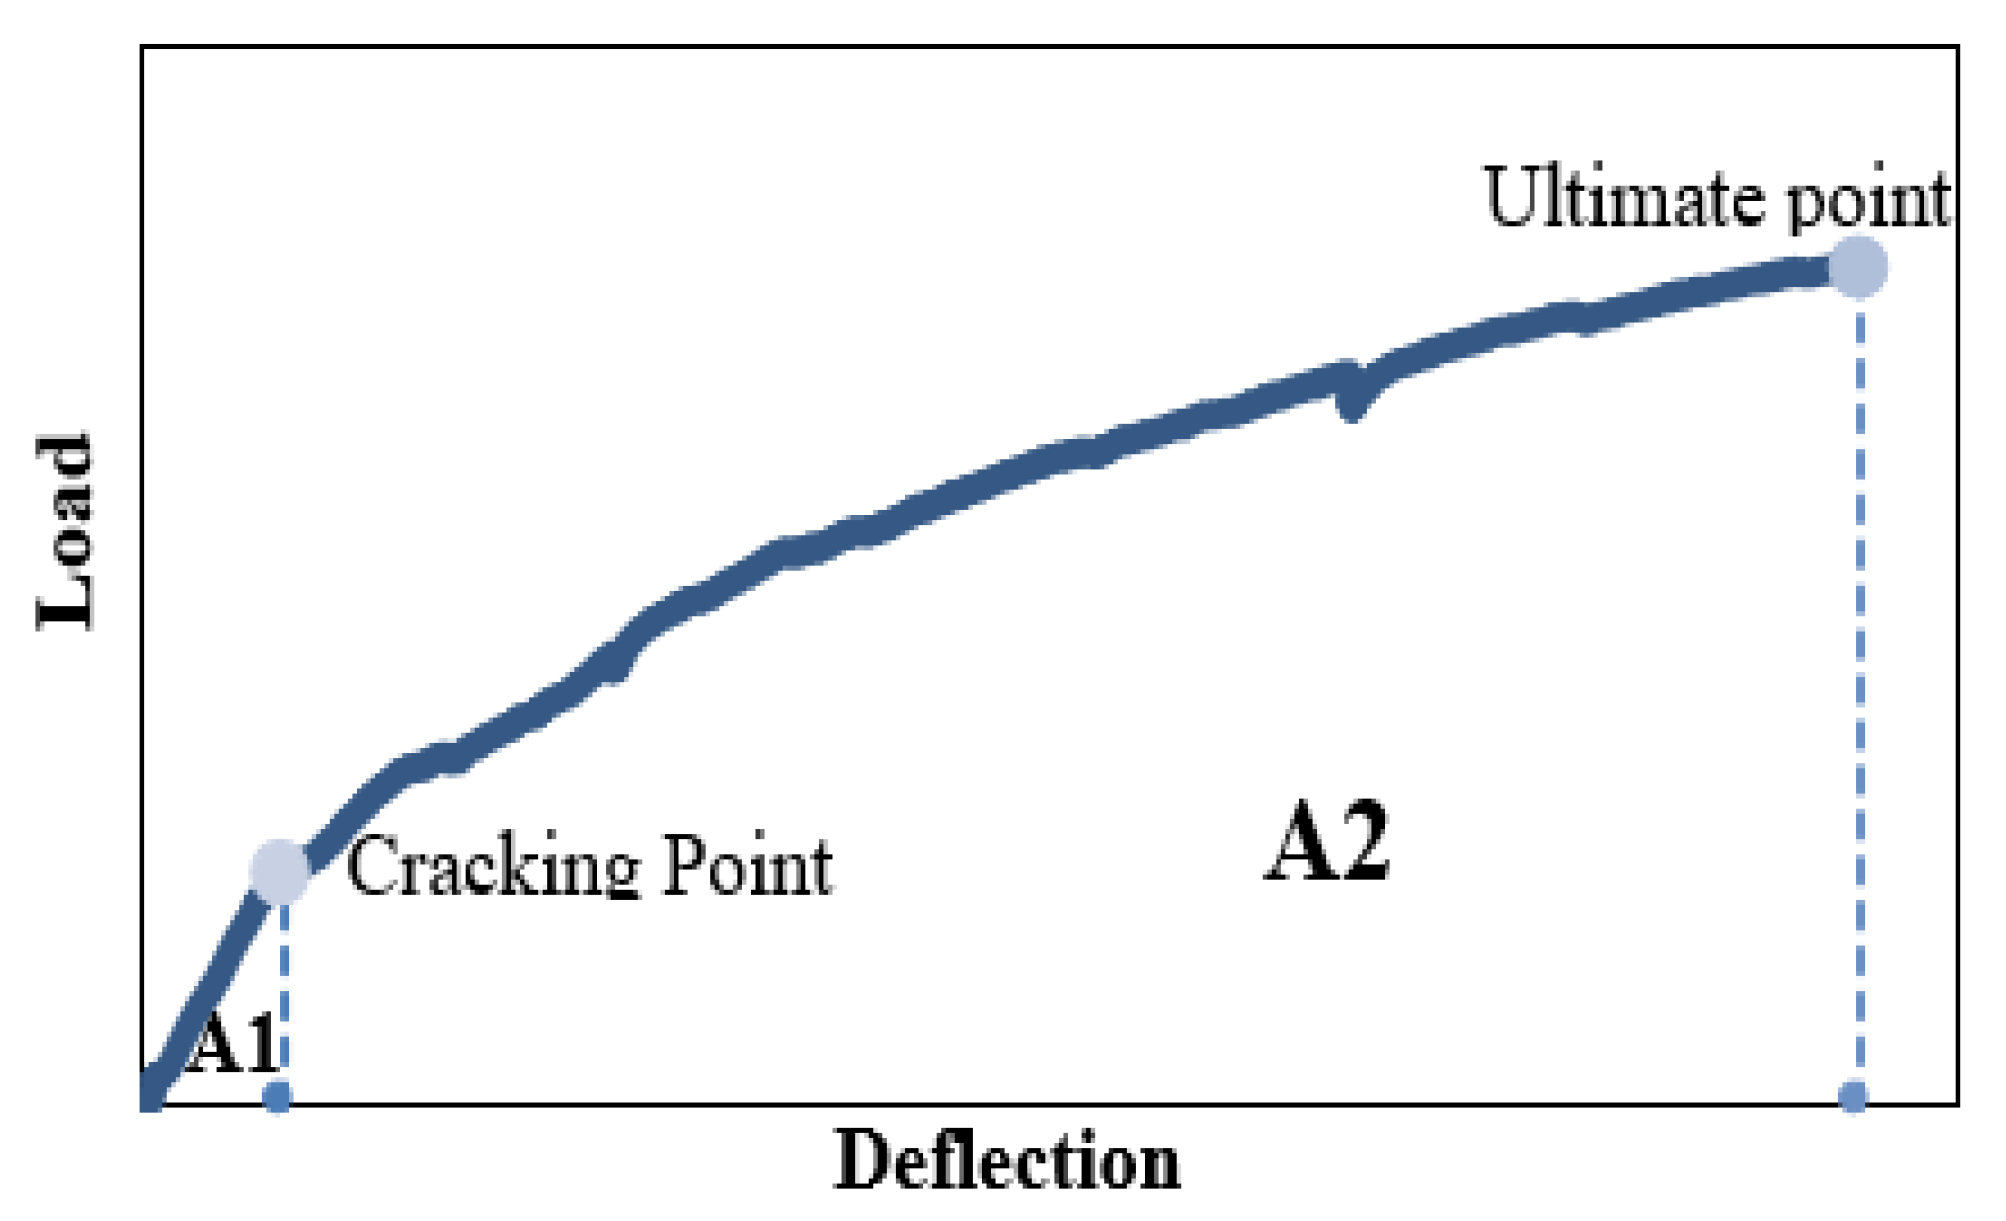
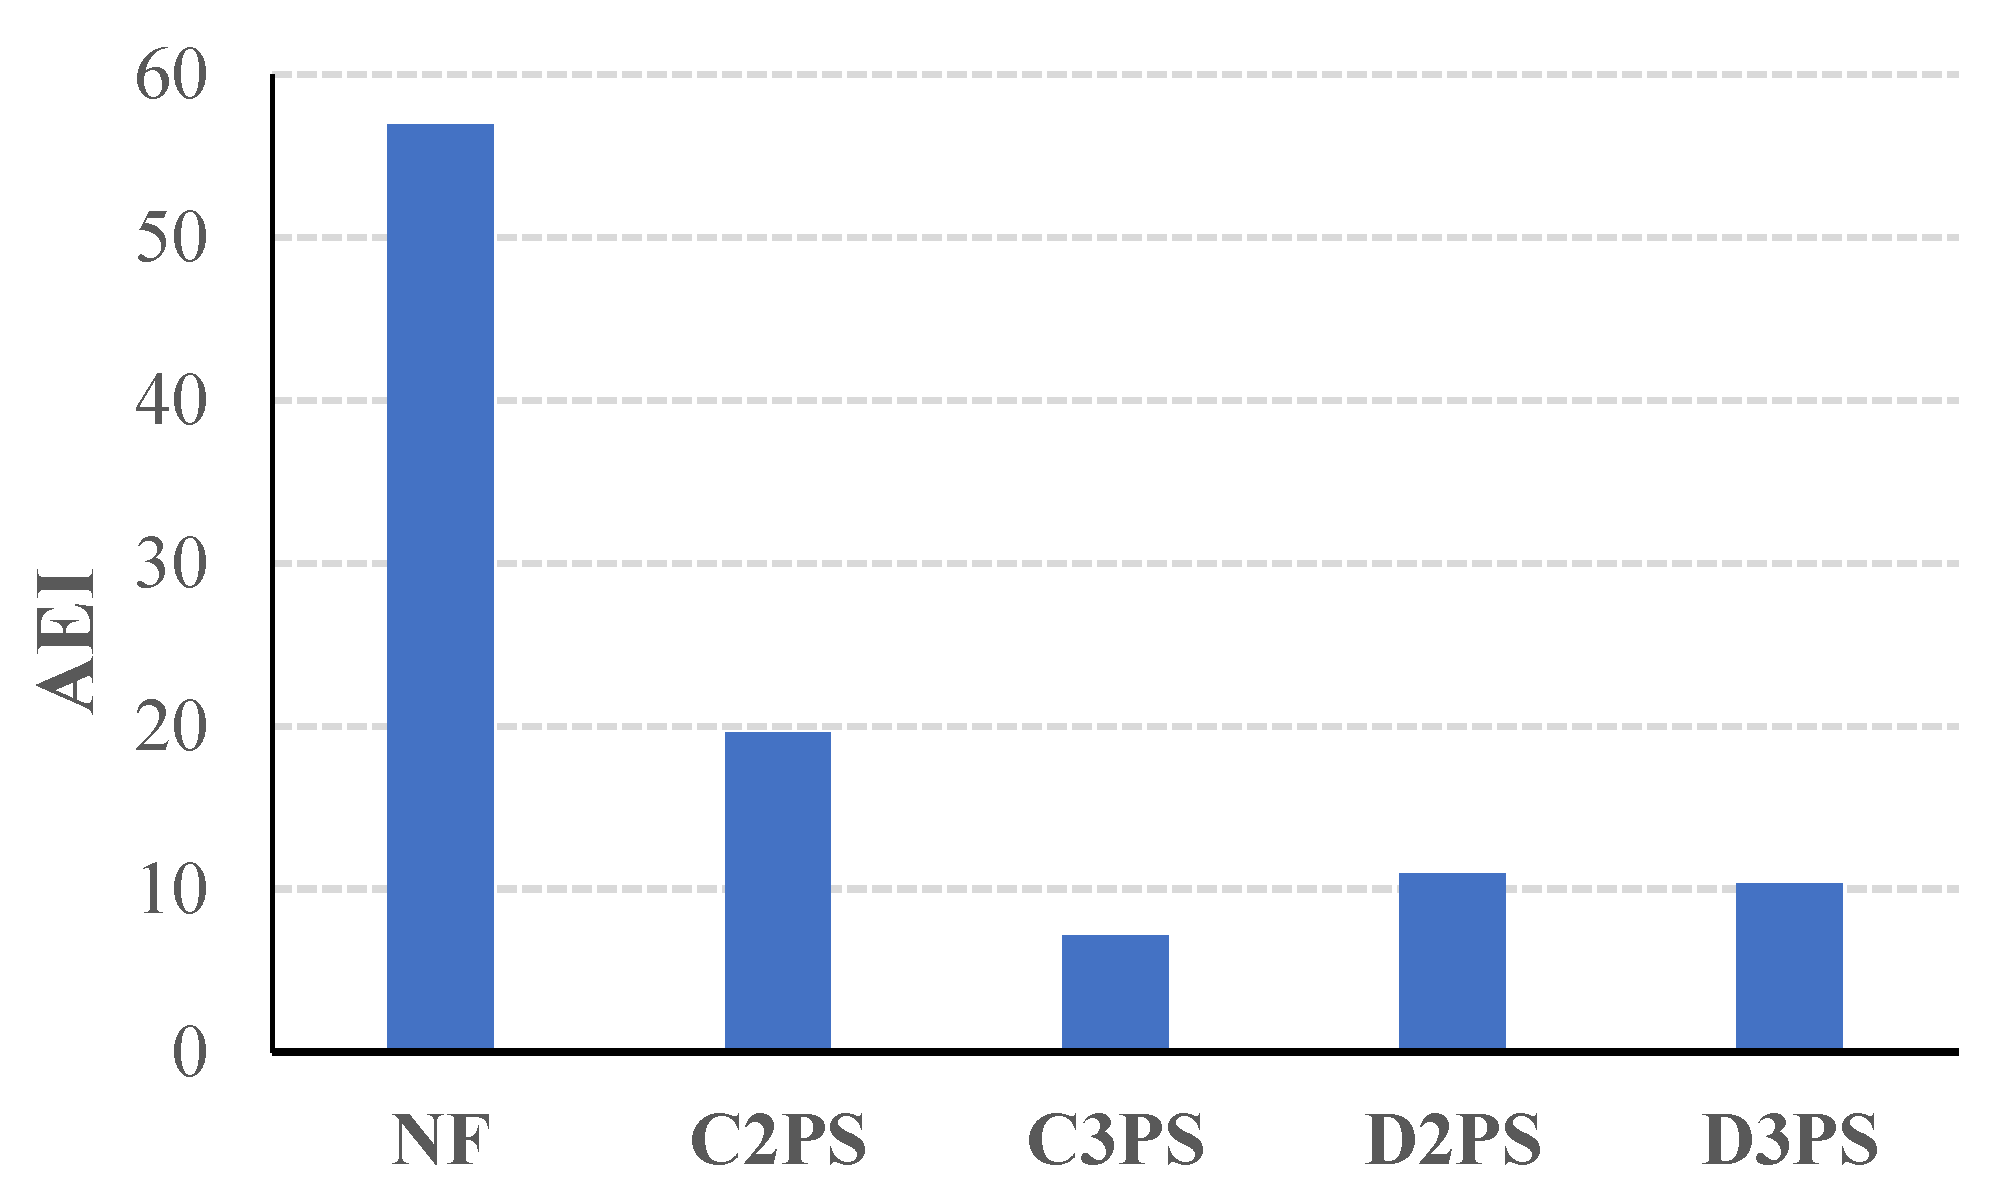
5.6. Energy Absorbed
6. Design Codes
6.1. The Egyptian Code of Practice (ECP-203)
6.1.1. Non-Prestressed Reinforced Concrete Flat Slab
6.1.2. Post-Tensioned Reinforced Concrete Flat Slab
6.2. The American Building Code (ACI-318) [10]
6.2.1. Non-Prestressed Reinforced Concrete Flat Slab
6.2.2. Post-Tensioned Reinforced Concrete Flat Slab
6.3. CEB–FIP Model Code [11]
6.3.1. Non-Prestressed Reinforced Concrete Flat Slab
6.3.2. Post-Tensioned Reinforced Concrete Flat Slab
6.4. Euro Code [12]
6.4.1. Non-Prestressed Reinforced Concrete Flat Slab
6.4.2. Post-Tensioned Reinforced Concrete Flat Slab
7. Conclusions
- All tested flat slabs failed due to brittle punching shear, however post-tensioned flat slabs achieved a significant delay in the appearance of the first crack and crack propagation when compared with the control non-prestressed slab. The average punching cone diameter in PT flat slabs is larger than the control specimen.
- The increase of the prestressing force is directly proportional to the punching shear strength of the slab–column connection in case of distributed post-tensioning force. As flat slabs with distributed strands, D2PS and D3PS achieved punching shear strengths of 36.71% and 41.01% more than the same slabs without post-tensioning, respectively. While the slab–column connections with banded strands C2PS and C3PS recorded shear strengths 64.56% and 48.35%, respectively, when compared to slabs with no prestressing in cases of banded and distributed prestressing level. This clearly shows that the banded lay out of the post-tensioning strands enhanced the punching shear strength in different PT levels.
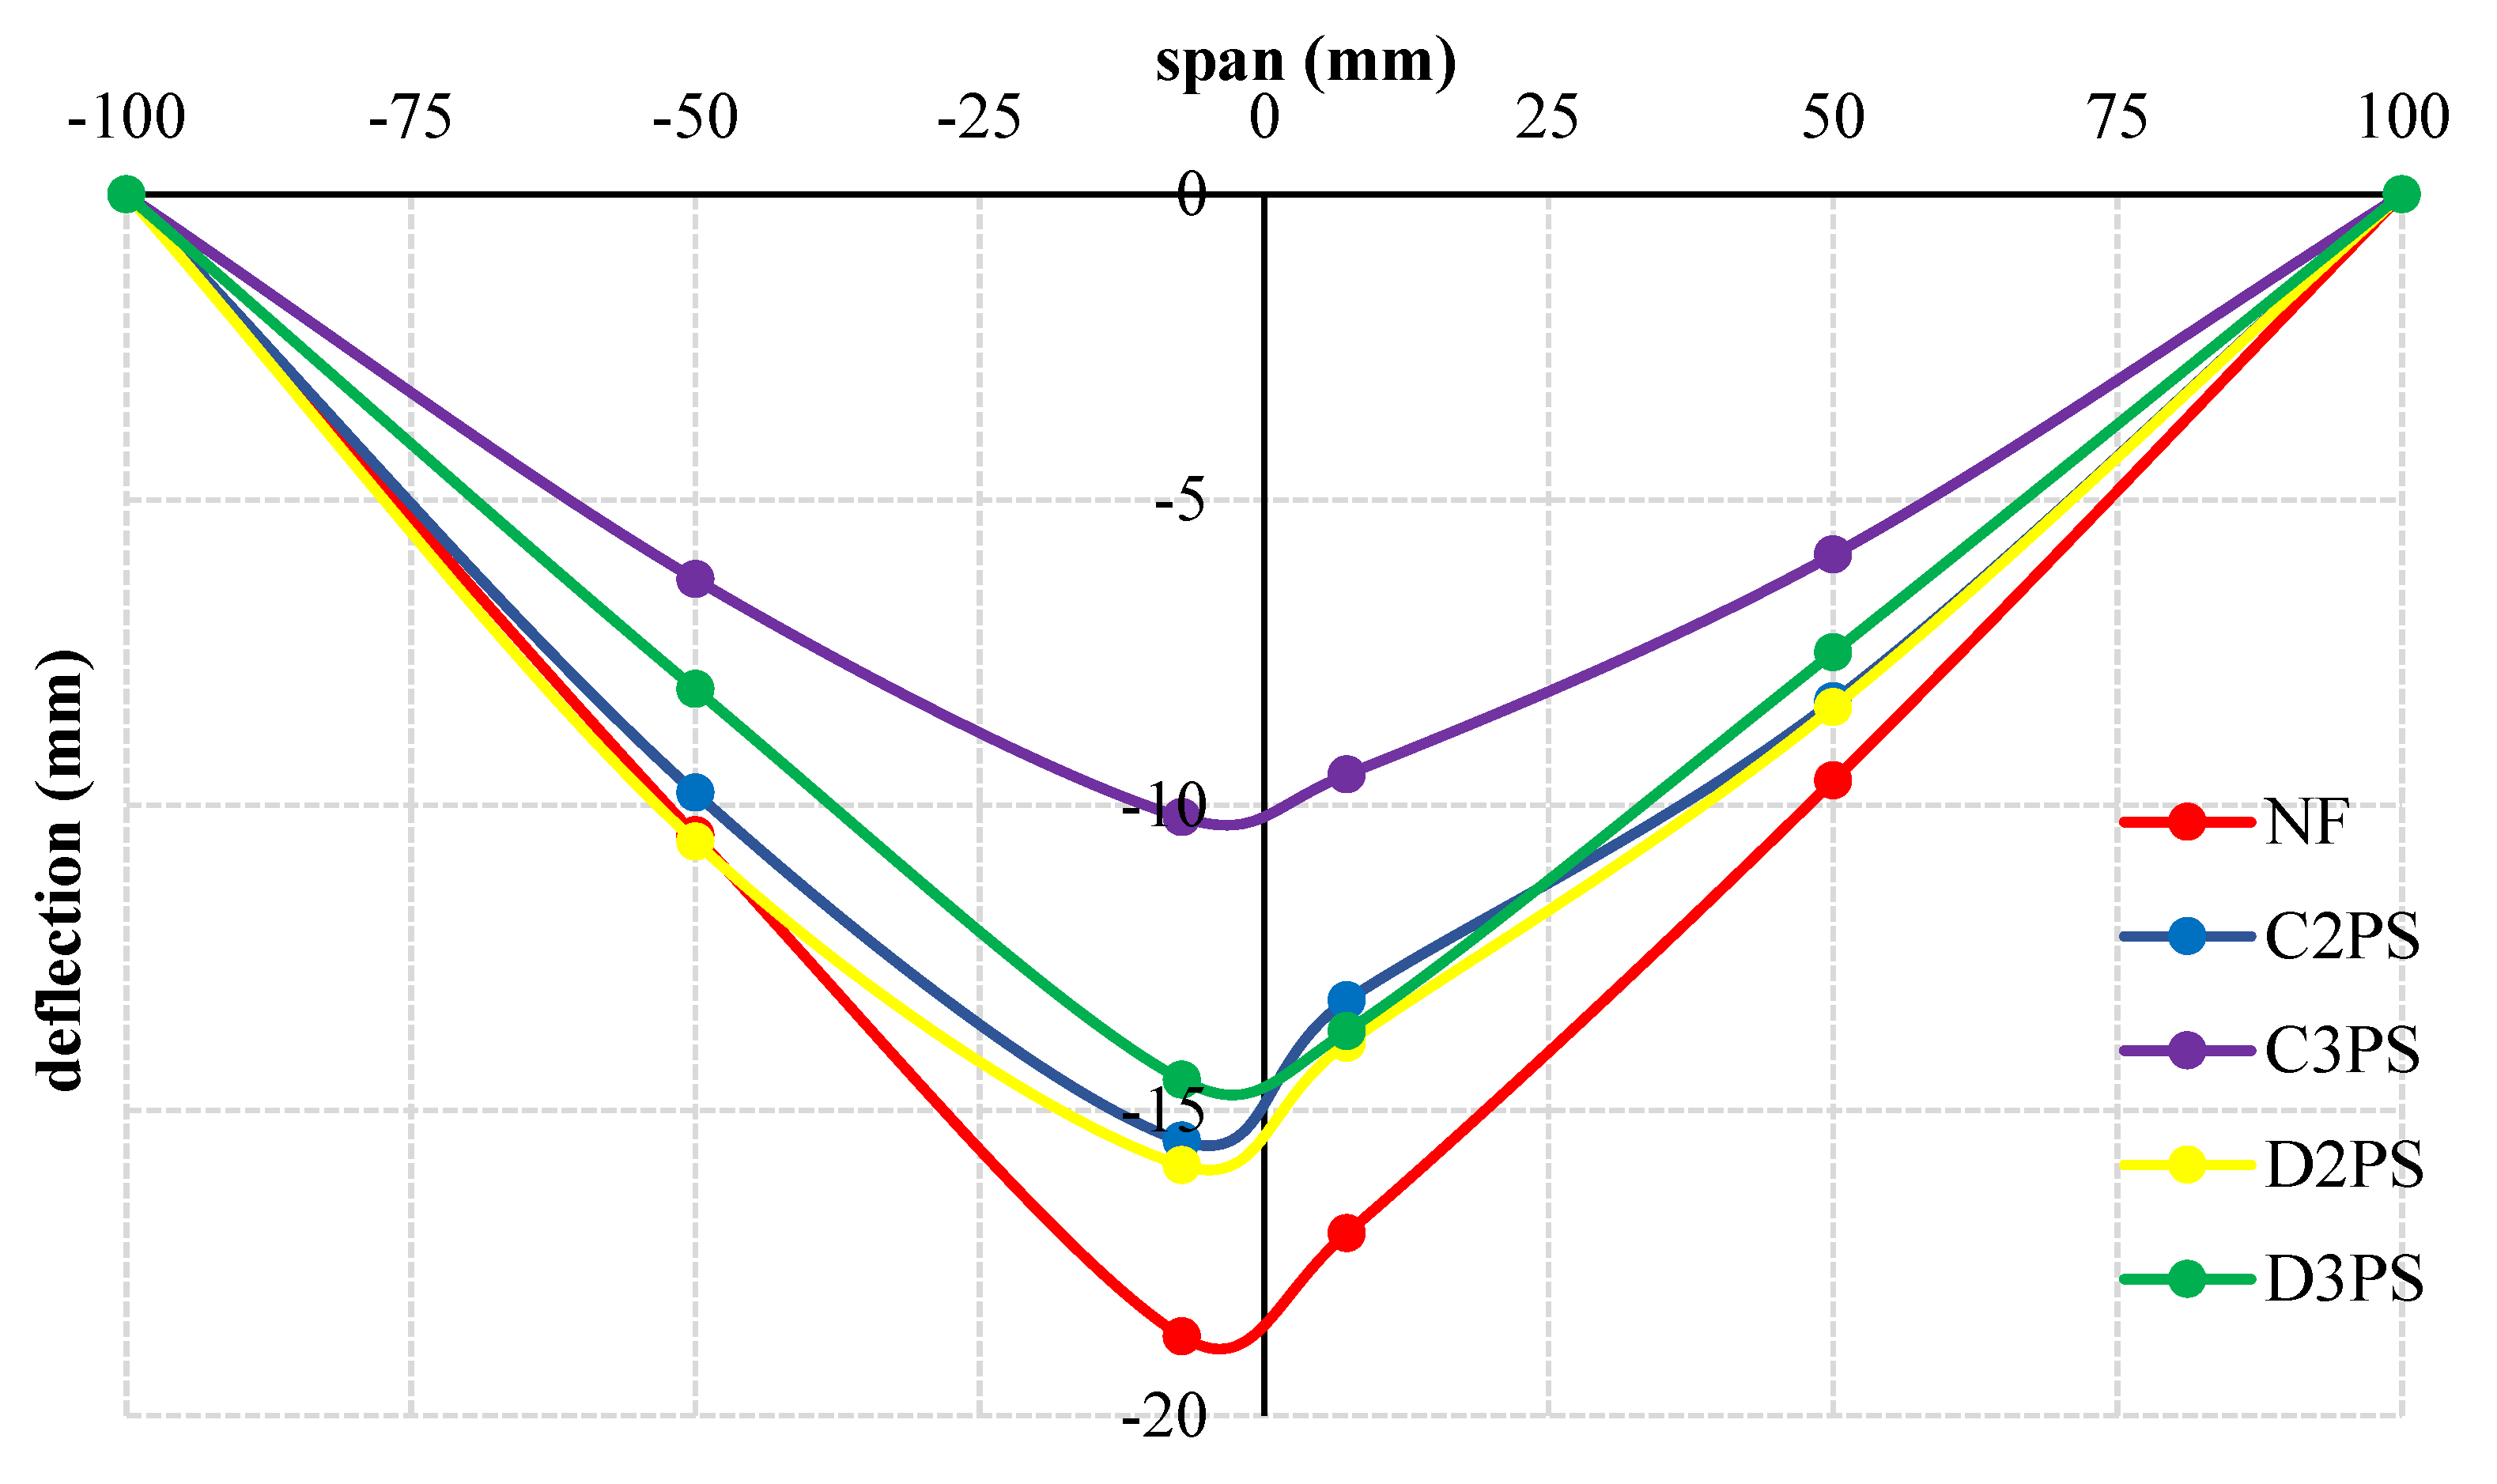
- Increase of PT level significantly decreased the deflection at ultimate load. Additionally, distributed lay out of strands delayed the punching shear failure. This is demonstrated by the way that the deflections at ultimate load of flat slabs were decreased by 17.11%, 45.5%, 14.97% and 22.5% in case of C2PS, C3PS, D2PS and D3PS, respectively, when compared to the control flat slab NF.
- Ductility (µ) of a flat slab is significantly influenced by the level of post-tensioning, as the ductility decreased by 10.05% and 8.995%, respectively, in cases of low post-tensioning level and decreased by 11.64% and 21.69%, respectively, for slabs of higher prestressing level in cases of banded and distributed strands, when compared with non-prestressed slabs.
- Ductility of flat slabs is highly affected by the distribution of the strands in case of high prestressing force. Ductility decreased by 8.995% and 21.69% for slabs with distributed strands with a higher level of PT. However, the effect of the distribution of the PT force decreases in cases of low PT force, as the ductility decreased by 10.05% and 11.64% in cases of banded and distributed strands, respectively.
- The absorbed energy index (AEI) is inversely proportional to the PT level. The flat slabs with low level of prestressing achieved AEI 19.6 and 10.955 in the cases of banded and distributed strands, respectively. Meanwhile, the flat slabs with high level of prestressing achieved AEI 7.15 and 10.35 in the cases of banded and distributed strands, respectively.
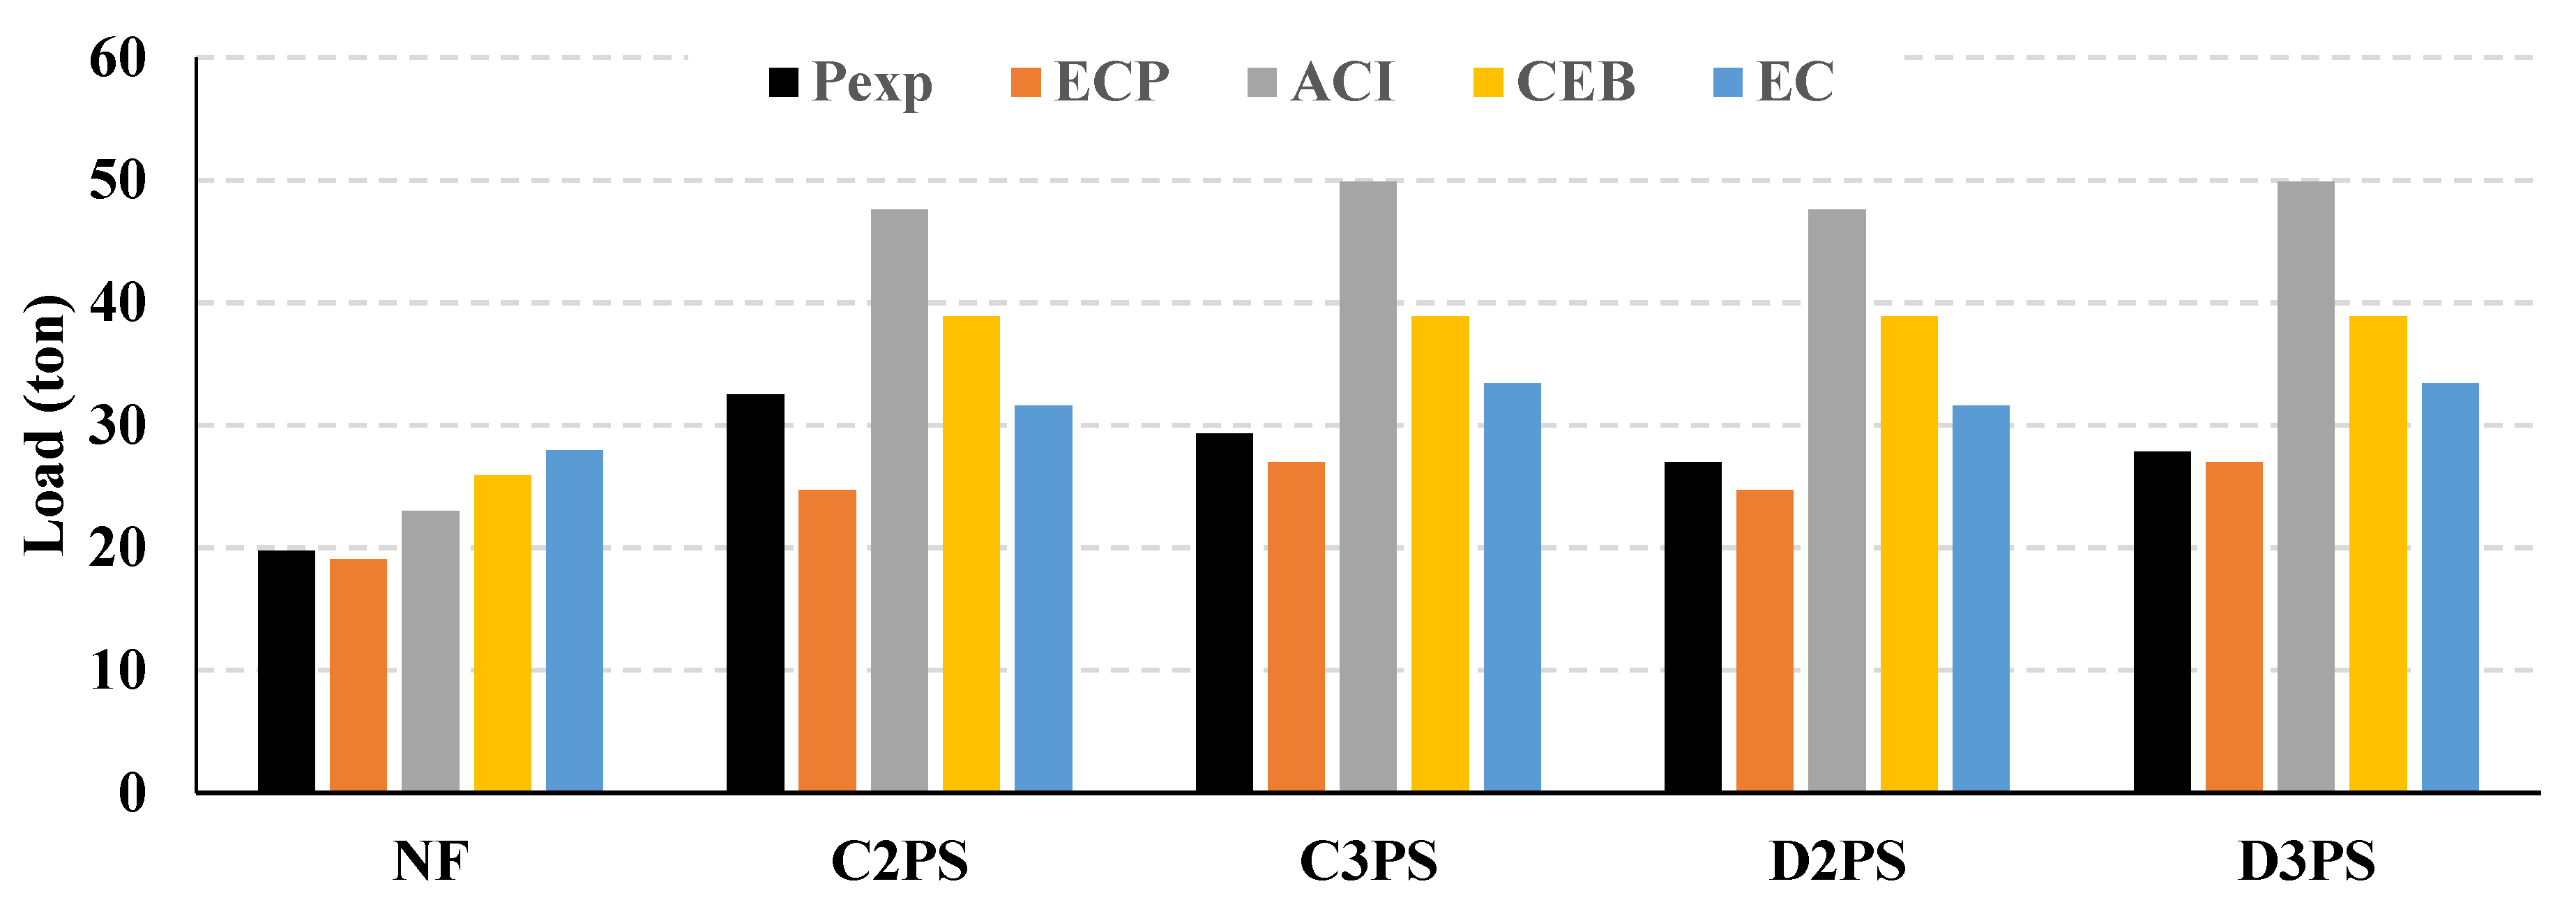
- Calculation of ultimate punching shear strength based on equations provided by different design codes are comparable to the experimental test results. The Egyptian code of practice gives very conservative ultimate punching shear strength in both cases of non-prestressed and prestressed flat slabs. Predicted values using the ACI are remarkably close to the experimental results, but the error increases with an increase in the distribution and an increase in the post-tensioning force. CEB values are consistent with the measured flat slab strength. The Euro code came the closest to predicting the correct ultimate punching shear strength of post-tensioned flat slabs, with no conservative prediction.
Author Contributions
Funding
Institutional Review Board Statement
Informed Consent Statement
Data Availability Statement
Conflicts of Interest
Notations
| a, b | short and long dimensions of column dimensions |
| b0 | perimeter of critical section of punching |
| d | slab thickness |
| concrete cylinder compressive strength | |
| fcu | concrete characteristic compressive strength |
| fpc | the mean effective prestress |
| PT | Post-tensioned |
| Vc | ultimate punching load capacity |
| Vp | the vertical component of prestress in tendon at supports |
| λs | size effect factor |
| βc | column aspect ratio (long side/short side) |
References
- Malvade, S.S.; Salunke, P. Analysis of Post-Tensioned Flat Slab by using SAFE. Int. J. Sci. Eng. Appl. Sci. (IJSEAS) 2017, 3, 92–95. [Google Scholar]
- Mohammed, A.H.; Tayşi, N.; Nassani, D.E.; Hussein, A.K. Finite element analysis and optimization of bonded post-tensioned concrete slabs. Cogent Eng. 2017, 4, 1341288. [Google Scholar] [CrossRef]
- Abd-El-Mottaleb, H.E.; Mohamed, H.A. Behaviour of Two-Way Post Tension Flat Slab. Appl. Eng. Sci. 2018, 2, 54–59. [Google Scholar] [CrossRef]
- Puskás, A.; Töröka, I.; Virág, J. Price comparison of three post-tensioned flat slabs beside classic flat slabs from three existing structures/under construction. In Proceedings of the 12th PhD Symposium, Prague, Czech Republic, 29–31 August 2018. [Google Scholar]
- Töröka, I.; Puskás, A.; Virág, J. Post-tensioned Flat Slabs with Unbonded Tendons for Public Buildings. Procedia Manuf. 2019, 32, 102–109. [Google Scholar] [CrossRef]
- Luu, B.T.; Ngo-Huu, C.; Nguyen-Minh, L. Punching shear capacity of unbonded post-tensioned slab-Concrete filled steel tube column joints with innovativeconnections: Experiment and A new prediction model. J. Build. Eng. 2022, 59, 104974. [Google Scholar] [CrossRef]
- Eid, H.; Riad, K.H.; Zaher, A.H. Punching Shear Strength of Pre-Stressed Flat Slab in Case of Near-Column Openings. World Appl. Sci. J. 2014, 32, 780–791. [Google Scholar] [CrossRef]
- Husain, M.; Eisa, A.S.; Roshdy, R. Alternatives to Enhance Flat Slab Ductility. Int. J. Concr. Struct. Mater. 2017, 11, 161–169. [Google Scholar] [CrossRef] [Green Version]
- Egyptian Code for Design and Construction of Reinforced Concrete Structures, ECPCS-203; Housing and Building National Research Center, Ministry of Housing, Utilities and Urban Planning: Cairo, Egypt, 2018.
- ACI Committee 318. Building Code Requirements for Structural Concrete and Commentary, ACI 318M-08; American Concrete Institute: Michigan, MI, USA, 2008. [Google Scholar]
- CEB-FIP MC90 Model Code, Model Code for Concrete Structures; Comintary International du Baton et federation International de la Precontrainte: Lausanne, Switzerland, 1990.
- Part 1-1: General Rules and Rules for Buildings. In Design of Concrete Structures; Eurocode2; British Standards Institution: Brussels, Belgium, 2004.


| Specimen ID | Concrete Dimensions | Mild RFT | Prestressing System | |||||||
|---|---|---|---|---|---|---|---|---|---|---|
| Plan m × m | Thickness mm | Top and Bottom Reinforcement | Cover mm | No. of Strands | Alignment | Cover mm | ||||
| NF | 2 × 2 | 150 | 44.50 | 5 Φ 10/m | 20 | 500 | --- | --- | --- | --- |
| C2PS | 2 Φ 0.6″/direction | Banded | 1640 | 40 | ||||||
| C3PS | 3 Φ 0.6″/direction | Banded | ||||||||
| D2PS | 2 Φ 0.6″/direction | Distributed | ||||||||
| D3PS | 3 Φ 0.6″/direction | Distributed | ||||||||
| Concrete | Mild Steel Reinforcement | Prestressing Cables | ||||||
|---|---|---|---|---|---|---|---|---|
| Concrete Mix Proportion of 1 m3 | Design Cube Compressive Strength (MPa) | Test Day Cube Compressive Strength (MPa) | ||||||
| Cement (kg) | Fine Aggregate (kg) | Coarse Aggregate (kg) | W/C | |||||
| 400 | 1400 | 720 | 0.55 | 40 | 44.50 | 500 | 1640 | 1860 |
| Specimen ID | Failure Mechanism | Average Cone Diameter (mm) | |
|---|---|---|---|
| NF | 197.5 | Punching | 65 |
| C2PS | 325 | Punching | 135 |
| C3PS | 293 | Punching | 115 |
| D2PS | 270 | Punching | 90 |
| D3PS | 278.5 | Punching | 97 |
| Specimen ID | Ultimate | Cracking | ||||||
|---|---|---|---|---|---|---|---|---|
| Load | Deflection | Load | Deflection | |||||
| NF | 197.5 | - | 18.7 | - | 55.5 | - | 1.568 | - |
| C2PS | 325 | 64.6 | 15.5 | 17.11 | 130.7 | 135.5 | 2.586 | 64.9 |
| C3PS | 293 | 48.4 | 10.2 | 45.5 | 151.0 | 172 | 3.369 | 114.86 |
| D2PS | 270 | 36.71 | 15.9 | 14.97 | 131.2 | 136.4 | 3.85 | 145.54 |
| D3PS | 278.5 | 41 | 14.5 | 22.5 | 152.7 | 175.14 | 3.51 | 123.85 |
| Specimen ID | K1 (kN/m) | K2 (kN/m) | ||
|---|---|---|---|---|
| NF | 35,395.41 | 11,480.6 | 5068.14 | 8194.83 |
| C2PS | 50,541.38 | 19,929.1 | 10,134. 1 | 15,059.68 |
| C3PS | 44,820.42 | 29,969.7 | 15,528.7 | 21,216.2 |
| D2PS | 34,077.92 | 14,625.1 | 9027.99 | 11,533.99 |
| D3PS | 43,504.27 | 15,124.6 | 6457.76 | 11,411.47 |
| Specimen ID | |||
|---|---|---|---|
| NF | 10.017 | 18.896 | 1.89 |
| C2PS | 9.074 | 15.488 | 1.70 |
| C3PS | 6.005 | 10.062 | 1.67 |
| D2PS | 9.238 | 15.884 | 1.72 |
| D3PS | 9.811 | 14.534 | 1.48 |
| Specimen ID | |||
|---|---|---|---|
| NF | 4351 | 247,603 | 56.9 |
| C2PS | 16,899 | 331,252 | 19.6 |
| C3PS | 25,436 | 181,742 | 7.15 |
| D2PS | 25,256 | 276,679 | 10.95 |
| D3PS | 26,798 | 277,372 | 10.35 |
| Specimen ID | |||||||||
|---|---|---|---|---|---|---|---|---|---|
| ECP | ACI | CEB | EC | ECP | ACI | CEB | EC | ||
| NF | 197.5 | 191 | 230.3 | 259 | 279.4 | 0.97 | 1.17 | 1.30 | 1.40 |
| C2PS | 325 | 247.3 | 476 | 388.7 | 316 | 0.76 | 1.46 | 1.19 | 0.97 |
| C3PS | 293 | 269.8 | 498.6 | 388.7 | 334 | 0.93 | 1.70 | 1.33 | 1.14 |
| D2PS | 270 | 247.3 | 476 | 388.7 | 316 | 0.92 | 1.76 | 1.44 | 1.17 |
| D3PS | 278.5 | 269.8 | 498.6 | 388.7 | 334 | 0.97 | 1.79 | 1.40 | 1.19 |
Disclaimer/Publisher’s Note: The statements, opinions and data contained in all publications are solely those of the individual author(s) and contributor(s) and not of MDPI and/or the editor(s). MDPI and/or the editor(s) disclaim responsibility for any injury to people or property resulting from any ideas, methods, instructions or products referred to in the content. |
© 2022 by the authors. Licensee MDPI, Basel, Switzerland. This article is an open access article distributed under the terms and conditions of the Creative Commons Attribution (CC BY) license (https://creativecommons.org/licenses/by/4.0/).
Share and Cite
Elsheshtawy, S.S.; Shoeib, A.K.; Hassanin, A.; Ors, D.M. Influence of the Distribution and Level of Post-Tensioning Force on the Punching Shear of Flat Slabs. Designs 2023, 7, 1. https://doi.org/10.3390/designs7010001
Elsheshtawy SS, Shoeib AK, Hassanin A, Ors DM. Influence of the Distribution and Level of Post-Tensioning Force on the Punching Shear of Flat Slabs. Designs. 2023; 7(1):1. https://doi.org/10.3390/designs7010001
Chicago/Turabian StyleElsheshtawy, Sarah S., Ata K. Shoeib, Amal Hassanin, and Dina M. Ors. 2023. "Influence of the Distribution and Level of Post-Tensioning Force on the Punching Shear of Flat Slabs" Designs 7, no. 1: 1. https://doi.org/10.3390/designs7010001
APA StyleElsheshtawy, S. S., Shoeib, A. K., Hassanin, A., & Ors, D. M. (2023). Influence of the Distribution and Level of Post-Tensioning Force on the Punching Shear of Flat Slabs. Designs, 7(1), 1. https://doi.org/10.3390/designs7010001