1. Introduction
Power generation from renewable sources has grown significantly in recent years due to increasing energy demand as well as the environmental and economic concerns with fossil fuels. Photovoltaic (PV) is one of the renewable energy sources with the greatest future projection as it possesses features such as simple installation, high reliability, low maintenance cost due to the absence of moving parts, and zero fuel cost [
1,
2]. Solar trackers are used to increase the energy output from solar panels and solar receivers and used to keep solar collectors/solar panels oriented directly towards the sun as it moves through the sky every day. Therefore, creating renewable energy-based smart home systems to monitor and control electrical energy has become critical and needed on a large scale [
3]. The Internet of Things (IoT) is a system of related computing devices, digital and mechanical machines, objects, people with unique identifiers, and potential transfer of data over a network without human-to-human or human-to-computer interaction [
4].
Circuit breakers, RCBOs (Residual Current Operated Circuit Breaker), and ELCBs (Electric Leakage Circuit Breaker) are some examples of safety devices that are housed inside the modern distribution board. It was needed to upgrade the distribution boards to be smarter in order to meet the ever-increasing demands of today’s electricity grids, to make it easier to integrate distributed energy resources, solar PV panels, and electric vehicles into the grid, and to increase the system performance and reliability of low voltage distribution boards. Therefore, a user-friendly system for monitoring and warning energy consumption could help to some extent to prevent unnecessary energy consumption and disagreements over electricity bills. Numerous incidents are happening as a result of the electrical system. As a result, it is crucial to focus on creating and developing a smart distribution board equipped with a variety of sensors and integrated with an application that could inform users about electrical system faults, provide information about their real-time energy consumption, provide necessary alerts and warnings, etc. [
5]
In [
6], the process of tracking solar panels in three different areas with different amounts of dust was analyzed to present an IoT system based on detection, monitoring, and automatic cleaning system for the soiling of PV solar panels. In [
7], a particle swarm optimization (PSO) augmented internet of things (IoT)-based maximum power point tracking (MPPT) algorithm for solar photovoltaic (PV) systems has been proposed. The ioT-based control system provides monitoring and compiling of PV reference voltage for the MPPT controller of the PV system. Further, the experimental results validate the improved performance of the proposed algorithm. In [
8], one of the causes of reducing the efficiency of solar systems is the temperature increase in solar panels. To prevent this phenomenon, a cooling fan can be installed on the back side of the solar panel. The solar system efficiency also decreases due to weather conditions and unexpected situations. The IoT system was used to monitor the state of the solar system and control the cooling fan. The authors proposed to use the IoT system for monitoring and controlling fan-based cooling systems. IoT system relying on Arduino microcontroller supercapacitor was used for increasing the efficiency of the energy-storing system. Moreover, in [
9,
10,
11,
12,
13,
14,
15], a comprehensive study shows a review of monitoring technologies for solar PV Systems using data processing modules and transmission protocols. In a related study [
15,
16,
17,
18,
19,
20,
21,
22], a cost-effective design of an IoT-based smart household distribution system was presented.
In the present work, there will be three important parts, which are the solar cell tracking system and the cleaning system, and then all of these will be transferred to the smart box, and then the information coming from the solar tracking system will be organized, which includes the current for voltage and energy. In this case, an Arduino-based working prototype is used to collect data, and a mobile application is also used to allow individual consumers to monitor the system in real time and also alert users about faults in the electrical system, give their real-time energy consumption, give necessary alerts and warnings, etc.
2. Materials and Methods
2.1. Solar Tracking and Cleaning System
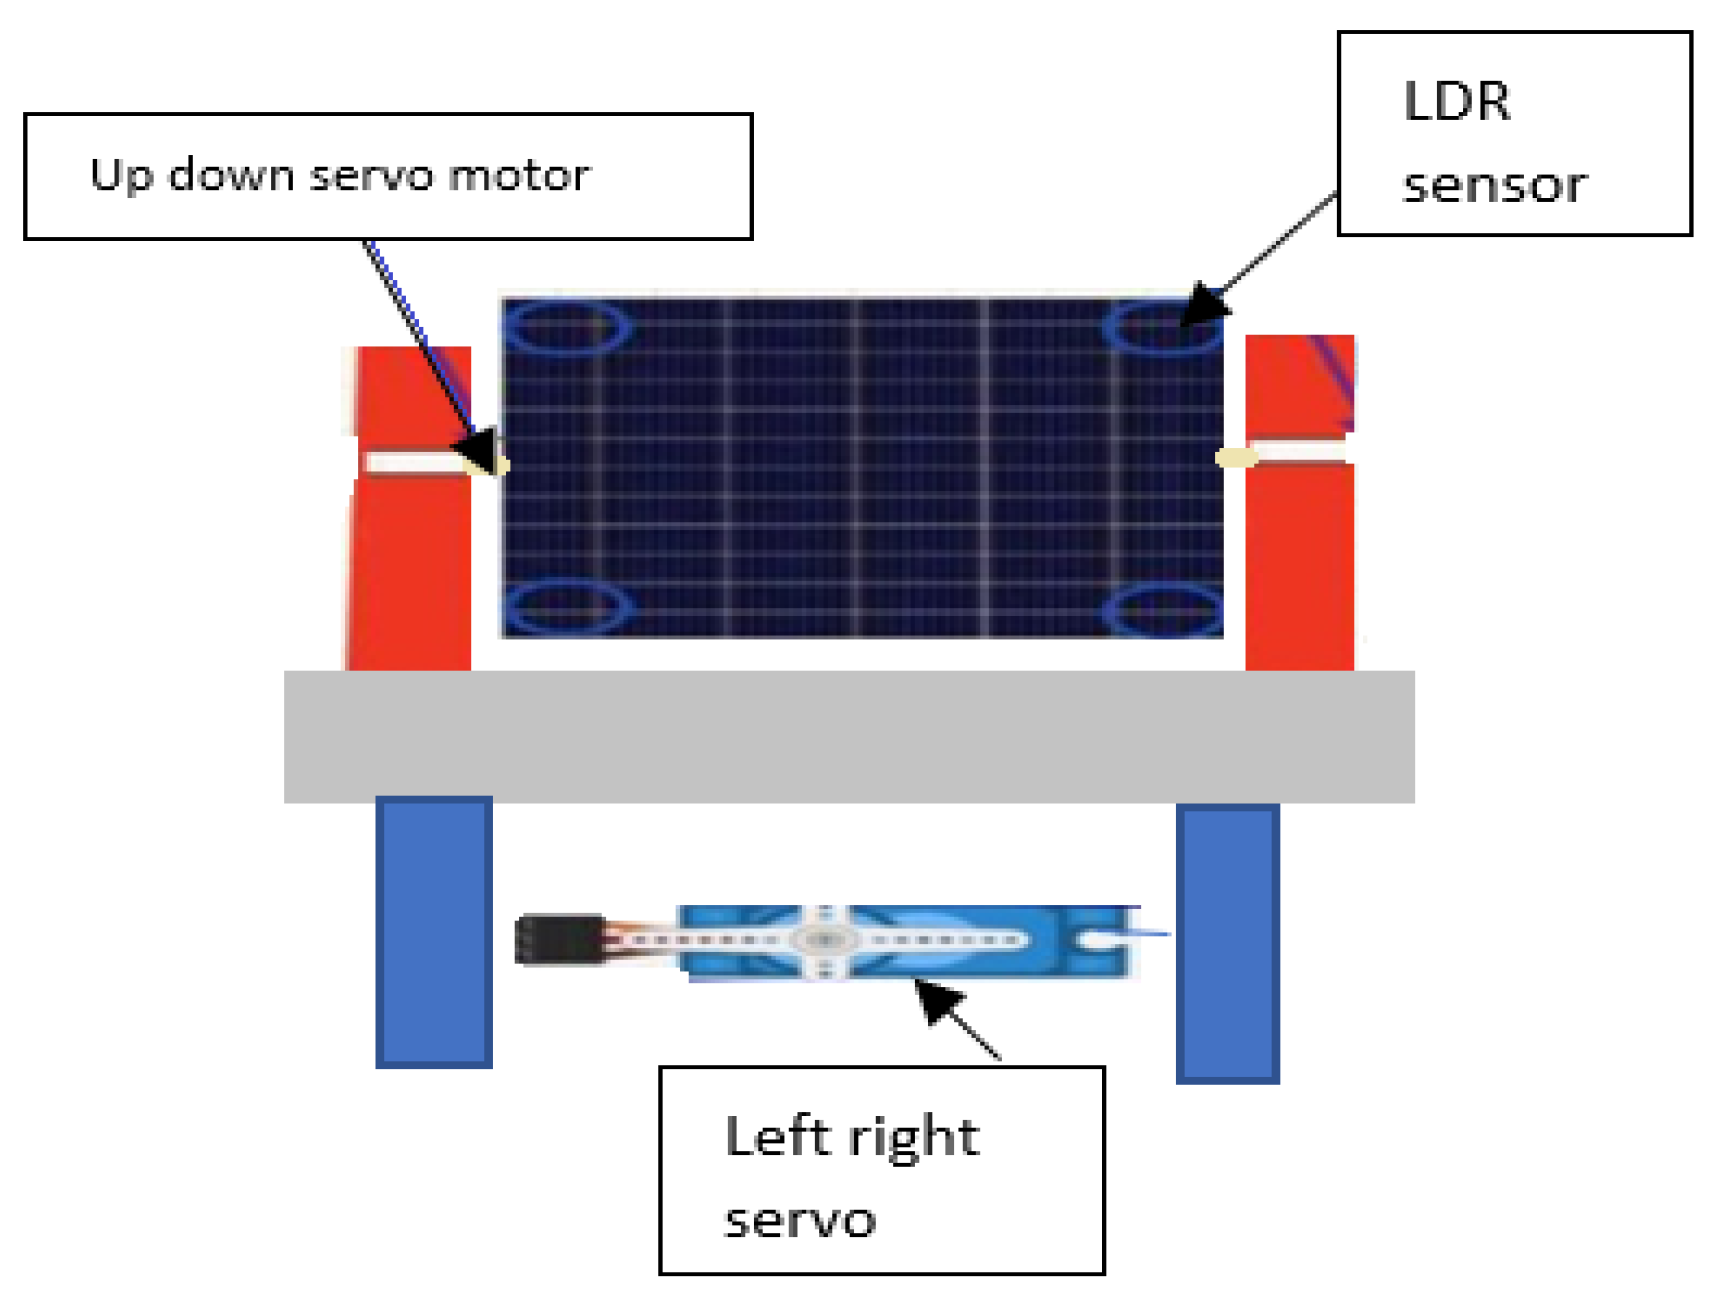
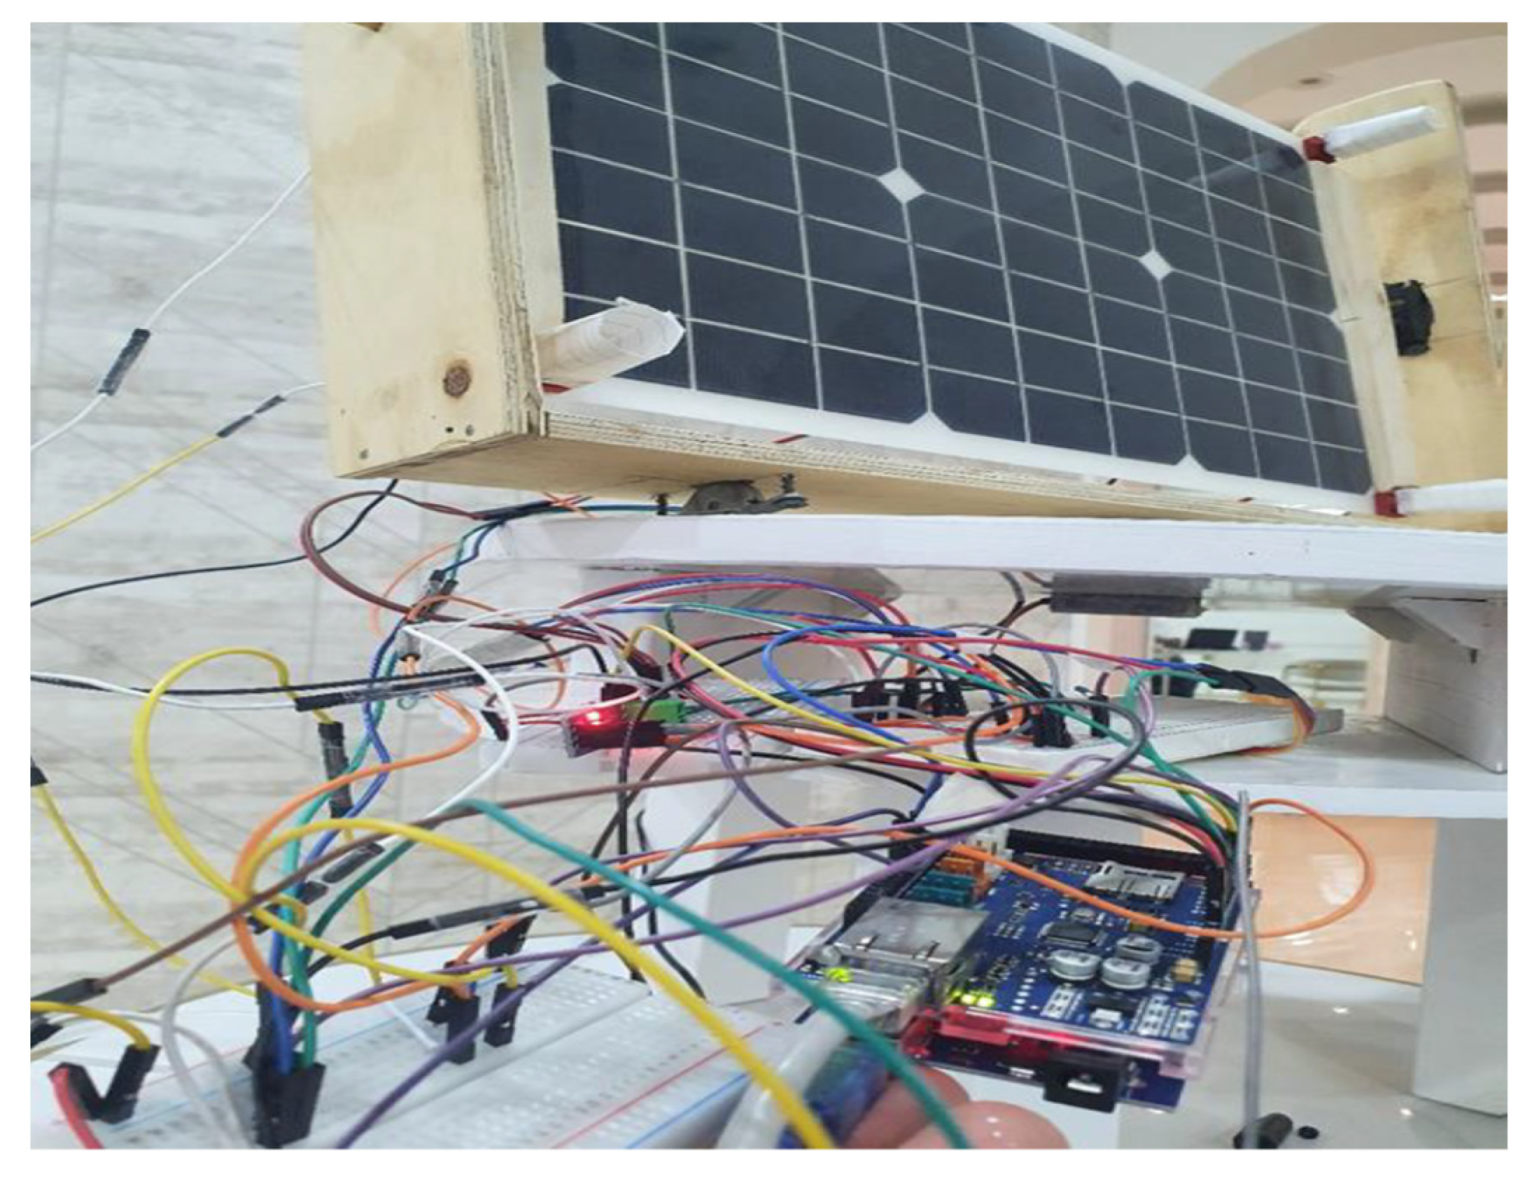
The main objective of the solar tracker algorithm is to quickly determine the best angle of exposure to light from the sun. The photovoltaics category is monocrystalline photovoltaic (ACOPOWER) 10 Watt 12 V, a pair of sensors is used to point the East and West of the location of the light. The frame will be made from wood, and the element that is responsible for moving in the right and left direction at the bottom, as shown in
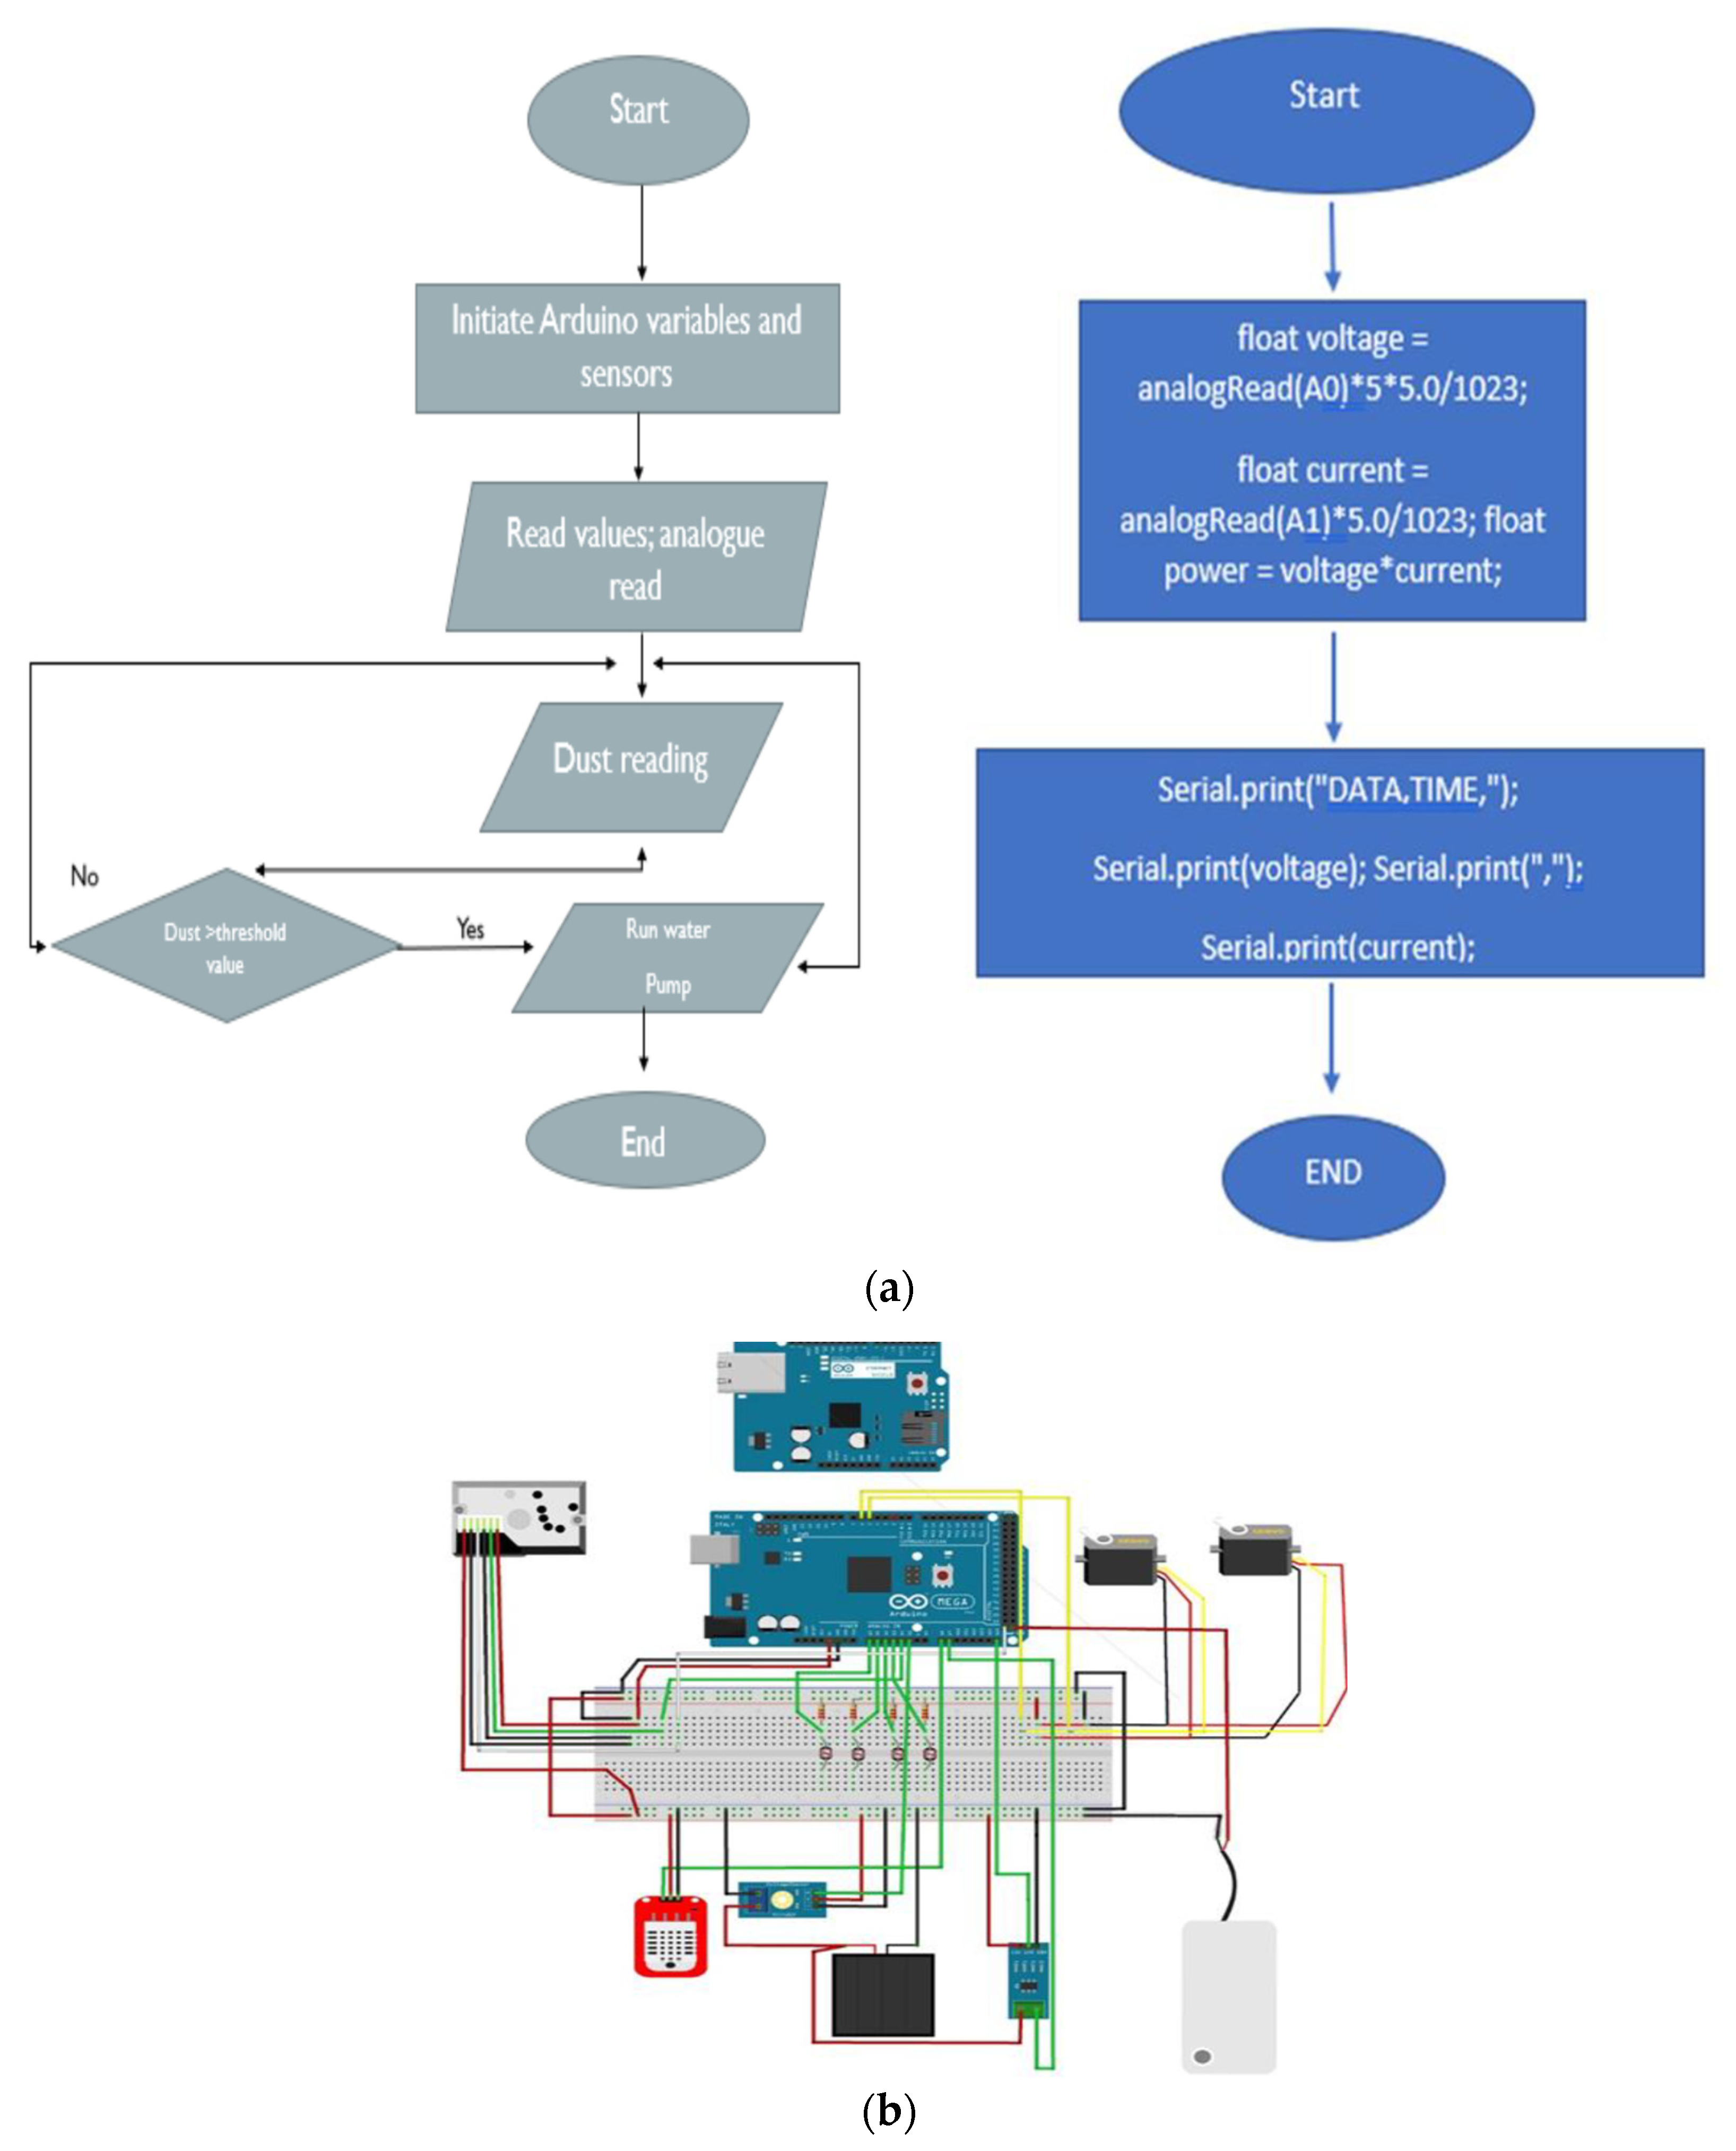
Figure 1. The element that is responsible for moving forward and backward is placed behind a cylindrical tube to facilitate movement. The algorithm and the hardware used to apply this system can be seen in
Figure 2. The detailed design of the system consists of an Arduino Mega2560, ACS712 AC/DC Current Sensor, Voltage Sensor, Dust Sensor, Ethernet module, Relay Module, LED indicators, Water pump, and Servo motors.
2.2. Implementation of the Smart Distribution Board
The system is made up of two main components: A hardware interface module and a software communication module. The hardware of the system is developed following the simulation design using Fritzing and Arduino IDE software tools. The electronic components are constructed on a breadboard to have a better understanding of the hardware connection design.
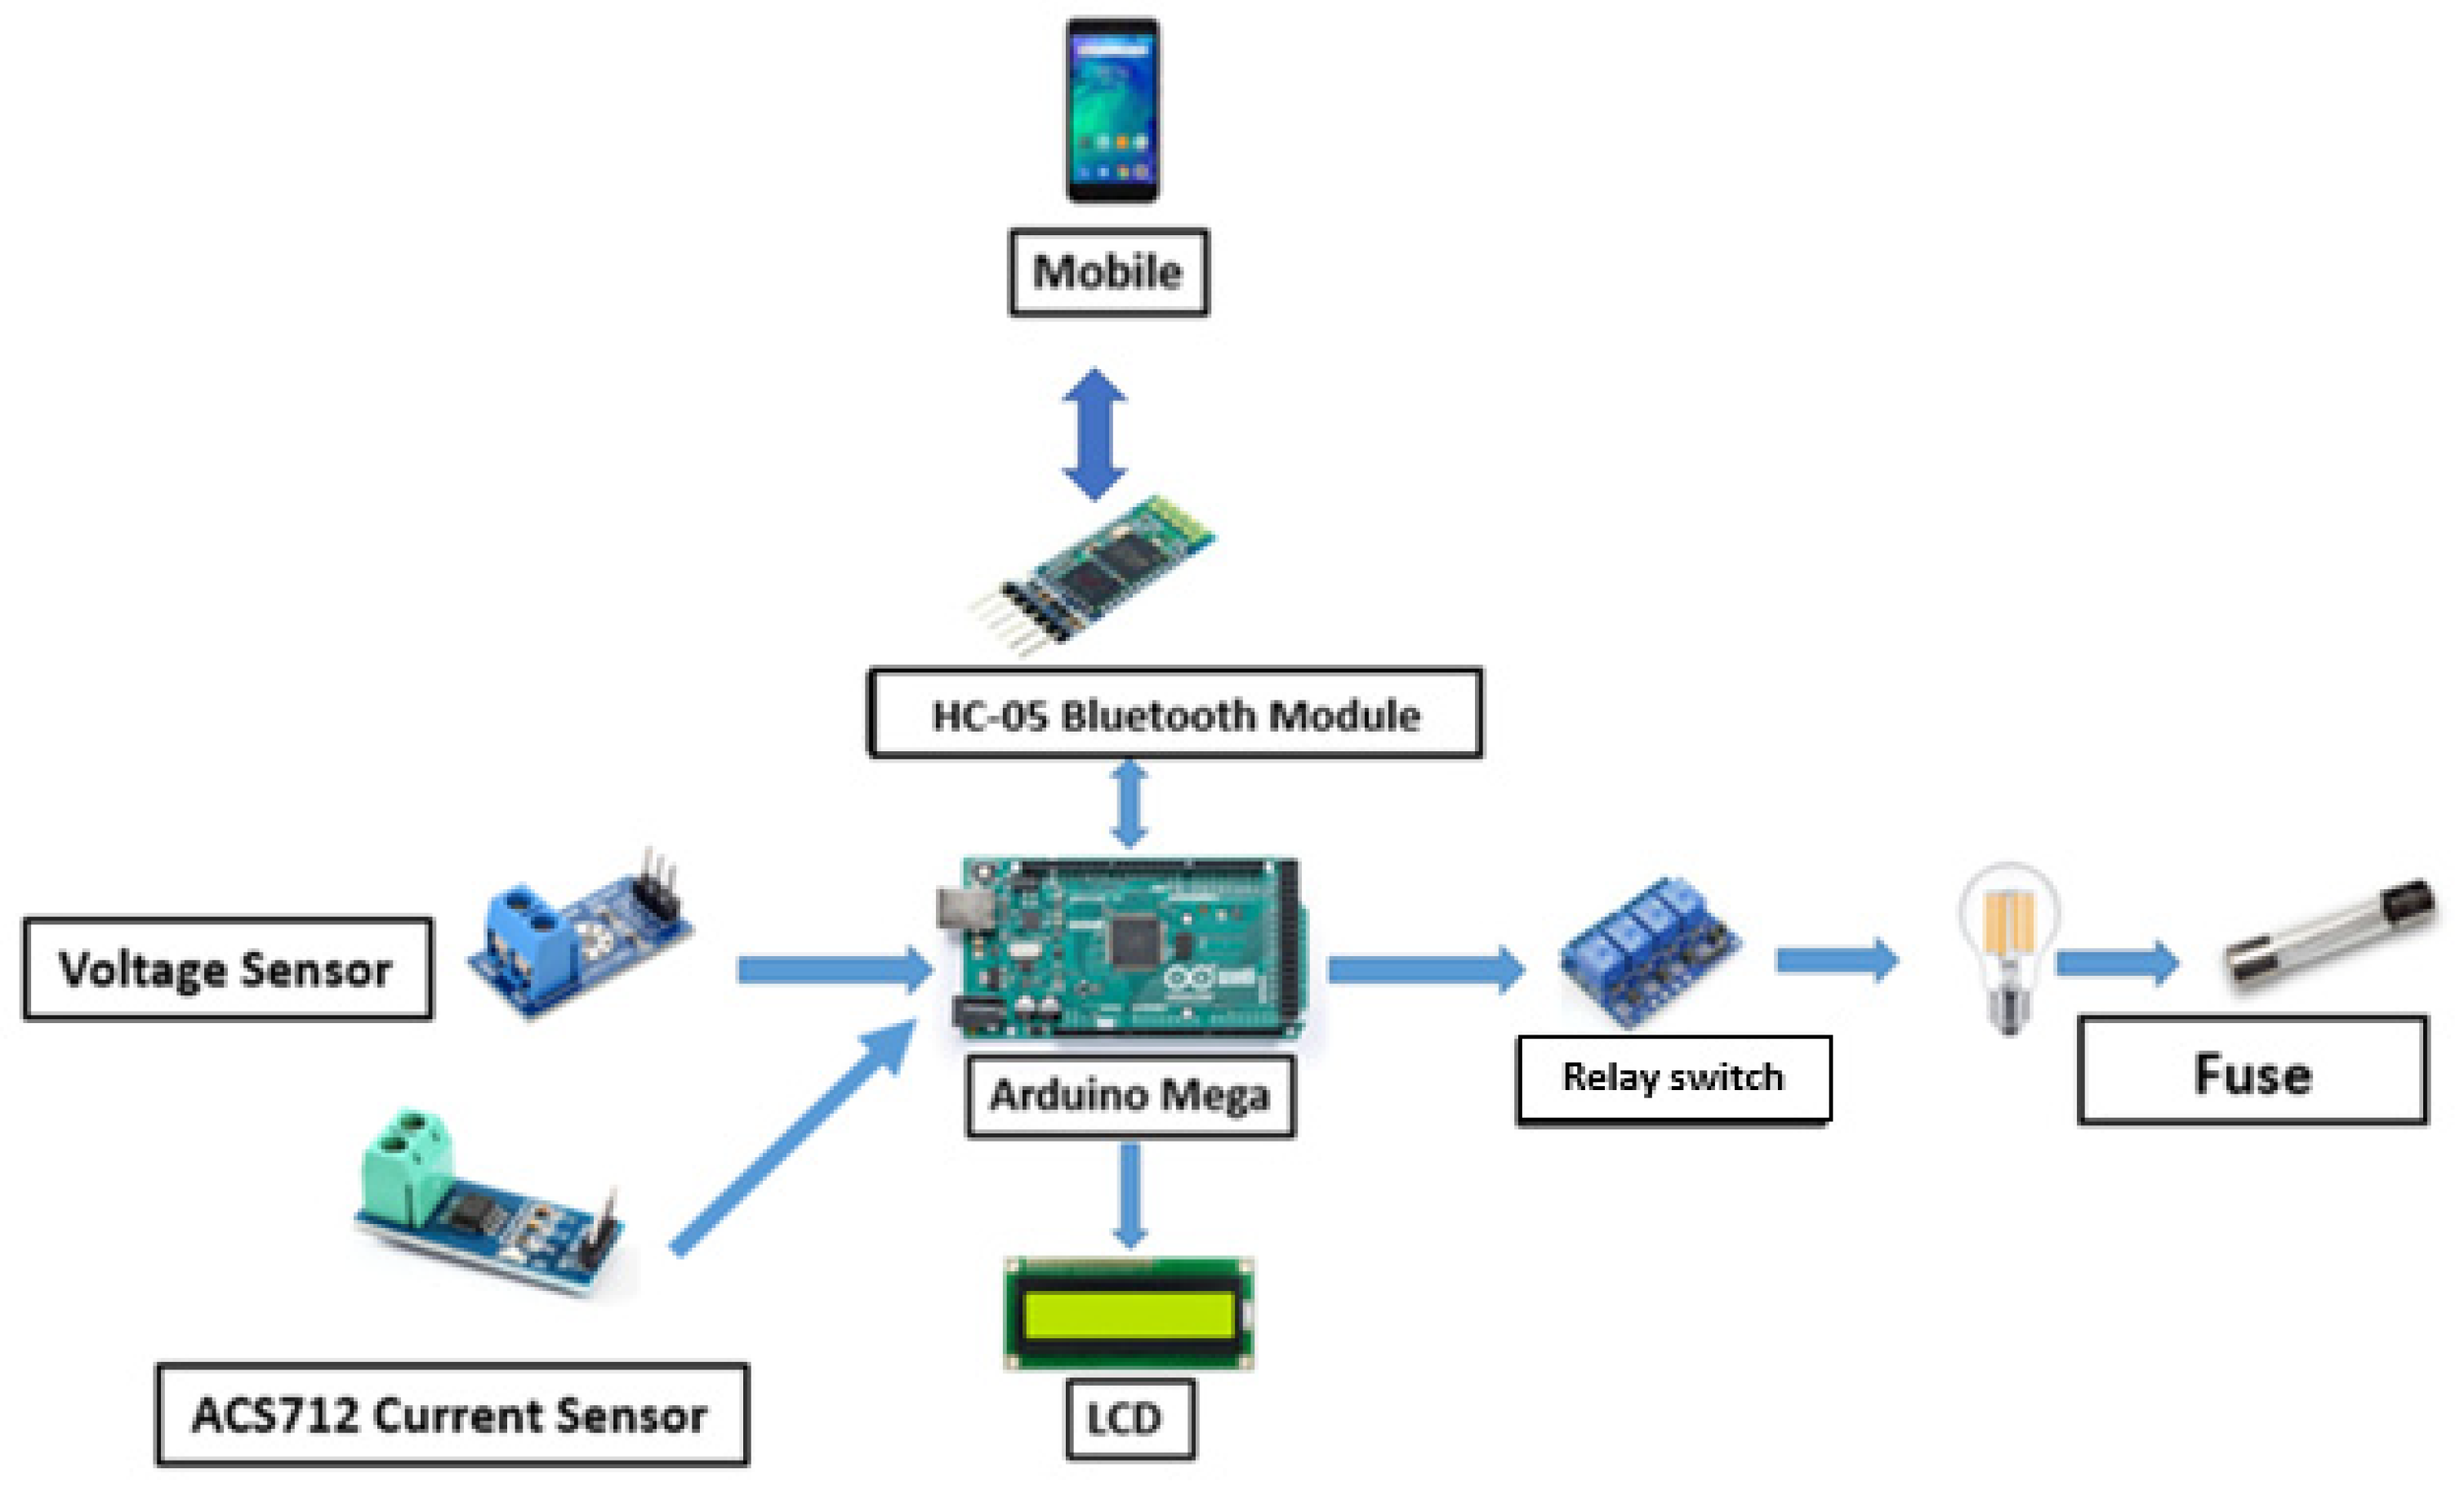
To compete in the global market for home applications, every model must be affordable and simple to install. This work provides a schematic overview of the proposed system, as shown in
Figure 3.
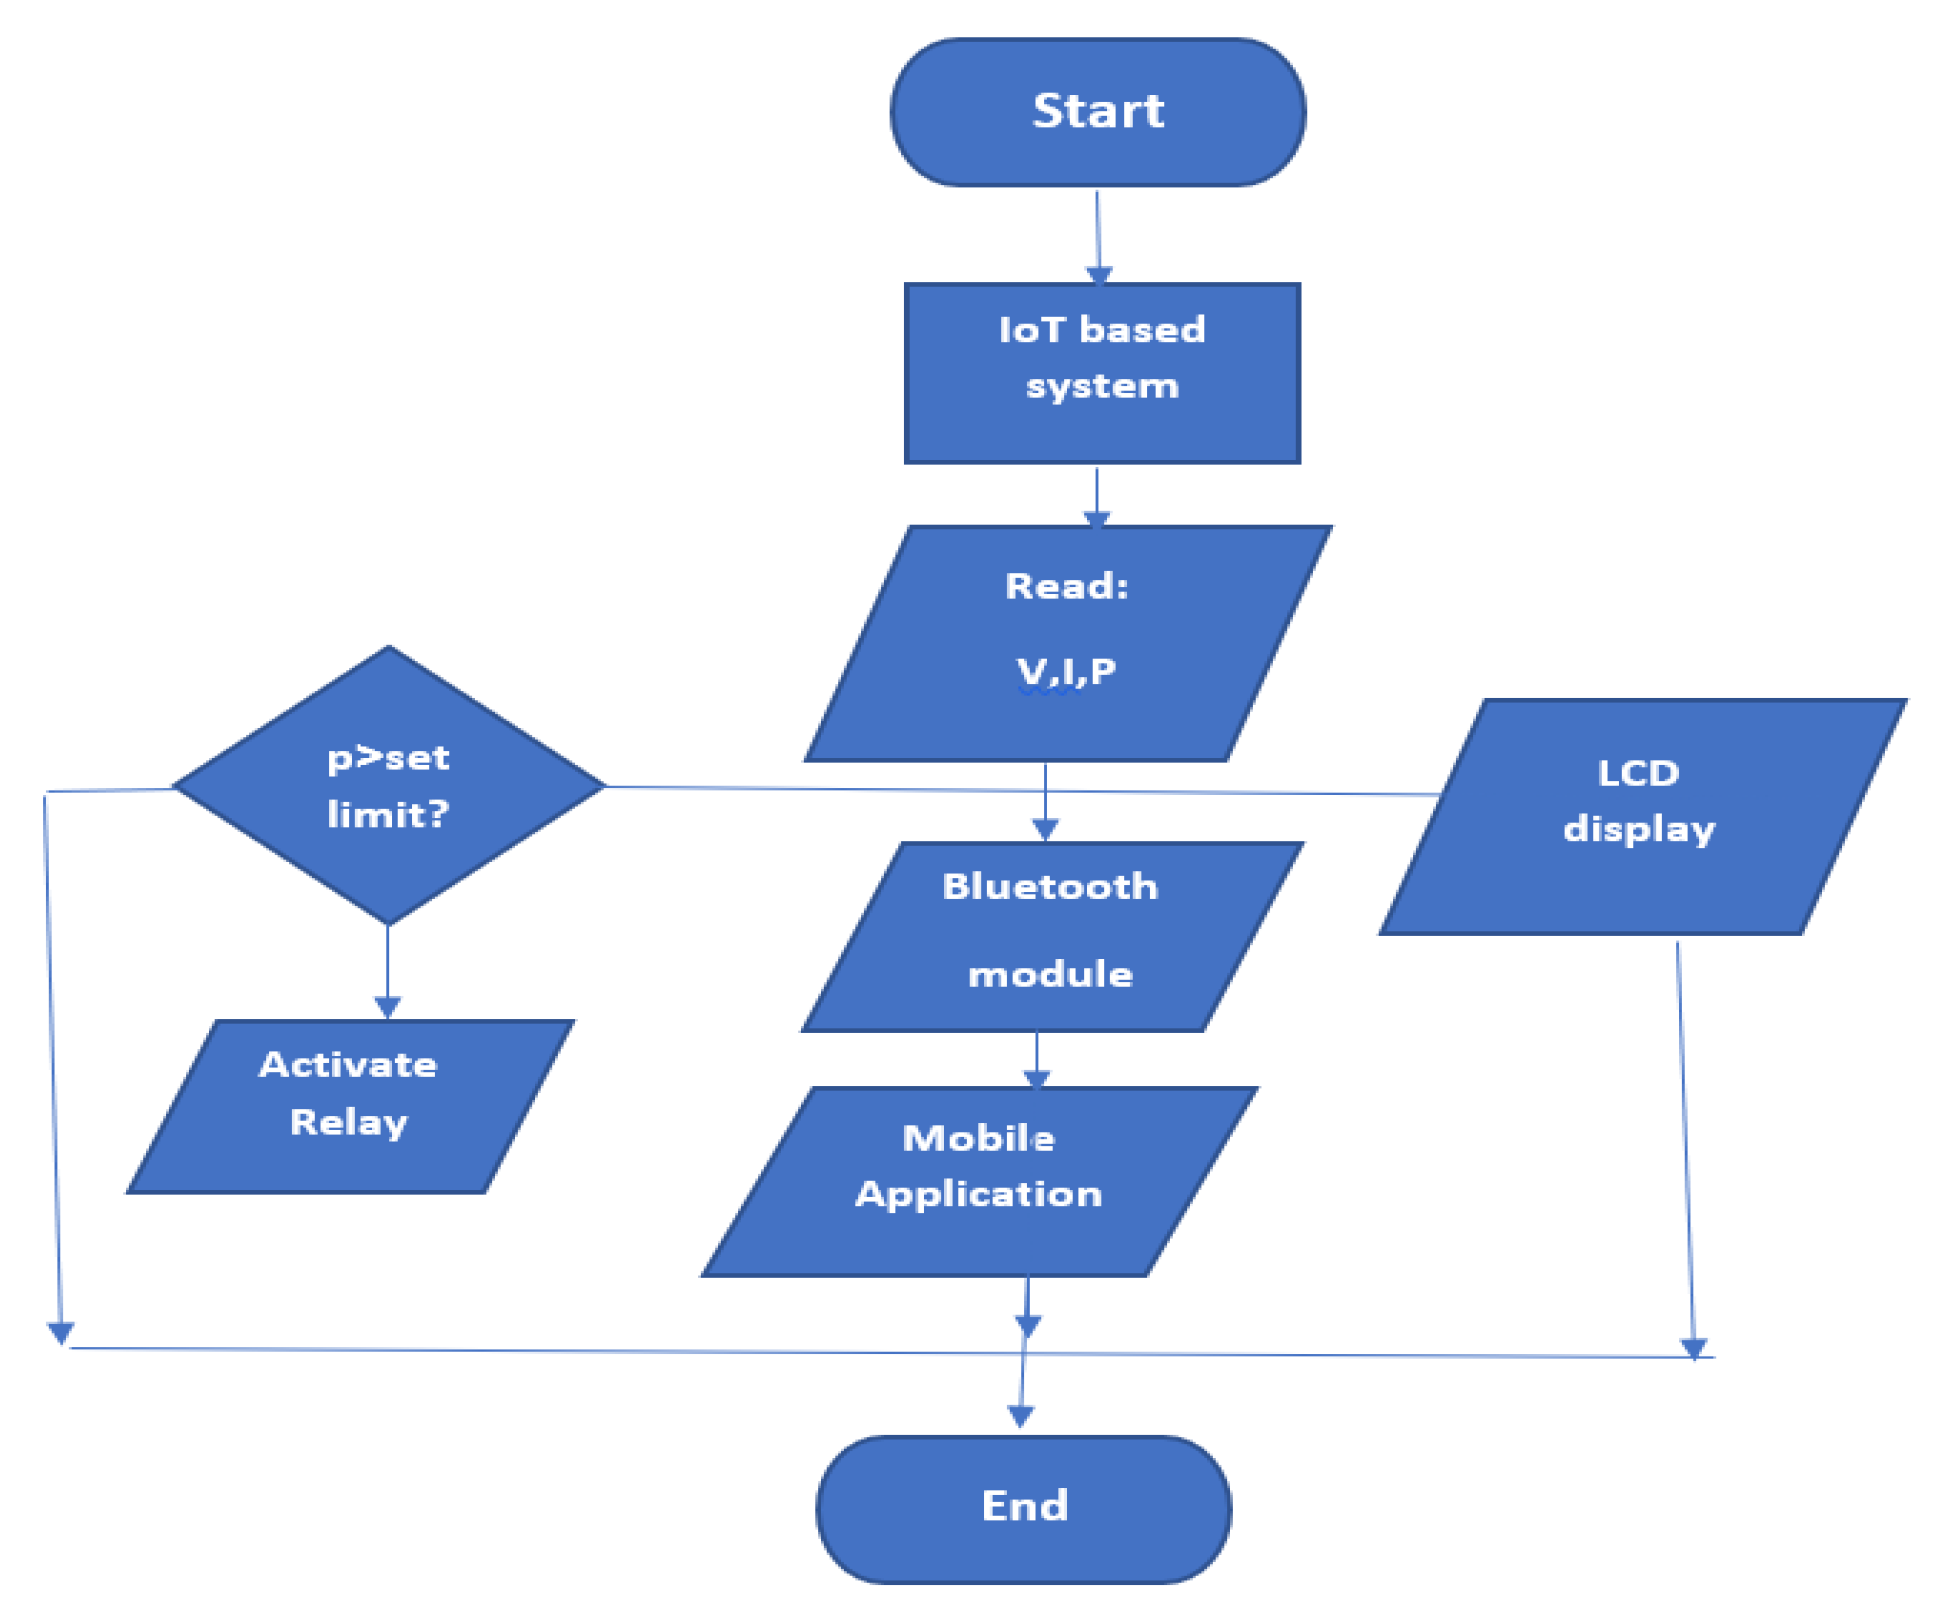
An Arduino microcontroller is installed at the center of the system. All system controls and communication are handled by the microcontroller. The IoT-based system collects data from specified segments, including voltage (V), current (I), and power (P). These results can be viewed via a mobile application or a liquid crystal display (LCD) screen. The control system uses the data gathered by the sensors to determine the consumption of residential loads and disconnects any load when the set limit current or power is exceeded. The suggested system’s flowchart is shown in
Figure 4.
The V, I, and P data are obtained by the IoT-based system in the first stage from the measuring sensors. These data can be viewed on a mobile application or an LCD monitor. Based on the rating of the observed device, the computed power is compared with a specified value. The attached relay is engaged, and this device is disconnected if the measured power exceeds the set limit. Otherwise, the device’s normal operational condition is maintained.
To better understand the hardware connection design, the electronic components are built on a breadboard. The performance of the system is examined through experimental tests.
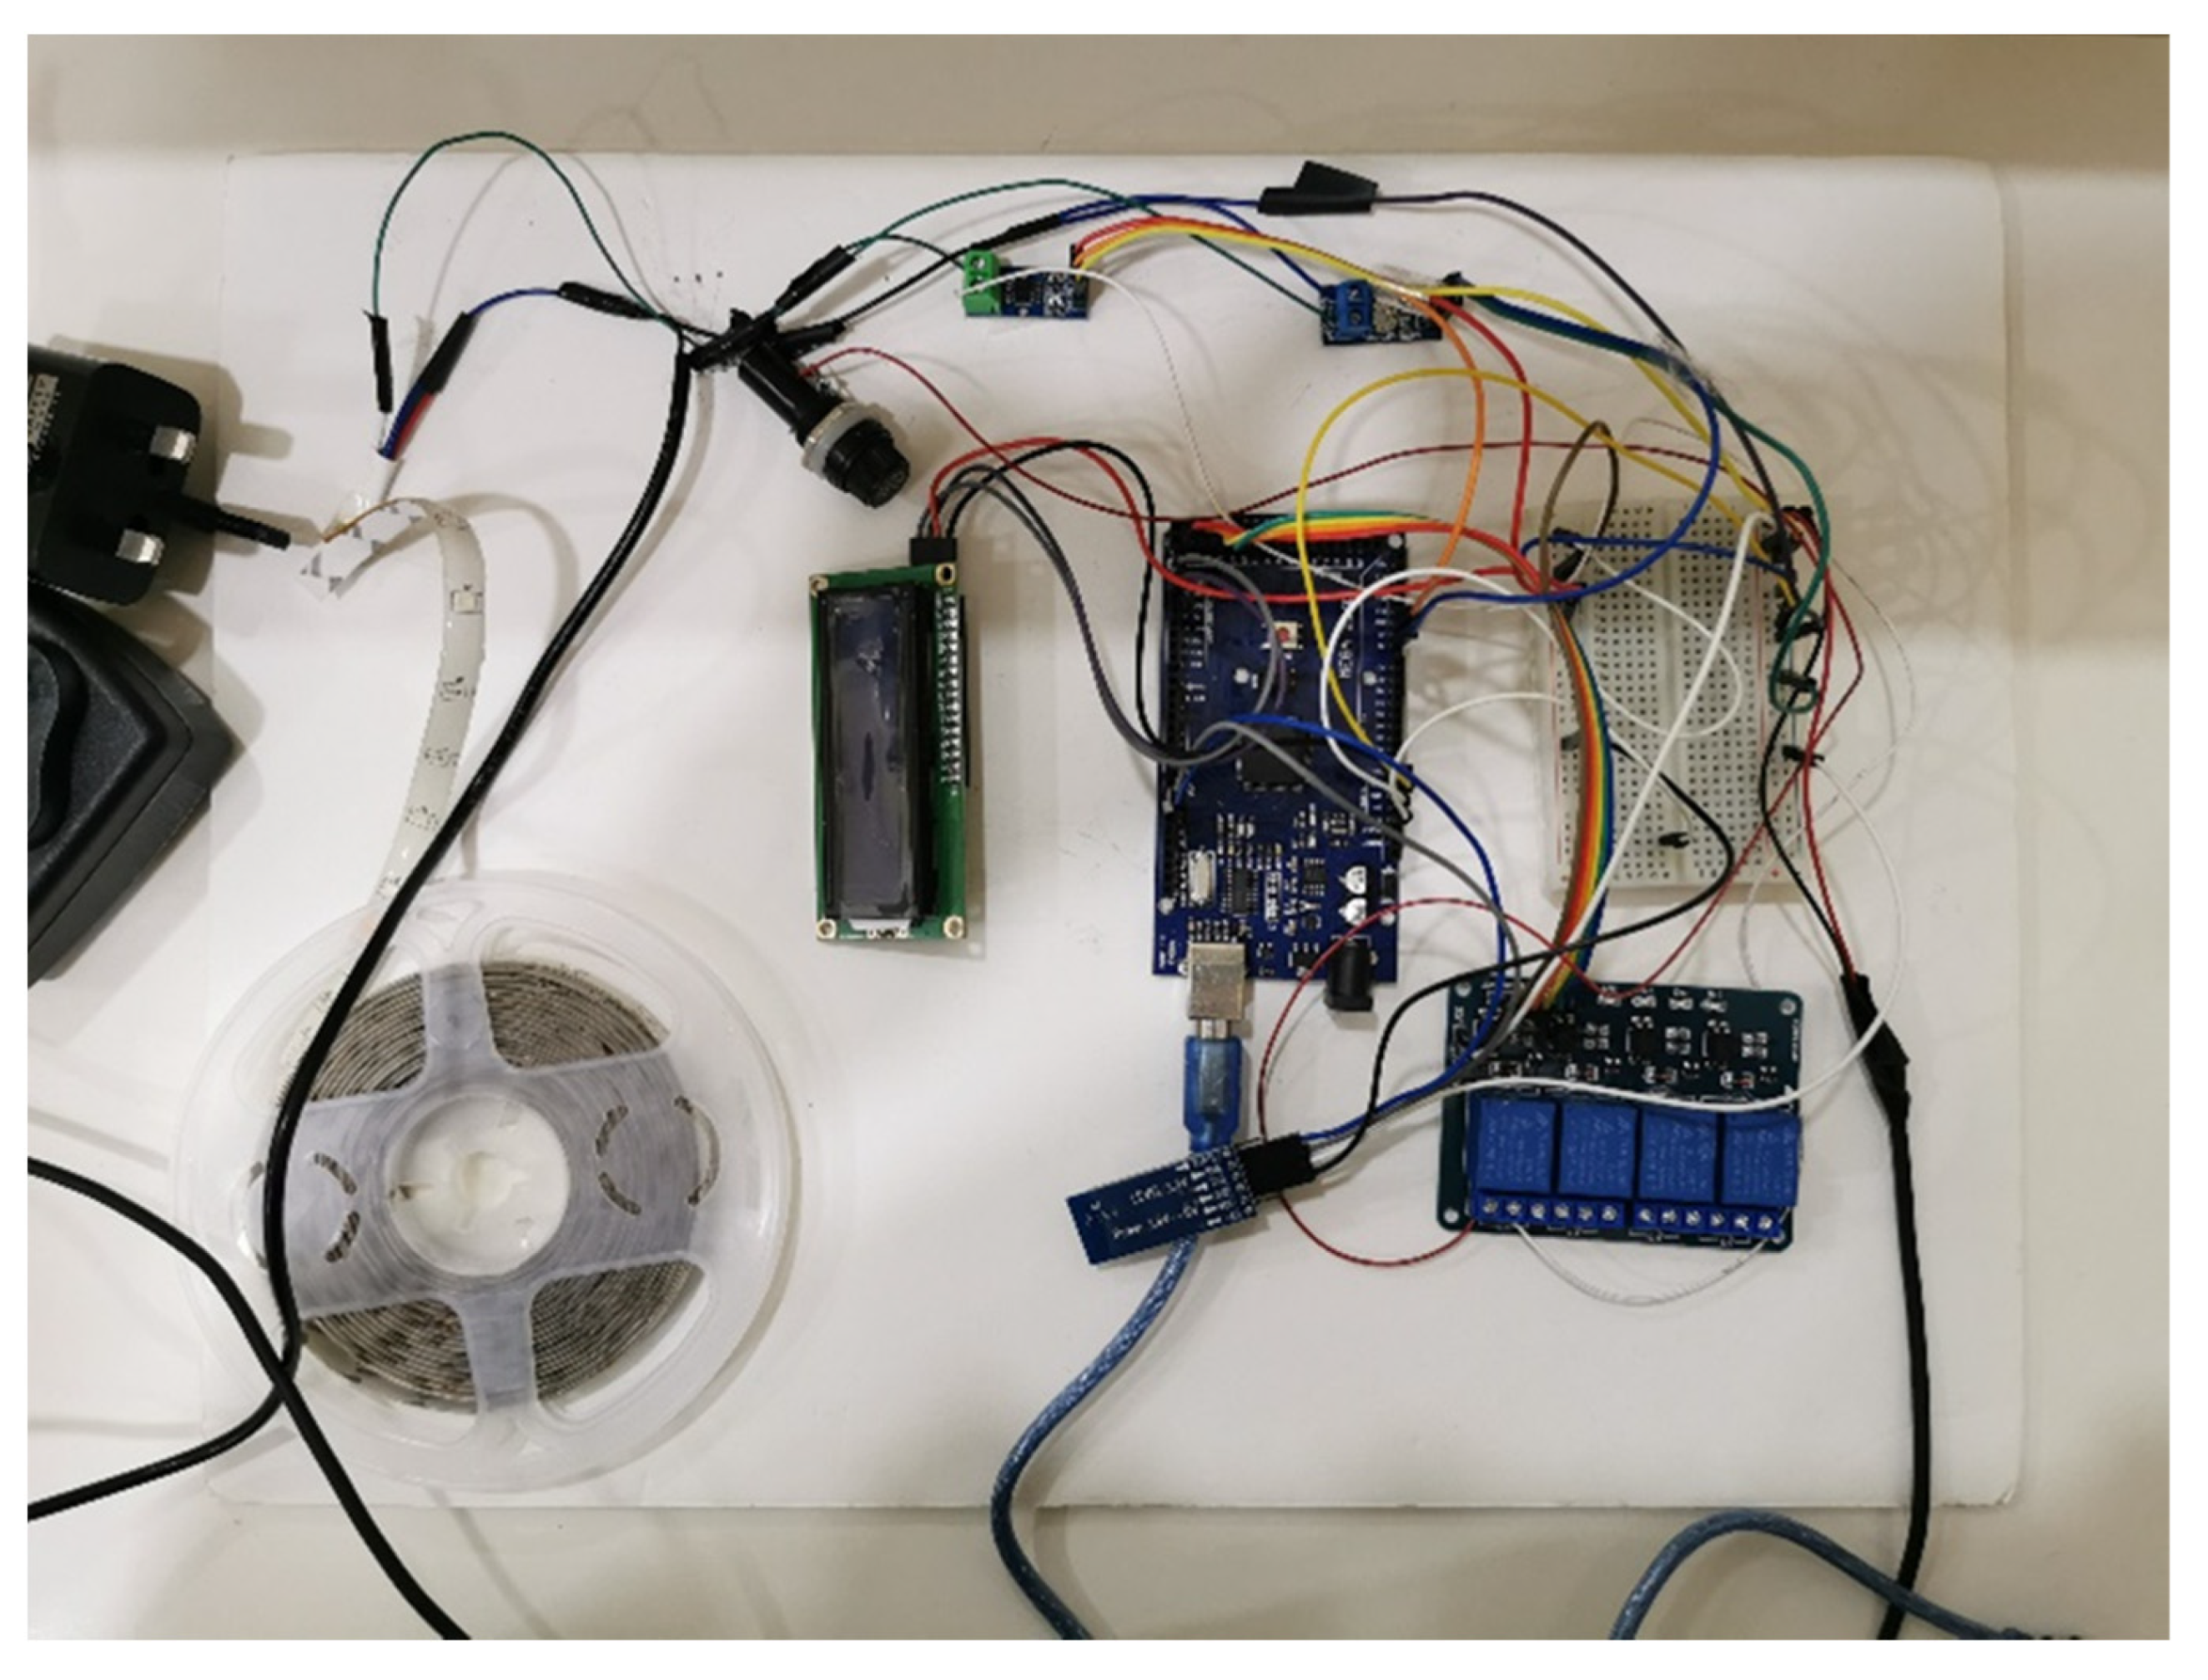
2.3. Hardware Interface
The Arduino IDE 1.8.5 (Integrated Development Environment, Manila, Philippines) software tools are used to design the hardware for the smart distribution system. The designed hardware for the smart home distribution board system is shown in
Figure 5.
The required hardware consists of Arduino Mega2560. The Arduino Mega 2560 is a microcontroller board based on the ATmega2560. It has 54 digital input/output pins (of which 15 can be used as PWM outputs), 16 analog inputs, 4 UARTs (hardware serial ports), a 16 MHz crystal oscillator, a USB connection, a power jack, an ICSP header, and a reset button. It contains everything needed to support the microcontroller. Simply connect it to a computer with a USB cable or power it with an AC-to-DC adapter or battery to get started. The Mega 2560 board is compatible with most shields designed for the Uno and the former boards Duemilanove or Diecimila. The Mega 2560 is an update to the Arduino Mega, which it replaces. The other components are ACS712 AC/DC Current Sensor, voltage sensor, HC-05 Bluetooth module, relay module, some M-F/F-F jumper cables, load (LED), and fuse. The hardware module is connected to an Arduino Mega microcontroller. The microcontroller is responsible for all of the system’s communication and control. In ACS712 AC/DC current sensor and voltage sensor, the system receives various data, including voltage (V), current (I), and power (P) [
19]. The system receives the V, I, and P data from the measuring sensors. These data can be visualized through LCD display. The character LCD is ideal for displaying text and numbers, and special characters. A standard LCD requires over ten connections, which can be a problem if Arduino does not have many GPIO pins available. Using an I2C (Inter-Integrated Circuit) interface, only two connections for an LCD character display are possible. The relay module has one, two, four, and eight channels. The relay module should be powered with 5 V, which is appropriate to use with an Arduino. There are other relay modules that are powered using 3.3 V, which is ideal for ESP32, ESP8266, and other microcontrollers. The calculated power is compared with a predefined value based on the rating of the monitored device. If the measured power exceeds the set limit, the associated relay is activated to disconnect this device. Otherwise, the normal operating condition is maintained. The Electrical load used in this prototype is a 12-volt LED strip, and we can use more than one electrical load up to four loads. The HC-05 Bluetooth module is employed to receive and transmit the data from the sensors to the mobile app that requires a fingerprint sign-in. In addition, the application is employed to monitor the usage wirelessly and remotely. The mobile app receives the sensor’s data through an HC-05 Bluetooth module. The fuse is used to comply with the safety regulations of the buildings equipped with the system, A 2-A fuse is recommended and is used in the experimental setup.
3. Results
The photovoltaic system was controlled by the tracking and cleaning systems to supply the load by the required voltage and current, as shown in
Figure 6.
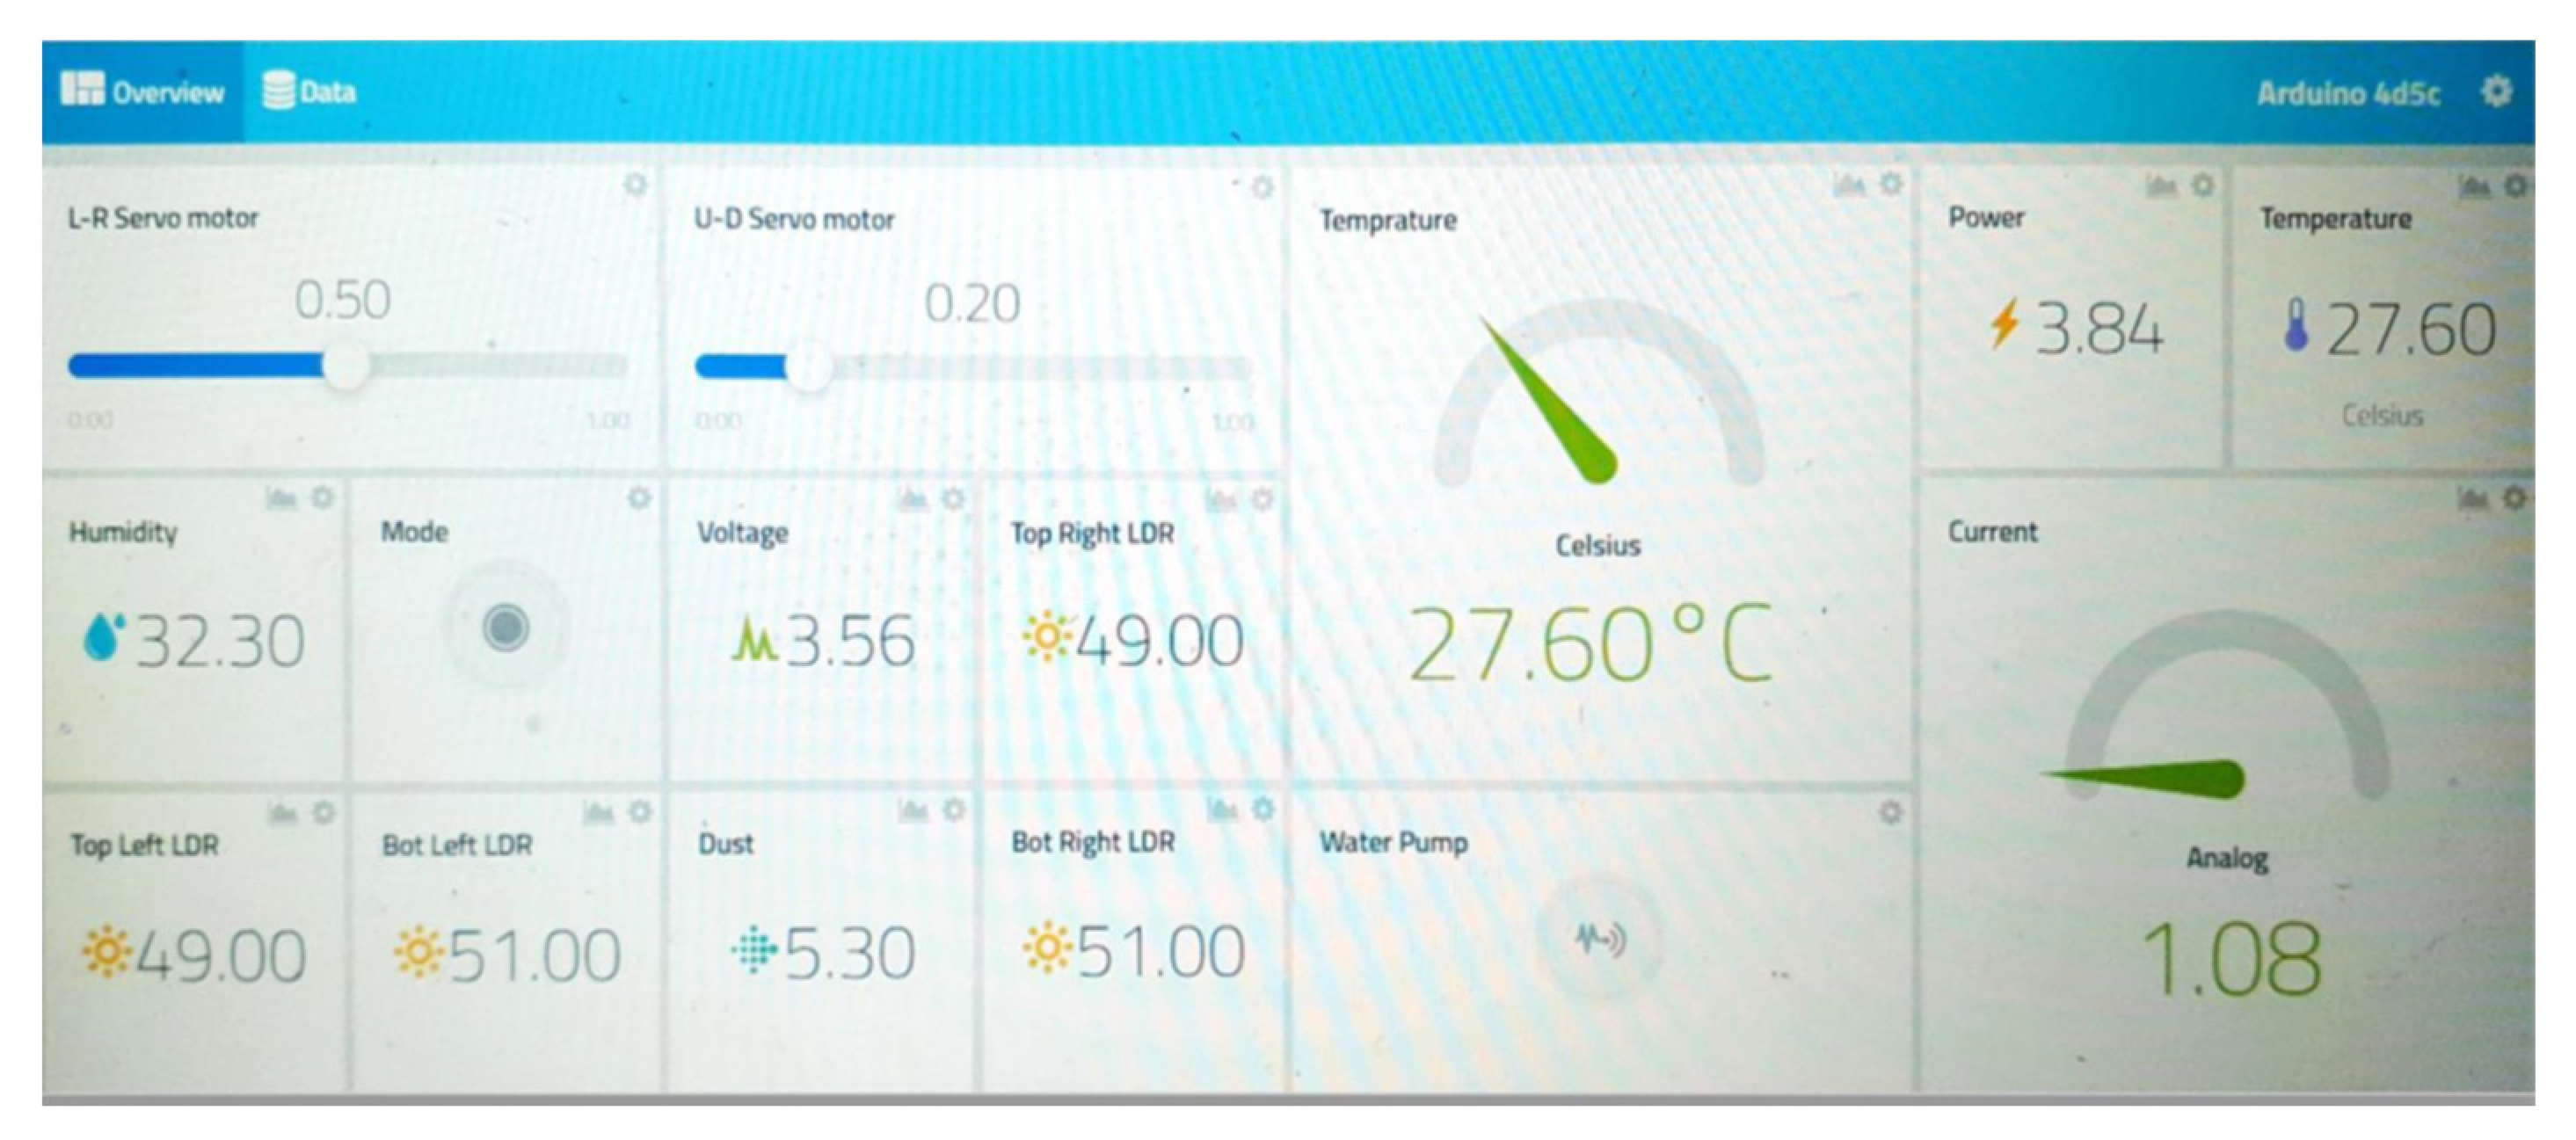
The control screen is shown in
Figure 7. The user will be able to know the voltage, current, available energy, and stored energy, and the option will be to clean the solar panel.
From the available data on the screen, the user will be able to know the measured angles from the lighting sensors, the angle scale, which gives the maximum value of energy, and the option to control the angles will be available by the user.
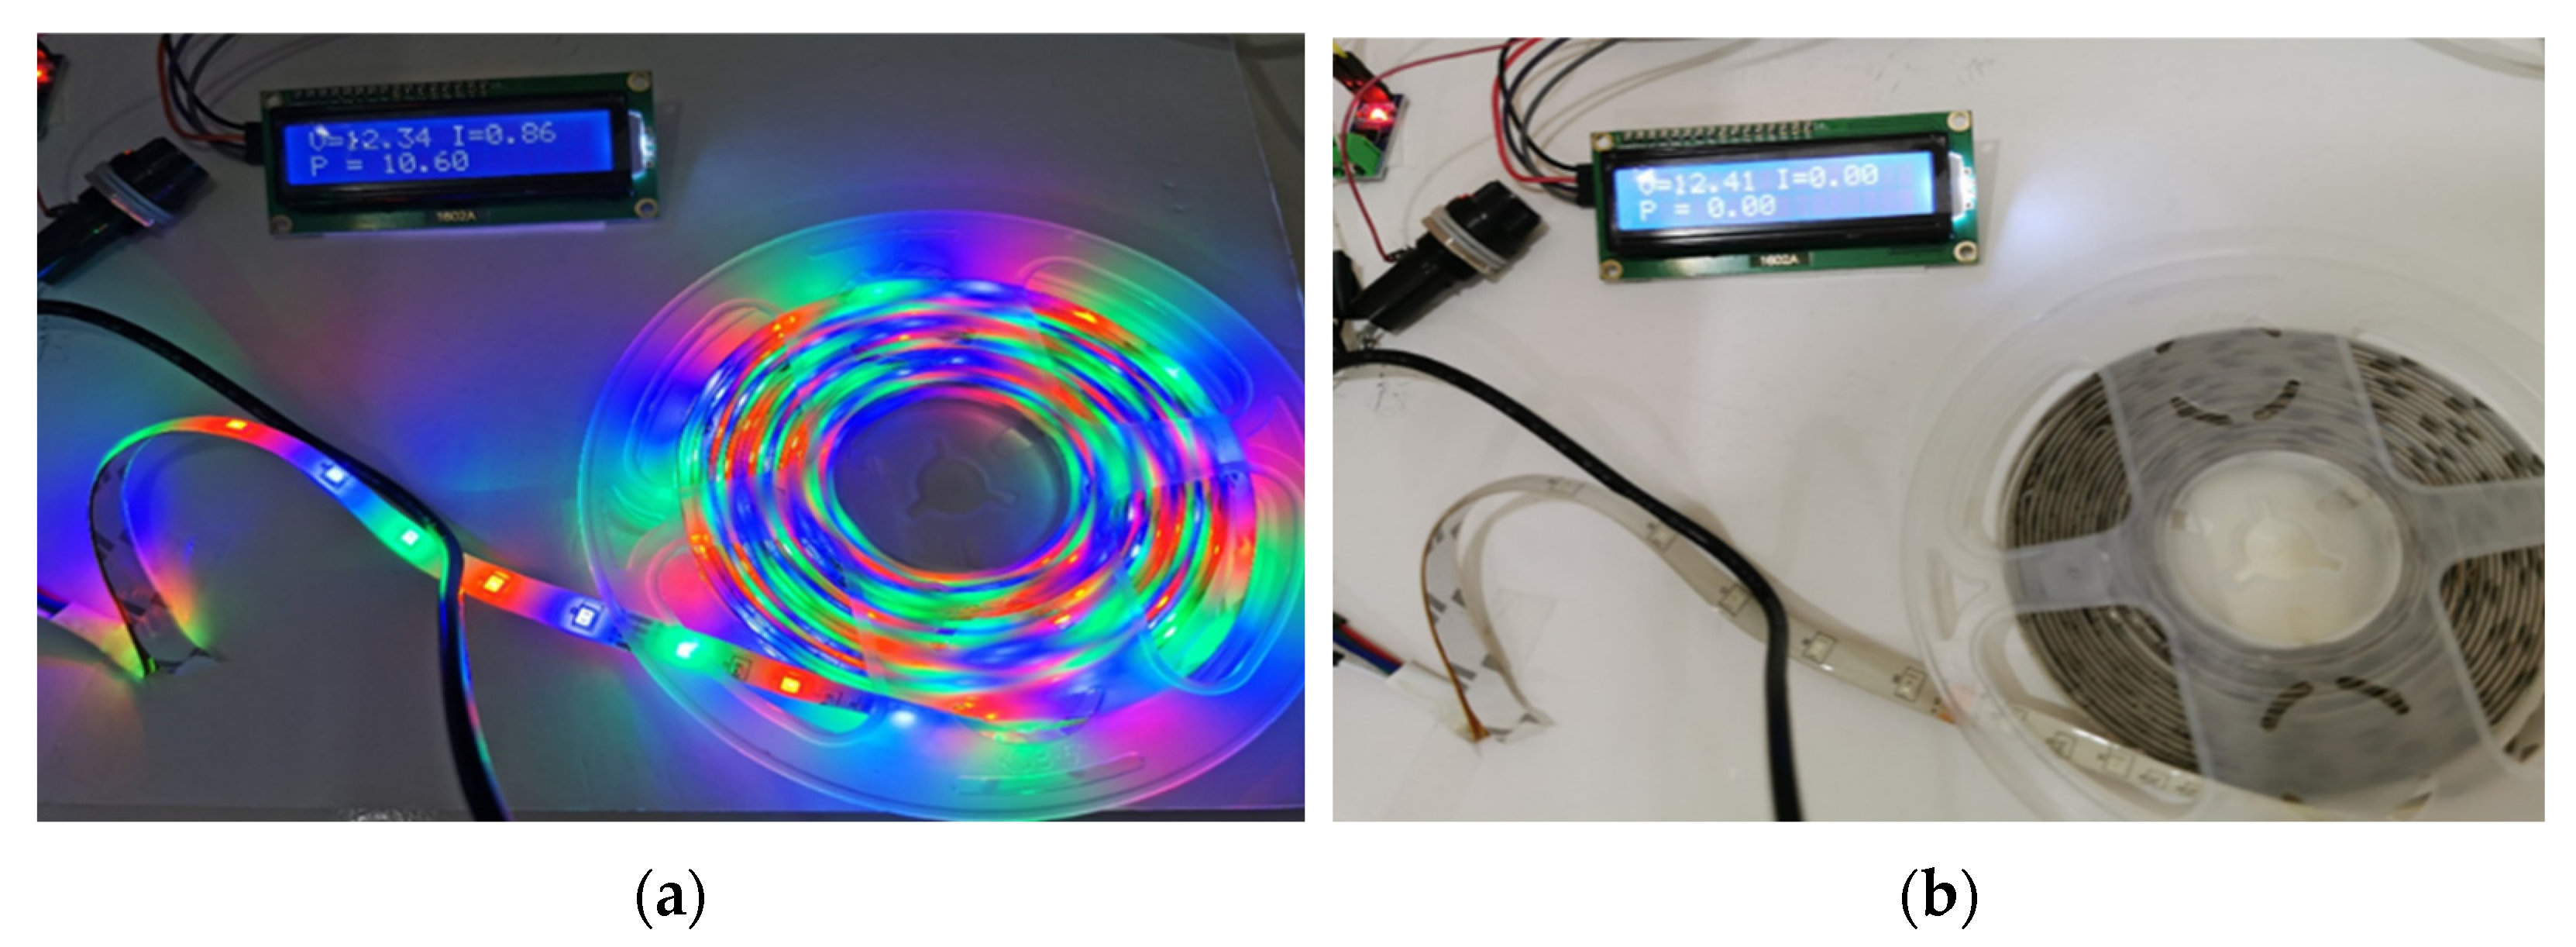
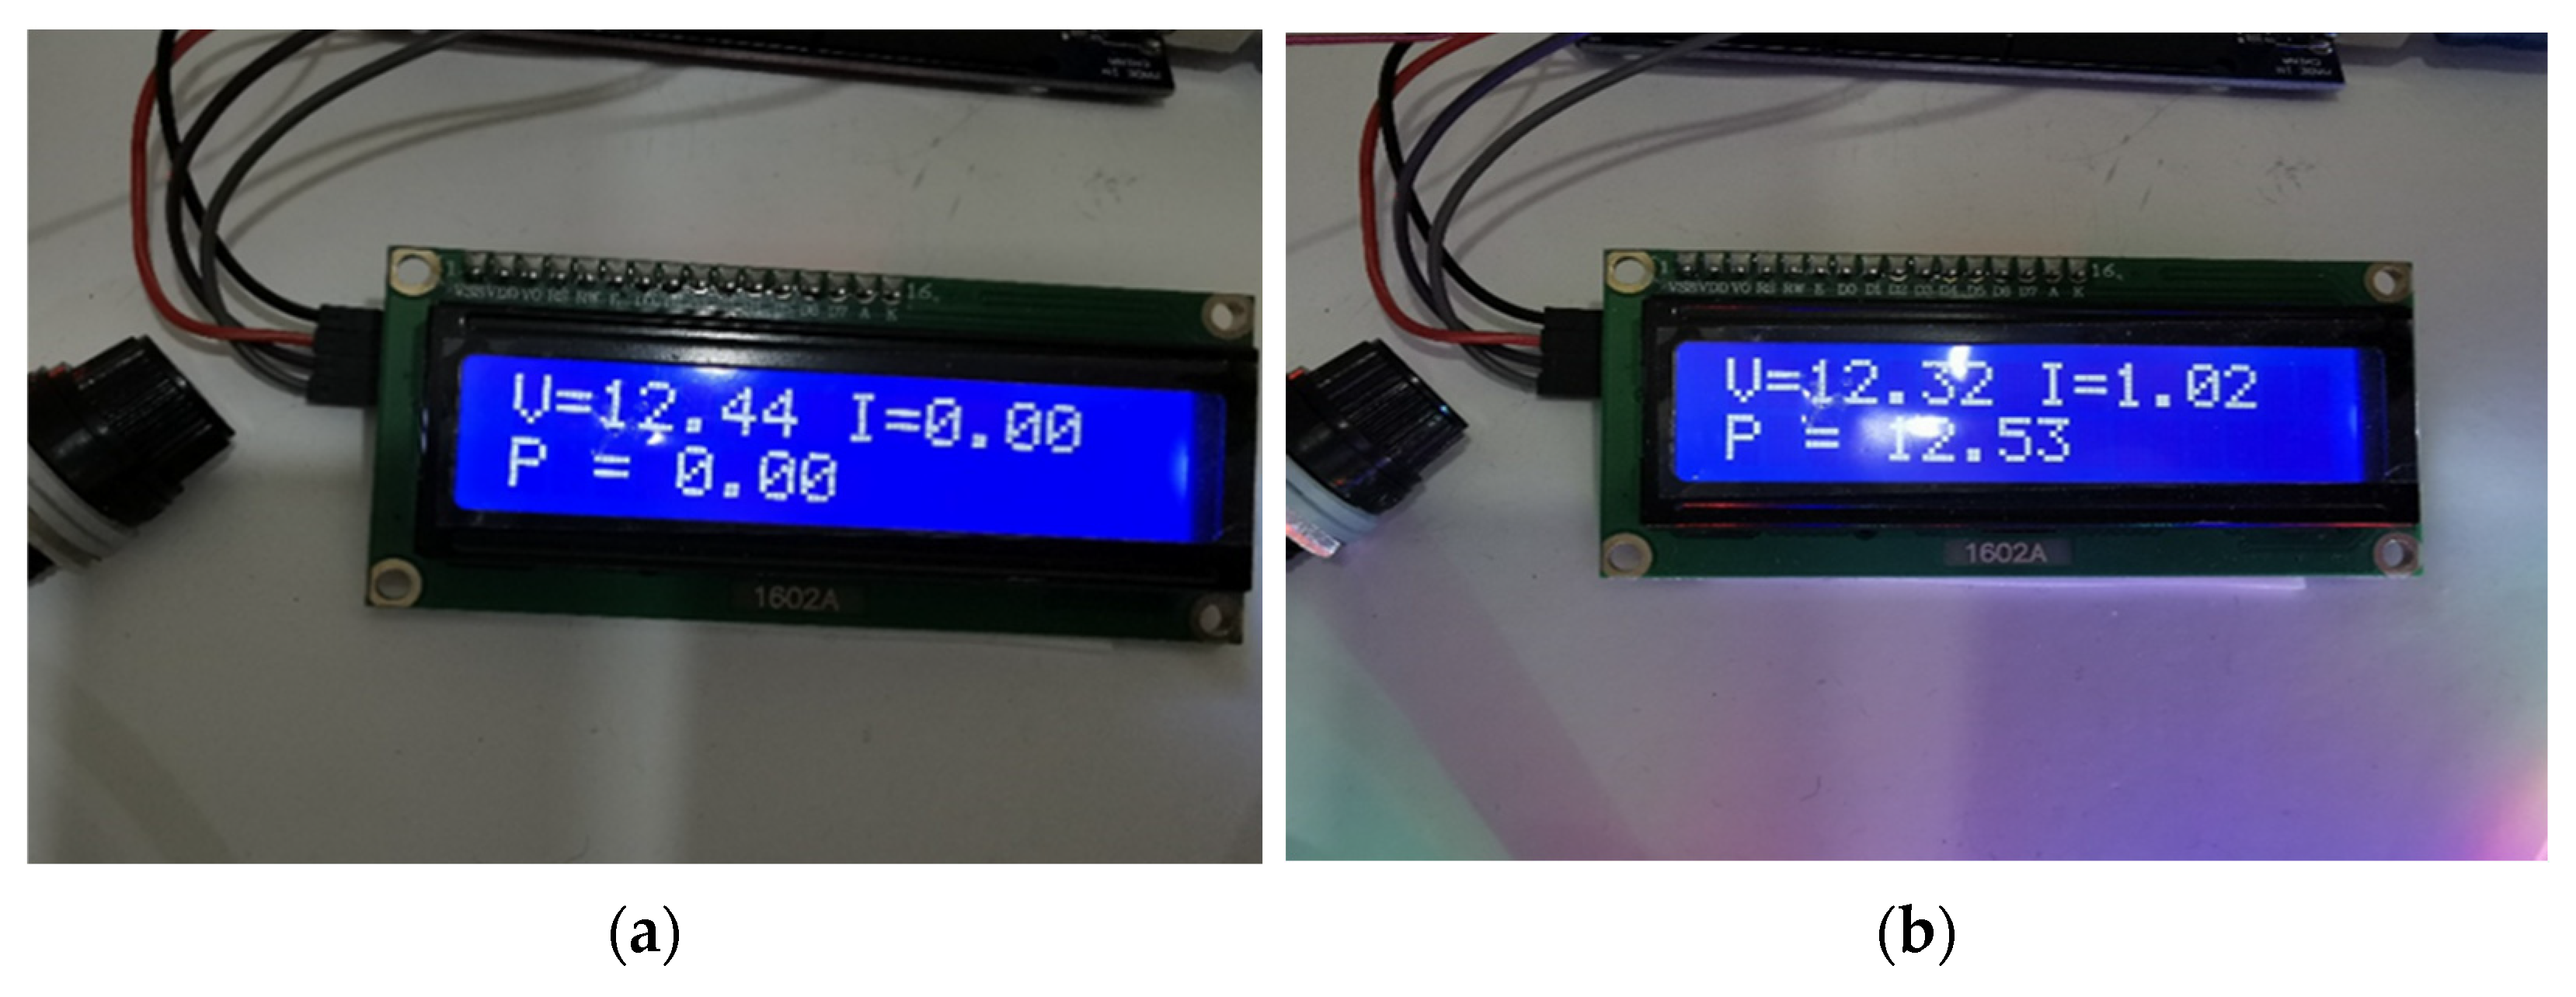
In the suggested smart distribution system, the records can be viewed on an LCD screen or via a mobile application. The following are the calculated results:
The suggested smart distribution system model has been tested with an LED strip. The purpose of the testing was to evaluate the accuracy of the designed system. The operating voltage for the tested LED strip is 12 V. The measurement is displayed on the LCD as shown in
Figure 8a without load in which there is no current and power consumption, and in
Figure 8b with a connected load. The detailed results for the tested load are presented below.
The results for an LED strip with a current fluctuated in the range 0.5 to 1.02 A. The results reveal that the power consumption of the LED strip is within the range of 9 to 12.53 W. The decreased reading may be attributed to an error within the appliance.
Despite the fact that the loads are connected to the Arduino board via sensors, the commanding signal from the Arduino switches turns the loads on or off. This can be done by using the relays in two modes (activation and deactivation) to manage the power usage, as shown in
Figure 9a,b.
An application has been created to facilitate a user-friendly interface. The Kodular project (SDB) was built in this regard, together with data screening (LCD). In addition, the application is employed to monitor the usage wirelessly and remotely. The mobile app receives the sensor’s data through an HC-05 Bluetooth module.
4. Discussion
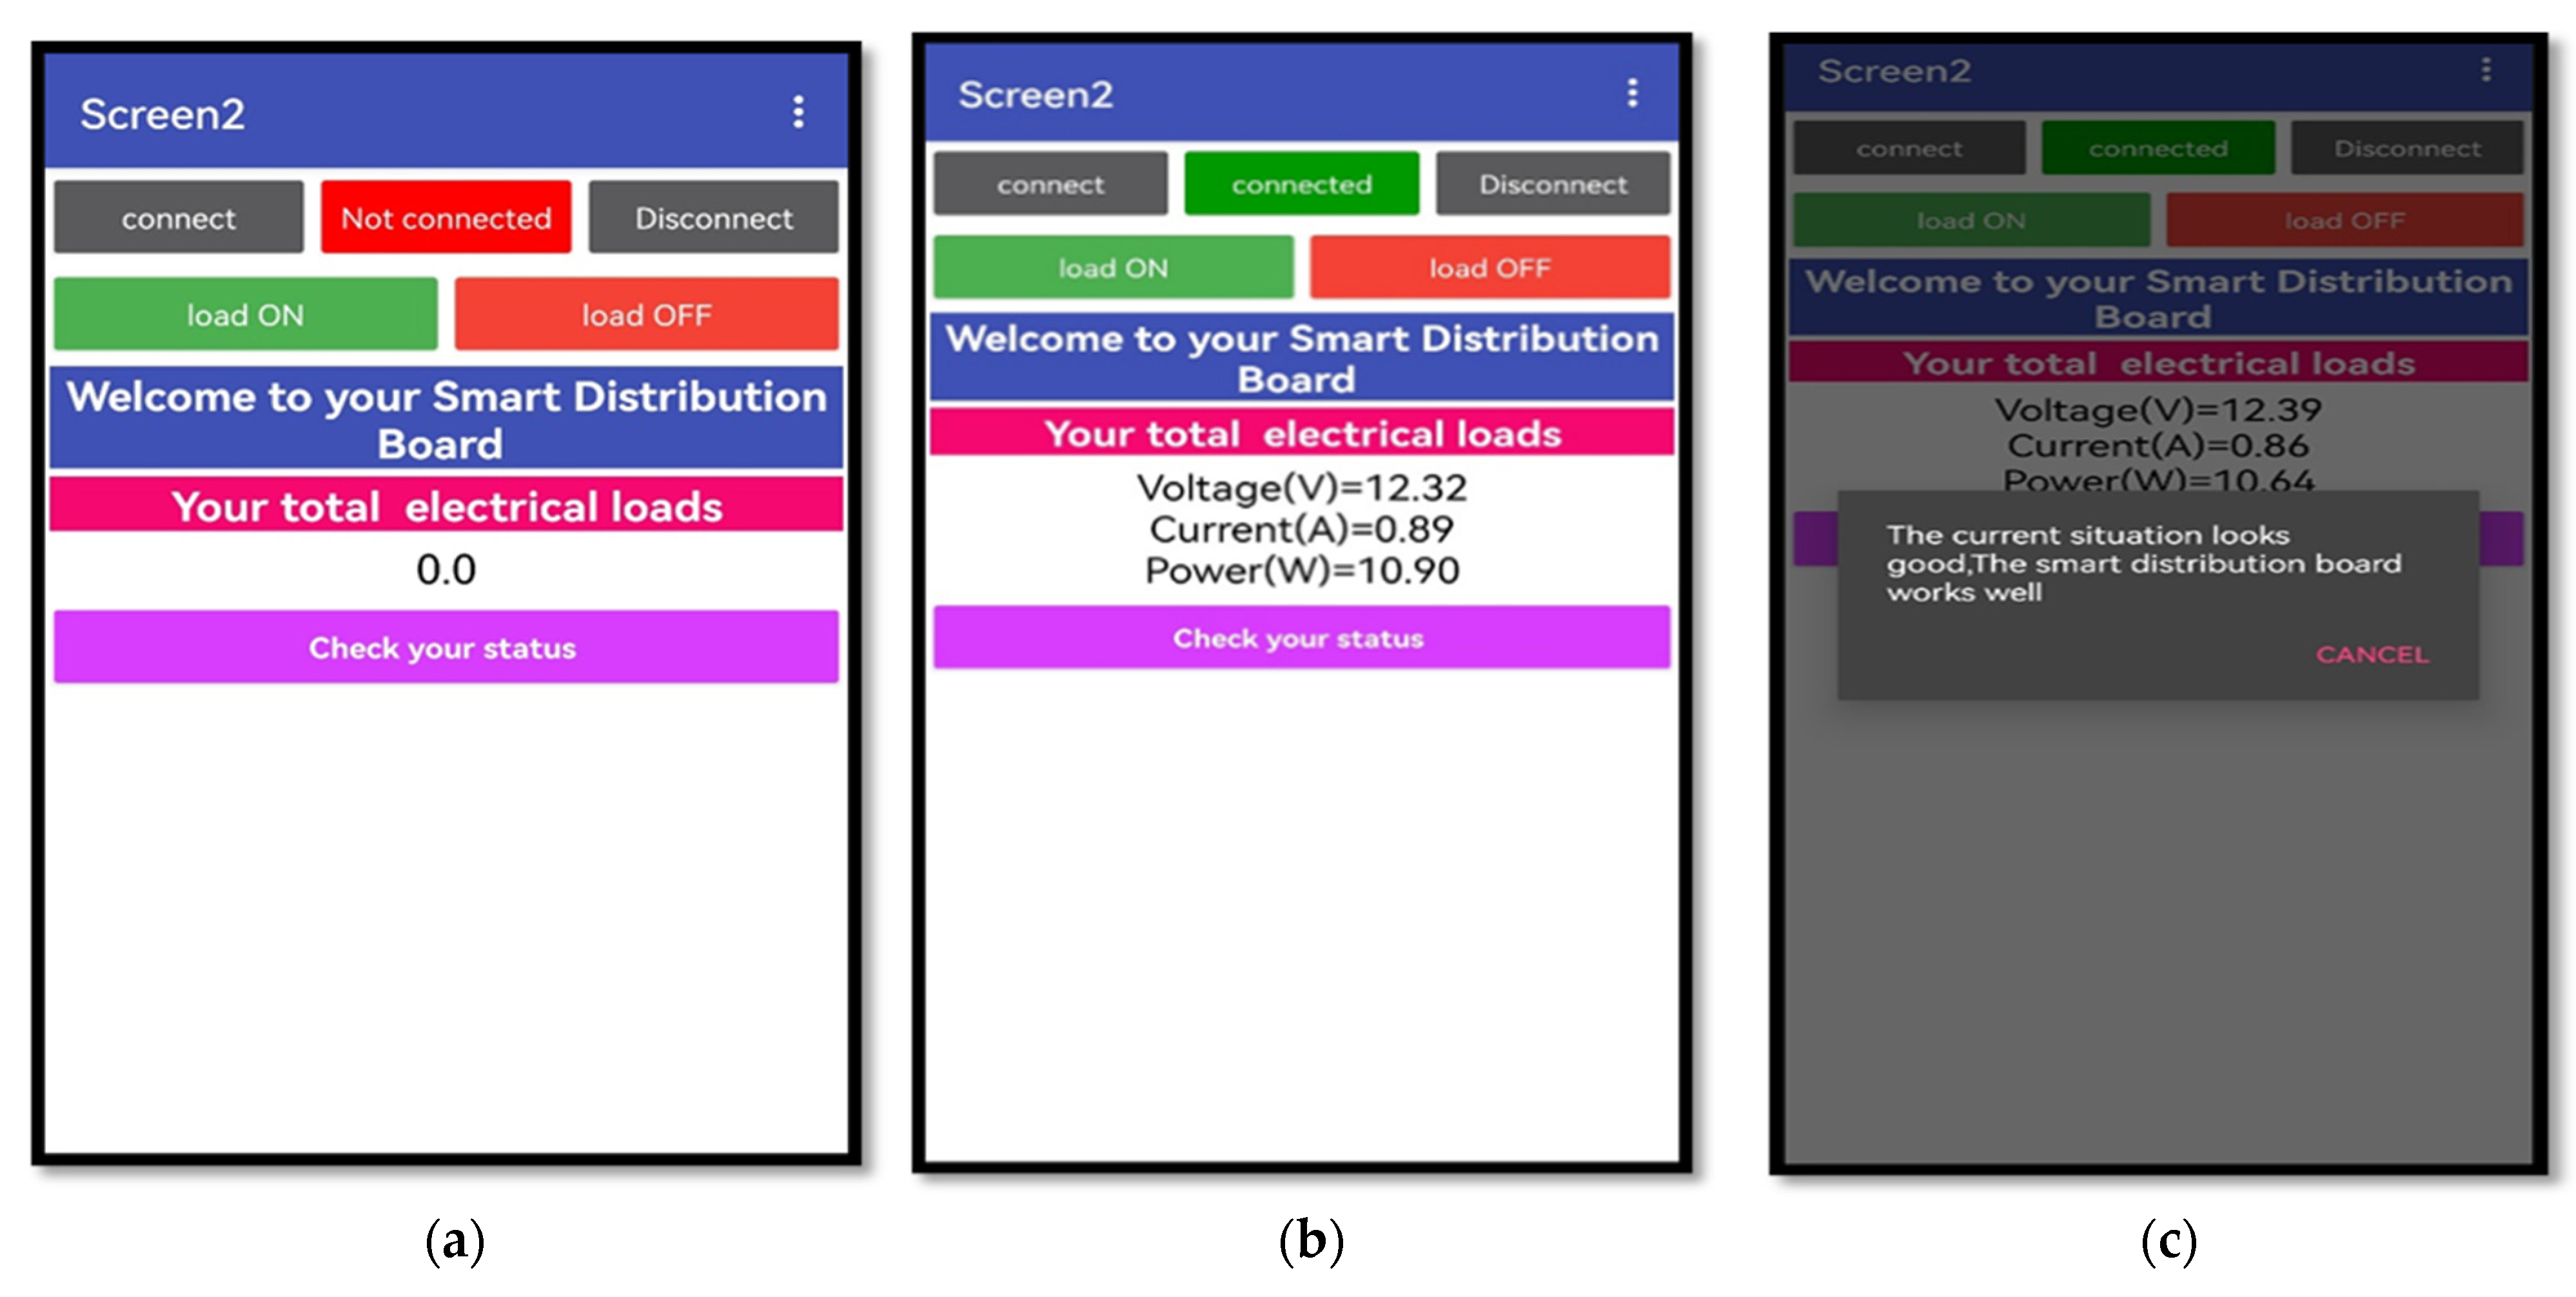
Initial results showed that the developed IoT-based system provides users with a simple monitoring application. As today’s houses are supplied with a variety of smart appliances, energy management of such devices has become critical. This project created an IoT-based smart distribution board to monitor the functioning of various appliances. The designed board can precisely measure the current, voltage, and power consumption of a variety of household appliances. Communication through Bluetooth module tested, with measured data displayed on an LCD and mobile application. The system prototype was successfully created and will be tested with a variety of household appliances, as shown in
Figure 10a–c.
5. Conclusions
As today’s houses are supplied with a variety of smart appliances, energy management of such devices has become critical. This project created an IoT-based smart household distribution board to monitor the functioning of various appliances. The proposed system consisted of two parts, the first part is considering a photovoltaic system with a tracking and cleaning system to guarantee the maximum power that can be delivered to a load that is connected through a smart distribution board. The second part is a smart distribution board, which is a significant improvement over traditional distribution boards in terms of security and safety. If there are any defects, such as short circuits, the user will be notified in real time via the app. This solution encourages users to use energy wisely by delivering real-time usage data, thereby improving their quality of life. Some of the ideas that can be added to the project in the future include implementing artificial intelligence for prediction and analysis, new features like online energy bill payment directly through our application, and online support feature and feedback system for our app to provide a better experience.


