Article

Simulation and Experimental Study of CO2 Transcritical Heat Pump System with Thermoelectric Subcooling

School of Energy and Security Engineering, Tianjin Chengjian University, Tianjin 300384, China
*
Author to whom correspondence should be addressed.
Designs 2022, 6(6), 115; https://doi.org/10.3390/designs6060115
Submission received: 31 August 2022 / Revised: 10 November 2022 / Accepted: 11 November 2022 / Published: 16 November 2022
(This article belongs to the Topic Building Energy and Environment)

Abstract

:
In order to improve the efficiency of the system and promote its application in other industries, the performance of a thermoelectric subcooled CO2 transcritical heat pump system was studied. A simulation model of the system was established using steady-state lumped parameter technology, and the experimental data were compared with the simulation results. The effects of cooling and chilled water flow rate and temperature, subcooling degree, compressor discharge pressure on the coefficient of performance (COP), and heating coefficient of performance (COPh) were analyzed. The results showed that COP/COPh increased with the increase in cooling and chilled water flow rate and chilled water temperature and decreased with the increase in cooling water temperature. The experimental COPh and COP of the system with a thermoelectric subcooler increased by 4.19% and 4.62%, respectively, compared to the system without it. The simulated data was in good agreement with the experimental data, and the error was within 10%, thus verifying the correctness of the model. When the subcooling degree increased to 11 °C, the system simulation results showed that COP/COPh increased by about 40% and 13.3%, respectively. The optimal high pressure was about 8.0 MPa, which corresponded to the maximum COP and COPh of the system of 3.25 and 4.25, respectively. The research results can provide a theoretical basis for future system optimization.

1. Introduction

The world is paying more attention to environmental concerns due to fast economic expansion. At the 75th session of the United Nations General Assembly, China proposed the targets of “carbon peak” by 2030 and “carbon neutral” by 2060 to address the issue of global warming [1]. The main solution to the problem of carbon dioxide emission is to reduce the use of fossil fuels [2]. Heat pump technology has the potential to minimize the usage of fossil fuels while enhancing energy efficiency. The use of artificial (unnatural) working medium in heat pump units will cause environmental issues. For a long time, the widespread use of refrigerants, such as HFC, has intensified the global greenhouse effect [3,4]. To address this issue, China ratified the Kigali Amendment to the Montreal Protocol, which came into effect on 1 June 2022. The use of HFCs is also anticipated to be significantly reduced in the Chinese market [5,6]. The use of natural ingredients as refrigerants has gained widespread attention in recent years. Due to its advantages of large volume cooling capacity, good compatibility, low price, low viscosity, and low pressure ratio, carbon dioxide has begun to be used as a refrigerant worldwide [7]. However, CO2 transcritical heat pump cycles also have several drawbacks, such as high operating pressure and large throttling losses, which result in low circulation efficiency [8,9].
In order to improve the system efficiency and reduce throttling loss, Dai et al. [10] proposed a new type of thermoelectric subcooler–expander coupled CO2 transcritical refrigeration cycle and analyzed the energy losses and efficiencies in detail. Rigola et al. [11] used theoretical and experimental results to show that the CO2 transcritical cycle with an internal heat exchanger could increase the cooling capacity and COP.
A thermoelectric subooler (TESC) is composed of multiple thermoelectric elements in series or in parallel. Thermoelectric modules are able to pump heat from a cold surface to a hot surface through the Paltier effect. Its advantages include small size, light weight, reliable performance, and ease of use. It has been documented that the performance of a thermoelectric cooler in a heat exchanger is related to the influence of heat transfer area, thermal conductivity, and heat transfer mechanism [12,13]. In addition, the performance and operational reliability of TESC are significantly affected by the joule heat generated by the input current inside the module [14].
To improve the effectiveness of cooling facilities, many authors have proposed thermoelectric subcooling in transcritical CO2 refrigeration systems. Koeln et al. [15] found that subcooling the outlet of the gas cooler of a CO2 transcritical refrigeration system could significantly improve the efficiency of the system. In a heat pump experiment, Wang [16] discovered that including a subcooler might raise the product’s energy efficiency ratio. Yang et al. [17] found that the application of a thermoelectric subcooler at the outlet of the air cooler in the transcritical CO2 cycle could effectively improve the efficiency of the whole system. Li et al. [18] designed a subcooling device based on the principle of thermoelectricity and found that the cooling effect of the thermoelectric subcooling device was the best at 12 V working voltage. Astrain et al. [19] compared a CO2 transcritical refrigeration system with a thermoelectric module, an air-cooled CO2 transcritical system, and a system with internal heat exchange and found that the cooling efficiency of the system with a thermoelectric module was higher than the other two systems. Sánchez et al. [20] proposed a thermoelectric subcooling system and tested it in a CO2 transcritical refrigeration unit. The results showed that under optimal operating conditions, the COP and cooling capacity of the refrigeration unit could be increased by 9.9% and 16.0%, respectively. Aranguren [21] conducted an experimental study on a transcritical CO2 compression cycle with a thermoelectric subcooler, and the results showed that the experimental COP increased by 11.3% and the cooling capacity improved by 15.3%.
Most scholars have established models to analyze the performance of CO2 transcritical refrigeration cycles with thermoelectric subcoolers. In addition, some scholars have conducted research only through experiments. In this study, the performance of a transcritical CO2 refrigeration cycle with a thermoelectric subcooler was investigated by experiments and simulation models. The system model was simulated by MATLAB software. In addition, the influence of chilled water flow rate and temperature, cooling water flow rate and temperature, compressor discharge pressure, and subcooling degree on the performance of the system was also analyzed. The purpose of this study was to provide theoretical suggestions for further improving the performance and optimization of such systems.

2. Experiment Test

2.1. Refrigeration System

This section describes the configuration of a single-stage vapor compression system, including a thermoelectric subcooler (TESC). Figure 1 shows the schematic diagram of a refrigeration system and the system’s P–H diagram.
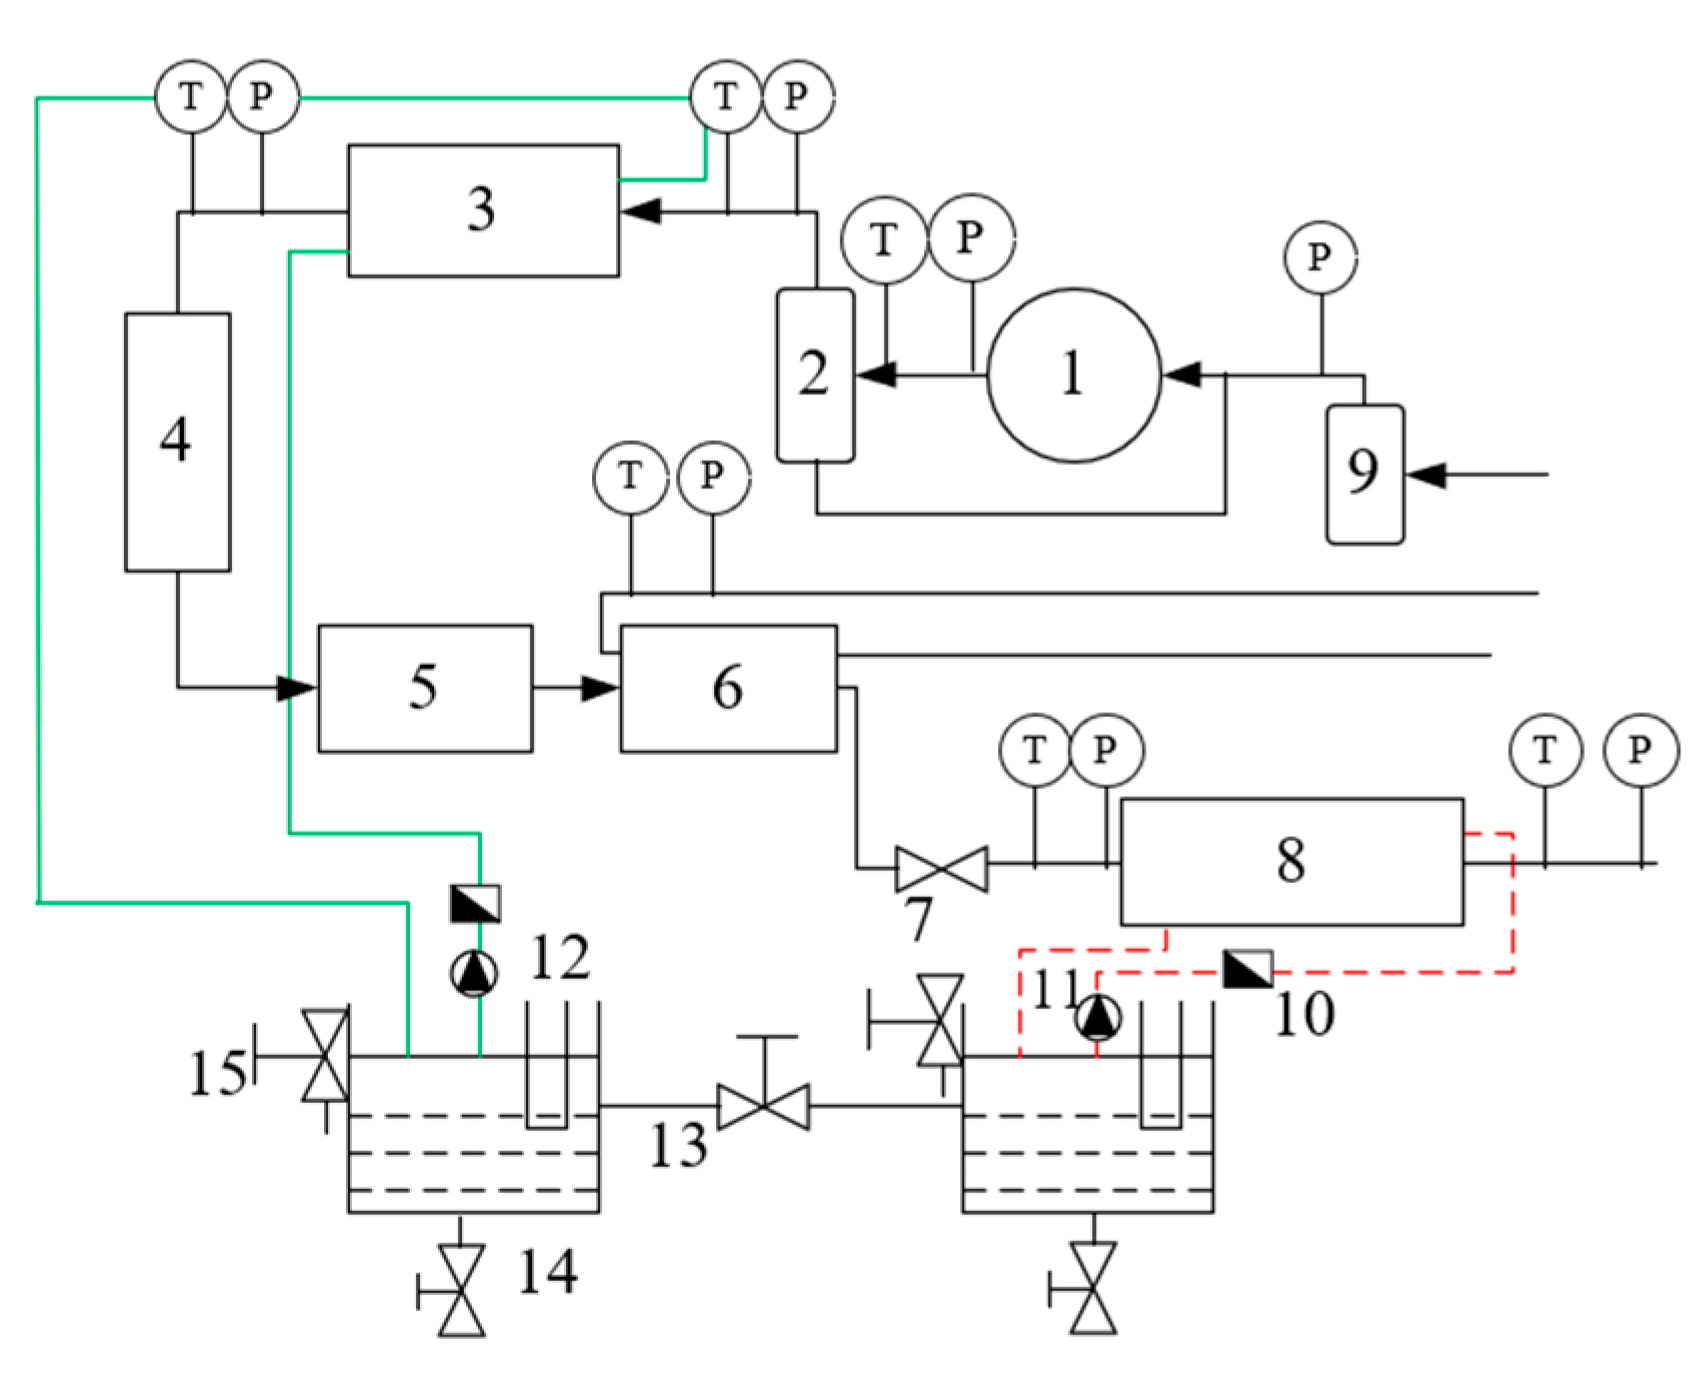
The four main components of the experimental system were the CO2 heat pump system, the water system, the data collecting system, and the control system. Figure 2 provides a flow chart of the system.
The main components and technical parameters of the heat pump system are shown in Table 1.

2.2. Thermoelectric Subcooler (TESC)

The thermoelectric subcooler is composed of thermoelectric refrigerating sheets, a cold plate, and a radiator. The cold plate is mounted at the cold end of the stack. The thermoelectric subcooler uses the Peltier principle. Semiconductors are divided into N-type and P-type according to the different charge carriers. When the power is turned on, an electron transition occurs at the contact of these two semiconductor materials, which generates or absorbs energy, forming a cold and hot junction.
For a thermoelectric refrigerating sheet, the theoretical cold end cooling capacity ( Q c ) and power consumption ( W e ) can be calculated using Equations (1) and (2), respectively [10].
Q c = α p α n A T c 0.5 A 2 R K T H T C
W e = ( α p α n ) A T c + A 2 R
where α refers to the Seebeck coefficient, V/K; P and N refer to the subscripts; A refers to the current; TC refers to the cold end temperature in K; R refers to the resistance in Ω; K refers to the thermocouple thermal conductivity, W/K; and Th refers to the hot end temperature in K.
In order to better measure the pros and cons of the thermoelectric subcooler, the ratio of the cooling capacity to the power consumption of the thermoelectric subcooler, namely, the efficiency COPsc, can be calculated as follows:
C O P s c = Q c W e
Due to the hot end of the thermoelectric subcooler constantly emitting heat during operation, the water cooled method is utilized to quickly disperse heat and prevent overheating damage.
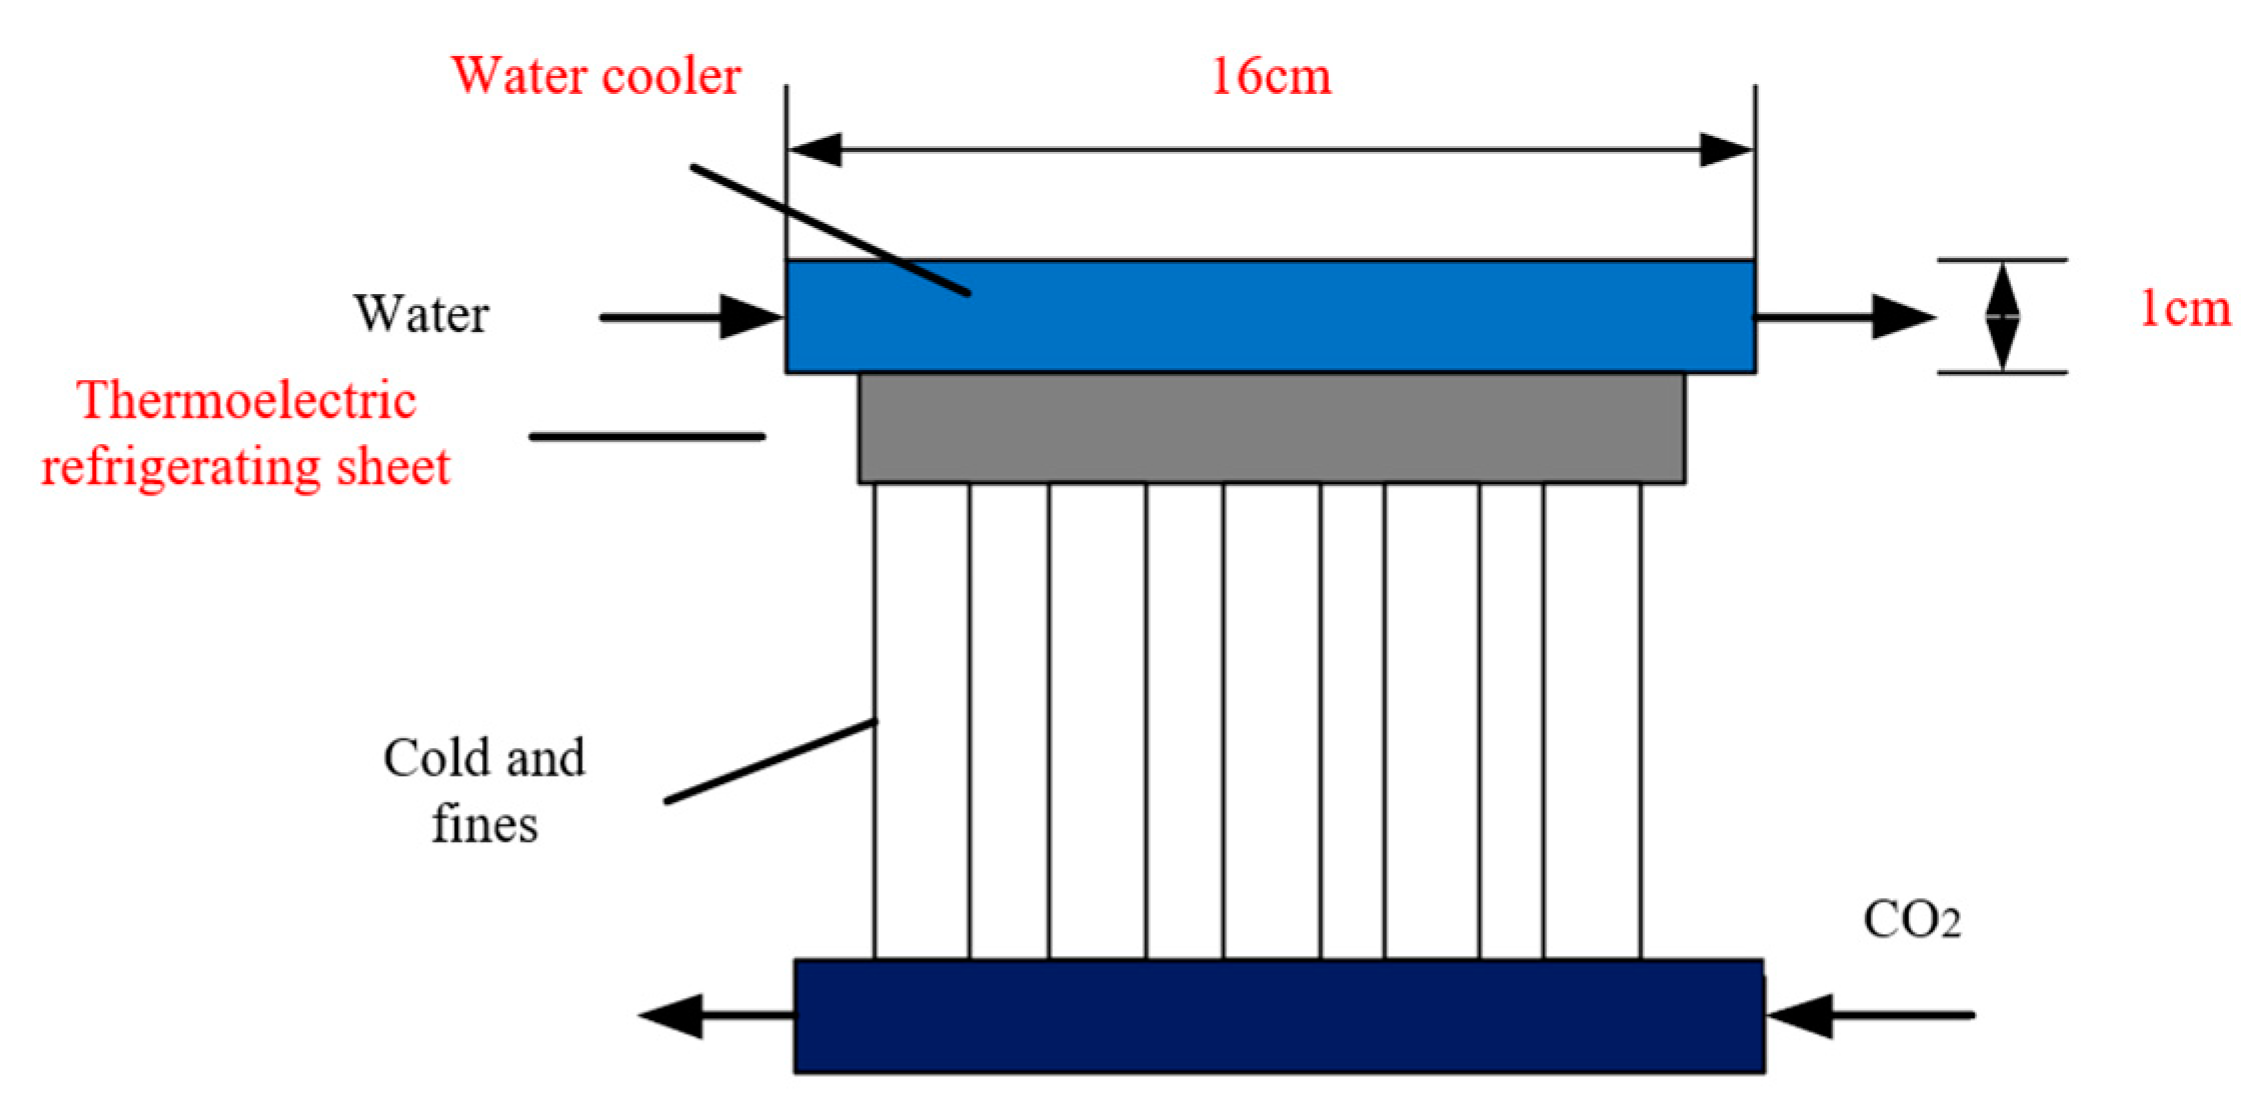
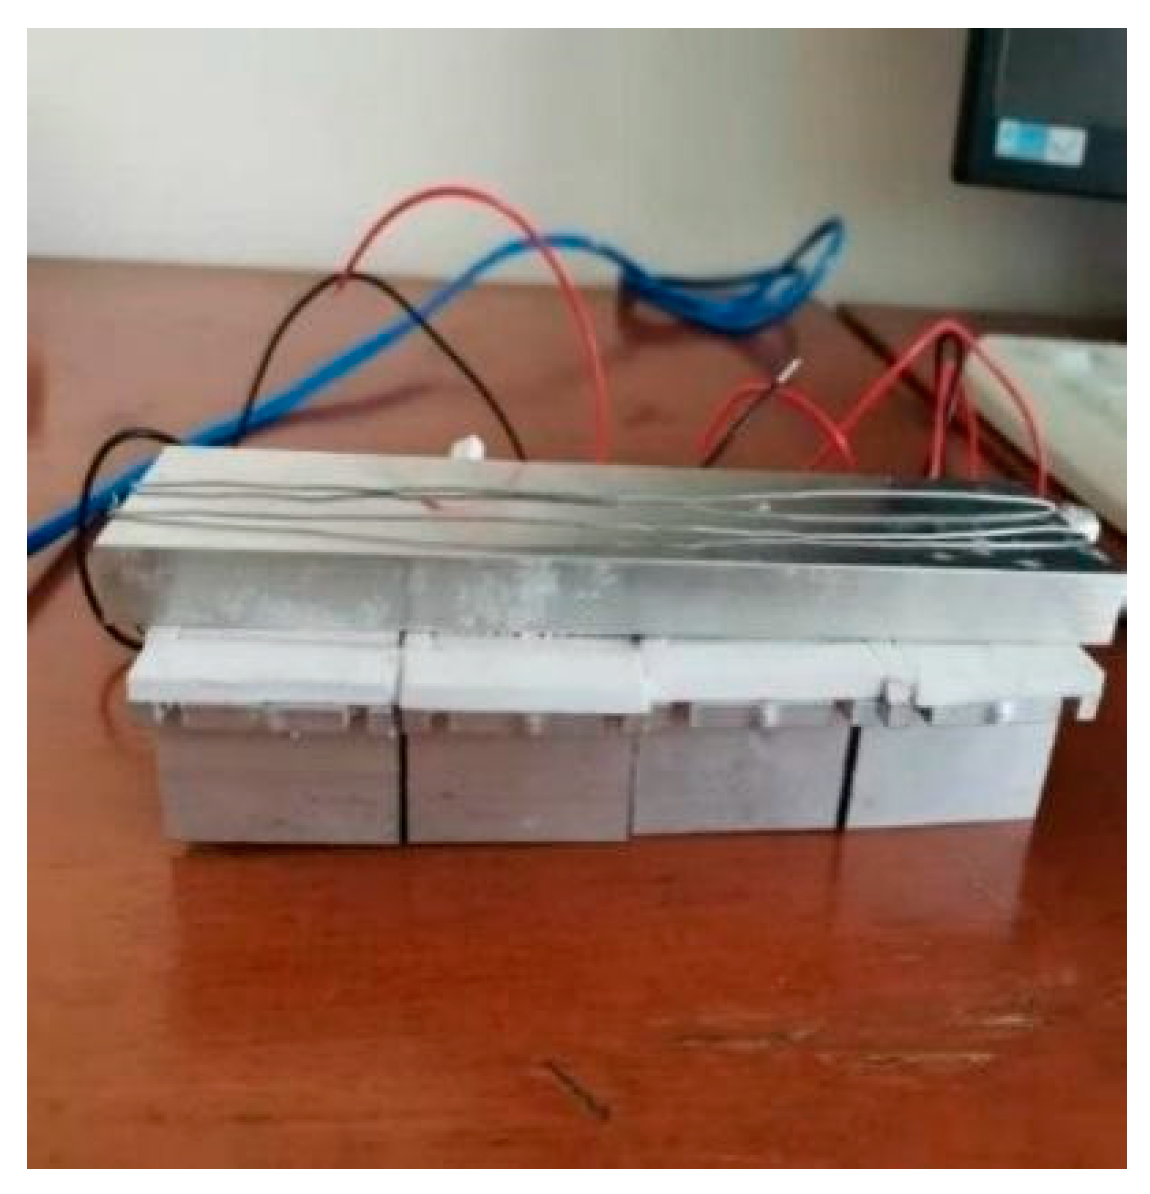
Fins are added to the thermoelectric subcooler’s cold end in order to expand the heat exchange area to cool the refrigerant in the pipeline. Here, the thermal contact resistance between the thermoelectric tube and the pipe is reduced by the thermal paste. The size of the thermoelectric subcooler is marked in Figure 3. Figure 4 is a physical diagram of the thermoelectric subcooler.
In order to achieve the subcooling degree of 5 °C, the cooling capacity of the thermoelectric subcooler should be 1.5 kW according to calculation using Equation (4) assuming the evaporation temperature is 0 °C, the discharge pressure of compressor is 8.5 MPa, the outlet temperature of the gas cooler is 35 °C, and the mass flow of the CO2 is 180 kg/h.
Thus, 22 thermoelectric refrigerating sheets of the model TEC1-12710 were chosen with the size of 40 × 40 × 3.4 mm. The specific parameters are shown in Table 2.
Q = G r ( h 3 h 3 )
where h 3 refers to the enthalpy value of the gas cooler outlet; h 3 refers to the enthalpy value of the thermoelectric subcooler outlet; G r refers to the refrigerant mass flow; and Q refers to the refrigeration capacity of the thermoelectric subcooler.

2.3. Experimental Condition

The performance of the CO2 transcritical water–water heat pump system was evaluated under various operating conditions, including with and without a thermoelectric subcooler.
The experiment’s rated working conditions were as follows: CO2 mass flow rate of 180 kg/h, cooling water flow rate of 0.5 m3/h, chilled water flow rate of 1.2 m3/h, inlet temperature of cooling water of 20 °C, and inlet temperature of chilled water of 12 °C.
The variable working conditions of the experiment were as follows: (1) variation of the mass flow rate of CO2 from 160 to 200 kg/h, (2) variation of cooling water flow rate from 0.8 to 2 m3/h and cooling water temperature from 20 to 30 °C, (3) variation of chilled water flow rate from 0.4 to 1 m3/h and chilled water temperature from 10 to 20 °C.

2.4. Experimental Data Processing

2.4.1. System Cooling Capacity

Calculations were made based on the exothermic heat dissipation on the chilled water side of the evaporator:
Q 1 = c p 1 g w 1 ρ w 1 3600 t w i n t w o u t
where Q 1 refers to the refrigeration capacity; c p 1 refers to the constant pressure specific heat of the chilled water; g w 1 refers to the volume flow of the chilled water; ρ w 1 refers to the density of the chilled water; and t w i n and t w o u t refer to the inlet and outlet water temperature of the chilled water, respectively.

2.4.2. The Heat Dissipation of the Gas Cooler

The heat absorption on the cooling water side of the gas cooler was calculated as follows:
Q 2 = c p 2 g w 2 · ρ w 2 3600 ( t w , o u t t w , i n )
where Q 2 refers to the heat absorption; c p 2 refers to the specific heat of the cooling water; g w 2 refers to the volume flow of the cooling water; ρ w 2 refers to the density of the cooling water; and t w , i n and t w , o u t refer to the inlet and outlet water temperature of the cooling water, respectively.

2.4.3. Coefficient of Performance

The COP and COPh of the entire refrigeration system were calculated using the following formulas. The system’s total power consumption included the power consumed by the compressor and the TESC (Equation (9)).
C O P = Q 1 W c o m + W T E S C
C O P h = Q 2 W c o m + W T E S C
W T E S C = V T E M I T E M

2.5. Experimental Error Analysis

This section analyzes the possible errors in the experiment resulting from many uncertain factors in the operational process.

2.5.1. Data Acquisition System

The data acquisition equipment included a platinum resistance temperature sensor, pressure sensor, electric power transmitter, turbine water flow meter, and electromagnetic CO2 mass flow meter. The parameters of each data acquisition device are shown in Table 3 below.

2.5.2. Uncertainty of Chilled Water Flow

The flowmeter used to measure the flow rate of chilled water was 1.6 m3/h, the measurement accuracy of the flowmeter was 0.5 level, and the uncertainty was δ v w = 0.008 m3/h. The smallest chilled water flow in the measurable range was 0.8 m3/h, and the maximum relative uncertainty of chilled water flow was 1%.

2.5.3. Uncertainty of Refrigerant Mass Flow Rate

The mass flow meter used to measure the mass flow of the refrigerant had a range of 0–250 kg/h, and the uncertainty of the mass flowmeter was δ q = 0.1 kg/h. The maximum relative uncertainty of mass flow was 0.063%.

2.5.4. The Uncertainty of Cooling Capacity and COP

Because the cooling capacity and COP were calculated indirectly from other data collected, their errors can be analyzed using the power of second method, that is, if Y is a function of n independent variables, xζ is the independent variable affecting the function Y, and the error of Y can be determined by Equation (10):
δ Y Y = ς = 1 n δ x ς x ς 2 1 2
Due to Q = f m w , t w i , t w o , the uncertainty of the cooling capacity Q can be calculated as follows:
δ Q Q = δ m w m w 2 + δ t w i n t w i n 2 + δ t w o u t t w o u t 2 1 2 = 0.5 % 2 + 0.1 % 2 + 0.1 % 2 1 2 = 0.52 %
Due to W = f G r , t i n , c o m , t o u t , c o m , P i n , c o m , P o u t , c o m , the uncertainly of the compressor power consumption W can be calculated as follows:
δ W W = δ G r G r 2 + δ t i n , c o m t i n , c o m 2 + δ t o u t , c o m t o u t , c o m 2 + δ P i n , c o m P i n , c o m 2 + δ P o u t , c o m P o u t , c o m 2 1 2 = 0.5 % 2 + 0.1 % 2 + 0.1 % 2 + 0.25 % 2 + 0.25 % 2 = 0.62 %
Due to C O P = f Q , W , the uncertainty of COP can be calculated as follows:
δ C O P C O P = δ Q Q 2 + δ W W 2 1 2 = 0.52 % 2 + 0.62 % 2 1 2 = 0.81 %
where m w 1 refers to the flow rate of chilled water in kg/s; t w i n and t w o u t refer to the inlet and outlet water temperatures of the chilled water of the evaporator, respectively, respectively, in °C; P refers to the measured pressure in MPa; and W refers to the compressor consumption power in kW.

3. Simulation Model Establishment

In this section, the CO2 transcritical water–water heat pump model is discussed in detail by establishing a mathematical model and using MATLAB to call physical parameters in Refprop software. The system is mainly composed of a compressor, gas cooler, thermoelectric subcooler, throttle valve, and evaporator. The use of energy conservation and related principles to establish the model can effectively supplement the problem of incomplete data caused by the limitation of test conditions. The model can be used to comprehensively analyze the impact of different parameters on the performance of the system and provide theoretical guidance to further understand the performance of and investment required for a heat pump system.

3.1. Compressor Model

Mass flow rate of CO2 refrigerant
G r = V t h η v 3600 v s
Volume efficiency [22]:
η v = 0.976728 0.0921418 P 2 P 1 0.714
where V t h refers to the calculated exhaust volume in m3/h; v s refers to the compressor refrigerant specific capacity; P 2 refers to the compressor exhaust pressure in MPa; and P 1 refers to the compressor suction pressure in MPa.
The compressor power consumption can be calculated by Equation (15):
W c o m = G r ( h 2 h 1 ) η i s η m
where η is and η m are calculated using empirical formula [22,23]:
η m = 0.26 + 0.7952 P 2 P 1 0.2803 P 2 P 1 2 + 0.414 P 2 P 1 3 0.0022 P 2 P 1 4
η i s = 0.995541 0.107987 P 2 P 1 0.714
In Equations (16) and (17), h 2 refers to the isentropic enthalpy value of compressor outlet state point; h 1 refers to the enthalpy value when the machinery is inhaled; η m refers to the mechanical efficiency; and η is refers to the isentropic efficiency.

3.2. Gas Cooler

The model of the gas cooler was constructed by the centralized parameter method, and the following assumptions were made:
  • When the refrigerant and water are exchanged heat, it is a one-dimensional steady-state model, and the temperature and flow rate of the refrigerant and the water are evenly distributed in the corresponding cross section.
  • All the heat losses of the gas cooler are ignored, and the outer pipe wall is considered to be adiabatic.
  • The pressure drop of the water in the tube is ignored.
  • The thermal conduction process only occurs in the horizontal direction of fluid flow.
  • The system operation state is steady.
  • The refrigerant flows along the tube and is evenly distributed.
According to the energy conservation law, the heat released by the refrigerant is the same as that absorbed by cooling water. Thus, the following equation can be obtained:
Q C O 2 = G r h 2 h 3
Cooling water side heat absorption equation:
Q w = m w 2 c p 2 t w , o u t t w , i n
Total heat transfer equation:
Q C O 2 = Q w = K A 2 t
where m w 2 refers to the cooling water flow in kg/s; c p w refers to the specific heat capacity of the cooling water at constant pressure in kJ/(kg·°C); A2 refers to the heat exchange area of the gas cooler in m2; and t refers to the logarithmic average temperature difference in °C.
The parameters involved can be calculated as follows:
(1)
Using the outer surface of the inner tube as a reference, the total heat transfer coefficient solution equation is established.
K = 1 1 h C O 2 + r 1 + δ λ ln d w , o d m + 1 h w + r 2 d w , o d w , i
where r 1 and r 2 refer to the fouling coefficient of the inner and outer tubes, respectively; d w , o refers to the inner tube outside diameter in mm; and d w , i refers to the inner diameter of the inner tube in mm.
(2)
Logarithmic mean temperature difference:
Δ t = t w , i n t C O 2 , o u t t w , o u t t C O 2 , i n ln t w , i n t C O 2 , o u t t w , o u t t C O 2 , i n
(3)
Heat transfer area:
A = π d w , o l
where l refers to the tube length in m.
In the cycle process, the gas cooler exothermic heat in the transcritical and the conventional cycle in the subcritical exothermic heat release are very different, which is caused by the special thermal properties of CO2. At present, more and more researchers have started studying the heat exchange correlation type of the air cooler in depth. According to the literature, the heat exchange working conditions of the heat exchange correlation type established by Yoon et al. were similar to this paper; thus, we selected the heat exchange correlation type of Yoon [24]:
N u C O 2 = a Re C O 2 b Pr C O 2 c ρ P C ρ f n
where ρ p c refers to the critical density of fluids, and ρ f refers to the fluid density.
Heat transfer coefficient on the cooling water side:
h w = N u w λ w l

3.3. Thermoelectric Subcooler

When the model was established, the input parameters included the cooling capacity and the number of thermoelectric refrigerating sheets. The output parameter was the degree of subcooling.
By calculation, 22 refrigerants sheets with a cooling capacity of 70 W and type TEC1-12710 constituted a thermoelectric subcooler, and the total cooling capacity of the thermoelectric subcooler was 1.5 kW.
  • The CO2 side cooling capacity:
Q = G r h 3 h 3
2.
The cooling capacity of the thermoelectric subcooler [10]:
Q c = n α p α n A T c 0.5 A 2 R K T H T C
3.
Equation for conservation of energy:
Q = Q c

3.4. Throttle Valve

The throttle process in the throttle valve assumes that the enthalpy values before and after the throttling are equal:
h 3 = h 4

3.5. Evaporator

The simulation model using a centralized parametric method was built on a lab jacketed evaporator based on the following assumptions:
  • The casing used is uniform and regularly round.
  • The chilled water and refrigerant both flow in a certain dimensional direction.
  • The chilled water and refrigerant are evenly distributed in the tube.
  • The heat transfer loss of the evaporator is not considered.
  • The interference caused by the lubricating oil and other similar factors on the heat exchange is ignored.
Heat absorption of refrigerant:
Q r = G r ( h 1 h 4 )
Heat release on the side of chilled water:
Q ld = c p 1 m w 1 ( t w i n t w o u t )
Total heat exchange:
Q r = Q l d = K A 1 t 1
where m w 1 refers to the flow rate per second of chilled water in kg / s ; t w i n refers to the temperature of the chilled water inlet in °C; t w o u t refers to the outlet temperature of chilled water in °C; A 1 refers to the heat transfer area of chilled water in m2; K refers to the heat transfer rate of the evaporator, W / ( m 2 · K ) ; and t 1 refers to the logarithmic average temperature difference in °C.
The parameters involved can be calculated as follows:
  • Using the outer surface of the inner tube as a reference, the total heat transfer coefficient solution equation is established as shown in Equation (33):
    K = 1 1 h r + r 1 + δ λ ln d l d , o d m + 1 h l d + r 2 d l d , o d l d , i
    where r 1 and r 2 refer to the fouling coefficient on the CO2 side and the chilled water side, respectively, and d m refers to the average diameter of the tube.
  • The heat transfer coefficient on the chilled water side is calculated using the Dittus–Boelter correlation [25]:
    N u l d = 0.023 Re 0.8 Pr n
    where n = 0.4 when the fluid is heated, and n = 0.3 when the fluid is cooled.
Compared to [26,27], Kew and Cornwell [28] heat transfer related formulas were selected as the correlation relationship of CO2 boiling heat transfer coefficient in the evaporator due to the similar dimensions and other relevant parameters with the laboratory evaporator model. The details are as follows [28]:
h r = 30 · Re r 0.857 · B o 0.714 · ( 1 x ) 0.143 · λ r n × d r
where h r refers to the heat transfer coefficient on the refrigerant side, W / ( m 2 · K ) ; λ r refers to the thermal conductivity coefficient for the refrigerant side, W / ( m · K ) ; x refers to dryness; Re r refers to Reynolds number; and B o refers to boiling number.

3.6. Solving the System Model

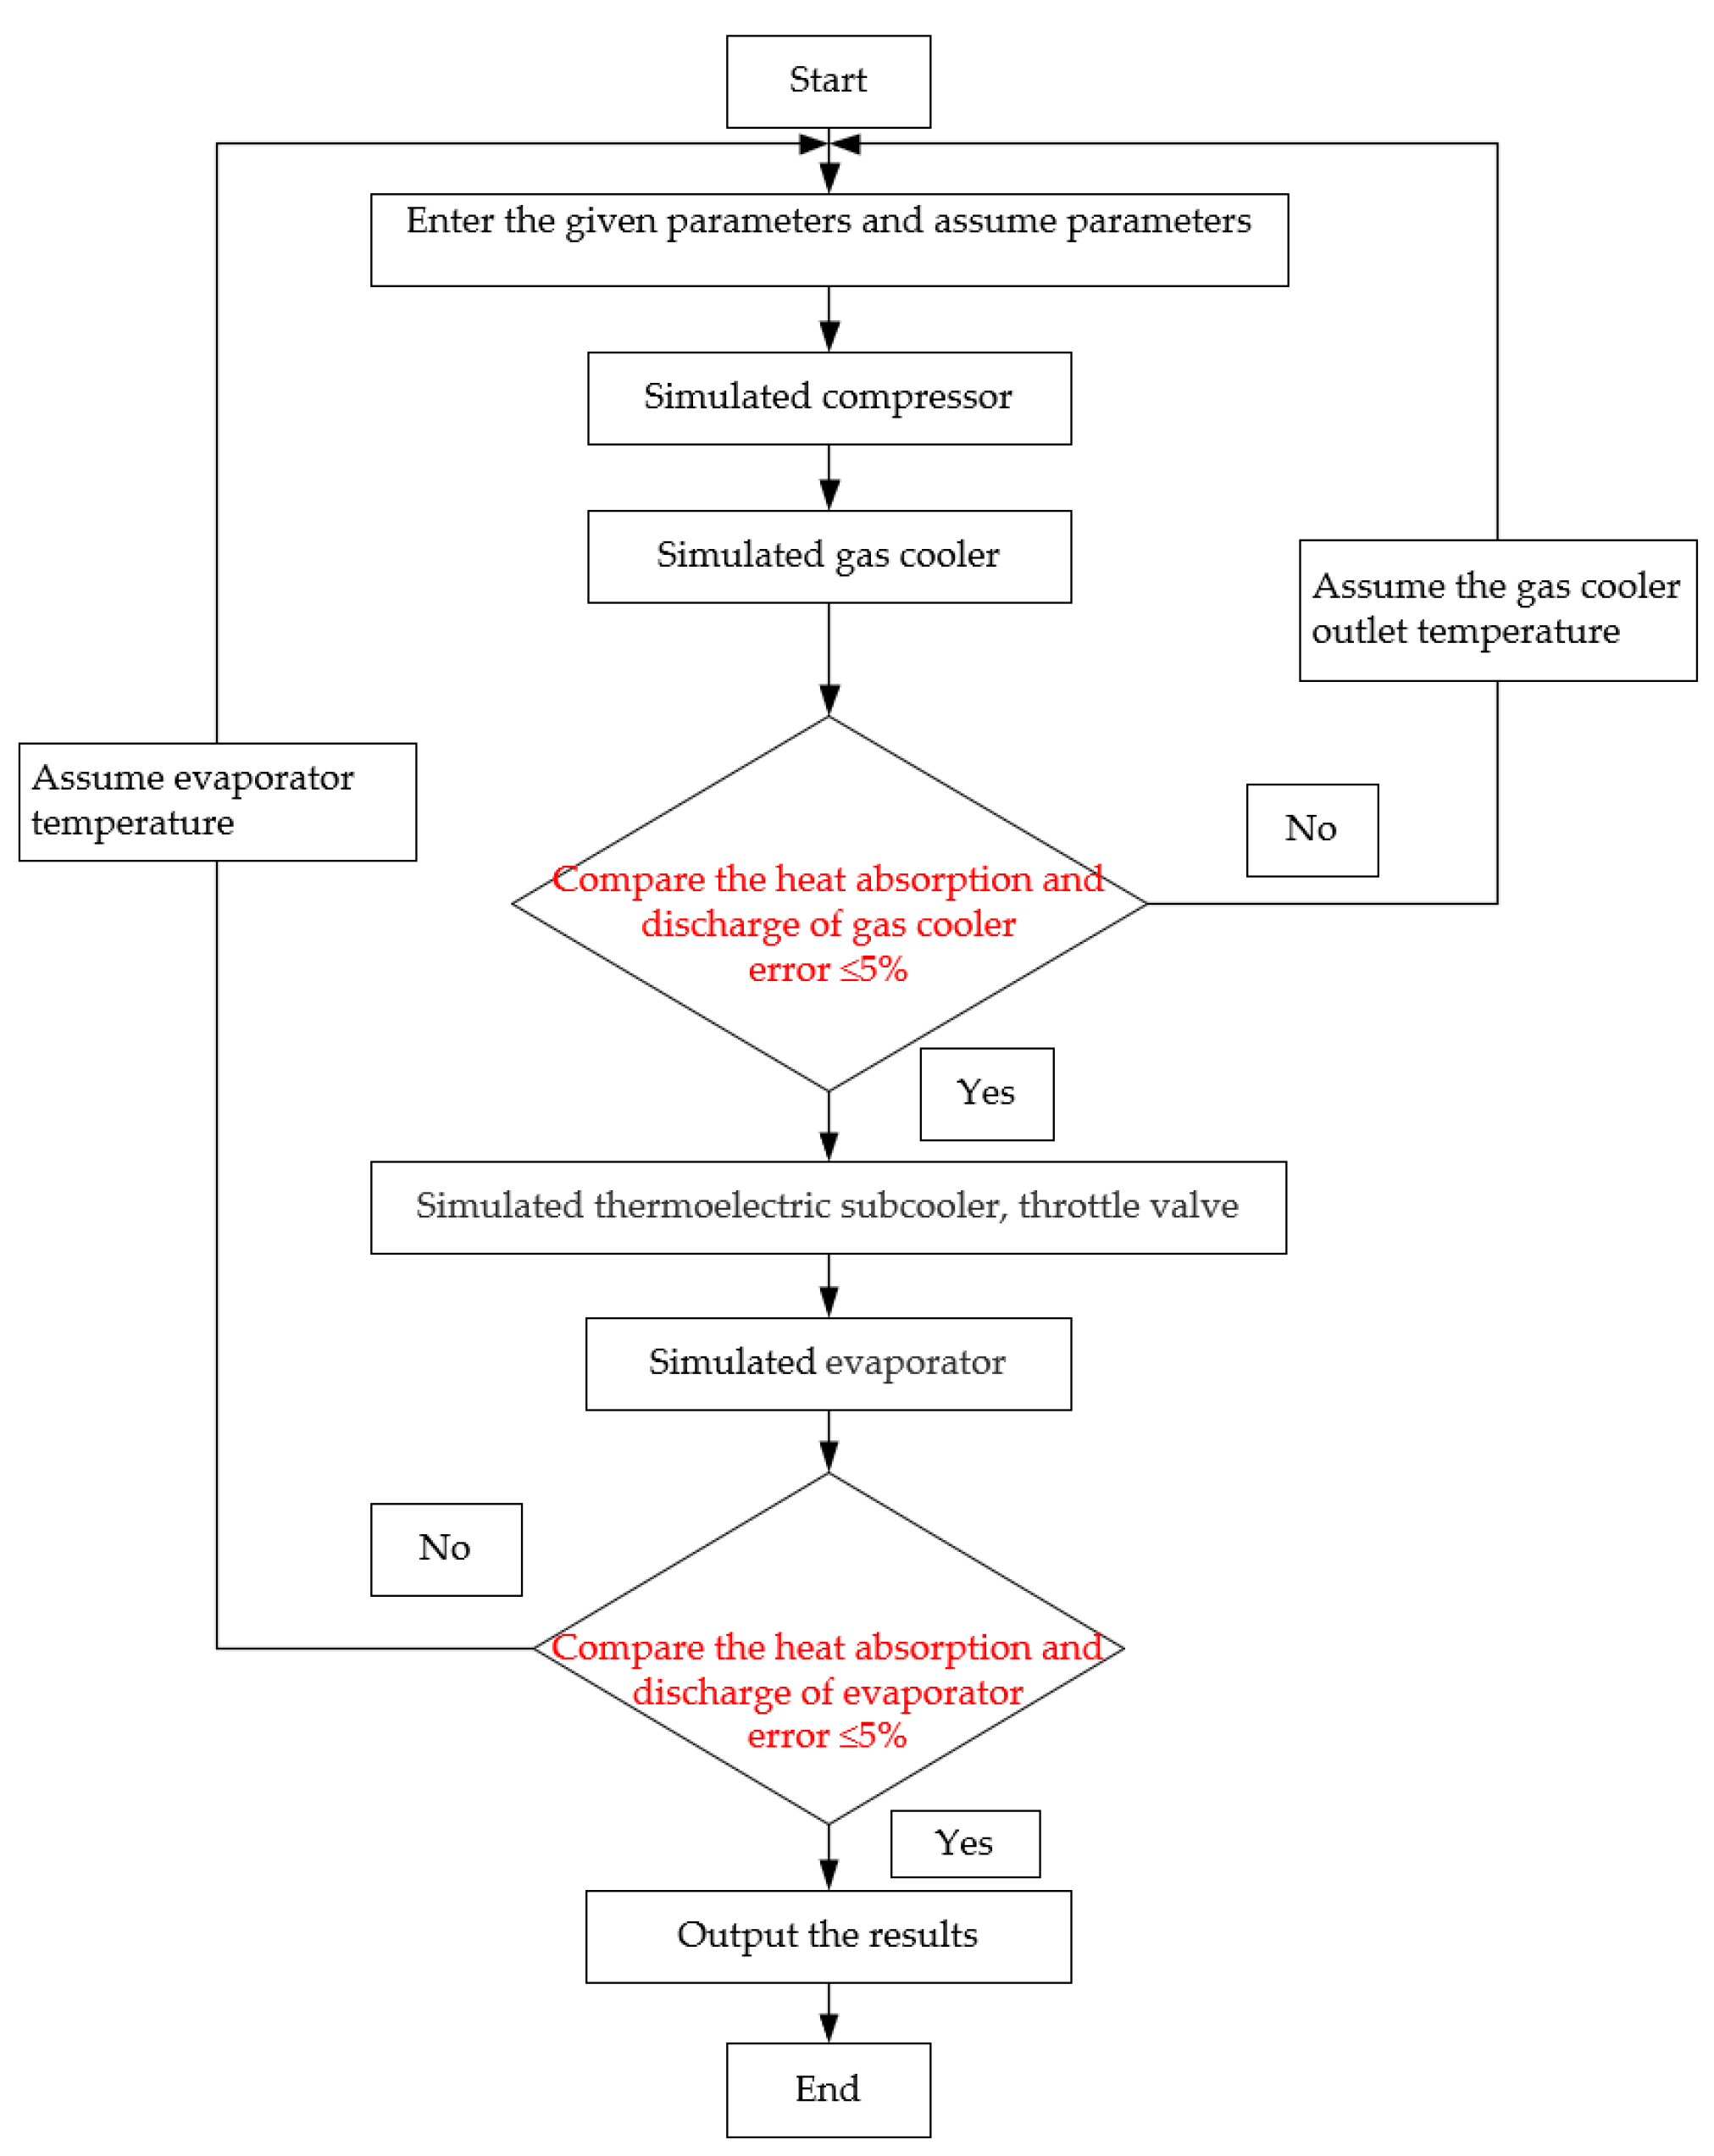
The matching module was developed in MATLAB and solved in accordance with the mathematical model of each component. Characteristics such as cooling/heating capacity and COP/COPh were determined by inputting the compressor discharge pressure, the tube diameter of the evaporator and gas cooler, and the temperature and flow rate of the chilled water and the cooling water. A compressor module, gas cooler module, thermoelectric subcooler module, throttle valve module, and evaporator module made up the overall system. Each component was meticulously simulated using the defined model, and data on endothermic and exothermic heat were calculated. The absolute value of the relative error of cooling capacity and heat absorption was taken as the convergence condition. If the error was less than 5%, the program continued calculation; otherwise, the parameters were reassumed. Figure 5 is the flow chart of system model calculation.

4. Results and Discussion

4.1. Analysis of Experimental Results

4.1.1. The Variation of the Cooling Water Flow Rate

Figure 6 shows the relationship between COPh and cooling water flow. With continuous increase in the cooling water flow, the heating coefficient of performance and the variation trend were similar for the systems with and without a subcooler. At the same time, the heating coefficient of the system with a subcooler increased by 3.14% compared to that without it under the same conditions.

4.1.2. Variation of Cooling Water Temperature

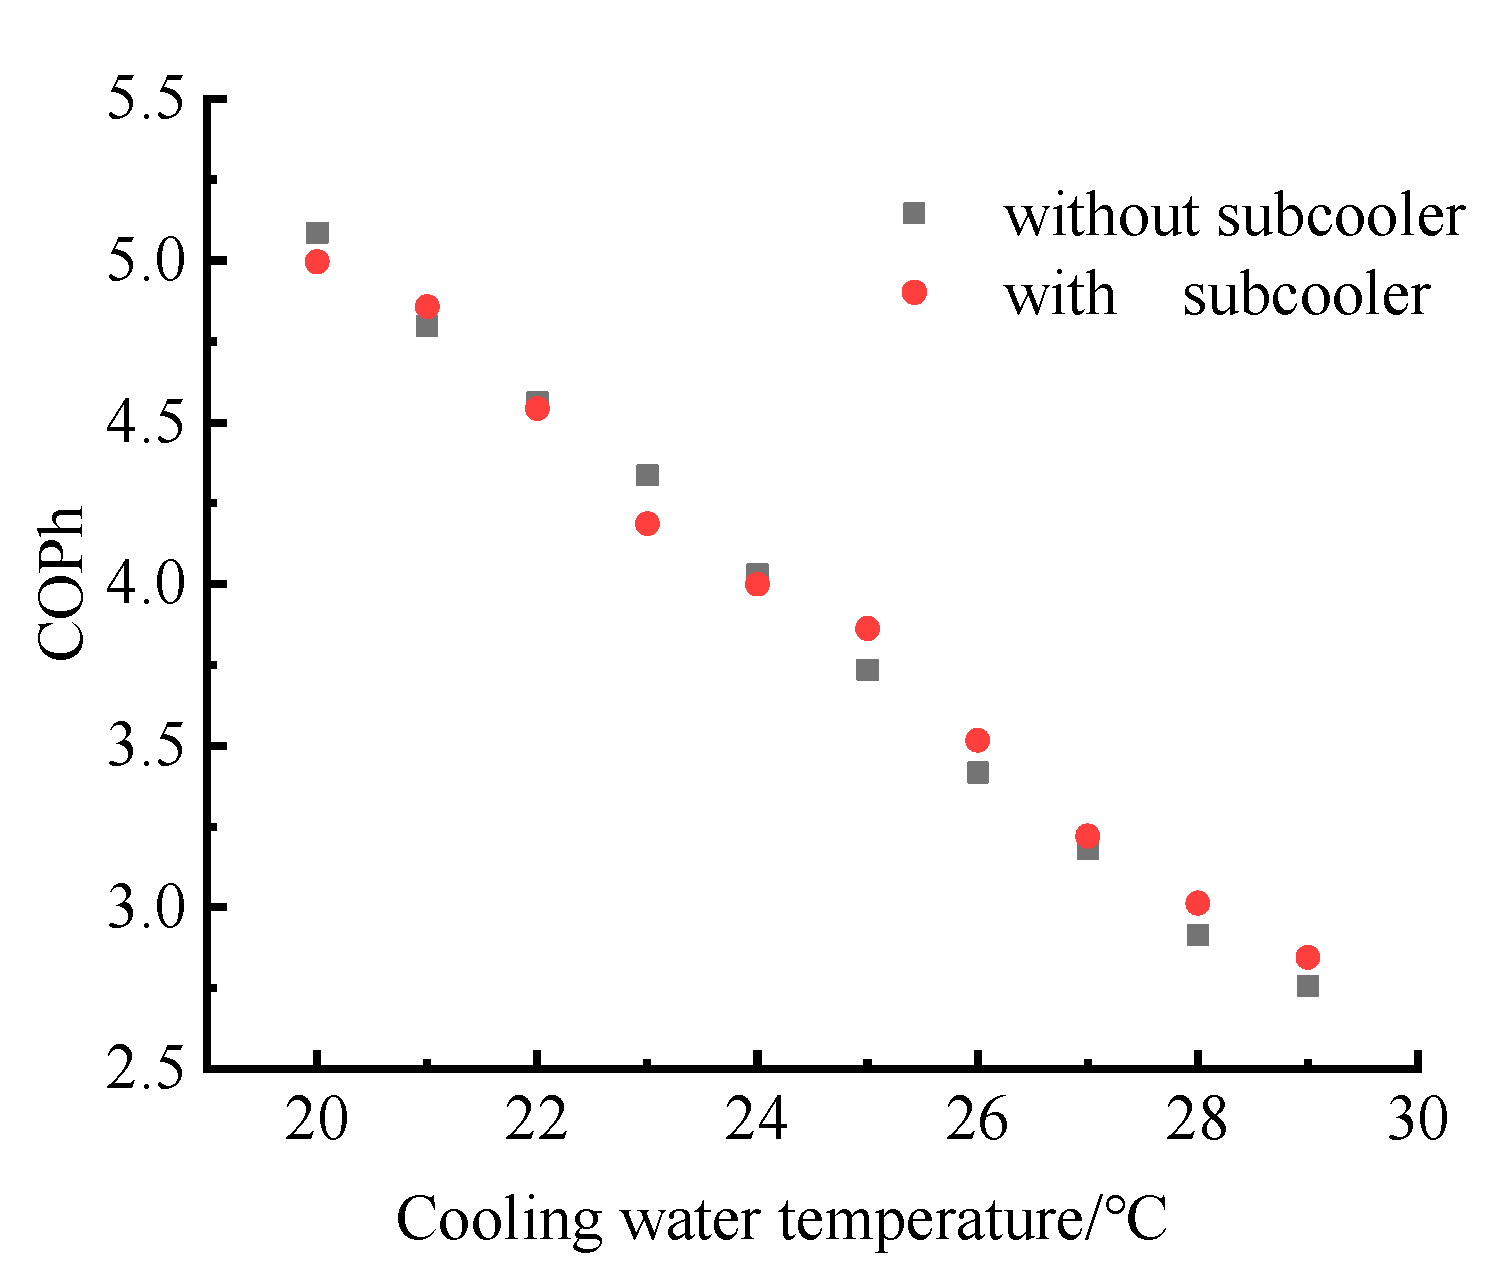
As can be seen from Figure 7, regardless of whether the system was equipped with a subcooler, the COPh decreased as the cooling water temperature increased, which was similar to the trend of heating coefficient of performance of the system without a subcooler. Under the same conditions, the COPh efficiency of the system with a subcooler increased by 2.63% compared to the system without a subcooler.

4.1.3. Variation of Chilled Water Flow

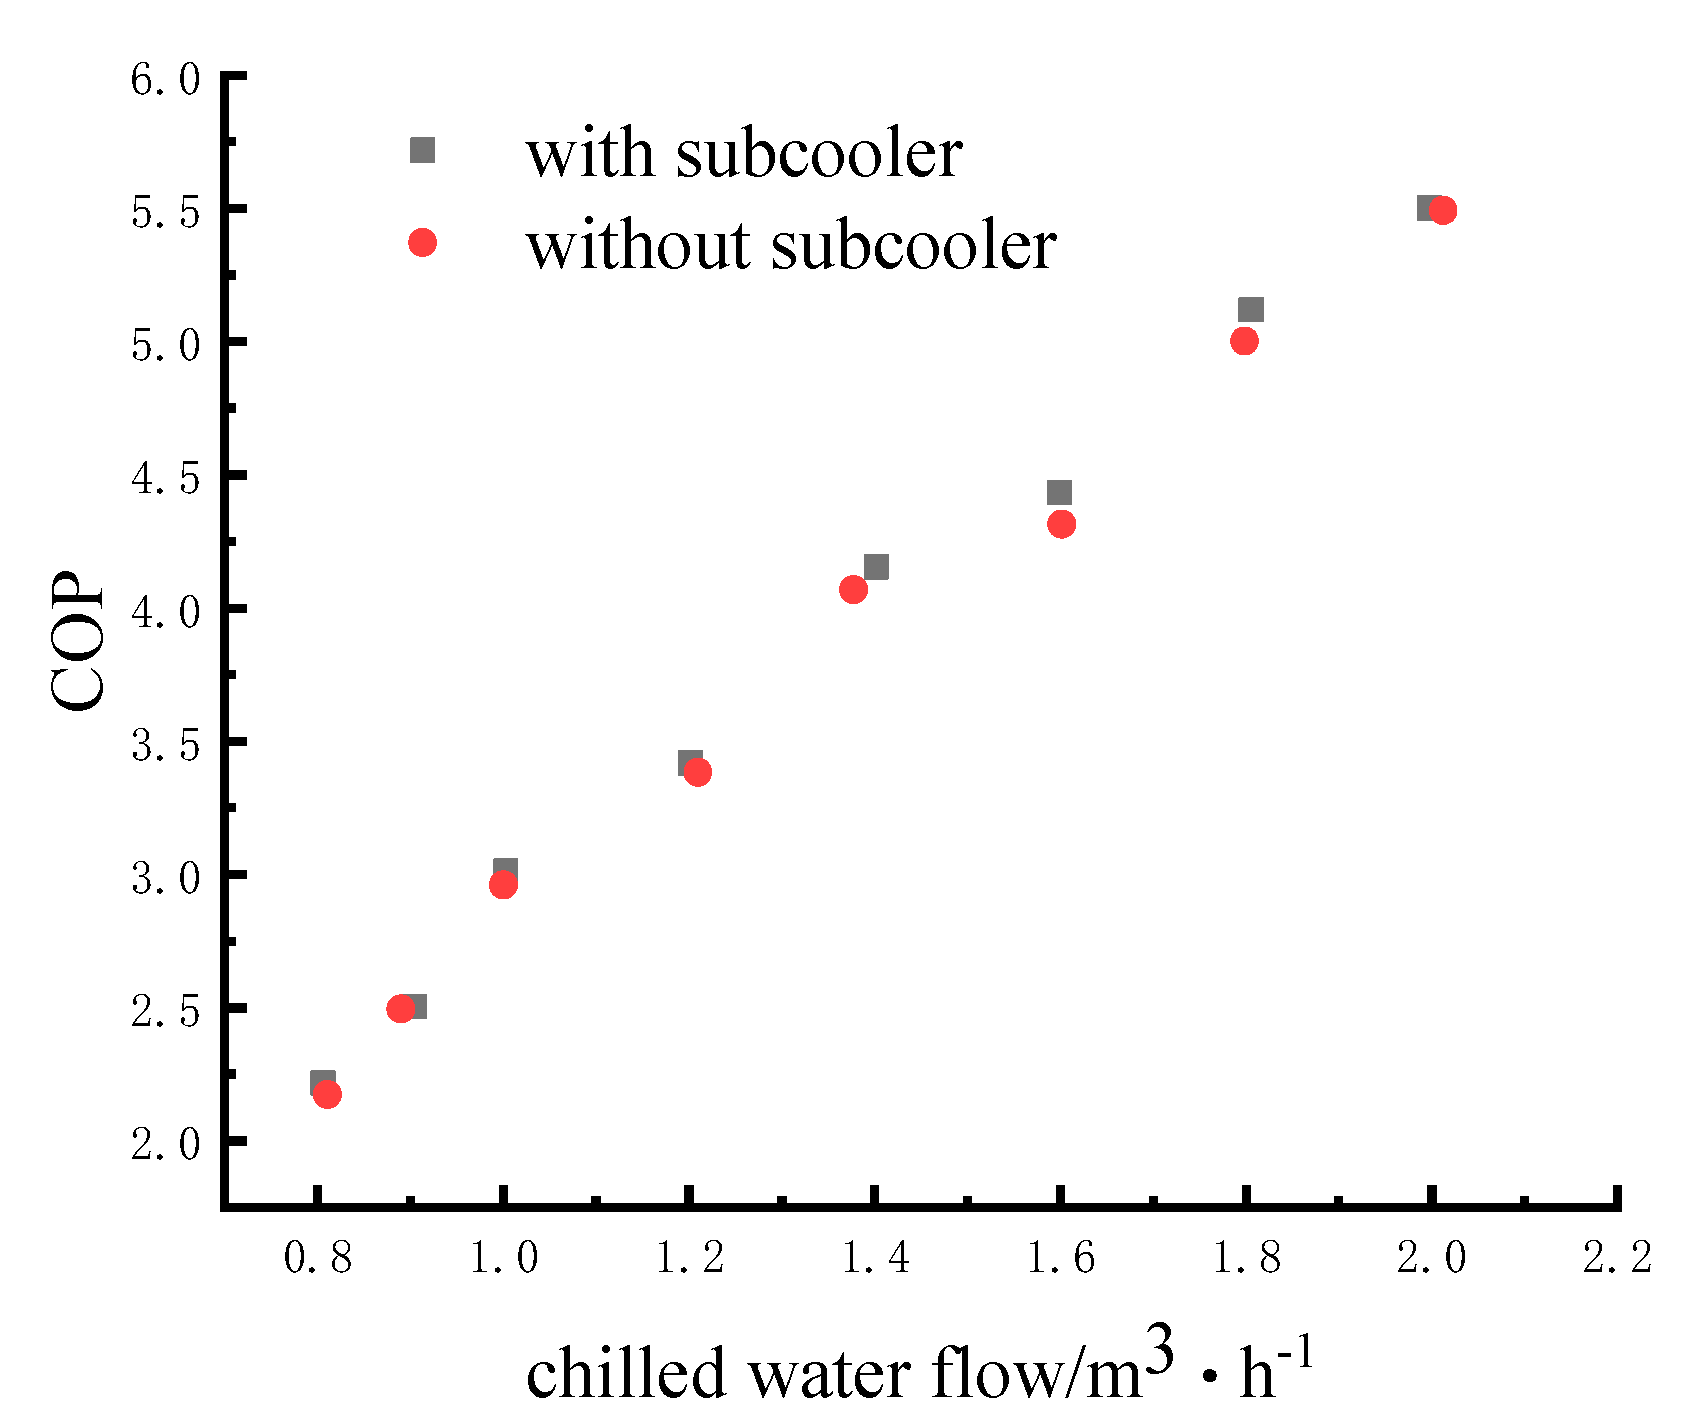
Figure 8 shows the variation trend of coefficient of performance with increasing chilled water flow rate with and without a subcooler. From Figure 8, it can be seen that the COP of the system increased with the increase in chilled water flow rate with or without a subcooler, and the coefficient of performance of the system with a subcooler was 1.62% higher than that of the system without a subcooler.

4.1.4. Variation of Chilled Water Temperature

Figure 9 shows the trend of coefficient of performance with and without a subcooler. As can be seen from Figure 9, the system cooling efficiency COP increased with the increase in chilled water temperature regardless of whether the system was equipped with a thermoelectric subcooler. The COP of the system with a subcooler was significantly higher than that of the system without a subcooler by 3.14%.

4.2. System Model Validation

When the experimental and simulated working conditions of the transcritical CO2 heat pump system with a thermoelectric subcooler were the same, the results obtained by the two methods were compared and analyzed, and the relative error was used in the analysis process:
relative   error = simulation   value experimental   value   experimental   value   × 100 %
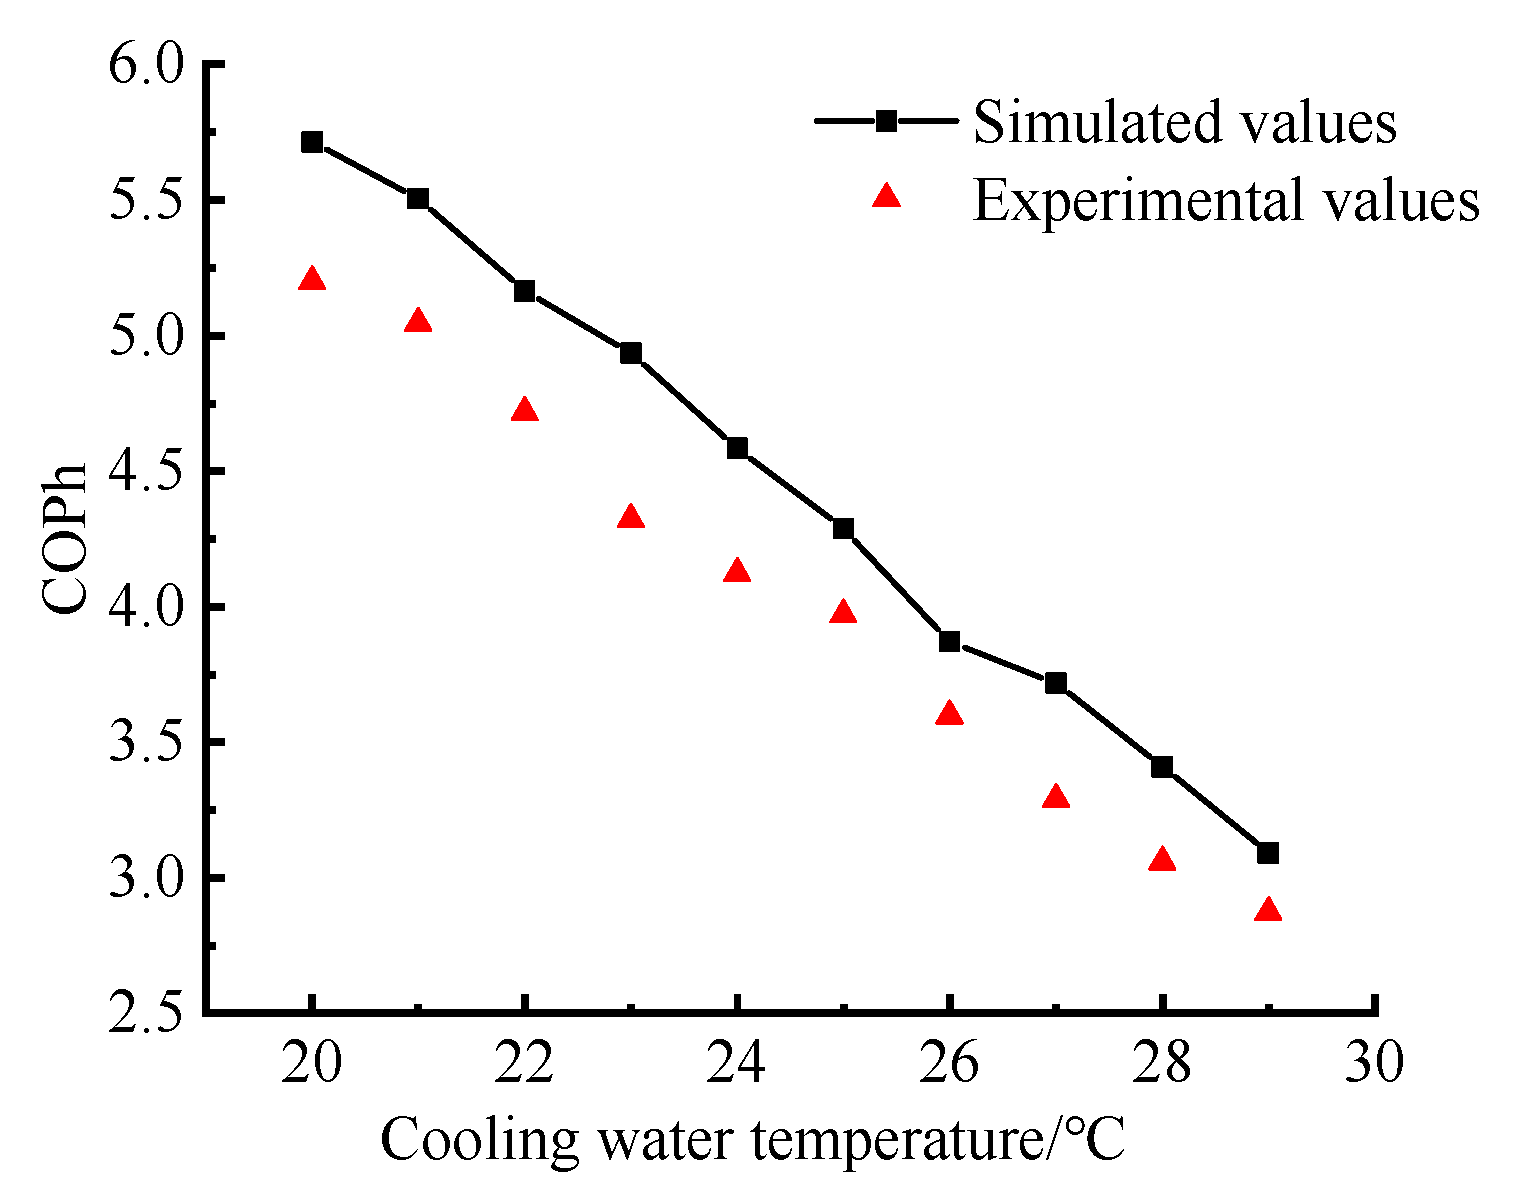
Figure 10 and Figure 11 show the experimental and simulated values of COPh when the flow rate and temperature of cooling water were changed. It can be seen that when the cooling water flow rate increased, the experimental data and simulation data showed an upward trend, and the consistency was higher at 0.4–0.55 m3/h. When the cooling water temperature gradually increased, COPh continued to decrease, and the analog value was generally slightly higher than the experimental results with an error margin of about 8.6%.
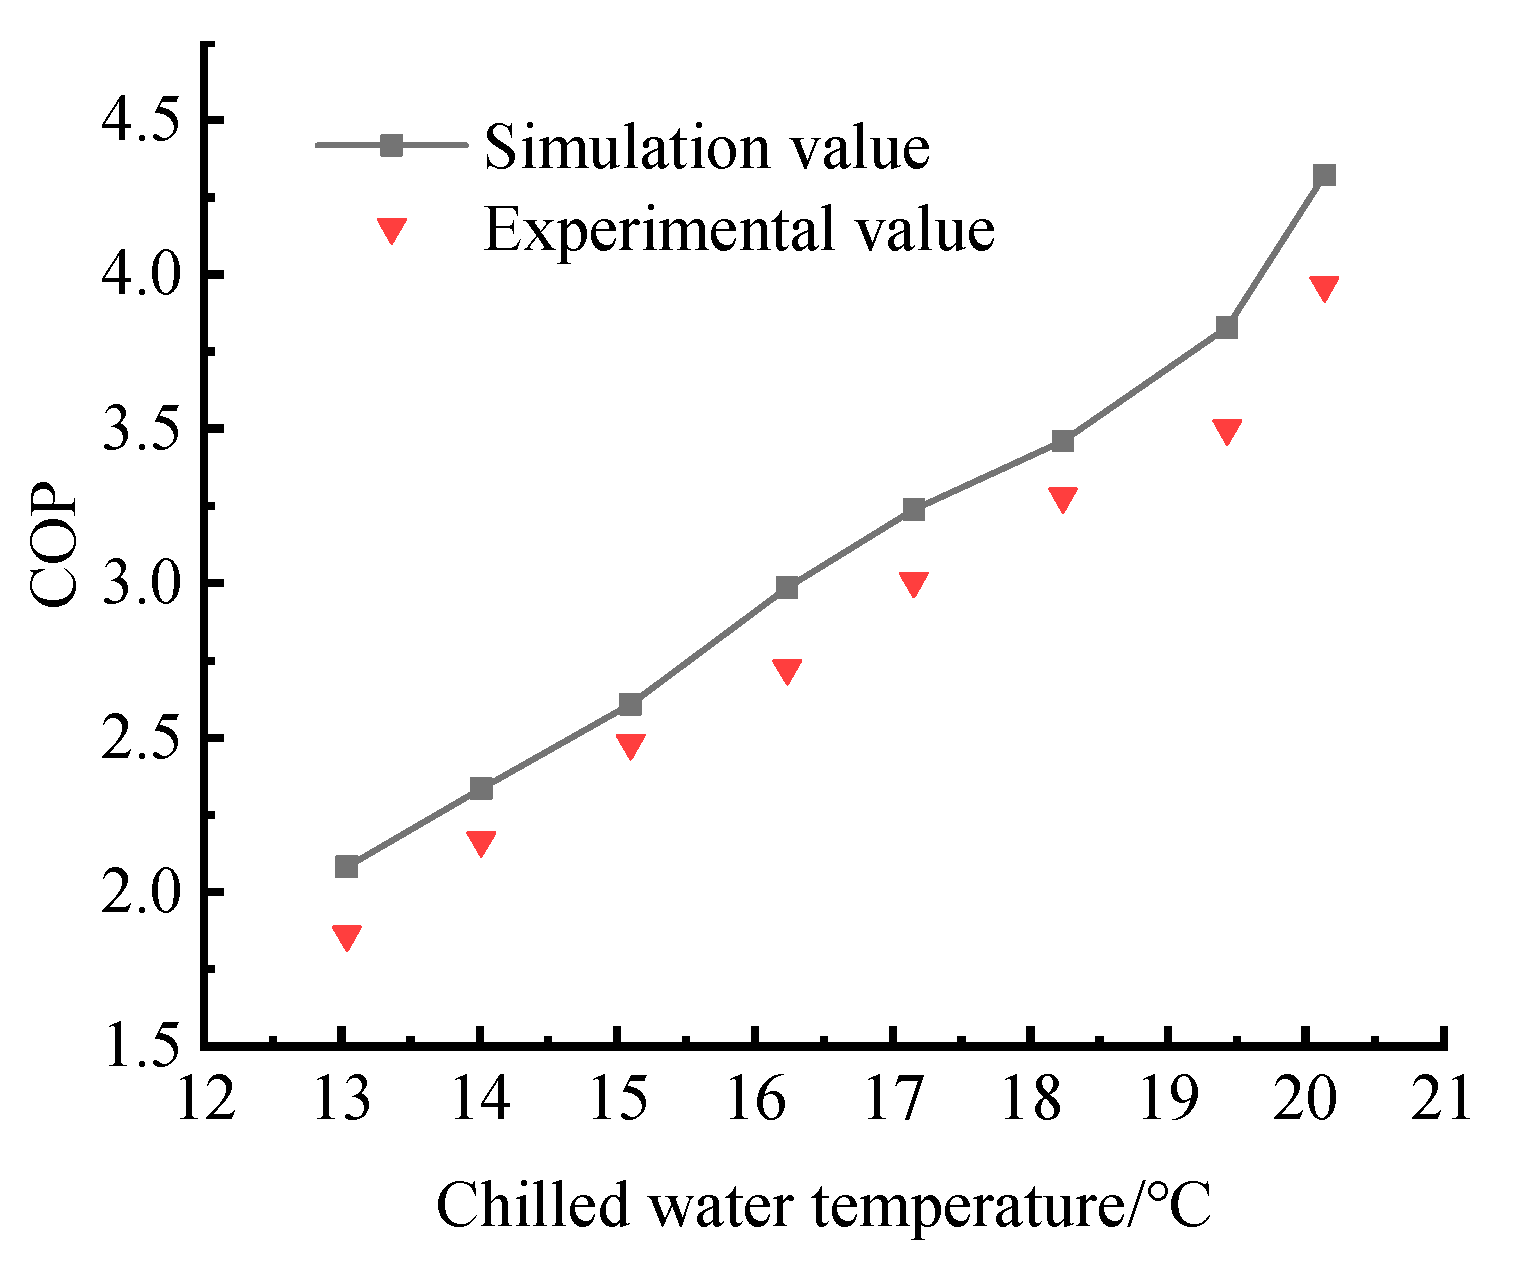
Figure 12 compares the refrigeration coefficient of performance of the experimental data and simulated data for different chilled water temperatures. As the temperature of chilled water gradually increased, the experimental value and the simulated value of COP gradually increased. The trend of the two was similar, and the simulation results were slightly higher than the experimental results.

4.3. Simulation Result Analysis

4.3.1. Influence of the Subcooling Degree

With the increase in thermoelectric subcooling sheets, the degree of subcooling increases. As can be seen from Figure 13 and Figure 14, the cooling capacity/heating capacity was positively correlated with COP/COPh and the degree of subcooling. When the subcooling increased from 1 to 11 °C, the cooling capacity increased from 1 to 7 kW, the heating capacity increased from 5.75 to 11.75 kW, COP increased by 40%, and COPh increased by 13.3%. This was due to the increase in thermoelectric cooling sheets, which led to an increase in the degree of subcooling.

4.3.2. Influence of Cooling Water Flow Rate and Temperature

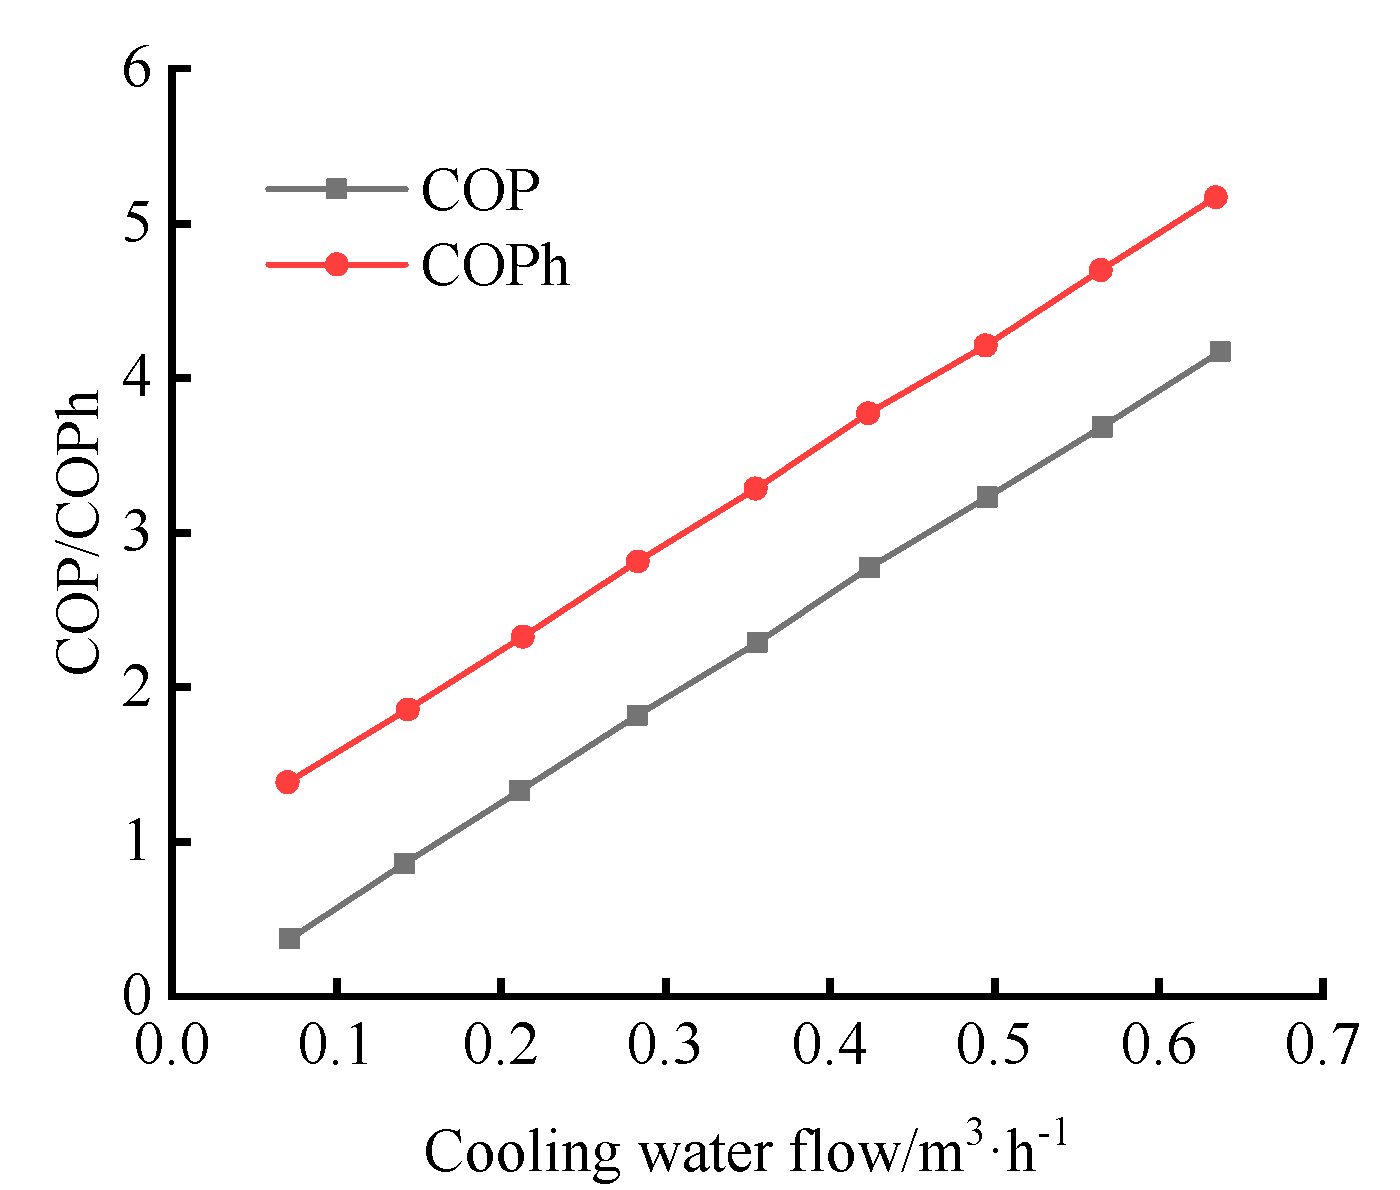
At rated conditions, COP/COPh is shown against cooling water flow rate in Figure 15. The chart shows a considerable positive correlation between COP/COPh and cooling water flow. According to the calculation results, increasing the cooling water flow would cause a heat exchange between the refrigerant and the cooling water.
As can be seen in Figure 16, there was a slight inverse relationship between cooling water temperature and COP/COPh. The COPh was around 2.5 and the COP was approximately 1.5 when the cooling water temperature was 30 °C.

4.3.3. Influence of Chilled Water Flow Rate and Temperature

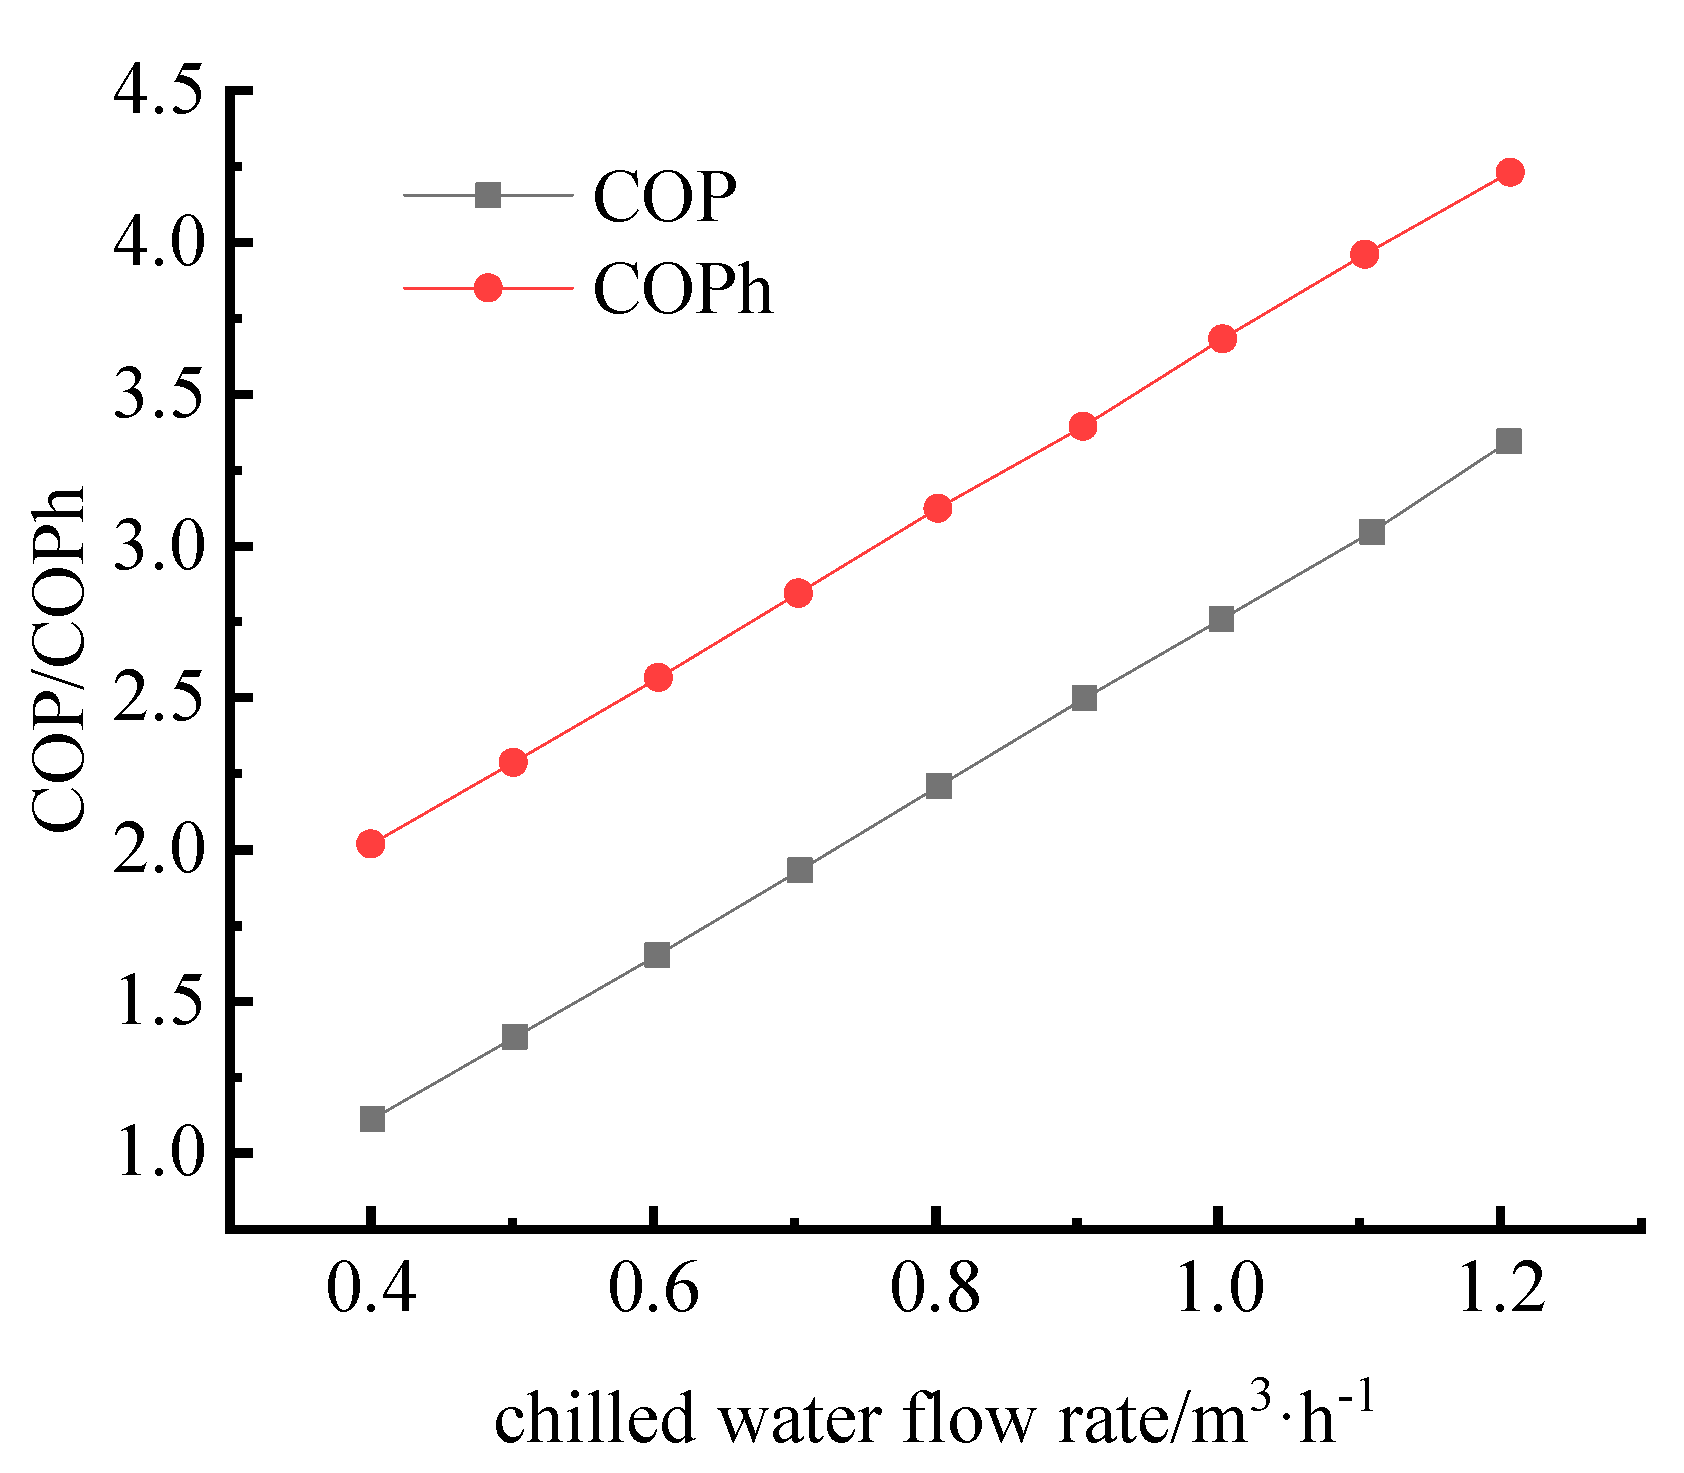
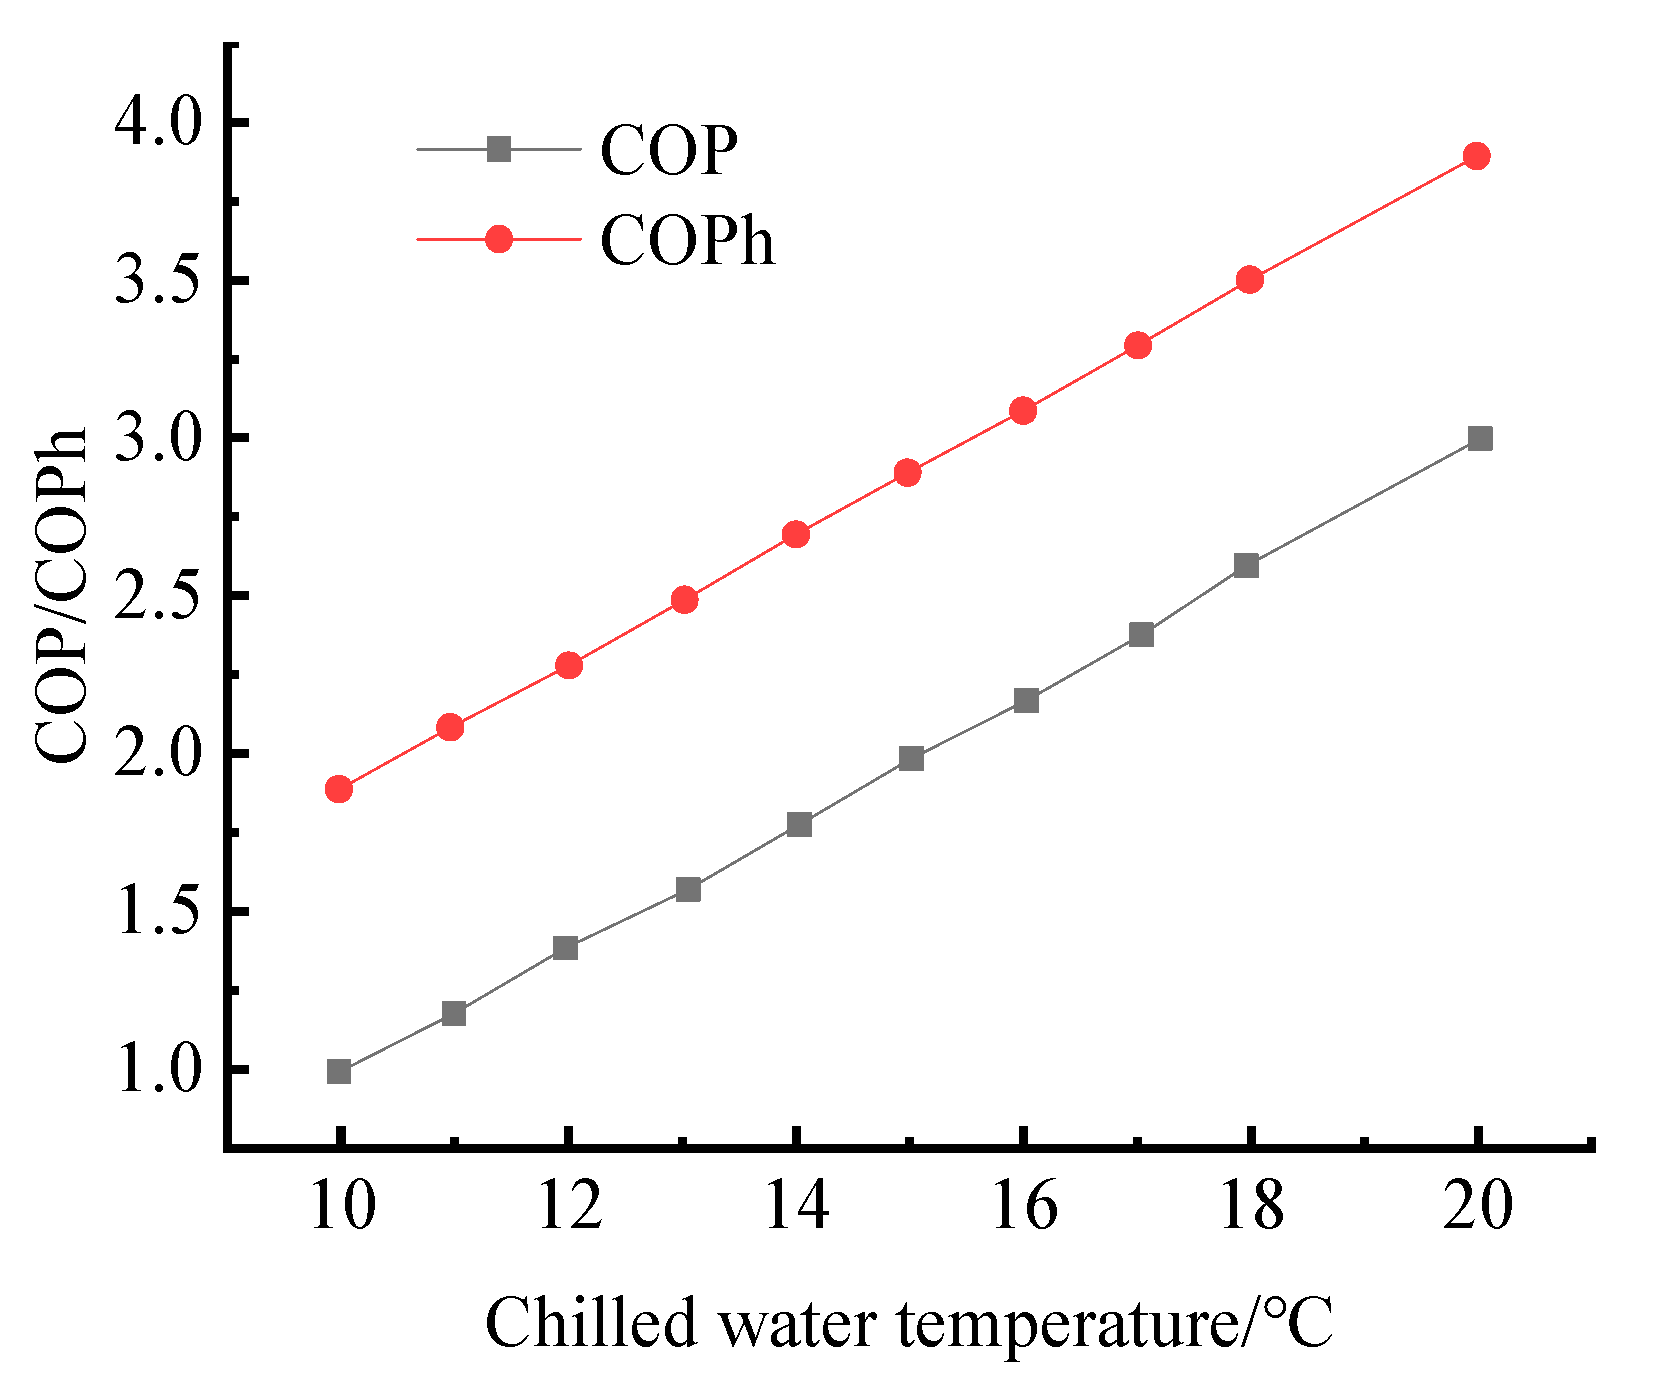
From Figure 17 and Figure 18, it can be seen that COP/COPh had a positive correlation with chilled water flow rate and temperature. As the chilled water flow increased, COP increased from 1.2 to 3.2 and COPh increased from 2 to 4.5. It can be seen that the heat exchange between the chilled water and refrigerant in the evaporator was strengthened due to increased chilled water flow rate. The evaporation process was endothermic. With the increase in chilled water temperature, the heat exchange between the refrigerant and chilled water in the evaporator was strengthened, so the system efficiency increased.

4.3.4. Influence of Compressor Discharge Pressure

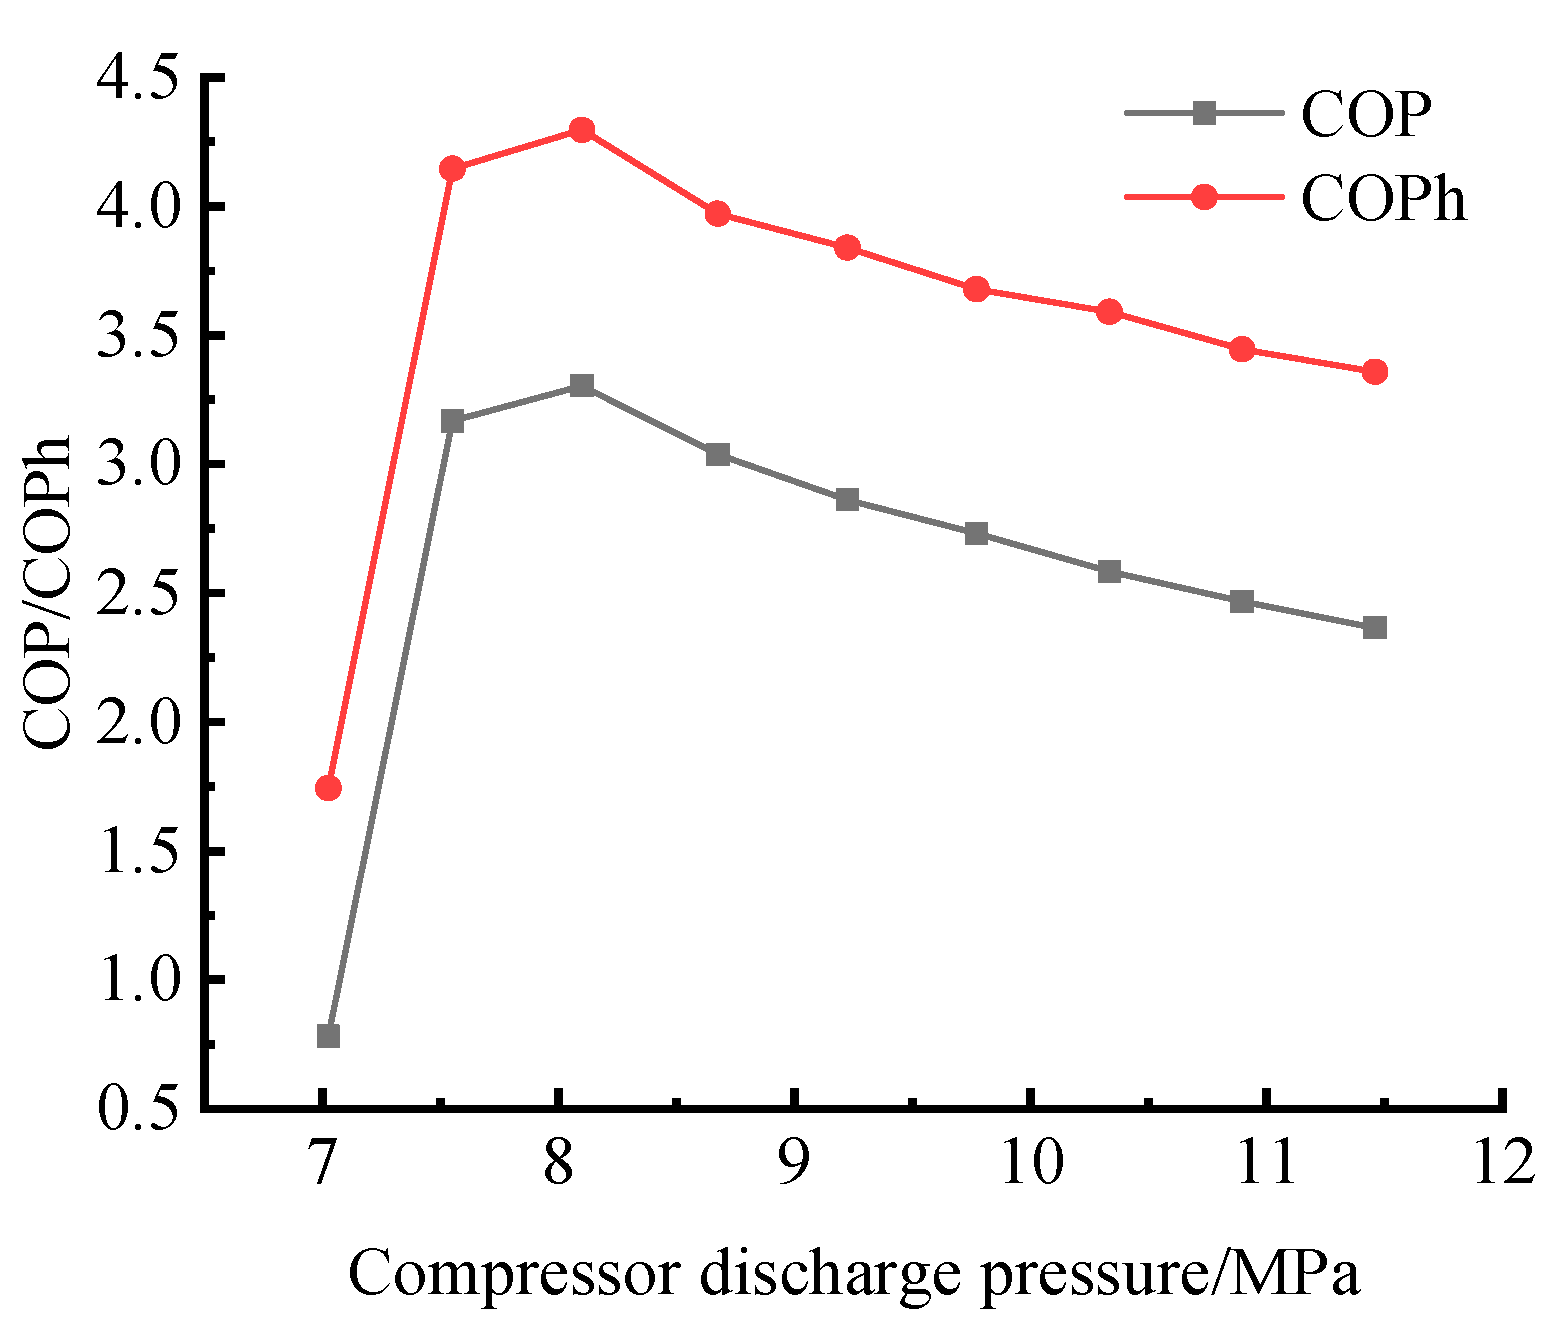
As can be seen from Figure 19, the system’s COP and COPh increased as the discharge pressure increased, and the variation trend gradually decreased, with the optimal high pressure existing. The highest values of COP and COPh of the system were 3.25 and 4.25, respectively, when the compressor discharge pressure was about 8.0 MPa.

5. Conclusions

Based on the existing experimental bench, the corresponding model of a CO2 transcritical water–water heat pump system with a thermoelectric subcooler was established by MATLAB. The compressor, gas cooler, subcooler, throttle valve, and evaporator were simulated and tested, and the simulation results were compared with the experimental results. The results are as follows:
  • Through calculation, it was found that the uncertainty of the experiment was less than 1%, indicating that the accuracy of the experiment was high. When the cooling water flow increased, COPh continued to rise, regardless of whether the system was equipped with a thermoelectric subcooler. COP increased with increased chilled water flow and temperature.
  • The simulation results of the system were compared with the experimental results, and the error was generally less than 10%, thus verifying the high accuracy of the established simulation model.
  • Through simulation calculation, it was found that with the increase in chilled water flow and temperature, COP and COP showed a gradual upward trend.
  • When the discharge pressure of the compressor changed, COP and COPh corresponded to an optimal high pressure of about 8 MPa.

Author Contributions

Data curation, J.Y.; writing—original draft preparation, L.W.; material collection, Y.H.; literature collection, X.Z.; data reduction, Y.D. All authors have read and agreed to the published version of the manuscript.

Funding

This research was funded by the Tianjin Natural Science Foundation Project, grant number 17JCZDJC31400.

Data Availability Statement

Data available on request due to restrictions, e.g., privacy or ethical. The data presented in this study are available on request from the corresponding author.

Conflicts of Interest

The authors declare no conflict of interest.

Nomenclature

A current, A
Boboiling number
COP coefficient of performance
COPh heating coefficient of performance
cpspecific heat at constant pressure, kJ/(kg·K)
d w , o Outside diameter of the inner tube, mm
d w , i inner diameter of the inner tube, mm
Grrefrigerant mass flow, kg/s
gw1 volume flow of the chilled water, m3/h
gw2volume flow of the cooling water, m3/h
hspecific enthalpy, kJ/kg
Kthermocouple thermal conductivity, W/K
ltube length, m
mw1cooling water mass flow rate, kg/s
mw2chilled water mass flow rate, kg/s
Ppressure, MPa
Qrefrigeration capacity of thermoelectric subcooler, kW
Q1refrigeration capacity, kW
Q2heating capacity, kW
Rresistance, Ω;
RerReynolds number
rfouling coefficient, m2·°C/W
ttemperature, °C
Tthermoelectric subcooler temperature, K
v s compressor refrigerant specific capacity
Wpower consumption, kW
xdryness
Greek symbols
α Seebeck coefficient, V/K
η m mechanical efficiency
η is isentropic efficiency
η v volumetric efficiency
ρ density, kg/m3
Subscript
ccold end
comcompressor
hhot end
nN-type
pP-type
TESC thermoelectric subcooler
w1 chilled water
w2 cooling water
w, ininlet water of the cooling water
w, outoutlet water of the cooling water
wininlet of the chilled water
woutoutlet of the chilled water

References

  1. Li, Y.-F. Do a good job of carbon peaking and carbon neutrality, and usher in a new ea of low-emission development. World Environ. 2021, 1, 16–19. [Google Scholar]
  2. Zhang, B.-T. How to fulfill the commitment to reduce emissions: The inspiration for China’s first carbon peak. Hydropower New Energy 2021, 3, 1–6. [Google Scholar]
  3. Jiang, H. Analysis of ozone and ozone layer destruction and its protection mechanism. Low-Carbon World 2017, 3, 27–28. [Google Scholar]
  4. Wang, G.; Xie, G.-Z.; Zhang, L.-R. Analysis of HCFCs working fluid substitution in the refrigeration and air conditioning industry. Refrig. Air Cond. 2012, 26, 18–23+43. [Google Scholar]
  5. Wang, X.-C. Interpretation, review and initiatives on the Montreal Protocol amendments to reduce hydrofluorocarbons (HFCs). HVAC 2017, 5, 72–76. [Google Scholar]
  6. Zhang, Z.-Y.; Fang, X.-K.; Bie, P.-J. Analysis of the contribution of China’s control of HFCs emissions to climate change mitigation. Environ. Prot. 2017, 45, 65–67. [Google Scholar]
  7. Liu, Y.-H.; Feng, L.-W.; Yang, Z.-F. Theoretical analysis and development of air source heat pump water heater based on CO2 refrigerant. Refrigeration 2022, 1, 36–40. [Google Scholar]
  8. Wang, G.-B.; Zhang, X.-R. Thermoeconomic Optimization and Comparison of the Simple Single-Stage Transcritical Carbon Dioxide Vapor Compression Cycle with Different Subcooling Methods for District Heating and Cooling. Energy Convers. Manag. 2019, 185, 740–757. [Google Scholar] [CrossRef]
  9. Ma, Y.-T.; Yuan, Q.-X.; Li, M.-X. Performance comparison of transcritical CO2 with expander and back-cycle with injector. Low Temp. Subconductivity 2011, 39, 36–41. [Google Scholar]
  10. Dai, B.-M.; Liu, S.-C.; Pan, H.-R.; Sun, Z.-L.; Yang, Q.-R.; Ma, Y.-T. Thermoelectric subcooler-expander coupled CO2 transcritical refrigeration cycle analysis. Fluid Mach. 2019, 47, 76–82+46. [Google Scholar]
  11. Rigola, J.; Ablanque, N.; Pérez-Segarra, C.D.; Oliva, A. Numerical Simulation and Experimental Validation of Internal Heat Exchanger Influence on CO2 Trans-Critical Cycle Performance. Int. J. Refrig. 2010, 33, 664–674. [Google Scholar] [CrossRef]
  12. Lin, X.; Mo, S.; Mo, B.; Jia, L.; Chen, Y.; Cheng, Z. Thermal Management of High-Power LED Based on Thermoelectric Cooler and Nanofluid-Cooled Microchannel Heat Sink. Appl. Therm. Eng. 2020, 172, 115165. [Google Scholar] [CrossRef]
  13. Astrain, D.; Aranguren, P.; Martínez, A.; Rodríguez, A.; Pérez, M.G. A Comparative Study of Different Heat Exchange Systems in a Thermoelectric Refrigerator and Their Influence on the Efficiency. Appl. Therm. Eng. 2016, 103, 1289–1298. [Google Scholar] [CrossRef]
  14. Gong, T.; Gao, L.; Wu, Y.; Zhang, L.; Yin, S.; Li, J.; Ming, T. Numerical Simulation on a Compact Thermoelectric Cooler for the Optimized Design. Appl. Therm. Eng. 2019, 146, 815–825. [Google Scholar] [CrossRef]
  15. Koeln, J.P.; Alleyne, A.G. Optimal Subcooling in Vapor Compression Systems via Extremum Seeking Control: Theory and Experiments. Int. J. Refrig. 2014, 43, 14–25. [Google Scholar] [CrossRef]
  16. Wang, Q.-Z.; Liu, S.-F. Test and practice of installing subcoolers in heat pumps. Jiangxi Coal Technol. 2005, 29–31. [Google Scholar] [CrossRef]
  17. Yang, B.; Ahuja, H.; Tran, T. Review Article: Thermoelectric Technology Assessment: Application to Air Conditioning and Refrigeration. HVACR Res. 2008, 14, 635–653. [Google Scholar] [CrossRef]
  18. Li, G.-L.; Lv, Z.-J.; Jin, T.-X. Experimental study on the optimization of the working voltage of thermoelectric subcooler. Low Temp. Supercond. 2018, 46, 86–90. [Google Scholar]
  19. Astrain, D.; Merino, A.; Catalán, L.; Aranguren, P.; Araiz, M.; Sánchez, D.; Cabello, R.; Llopis, R. Improvements in the Cooling Capacity and the COP of a Transcritical CO2 Refrigeration Plant Operating with a Thermoelectric Subcooling System. Appl. Therm. Eng. 2019, 155, 110–122. [Google Scholar] [CrossRef]
  20. Sánchez, D.; Aranguren, P.; Casi, A.; Llopis, R.; Cabello, R.; Astrain, D. Experimental Enhancement of a CO2 Transcritical Refrigerating Plant Including Thermoelectric Subcooling. Int. J. Refrig. 2020, 120, 178–187. [Google Scholar] [CrossRef]
  21. Aranguren, P.; Sánchez, D.; Casi, A.; Cabello, R.; Astrain, D. Experimental Assessment of a Thermoelectric Subcooler Included in a Transcritical CO2 Refrigeration Plant. Appl. Therm. Eng. 2021, 190, 116826. [Google Scholar] [CrossRef]
  22. Liu, Z.-Y. Numerical Simulation and Experimental Study of CO2 Transcritical Cycle Water-Water Heat Pump. Ph.D. Thesis, Tianjin University, Tianjin, China, 2011. [Google Scholar]
  23. Austin, B.T.; Sumathy, K. Parametric Study on the Performance of a Direct-Expansion Geothermal Heat Pump Using Carbon Dioxide. Appl. Therm. Eng. 2011, 31, 3774–3782. [Google Scholar] [CrossRef]
  24. Yoon, S.H.; Kim, J.H.; Hwang, Y.W.; Kim, M.S. Heat Transfer and Pressure Drop Characteristics during the In-Tube Cooling Process of Carbon Dioxide in the Subcritical Region. Int. J. Refrig. 2003, 26, 857–864. [Google Scholar] [CrossRef] [Green Version]
  25. Searle, M.; Black, J.; Straub, D.; Robey, E.; Yip, J.; Ramesh, S.; Roy, A.; Sabau, A.S.; Mollot, D. Heat Transfer Coefficients of Additively Manufactured Tubes with Internal Pin Fins for Supercritical Carbon Dioxide Cycle Recuperators. Appl. Therm. Eng. 2020, 181, 116030. [Google Scholar] [CrossRef]
  26. Chen, D.-S.; Shi, Y.-M.; Gao, Z.-Q. Some general flow boiling estimates the applicability of correlations to several elements. J. Refrig. 2013, 34, 8–14. [Google Scholar]
  27. Yang, J.-L.; Tang, J.-B.; Miao, Y.-F. Optimal design calculation of cased CO2 evaporator. Fluid Mech. 2016, 44, 83–86. [Google Scholar]
  28. Kew, P.A.; Cornwell, K. Correlations for the Prediction of Boiling Heat Transfer in Small-Diameter Channels. Appl. Therm. Eng. 1997, 17, 705–715. [Google Scholar] [CrossRef]
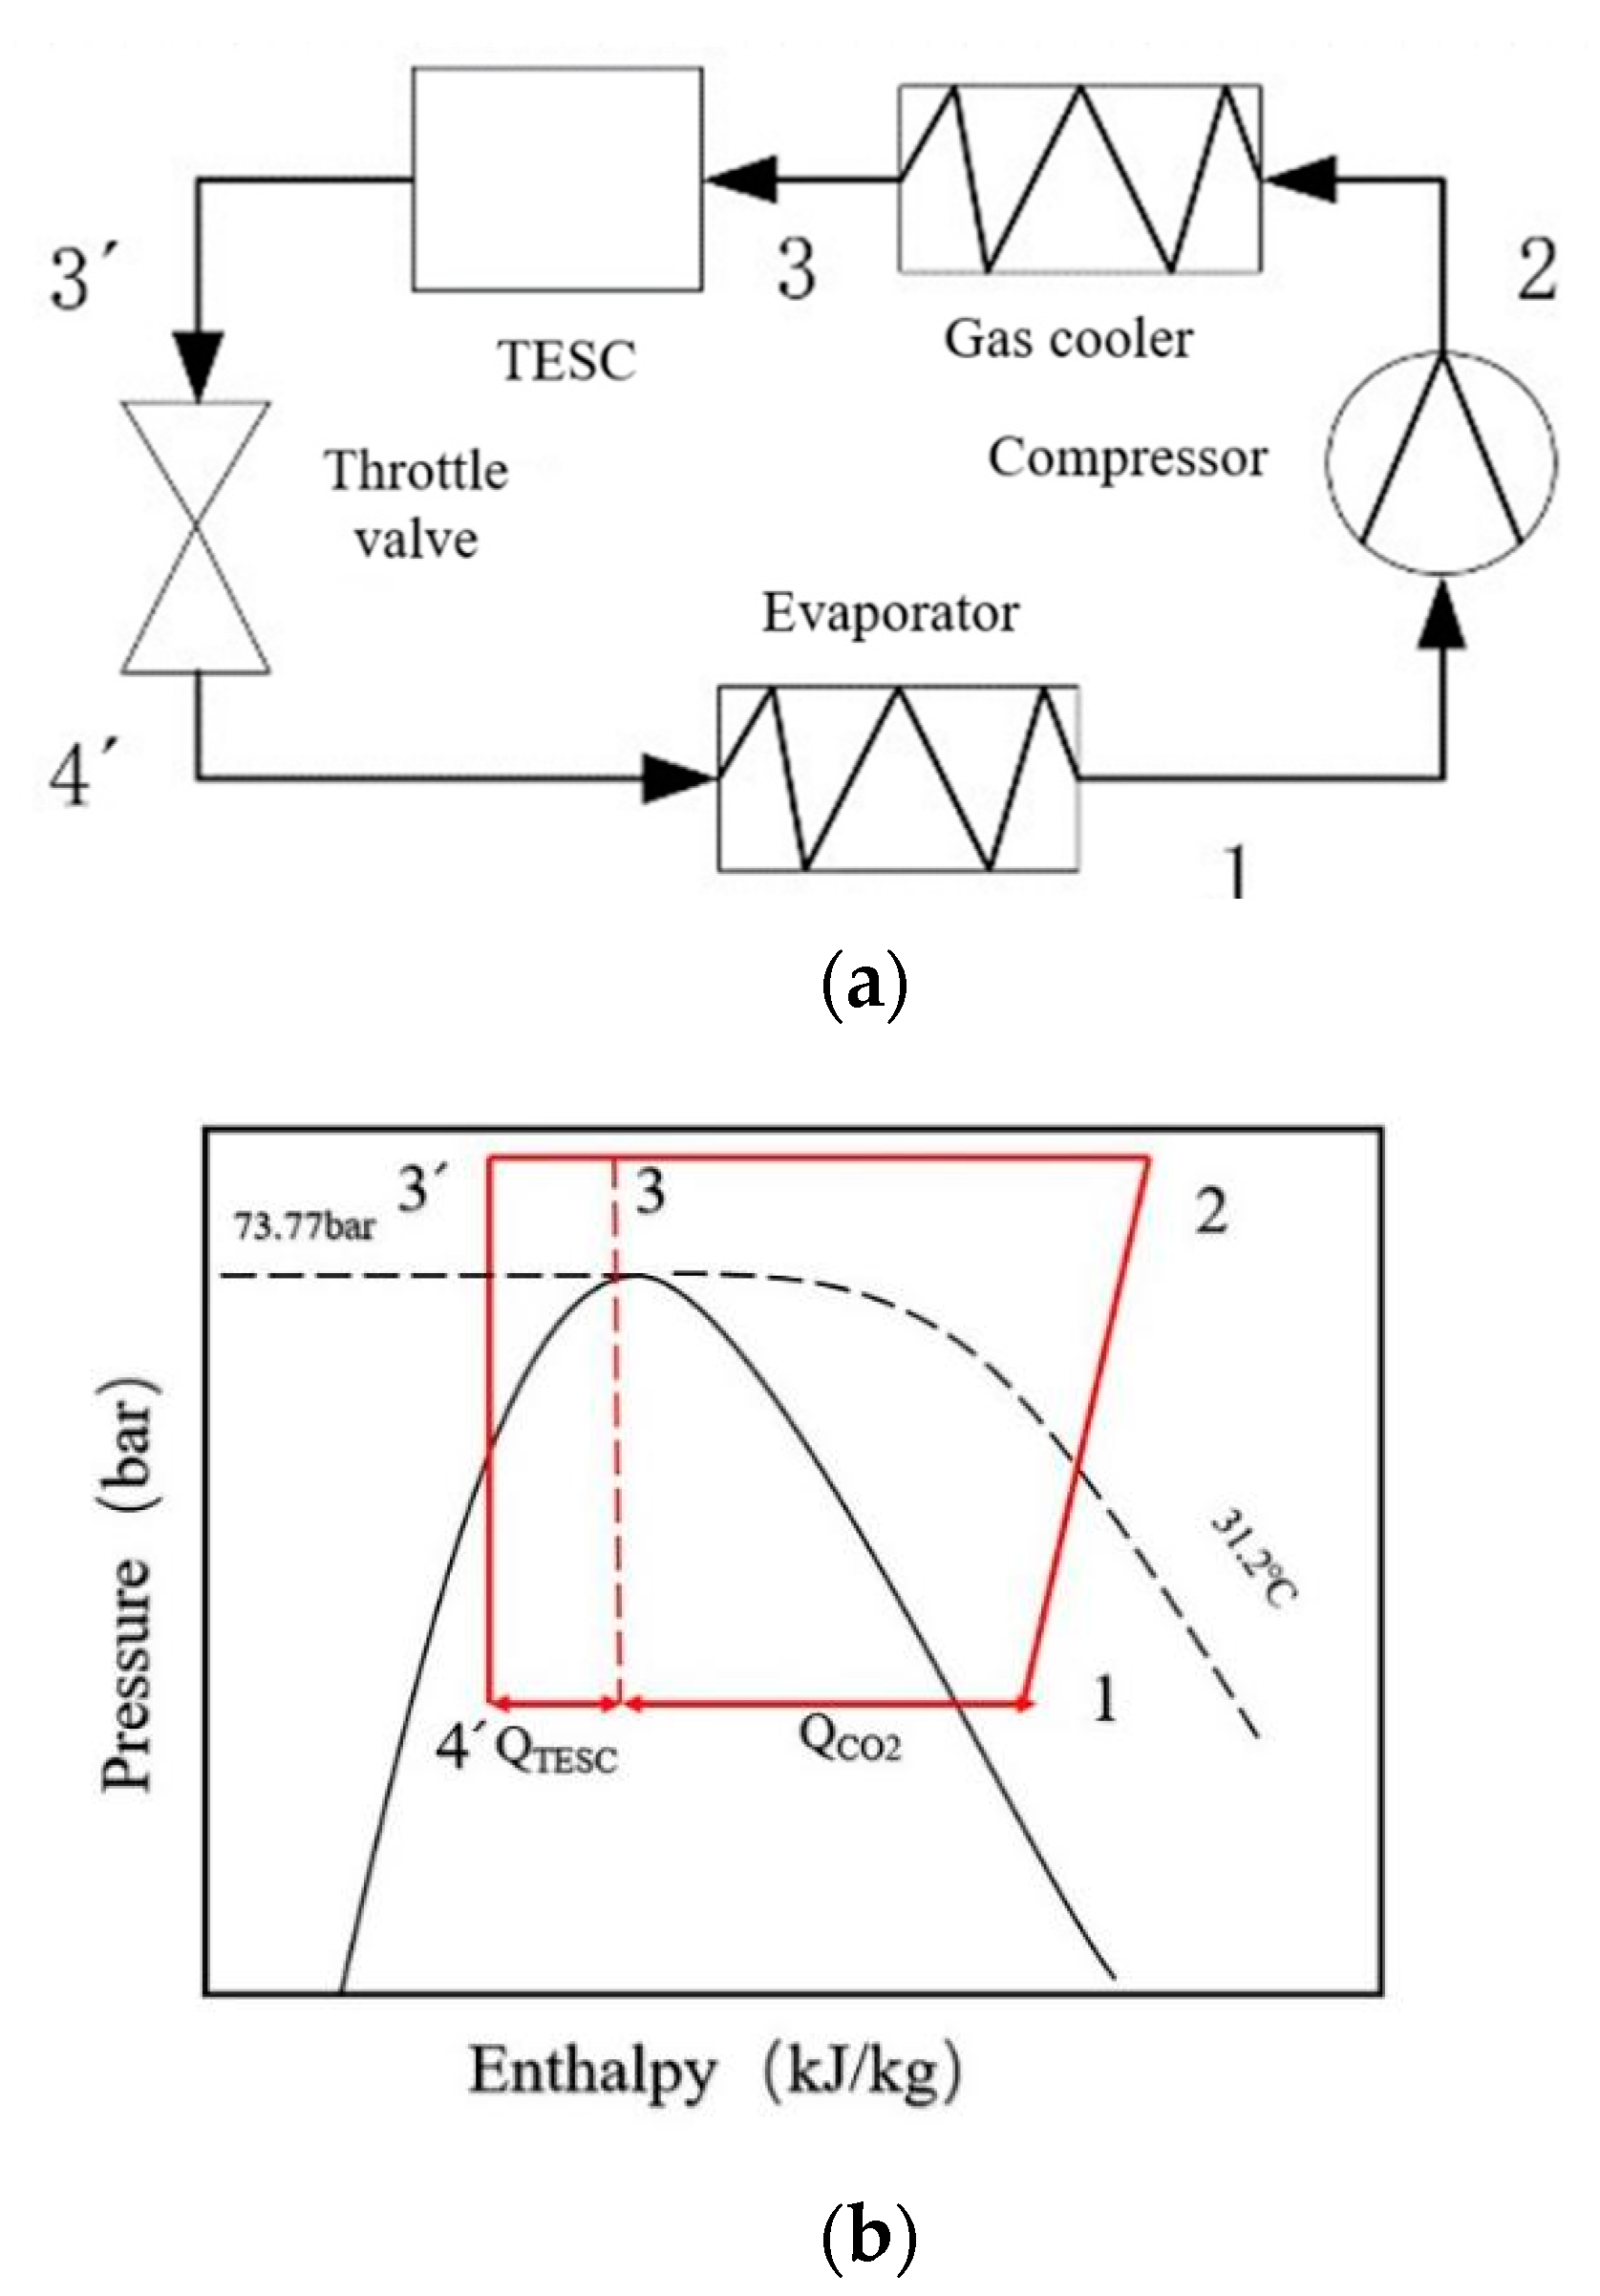
Figure 1. (a) Schematic diagram, (b) P–H diagram of the system.
Designs 06 00115 g001
Figure 2. CO2 water–water heat pump system with a thermoelectric subcooler. 1—compressor, 2—oil separator, 3—gas cooler, 4—thermoelectric subcooler, 5—mass flow meter, 6—regenerator, 7—throttle valve, 8—evaporator, 9—gas–liquid separator, 10—water flow meter, 11—water pump, 12—electric heater, 13—water tank, 14—drain valve, 15—inlet valve, T—thermocouple, P—pressure transmitter.
Designs 06 00115 g002
Figure 3. Structure of the thermoelectric subcooler.
Designs 06 00115 g003
Figure 4. Physical diagram of the thermoelectric subcooler.
Designs 06 00115 g004
Figure 5. The flow chart of system model calculation.
Designs 06 00115 g005
Figure 6. Influence of cooling water flow rate on COPh.
Designs 06 00115 g006
Figure 7. Influence of cooling water temperature on COPh.
Designs 06 00115 g007
Figure 8. Influence of chilled water flow on COP.
Designs 06 00115 g008
Figure 9. Influence of chilled water temperature on COP.
Designs 06 00115 g009
Figure 10. Influence of cooling water temperature on COPh.
Designs 06 00115 g010
Figure 11. Influence of cooling water flow rate on COPh.
Designs 06 00115 g011
Figure 12. Influence of chilled water temperature on COP.
Designs 06 00115 g012
Figure 13. Influence of subcooling degree on heating/cooling capacity.
Designs 06 00115 g013
Figure 14. Influence of subcooling degree on COP/COPh.
Designs 06 00115 g014
Figure 15. Influence of cooling water flow rate on COP/COPh.
Designs 06 00115 g015
Figure 16. Influence of cooling water temperature on COP/COPh.
Designs 06 00115 g016
Figure 17. Influence of chilled water flow rate on COP/COPh.
Designs 06 00115 g017
Figure 18. Influence of chilled water temperature on COP/COPh.
Designs 06 00115 g018
Figure 19. Influence of compressor discharge pressure on COP/COPh.
Designs 06 00115 g019
Table 1. The main components and technical parameters of the heat pump system.
EquipmentDetails
CompressorThe CO2 special compressor produced by Dorin (Torin) in Italy, model CD380H, speed 1450 rpm, rated input power 3.3 kW, oil injection capacity 1.3 kg, net weight 77 kg.
Gas coolerSelf-made casing heat exchanger, Φ22.2 seamless steel pipe as outer pipe, Φ12 nickel white copper threaded pipe as inner pipe, water pipe layer, CO2 shell layer, pipe length 16 m, total heat exchange area of 1.2 m2, countercurrent form adopted to enhance heat transfer, maximum pressure 14 MPa.
EvaporatorSelf-made casing heat exchanger, Φ22.2 seamless steel pipe as outer pipe, Φ12 nickel white copper threaded pipe as inner pipe, water pipe layer, CO2 shell layer, pipe length 16 m, total heat exchange area of 1.2 m2, countercurrent form adopted to enhance heat transfer, maximum pressure 14 MPa.
Thermoelectric subcoolerComposed of thermoelectric refrigeration sheet, water cooler, and cold end fin of model TEC1-12710, with a size of 16 × 1 × 6 cm.
RegeneratorSelf-made casing-type internal heat exchanger, stainless steel material, copper tube with inner tube Φ12, copper tube with outer tube Φ19, heat exchange area 0.3 m2, high temperature CO2 pipe from gas cooler, low temperature CO2 from evaporator flow outside the tube, countercurrent heat exchange.
CO2 expansion control valveInner diameter of the connecting pipe of 2.4 mm, cooling capacity of 8.6 kW, maximum pressure of 15 MPa, and working pressure difference of 0–10 MPa.
Gas–liquid separatorSelf-made stainless steel gas–liquid separator, outer tube Φ50, inner tube Φ6, height of 0.5 m.
Oil separatorHomemade stainless steel oil separator, outer tube Φ100, height 0.5 m, interface size 1–1/8 (28 mm).
CO2 high-pressure reservoirOuter tube Φ100, height 0.5 m.
Table 2. Performance parameters of thermoelectric refrigerating sheet.
ModelMaximum Operating Temperature/
°C
Maximum Cooling Capacity/
W
Maximum Temperature Difference/
°C
Input Voltage/
V
Maximum Current/
A
TEC1-127108089651210
Table 3. Technical parameters of each data acquisition equipment.
EquipmentMeasuring RangePrecision or Grade of PrecisionConditions of UseInstructions
TemperaturePlatinum resistance temperature sensor−50 to 400 °CA grade
0.1%
Siemens
7MC1006-1DA16-Z T10
PressurePressure transducer1 kPa to 40 MPa±0.25%Siemens
7MF1567-3DE00-3AA1
PowerElectric power transmitter0–866 W0.2%Operating temperature: 0–45 °CSuzhou honow
FPW-201
Water flowTurbine flow meter0.2–1.2 m3/hLevel 0.5 (water calibration)Temperature of measured medium: −20 to 120 °C; pressure: ≤25 MpaDayt and LWGAYA-15
The connection mode is threaded connection
CO2 mass flow rateCoriolis mass flow meter0–250 kg/h0.5 gradeStandard temperature: −50 to 150 °C, fluid
Pressure measurement tube: 23 MPa
Siemens
7ME4100-1CL10-1DA1
Publisher’s Note: MDPI stays neutral with regard to jurisdictional claims in published maps and institutional affiliations.