1. Introduction
Carbonic materials are a unique type of material, since they display a rather interesting array of characteristics: increased surface area, microporosity, chemical stability, etc. [
1]. However, they are not the best materials to be used for H
2 storage due to the fact that, despite their high porosities, only a fraction of these pores are in the diameter range suitable for their interaction with H
2 molecules and the storage of H
2 within their inner structures, especially at moderate pressures and room temperatures [
2]. Theoretical calculations made by Ulrich [
3] determined that, in specific configurations, MW-CNTs can provide a leakage-free material up to 10,000 bar. Nevertheless, this value is a theoretical one, and, as the authors of [
1,
4,
5,
6] have demonstrated, at moderate pressures (up to 5 bar) 6.5 wt.% of H
2 adsorption can be achieved. Moreover, the US-EERE (American Office of Energy Efficiency and Renewable Energy) has set a bold target of 4.5 wt.% of H
2 at 1 bar [
7].
Current research has shown that carbonic materials’ properties in terms of H
2-storage capacity can be tailored towards a significant increase by doping them with transitional metals or even metal alloys. It has been demonstrated that MW-CNTs doped with TiAlO can absorb up to 6 wt.% of H
2 at temperatures ranging from 573 to 623 K [
4,
6]. In the automotive sector, such high temperatures are difficult to obtain and maintain, so the study aimed to assess the H
2-adsorption capacities of the developed materials at room temperatures but at pressures comparable to the ones within LPG tanks currently mounted on vehicles. Thus, the testing pressures used were between 10 and 30 bar, given the fact that H
2 is actually adsorbed within the carbonic material.
The adsorption phenomenon takes place when the surface of the material is modified in order to create functional groups to embed the metal doping [
8]. Surface enhancement may be achieved by several techniques [
9,
10], but the one used in the current study was high-frequency ultrasound [
4]. The use of ultrasound was necessary to induce fractures within the materials’ inner structures in order to create the functional areas mentioned above. Since Pt is the doping metal usually used in reactions involving H
2, it is understandable that it was chosen for the carbon-based substrates [
11]. At the same time, Pt may be an expensive material, so cheaper alternatives were selected: Ir and Ru. All three of them are known for being very reactive and suitable for use in improving the H
2-adsorption capacity of a substrate, but their characteristics in terms of electronegativity and electron affinity vary. The most reactive of them is Pt, having an electronegativity of 2.28 and an electron affinity of 205.3 kJ/mole, while Ir has an electronegativity of 2.2 and an electron affinity of 151 kJ/mole and Ru has an electronegativity of 2.2 and an electron affinity of 101.3 kJ/mole.
The substrate [
12] doping was performed by chemical means—the reduction of metal salts in the presence of acids, after their functionalization by using high-frequency ultrasound—since it presents one great advantage compared with physical doping procedures: reproducibility. Metal particles deposited on the substrate enhance H
2 adsorption, but their most important role is that they “send” the dissociated hydrogen molecules and spill them over to the carbonic substrate [
4]. A modified porosity of the substrate can absorb large quantities of H
2, mainly due to the attractive potential of pore walls. In ref. [
8], the atoms of the adsorbed gas migrated away from the metallic dopant deep inside the substrate material. Nowadays, researchers are focused on fully understanding the spill-over process [
13], but it is widely accepted that, in order to obtain a notable result in terms of H
2-adsorption-capacity increase, the main condition regarding the substrate is to let the hydrogen atoms “travel” away from the metal [
1].
A variety of substrates are currently under research, as presented in [
14], starting from quite simple ones, such as MCM-41 mesoporous silica doped with the most regular metals, such as Fe, Ni, Ti, CO and Mg, and with rather modest results in terms of H
2-storage capacities ranging from 0.003 to 0.012 wt.% at 10 bar and 77 K [
15]. Some research is focused on more “sophisticated” substrates, as presented in [
16], where organic complexes made of benzene based complexes where boron atoms are used as substitutes for carbon atoms within benzene molecule and Li, Ca and Be were used as metals for doping, the newly obtained complexes, show results ranging from 2.26 wt.% for the Be-doped substrate to 6.82 wt.% for the Li- and 7.54 wt.% for the Ca-doped substrates.
The results published by Hussain et al. [
17] for a 2D boron–graphdiyne nanosheet as a substrate doped simultaneously with four metal atoms (Li, Na, K and Ca) are impressive; the authors managed to obtain up to 14.29 wt.% of H
2 at 1 bar and 100 K.
Moreover, papers such as Divyia et al.’s [
18] have tackled the obtainment of carbon-based substrates, namely, hydrogen-exfoliated graphene sheets doped with platinum for hydrogen adsorption. Their results showed a very promising start by obtaining a storage capacity of a maximum 1.4 wt.% at 25 °C and 3 MPa (30 bar).
High-surface-area carbon materials doped with Pt, Ru and Ni have been studied by Wang et al. in [
19]. They discovered that when doping templated and super-activated (AX-21) carbon, the H
2-storage capacities varied as follows: Ru/C > Pt/C > Ni/C, but the maximum storage capacity obtained was 1.56 wt.% at 298 K and 103 bar.
A very deep insight related to the progress reported on the development of materials used for hydrogen storage from 2013 to 2018 [
20] has shown that high gravimetric percentages of adsorbed H
2 of up to 15 wt.% can be achieved at 77 K and 50 bar. In this paper [
20], the authors agreed that future fundamental studies within this field would focus on nanostructured materials as supports.
Having in mind the above-mentioned aspects, the current paper tackles two types of carbonic substrates (carbon nanotubes and polyaniline) functionalized and doped with platinic metals: Pt, Ru and Ir. Their H2-adsorption capacities were assessed at 293 K and at relatively low pressures (10, 20 and 30 bar). As compared with the results reported in the literature, the ones obtained for the above-mentioned materials are much more promising, thus representing added value in the field of nanostructured carbonic materials for use in hydrogen adsorption.
2. Materials and Methods
In order to carry out the research work reported in this paper, MW-CNTs were purchased from the market but p-C6H5NH2 was prepared in the lab. Both substrates were doped with metals using the chemical doping method of metal salt reduction with formic acid. All the reactants used in this paper were purchased from Sigma-Aldrich, Darmstadt, Germany, Europe.
2.1. Method for Preparing Polyaniline p-C6H5NH2
A quantity of 3.82 g of 0.2 M aniline sulphate (C
12H
16N
2O
4S) was chemically oxidized with 5.71 g of 0.2 M ammonium peroxy-disulphate ((NH
4)
2S
2O
8), as in [
9,
10,
11]. Each of the 99.99%-purity reactants were dissolved in separate Berzelius beakers in 50 mL of H
2SO
4 at a concentration of 0.2 M at room temperature under continuous stirring in order to allow polymerization reactions to occur. After 2.5 h, the obtained mixtures were filtered and washed with H
2SO
4 in order to eliminate all the by-products. In addition, the precipitates were washed with (CH
3)
2CO to more thoroughly clean the precipitates of the by-products. The obtained result was a “synthetic metal”: polyaniline sulphate (p-C
6H
5-NH-HSO
4).
2.2. Method for Preparing Metal-Doped Polyaniline p-C6H5NH2
The procedure was similar to that performed for the 3 metal salts used for the substrate and was as follows:
A quantity of 0.5 g of the obtained “synthetic metal”, p-C6H5-NH-HSO4, was dispersed in deionized water, and a 70 kHz high-frequency ultrasound cannon was used to induce fractures within the p-C6H5NH2’s internal structure, allowing the metal salt grains to adhere to the substrate. It was calculated that this frequency was sufficient to fracture the inner part of the substrate.
Then, 1 g of NaHCO3 was added to the solution and brought to boil for 0.5 h.
In a separate Berzelius beaker, equal quantities (0.5 g) of the metal salts—H2PtCl6, RuCl3·H2O and IrCl3—were dissolved in 50 mL of deionized water underboiling and continuous stirring. After that, 3 cm3 of formic acid was mixed with 25 cm3 of purified water and poured over the dissolved salt. This mixture was kept at 80 °C for 0.5 h and then poured over the above-described functionalized p-C6H5NH2.
This final mixture was kept at 80 °C for 1 h under the influence of the ultrasound cannon and then vacuum-filtered and washed with deionized water until its pH = 7.
The precipitate was dried at 100 °C for 3 h and then ground to a grain size of 0.5 mm.
2.3. Method for Preparing the Metal-Doped MW-CNTs
As in the case of p-C6H5NH2, the same procedure was applied for all the metals, as follows:
Equal quantities (0.25 g) of the metal salts—H2PtCl6, RuCl3·H2O and IrCl3—and MW-CNTs were mixed with 50 cm3 of deionized water and heated to 80 °C under continuous stirring. The same high-frequency ultrasound cannon was used to induce fractures within the CNT structures. Then, 5 cm3 of formic acid was added to each mixture and this was brought to boil and kept for 1 h. After that, the solution was filtered, and the solid part was washed using deionized water until its pH = 7. Then, it was dried for 3 h at 100 °C.
The resultant solid did not need to be ground to obtain a fine granulated product.
The MW-CNTs used were TNMCN7s, produced by Chengdu Organic Chemicals Co. Ltd. Chinese Academy of Sciences, Chengdu, China, and had the following properties [
12]:
OD (outer diameter): 30–80 nm;
Purity: >98 wt.%;
N content: >2.5 wt.%;
Length: 10–30 µm;
SSA (specific surface area): >30 m2/g.
2.4. Methods for Substrate Characterization
2.4.1. X-ray Diffraction
A D8 Advanced XRD instrument, produced by Brucker, that uses wide-angle X-ray scattering was employed. Its main characteristics are: Cu anode (λ = 1.54059), Goebel mirror and 1D LynxEye secondary detector optics. The plots were drafted at a 0.04° angle increment and a scanning speed of 1 s/step. The sample was polished with a 5 µm soapstone and then put in the equipment for analysis.
2.4.2. N2 Adsorption Experiments
The Autosorb-1, provided by Quanta chrome Europe, was used to measure the samples’ and micropores’ surfaces. The method used was physical adsorption/desorption of nitrogen gas on the materials’ and open pores’ surfaces. The working pressure ranged from 0.001 to 1 bar and allowed the determination of the following: BET surface micropore properties, including surface area.
2.5. Method for the Adsorption-Capacity Measurement of the Doped Carbonic Materials
The method used to determine the H2-adsorption capacities of the doped materials was the physical adsorption method. The method relies on measuring the amount of gas stored within a porous material at different set pressures. The equipment used was a PCT-PRO User, provided by Setaram, Lyon, France. The equipment allows gas (H2 included)-adsorption-capacity measurements at pressures ranging from 1 to 200 bar (the standard pressure of a 50-litre gas tank provided by Linde Romania). Thus, 1 g of sample was put in a high-pressure container and gaseous hydrogen was introduced into the container until the set pressure was reached and then the amount of gas adsorbed by the material was measured. The results are given in wt.% vs. pressure at room temperature.
3. Results and Discussion
All the samples were structurally and functionally tested as follows: from the structural point of view, XRD was used to determine N2 adsorption for total and micropore surface areas, and from the functional point of view, H2-adsorption capacity was measured.
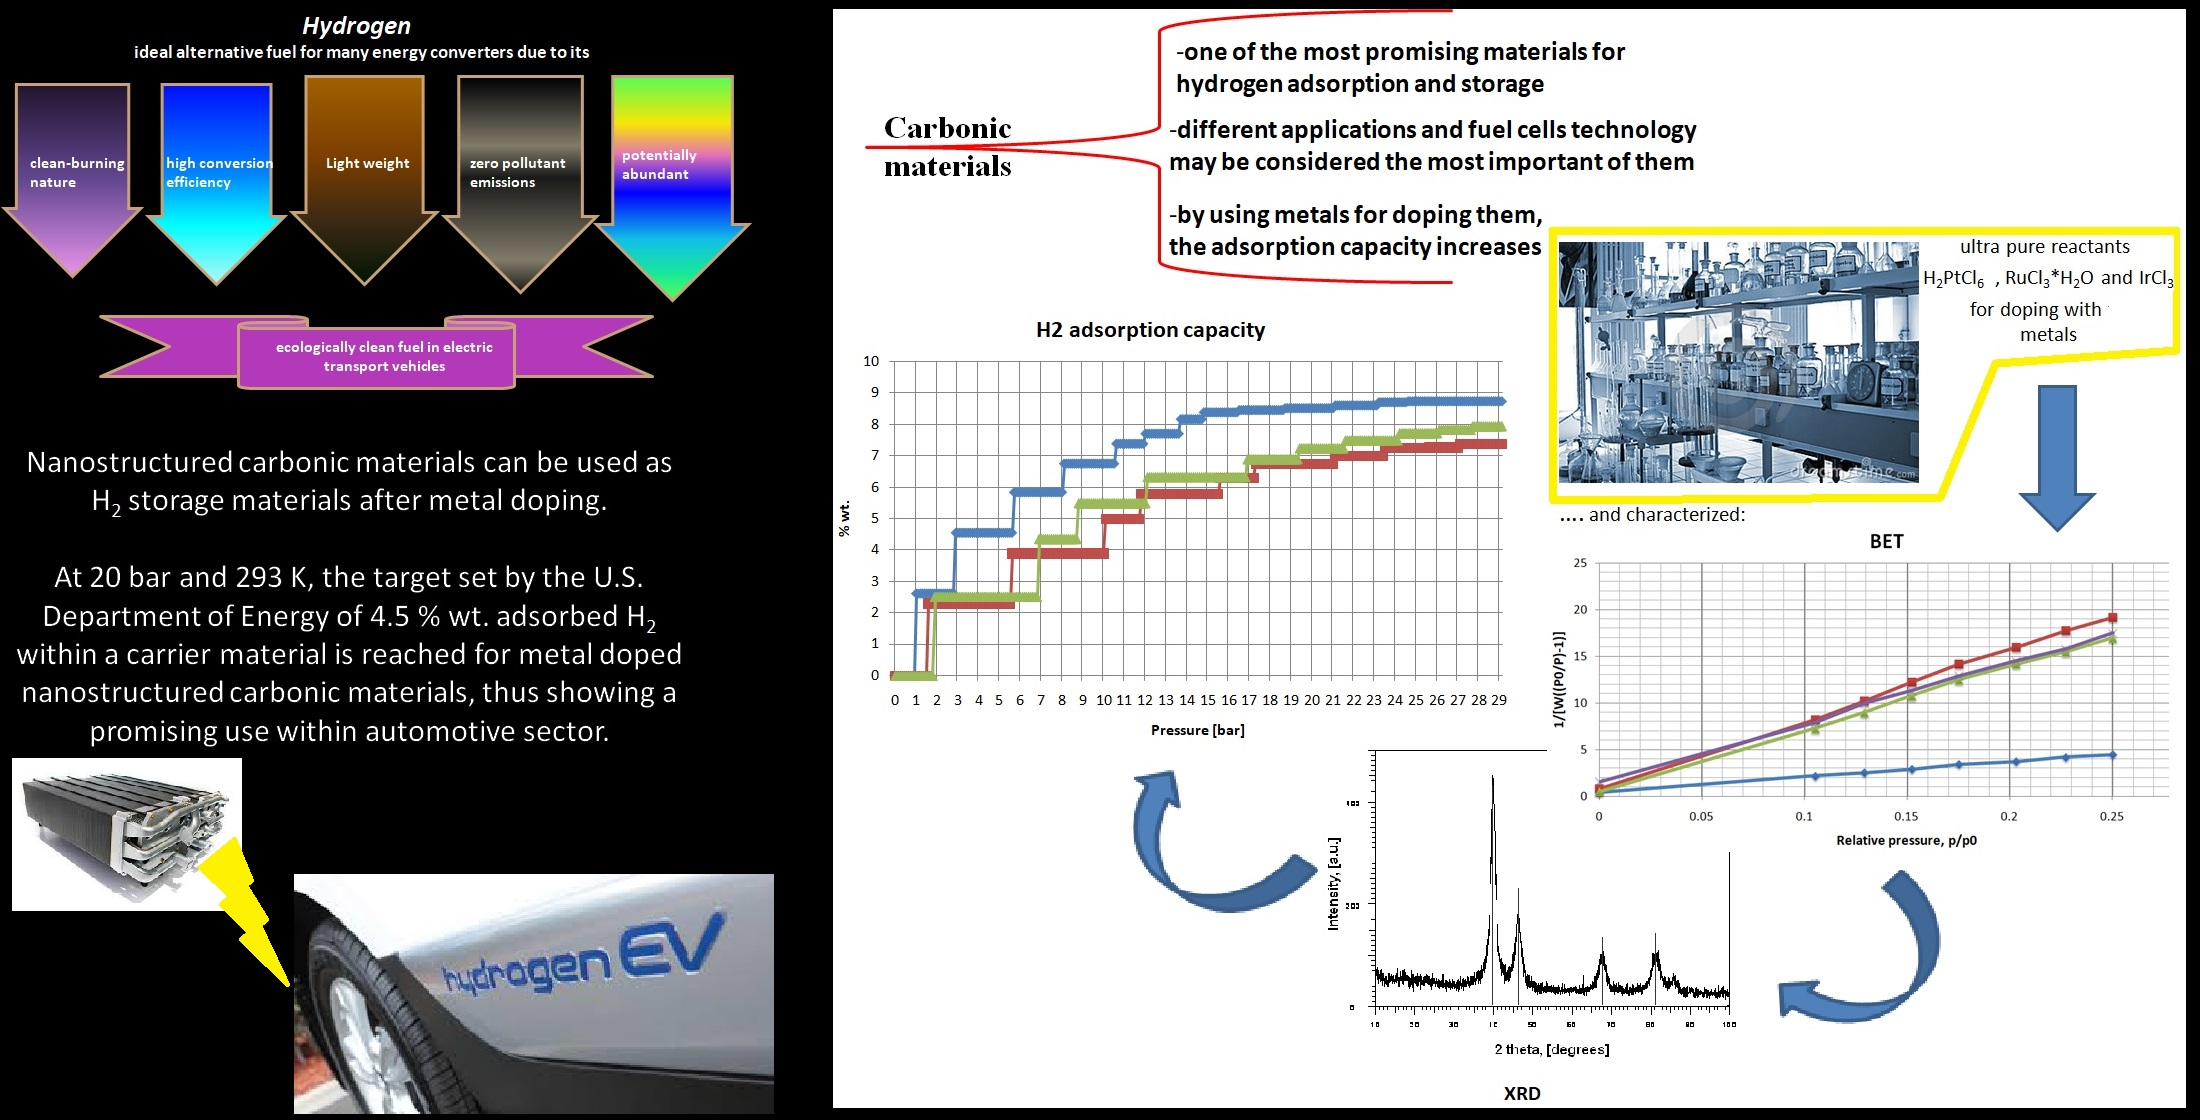
3.1. XRD Assessment
XRD plots were drafted in order to emphasize the presence of metals within the structures of the carbonic materials. The method relies on the analysis of the crystalline phase embedded in a sample.
As can be observed,
Figure 1a shows the crystalline structure of the graphite enclosed within the nanotubes (~2Θ = 26). Due to its sp
3 hybridization, the graphite peaks stand on their own within the amorphous structures of the nanotubes; it is well known that sp
3 hybridization can be observed using X-rays due to its similitude to a crystalline structure. The situation changes after the doping procedure, when metal crystalline forms started to appear within the materials’ structures. Thus,
Figure 1b shows a well-defined crystalline structure of Pt, the peak of which is considerably larger than the graphite’s. It is to be mentioned that Pt has a face-centred crystalline structure, as does Ir, while Ru has a hexagonal structure.
Figure 1c,d also show metal crystals embedded within the carbonic substrate, but their peak dimensions are lower than graphite’s. One possible explanation is the electronegativity of the metals. Thus, the proposed chemical reduction of their salts does not provide results similar to those for Pt. So, the next step in this research may be the use of a stronger acid than formic acid.
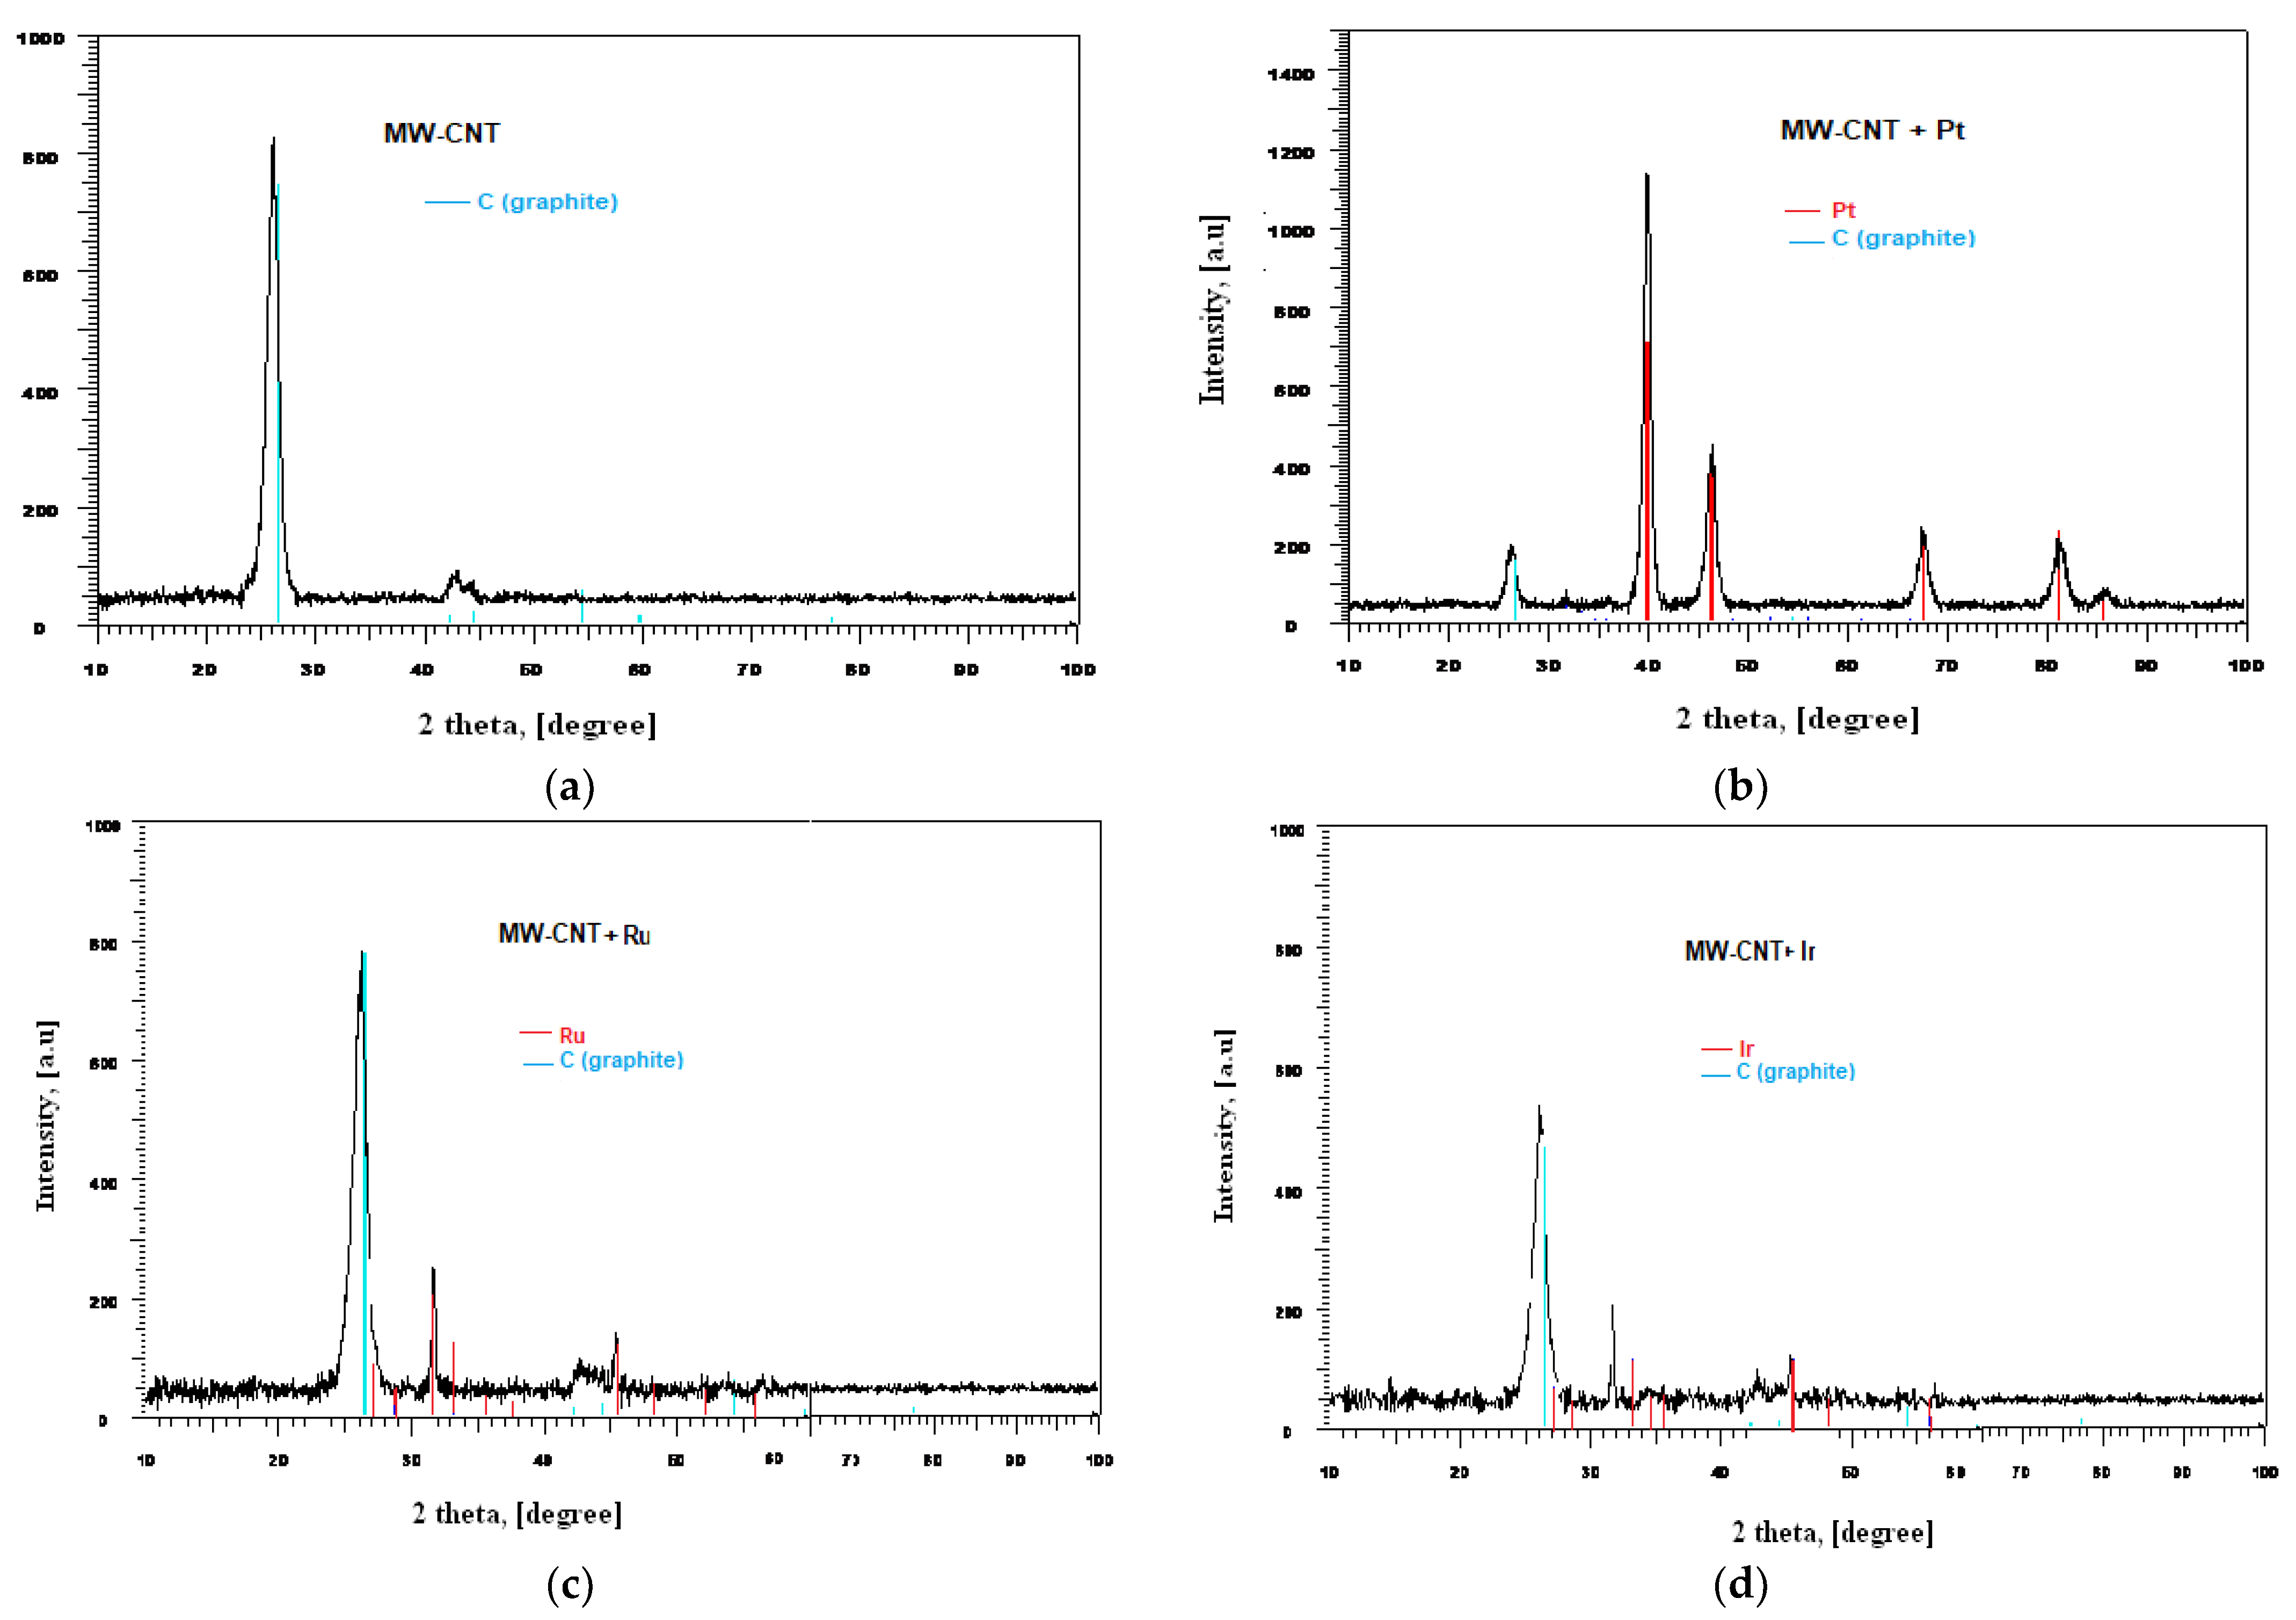
Figure 2 shows the presence of the metal crystalline forms embedded in the substrates. Unlike MW-CNTs, p-C
6H
5NH
2 does not have sp
3 hybridization; therefore, its structure is entirely amorphous, as can be observed in
Figure 2a. The peak sizes in the case of p-C
6H
5NH
2 doping are similar to those of the MW-CNTs in terms of size and shape, Pt being the best-represented.
3.2. N2-Adsorption Experiments
By determining the total amount of gas adsorbed on the surface of porous materials, this analysis modifies the pressure until equilibrium is reached. Two material characteristics were measured using the equipment described within
Section 2.4.2: BET surface, which indicates the modifications on the overall material’s surface after doping, and the total surface of the micropores. As stated before, one drawback of using carbonic materials for H
2 storage is the low number of micropores and thus the inability to establish strong physical bonds between H
2 molecules and pore walls. BET surface was determined using physical adsorption. Physisorbed molecules are fairly free to move around the surface of as ample. As more gas molecules are introduced within the system, the adsorbate molecules tend to form a thin layer that covers the entire adsorbent surface. Based on well-known BET theory, one can estimate the number of molecules necessary to cover the adsorbent surface with a monolayer of adsorbed molecules. Multiplying that number with the cross-sectional area of an adsorbate molecule yields the sample’s surface area. Continued addition of gas molecules beyond monolayer formation leads to the gradual stacking of multiple layers on top of each other. Computational methods, such as the one developed by Barret, Joyner and Halenda (BJH), allow the computation of pore sizes from equilibrium gas pressures. One can therefore generate experimental curves linking adsorbed gas volumes with relative saturation pressures at equilibrium and convert them to cumulative or differential pore-size distributions [
13].
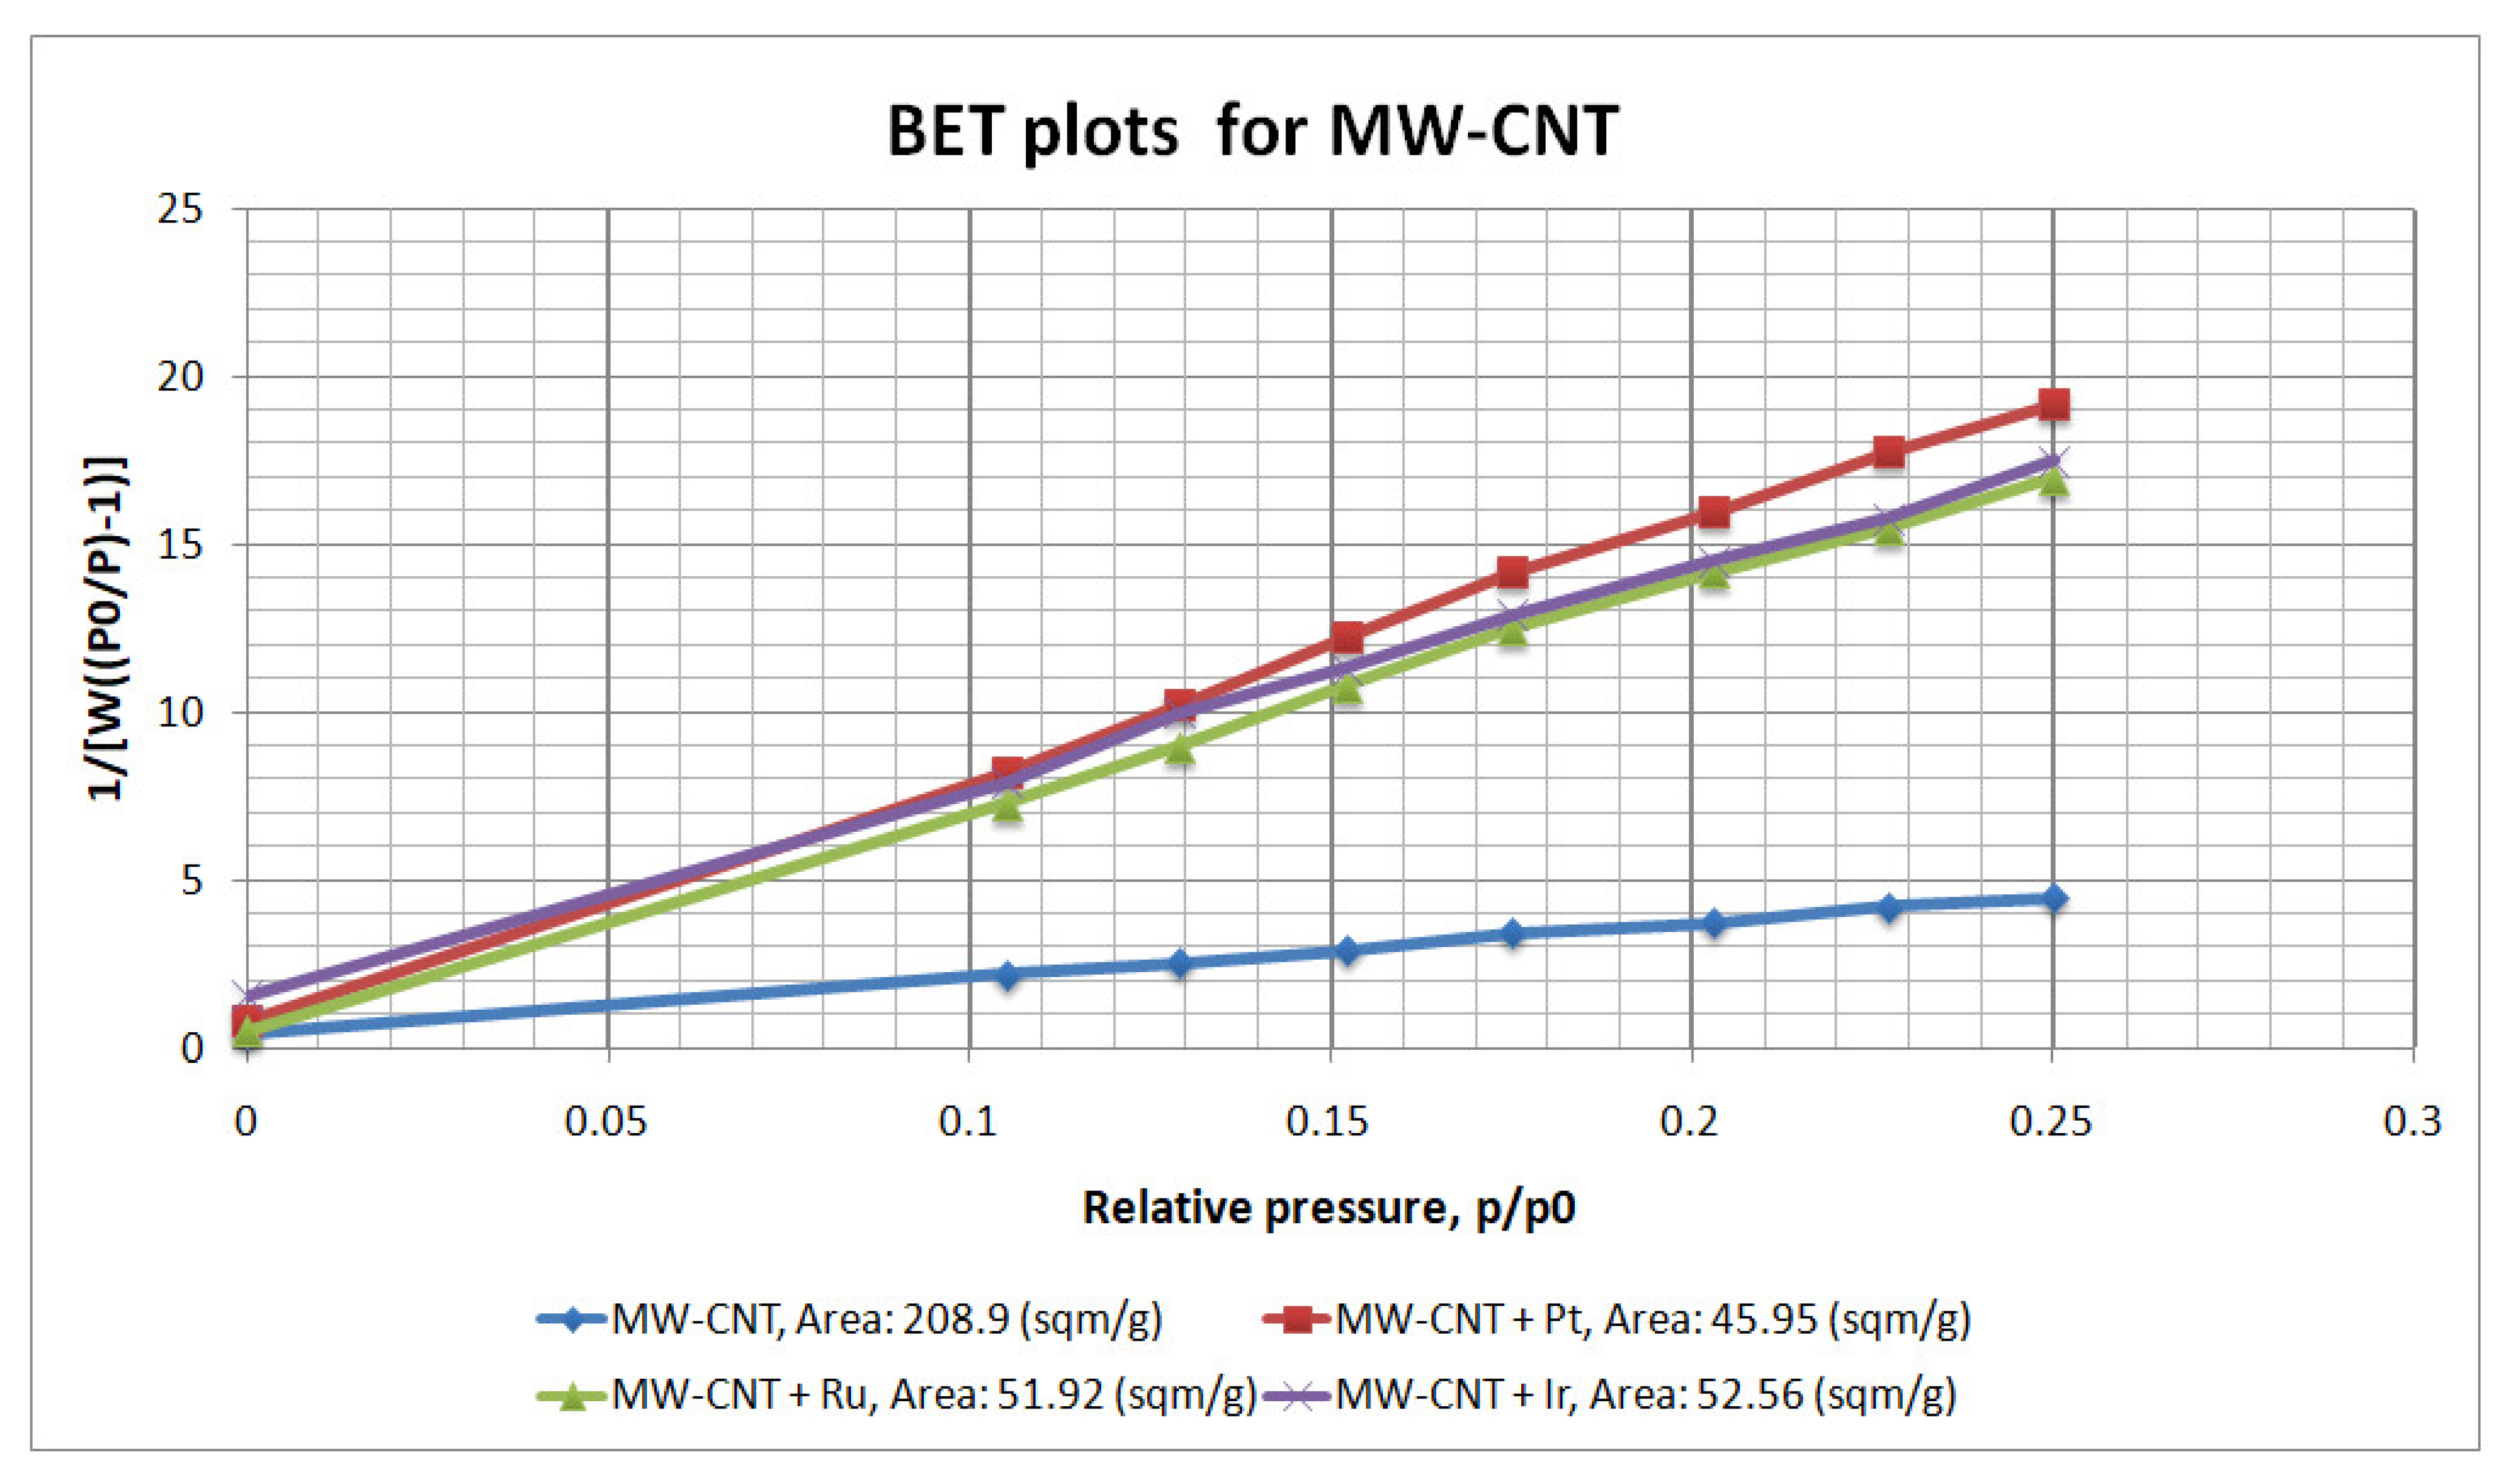
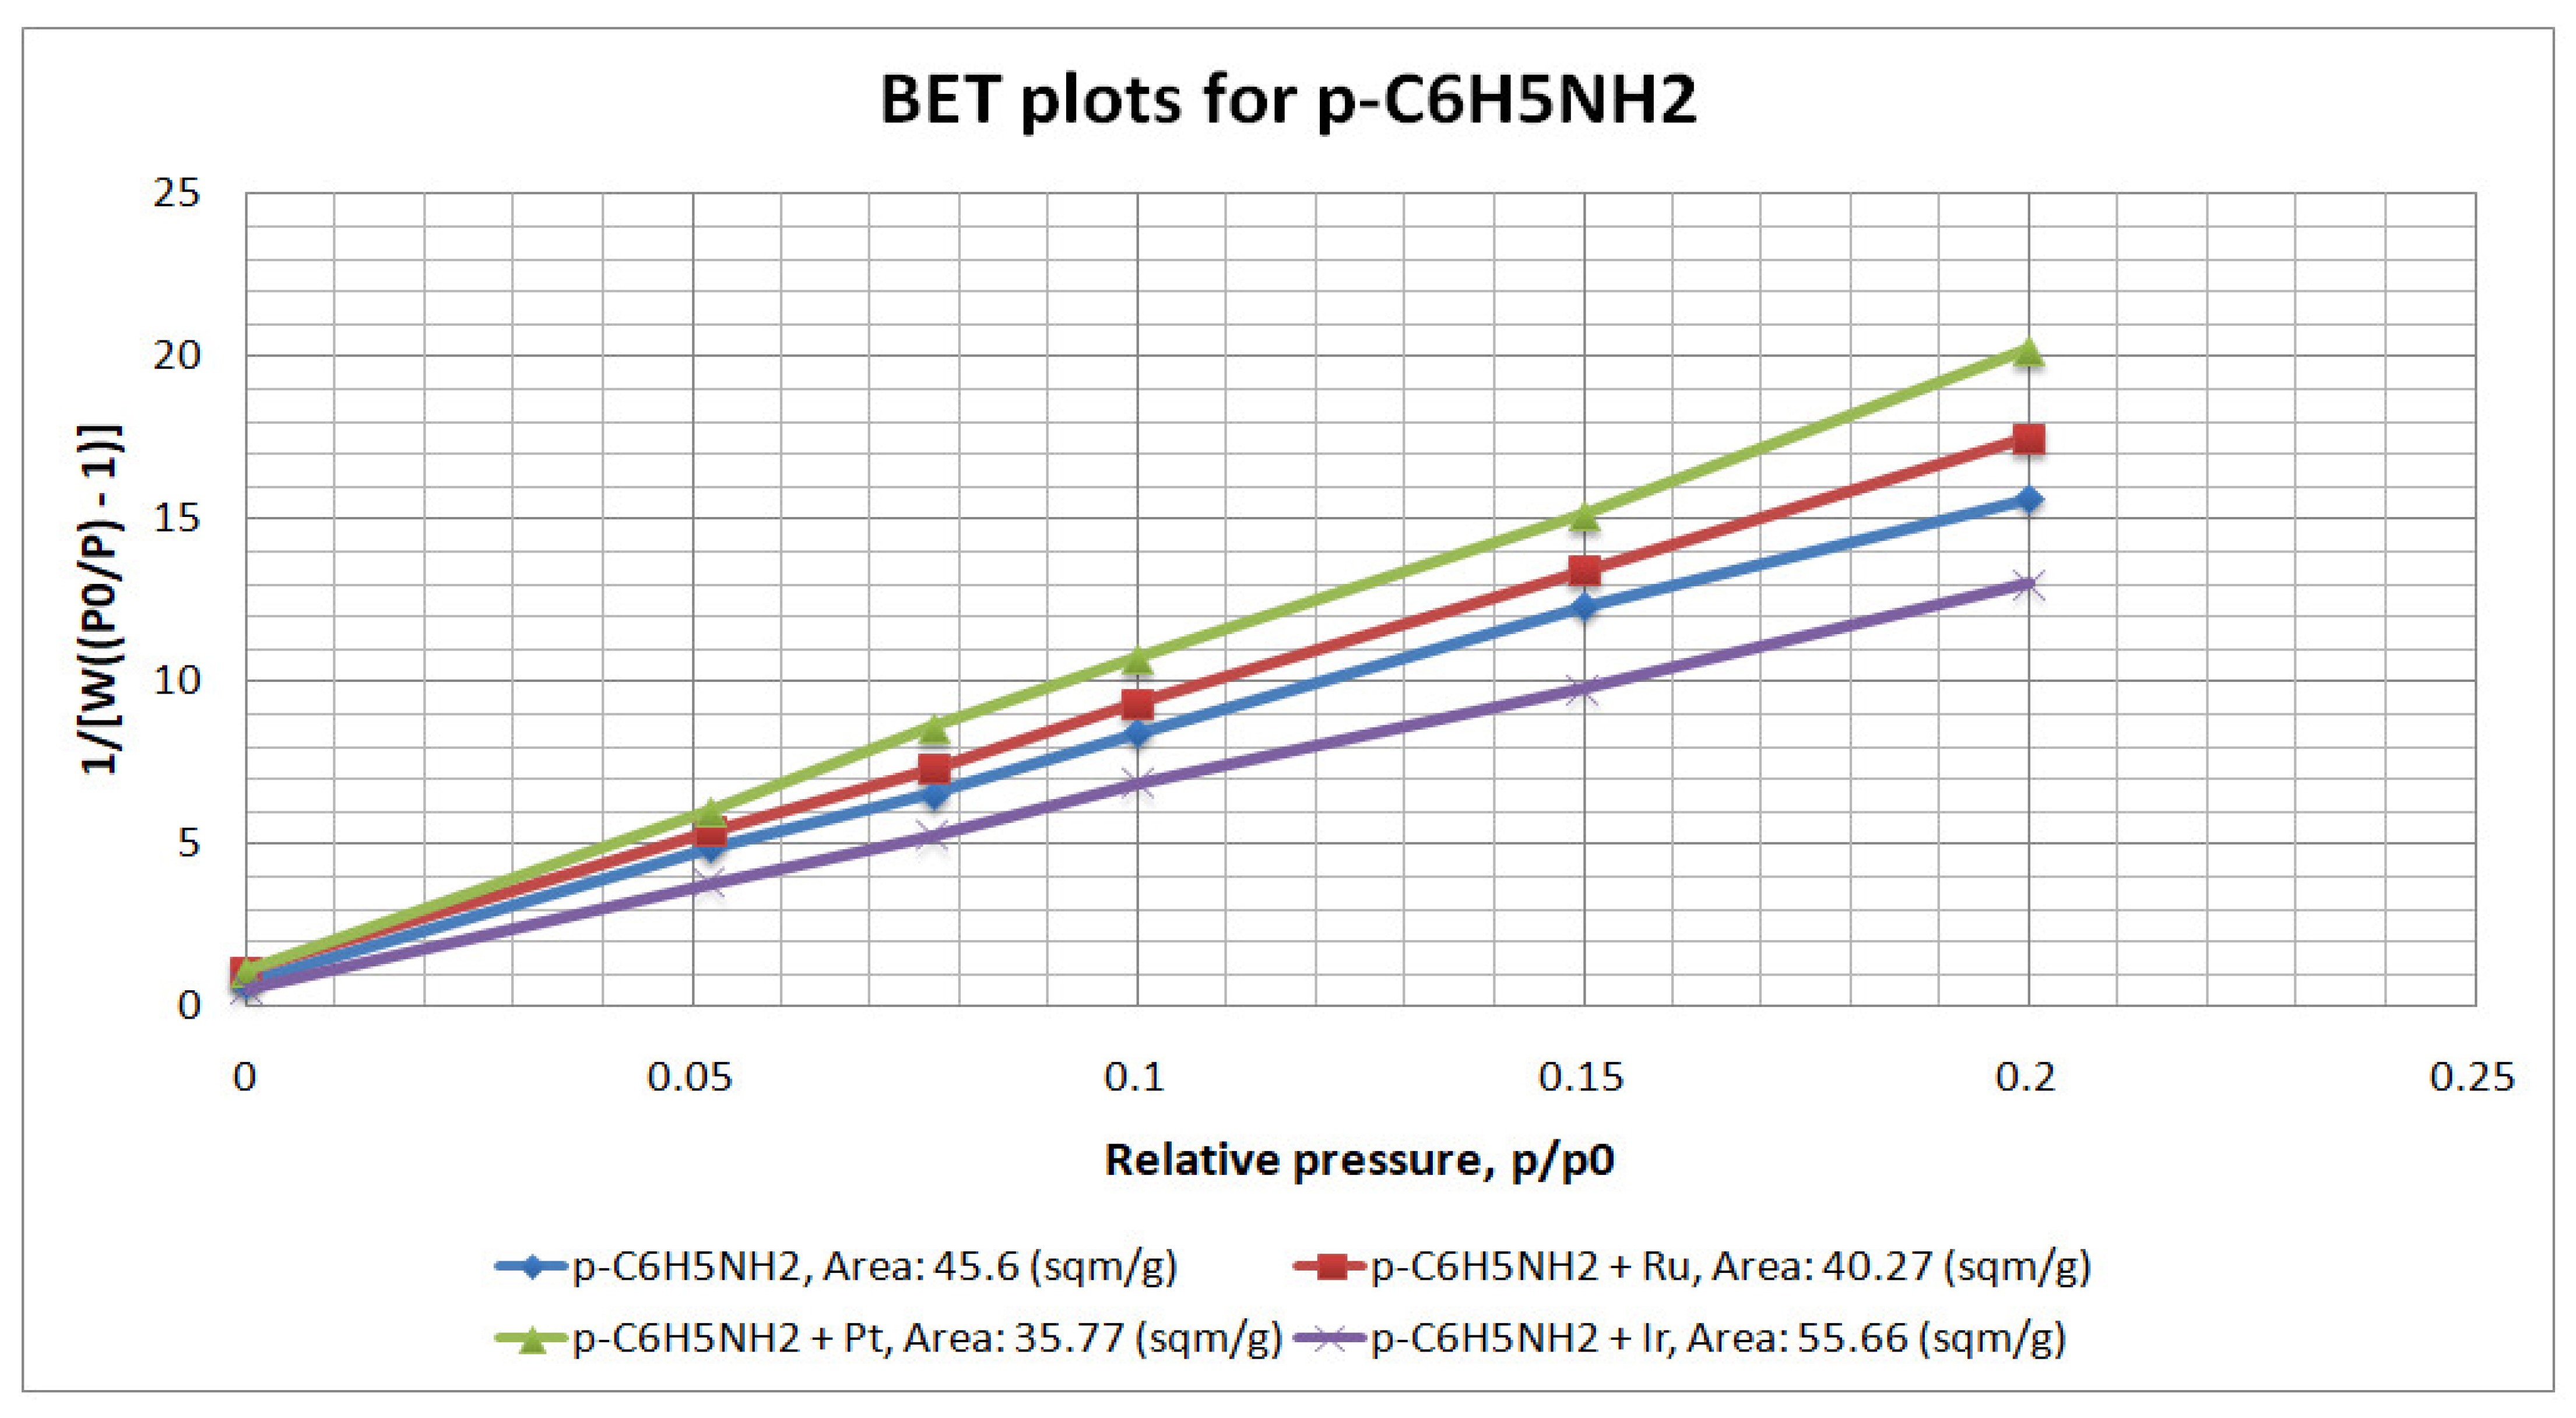
Figure 3 and
Figure 4 show the BET plots for the initial and doped materials (MW-CNTs and p-C
6H
5NH
2). The software Autosorb-1 AS1, used in the above-described equipment, automatically calculated the samples’ surface areas and micropore areas using the multipoint BET method for surface-area calculation and the Langmuir isotherm for the surface area of the micropores calculus.
The obtained numerical values are presented in
Table 1, which also contains the percentages of increase/decrease and the ratios between BET and micropore surfaces.
As can be observed, the BET surfaces of all the materials decreased after doping, except for p-C6H5NH2 + Ir, the surface of which increased by 21%. This increase may be a consequence of a secondary release of gases resulting from the chemical reaction between the substrate (p-C6H5NH2) and IrCl3 during the doping procedure, thus forming the additional porosity.
In addition, a noticeable result was that, even though, initially, the BET surface of the MW-CNT was 4–5 times bigger than that of the p-C6H5NH2 (208.9 vs. 46 m2/g), after the doping procedure, the values became comparable.
The increases in micropore surfaces and also the ratio of micropores to BET surfaces in the cases of Ir and Ru were impressive compared to Pt, but the H2-adsorption capacities of the carbonic materials doped with these metals proved to be lower than those of the Pt-doped ones.
3.3. H2-Adsorption-Capacity Assessment
As stated before, ref. [
2] demonstrated that nanostructured carbonic materials are not suitable for H
2 storage unless their inner structures are drastically modified. So, after doping them with Pt, Ir and Ru and modifying their structures, the adsorption capacity for H
2 storage was measured by the means described in
Section 2.5.
The main aspect to be considered is that the working temperature was kept at 293 ± 5 K, so that only the gas pressure influenced the adsorption capacity. Experiments were carried out at three different pressures: 10, 20 and 30 bar, considered as moderate since a regular LPG tank is able to retain up to 11 bar of gas and, in this particular case, the gas was stored in solid materials, so the danger that usually occurs in the case of regular gas stored at 30 bar was diminished.
The method of measurement consisted of the following steps: ~1 g of material milled to 5 µm was put in the measurement cell at surrounding pressure. An initial gas pressure was set, and the equipment started to feed the testing cell until Δp = set p and the working p was <1 bar. After that, the pressure was kept constant until equilibrium was reached and the gas was stored within the material. The equipment kept feeding the cell with gas until no pressure difference was measured. After that, the pressure was slowly released and the difference between the inserted and released gas volumes was read and transformed into wt.%
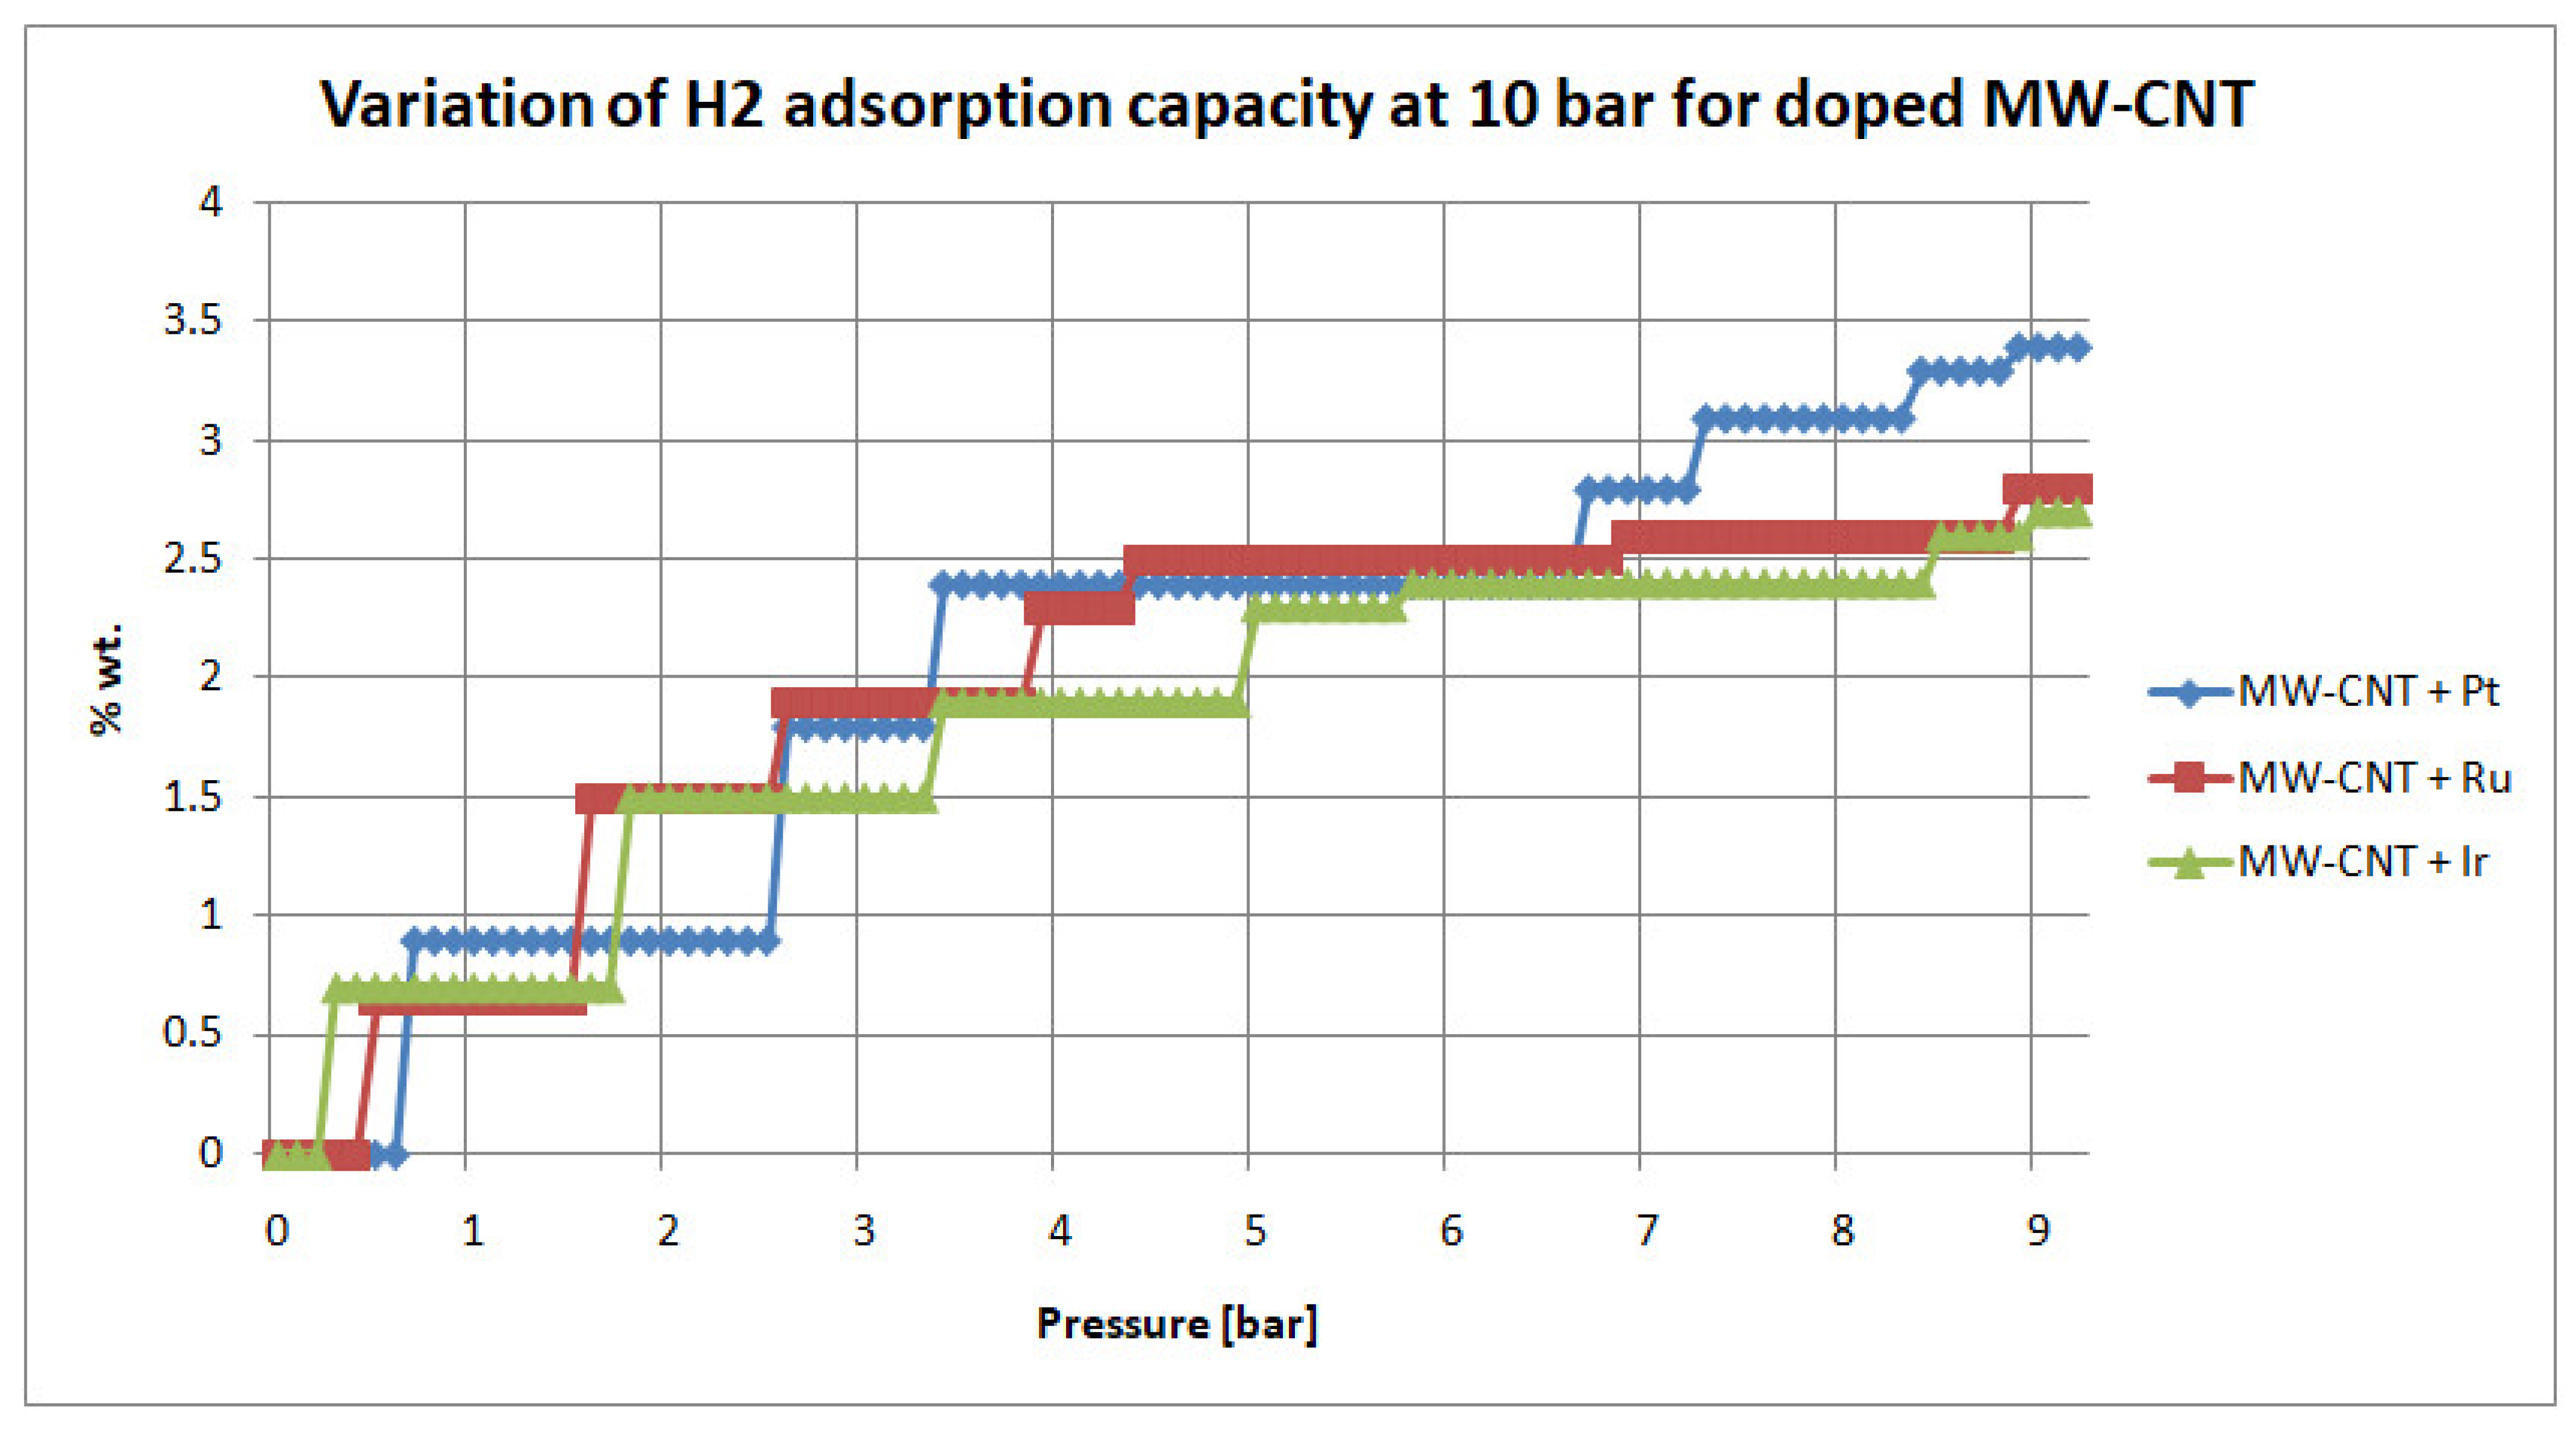
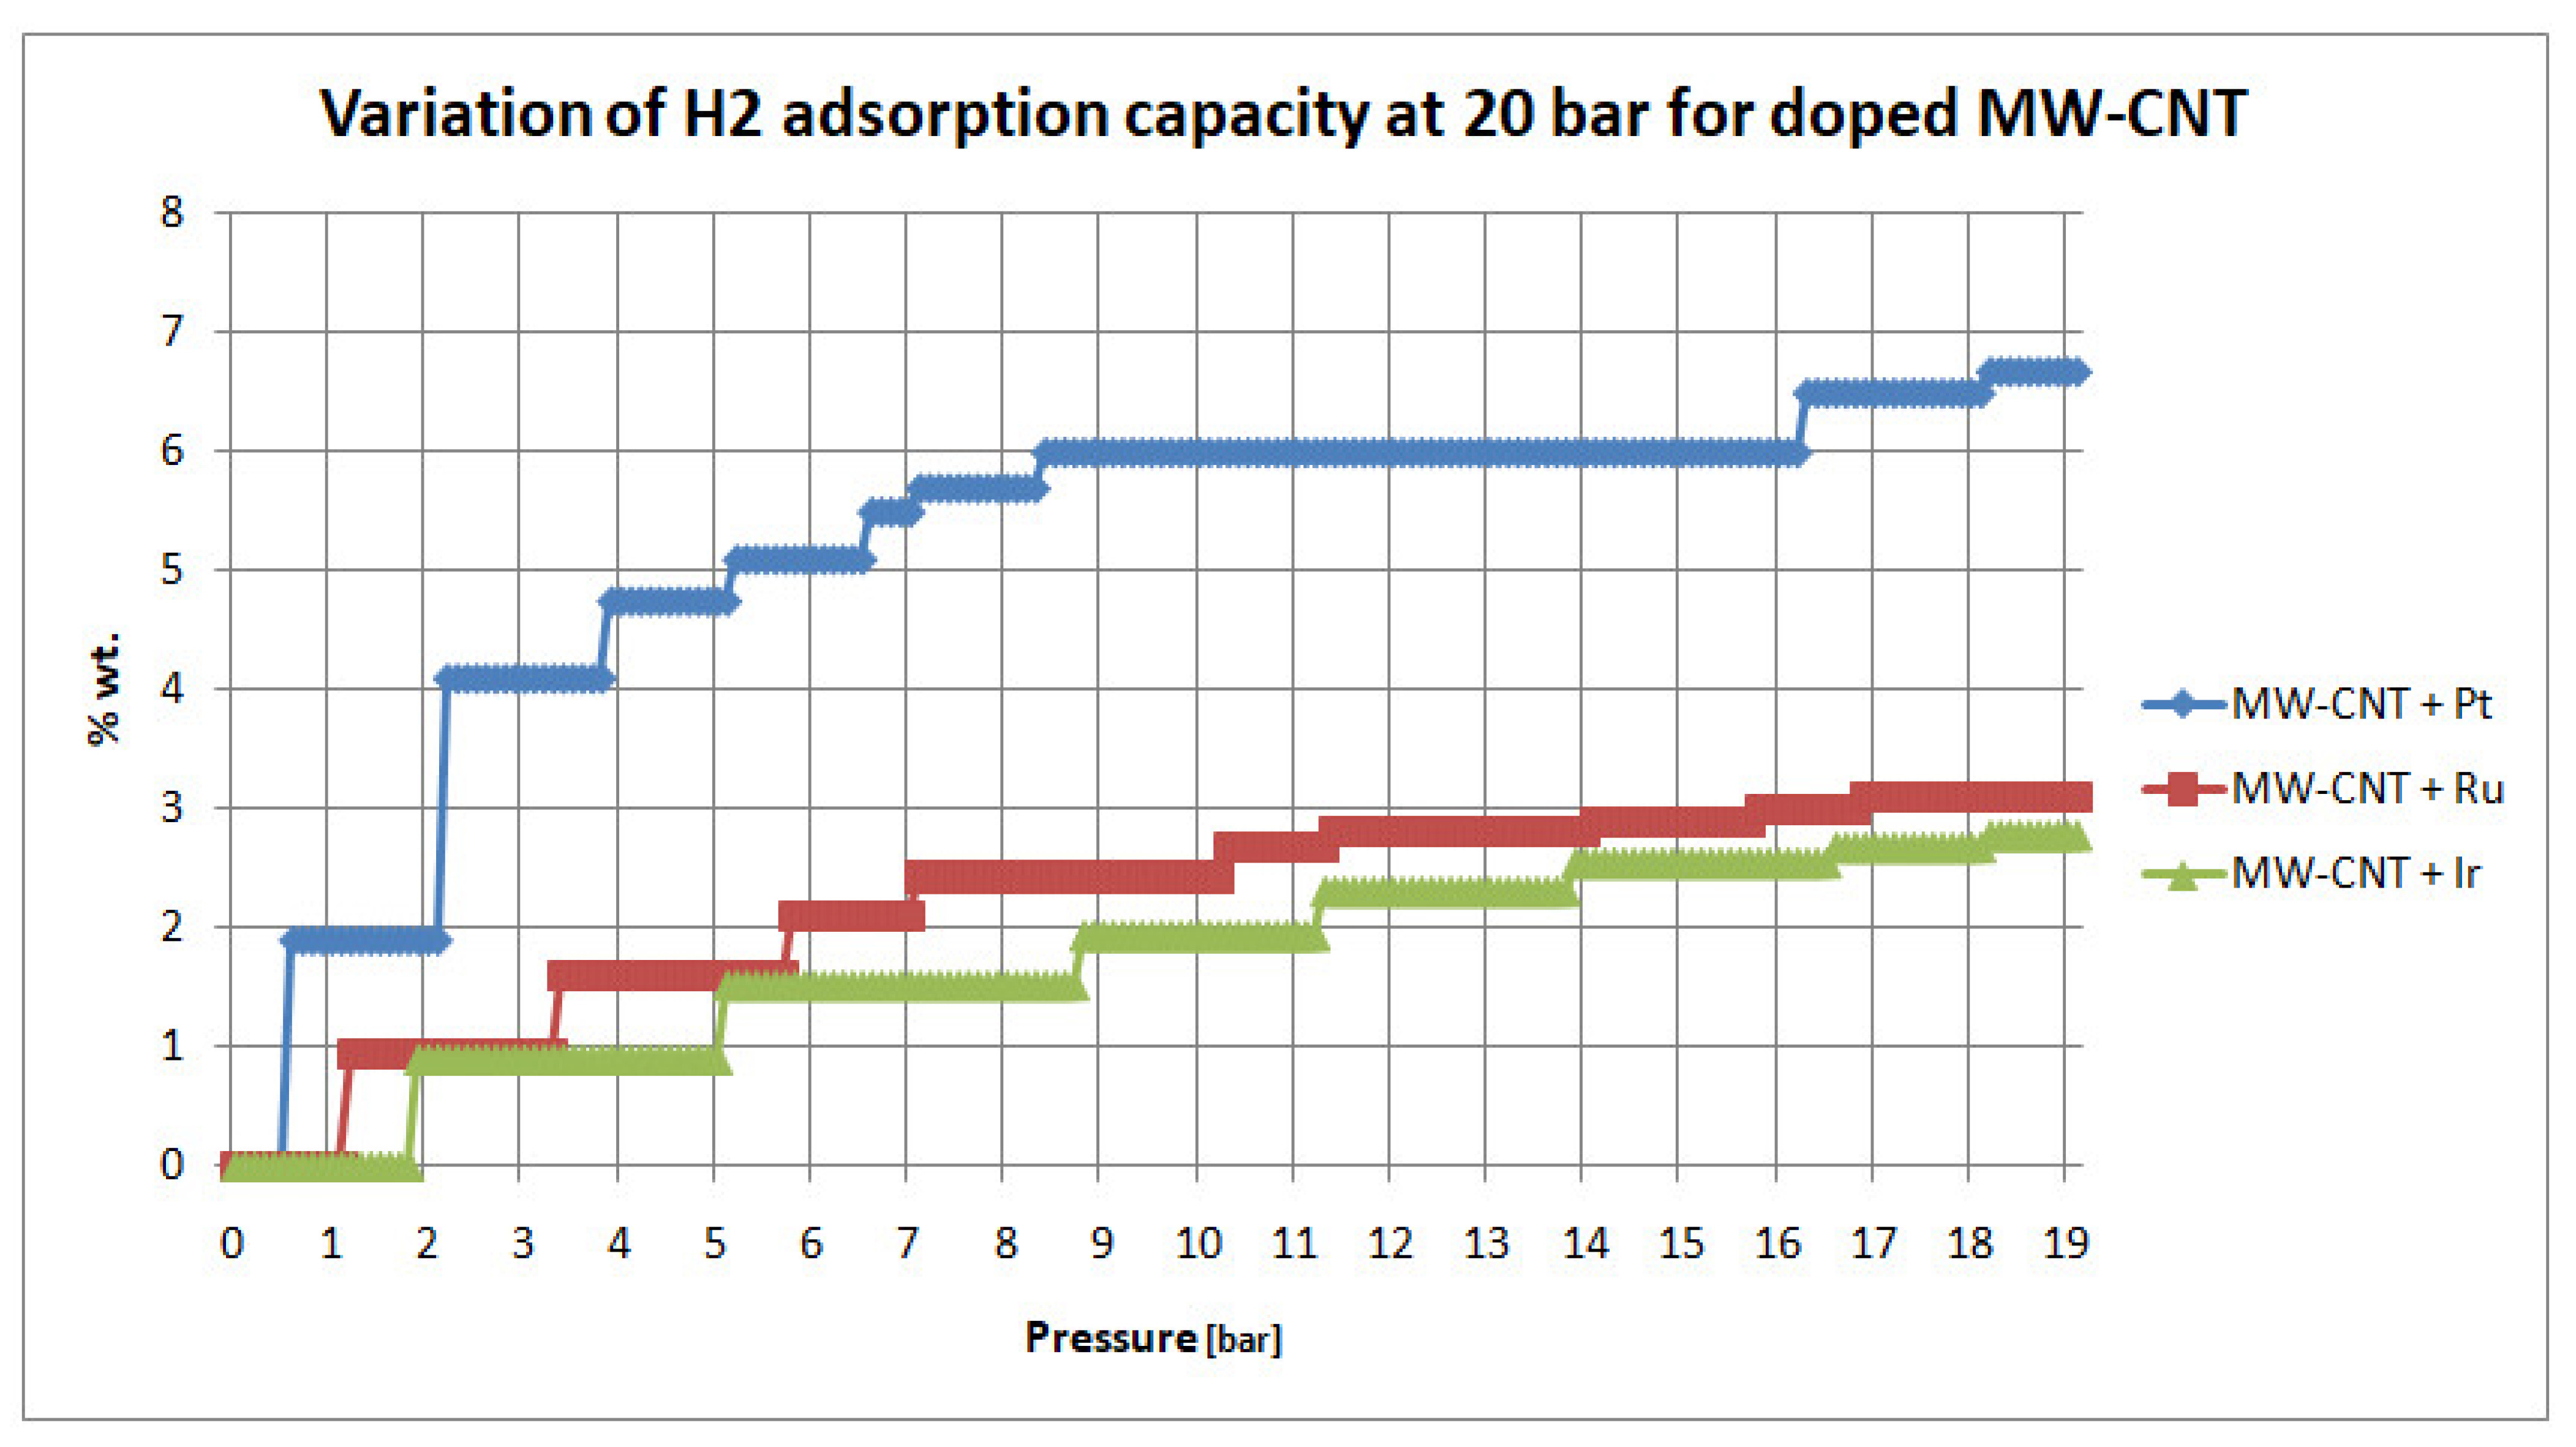
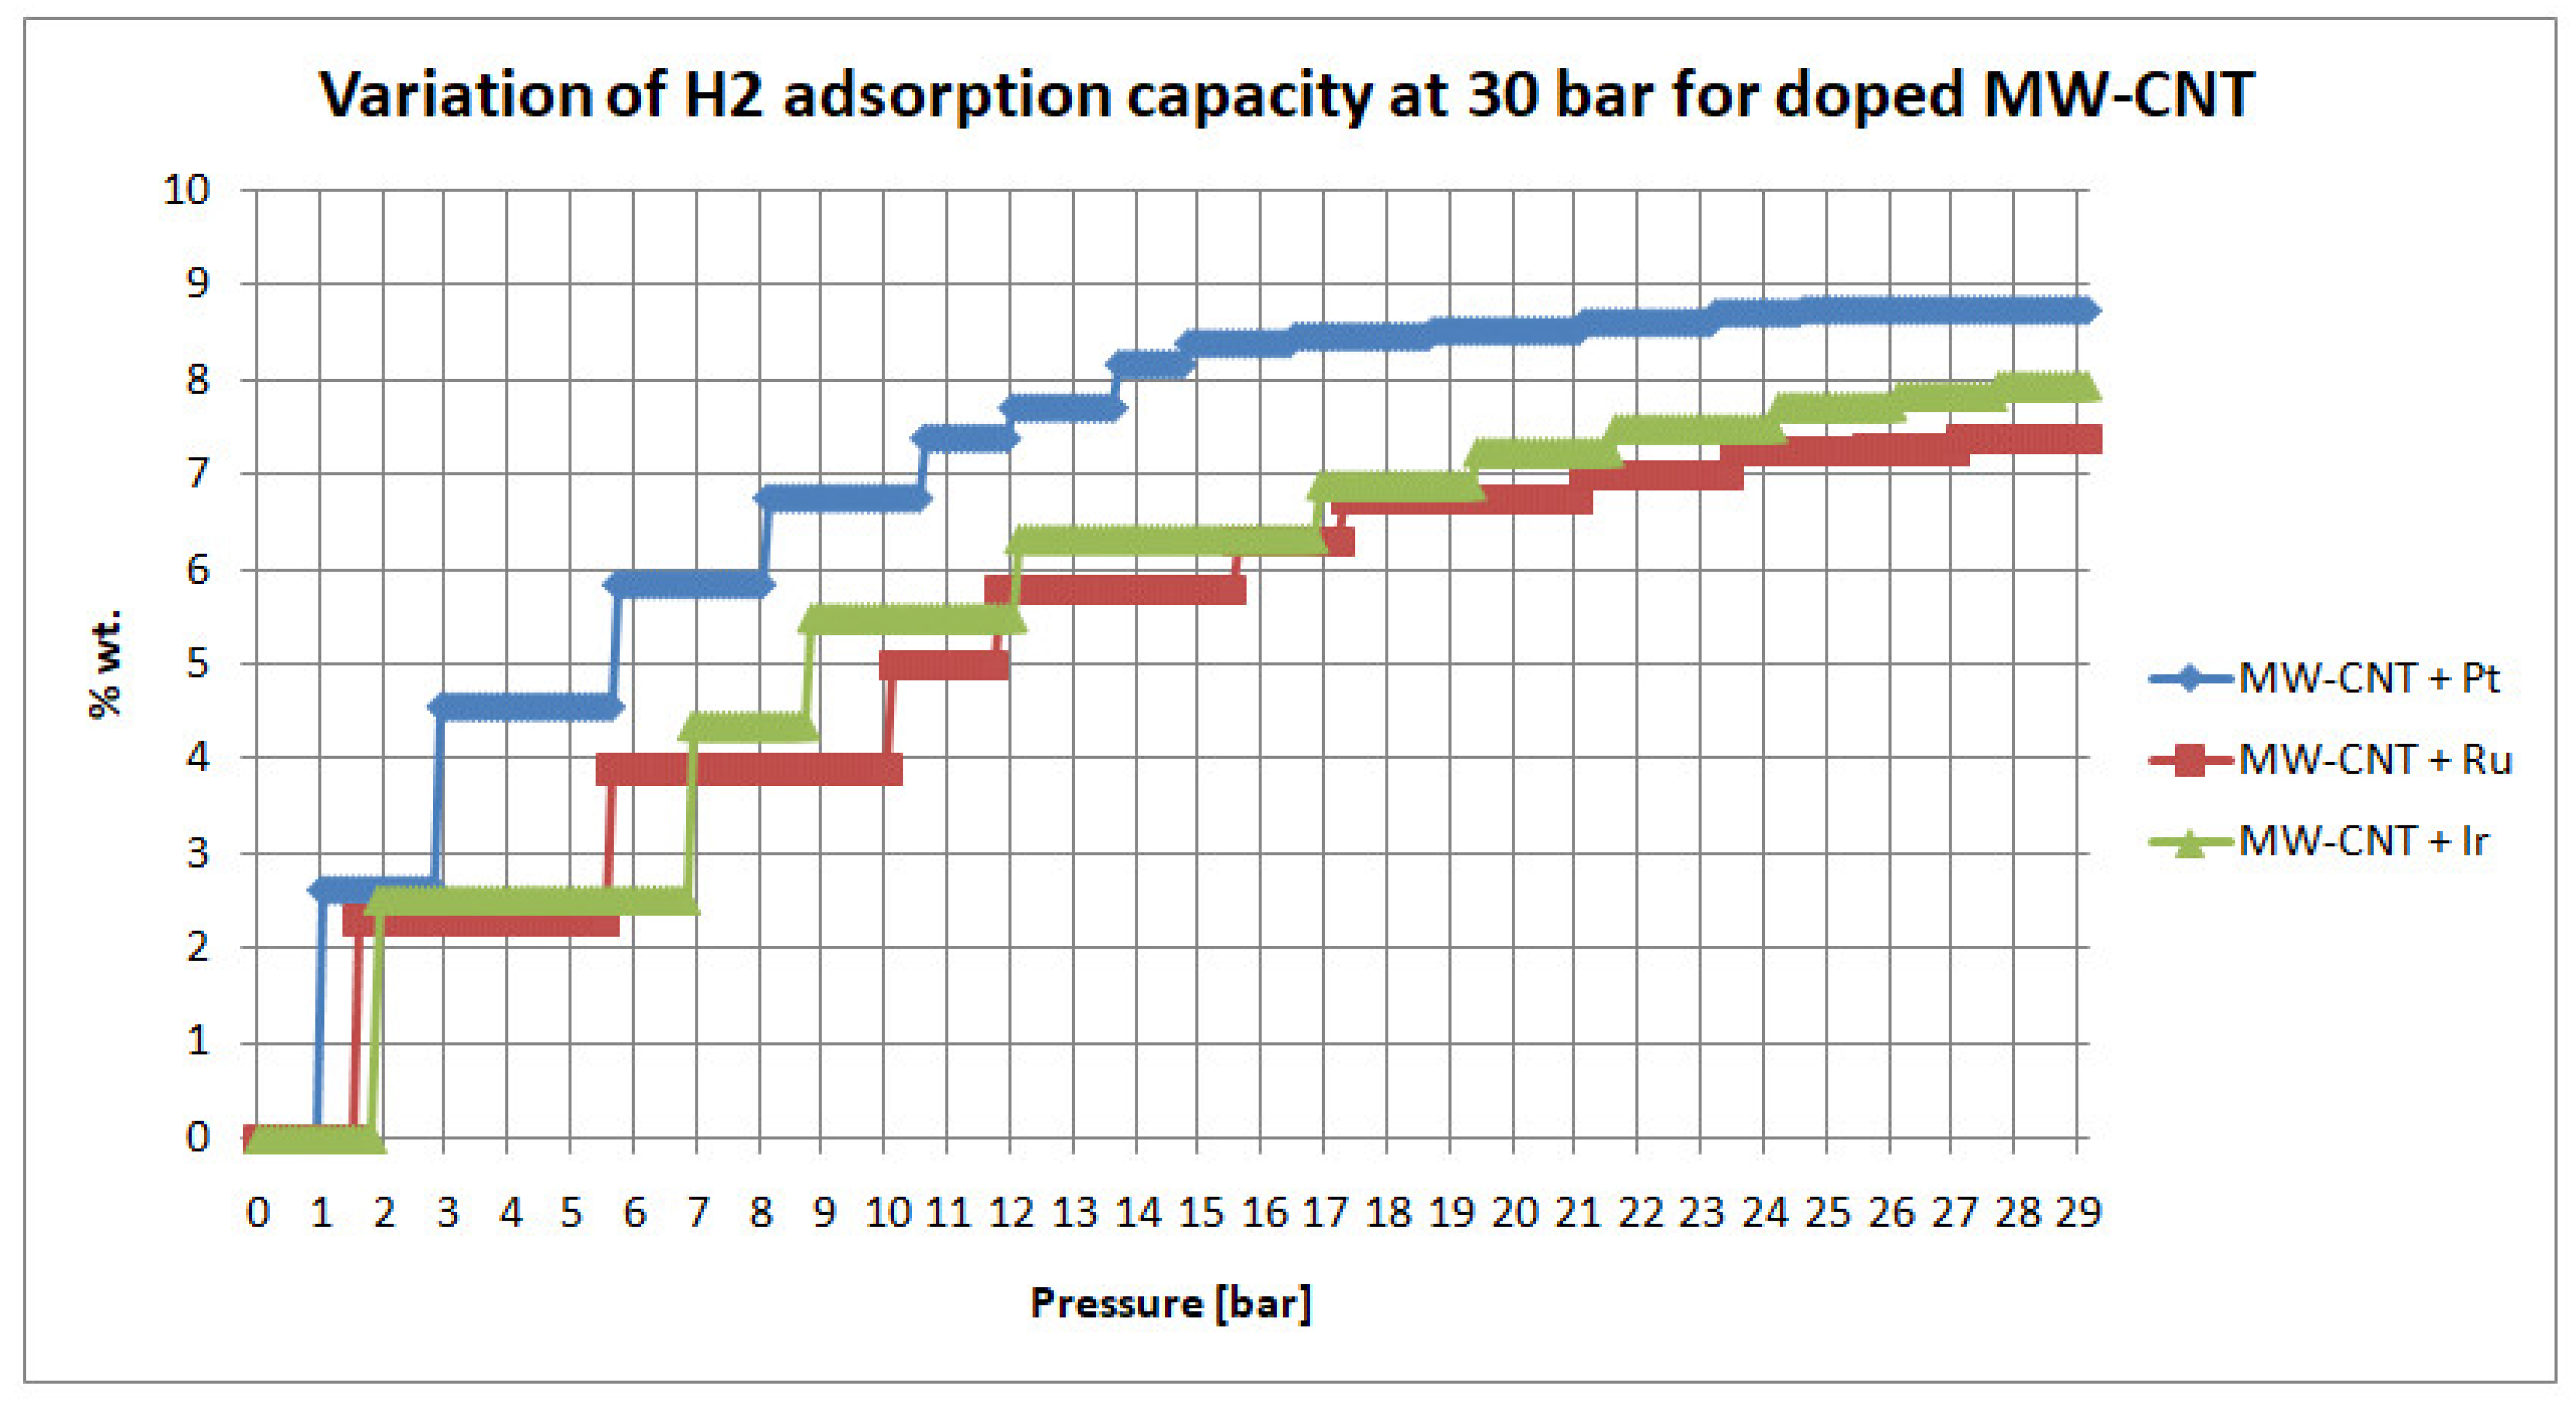
Figure 5,
Figure 6 and
Figure 7 show the variations between the Pt-, Ir- and Ru-doped MW-CNTs at the set pressures (10, 20 and 30 bar).
As expected, H
2 adsorption capacity increased as the set pressure increased. Nevertheless, the results showed an interesting aspect, namely, whatever the pressure, the Pt-doped MW-CNTs had higher H
2-adsorption capacities than the Ir- and Ru-doped MW-CNTs, regardless of the less impressive results obtained for the BET measurements. As stated in
Section 1, the performance of the Pt-doped material is a direct consequence of Pt reactiveness. Increased electronegativity and electron affinity grant superior characteristics in terms of H
2-adsorption capacity.
Thus, in the case of Pt-doped MW-CNTs, at 10 bar, the materials adsorbed 3.4 wt.%, the Ir-doped materials adsorbed 2.71 wt.% and the Ru-doped materials adsorbed 2.73 wt.%. At 20 bar, the tendencies were the same: the Pt-doped materials adsorbed 6.68 wt.%, the Ir-doped materials adsorbed 2.78 wt.% and the Ru-doped materials adsorbed 4.97 wt.%.At 30 bar, the Pt-doped materials adsorbed 8.73 wt.%, the Ir-doped materials adsorbed 7.95 wt.% and the Ru-doped materials adsorbed 7.38 wt.%.
In the case of the metal doping of the MW-CNTs, the Ru-doped materials seemed to break through, since, at all measured pressures, their performance was similar to that of the Pt-doped materials, but, in term of prices, Ru is almost eight times cheaper than Pt.
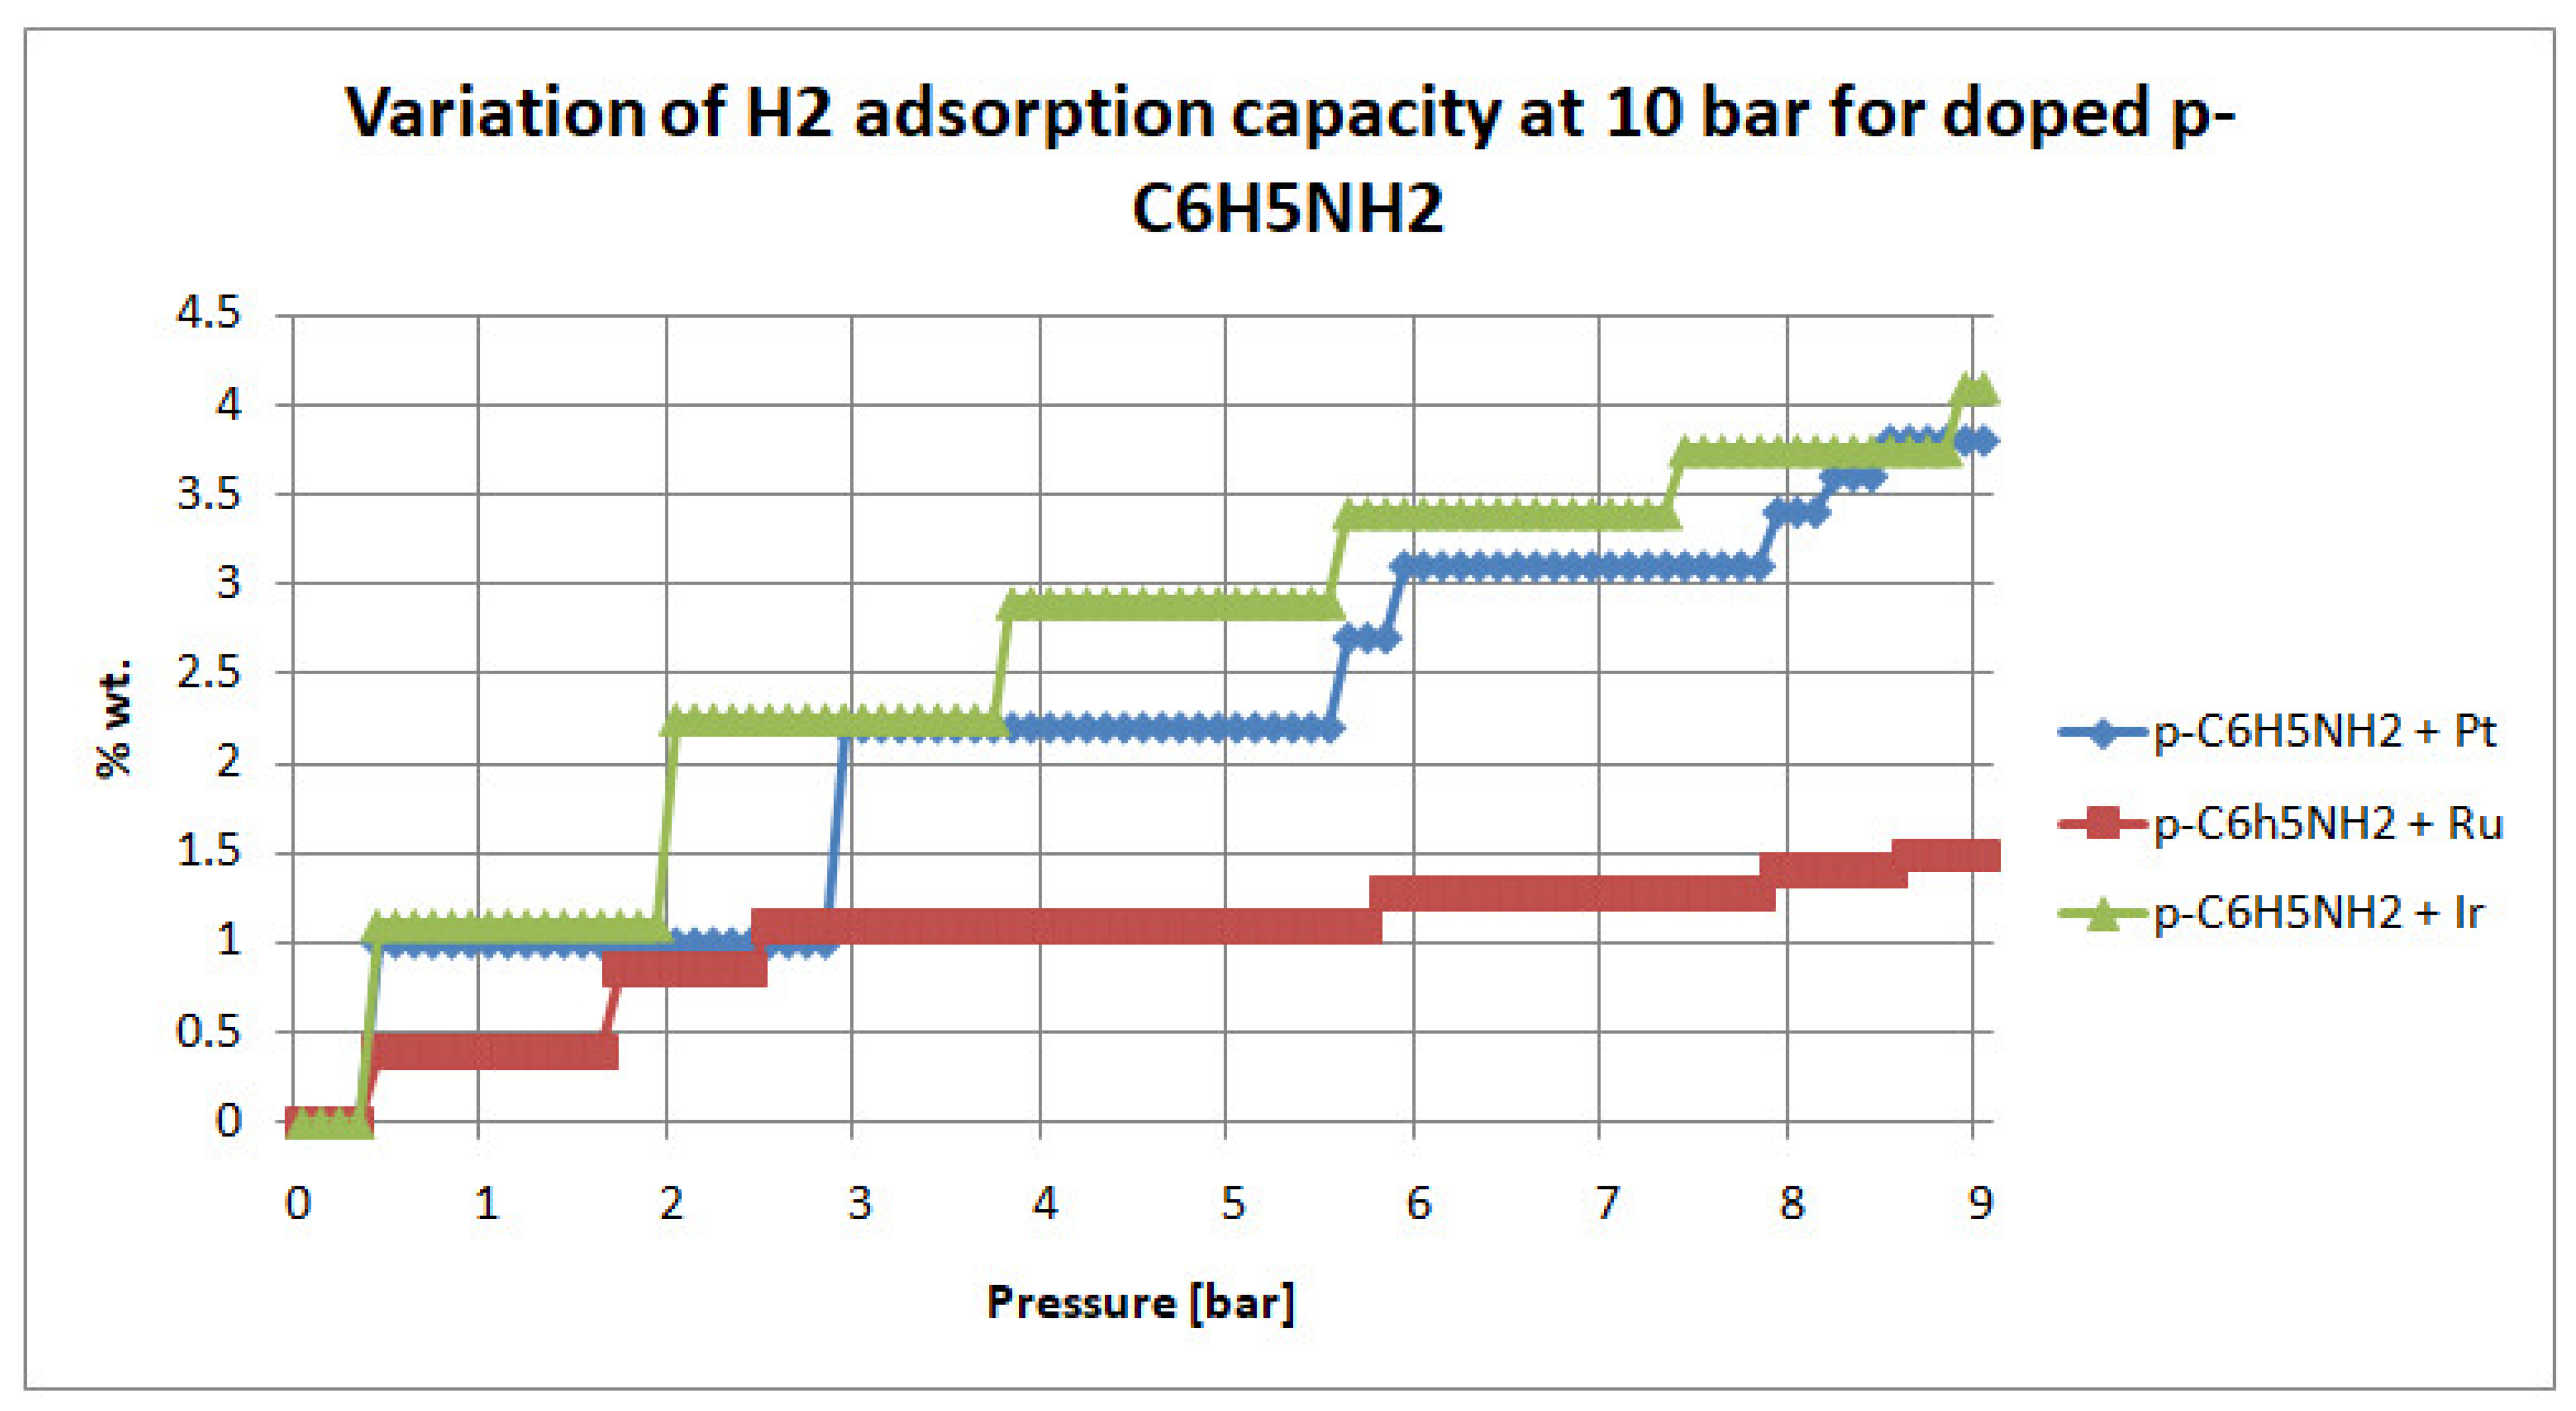
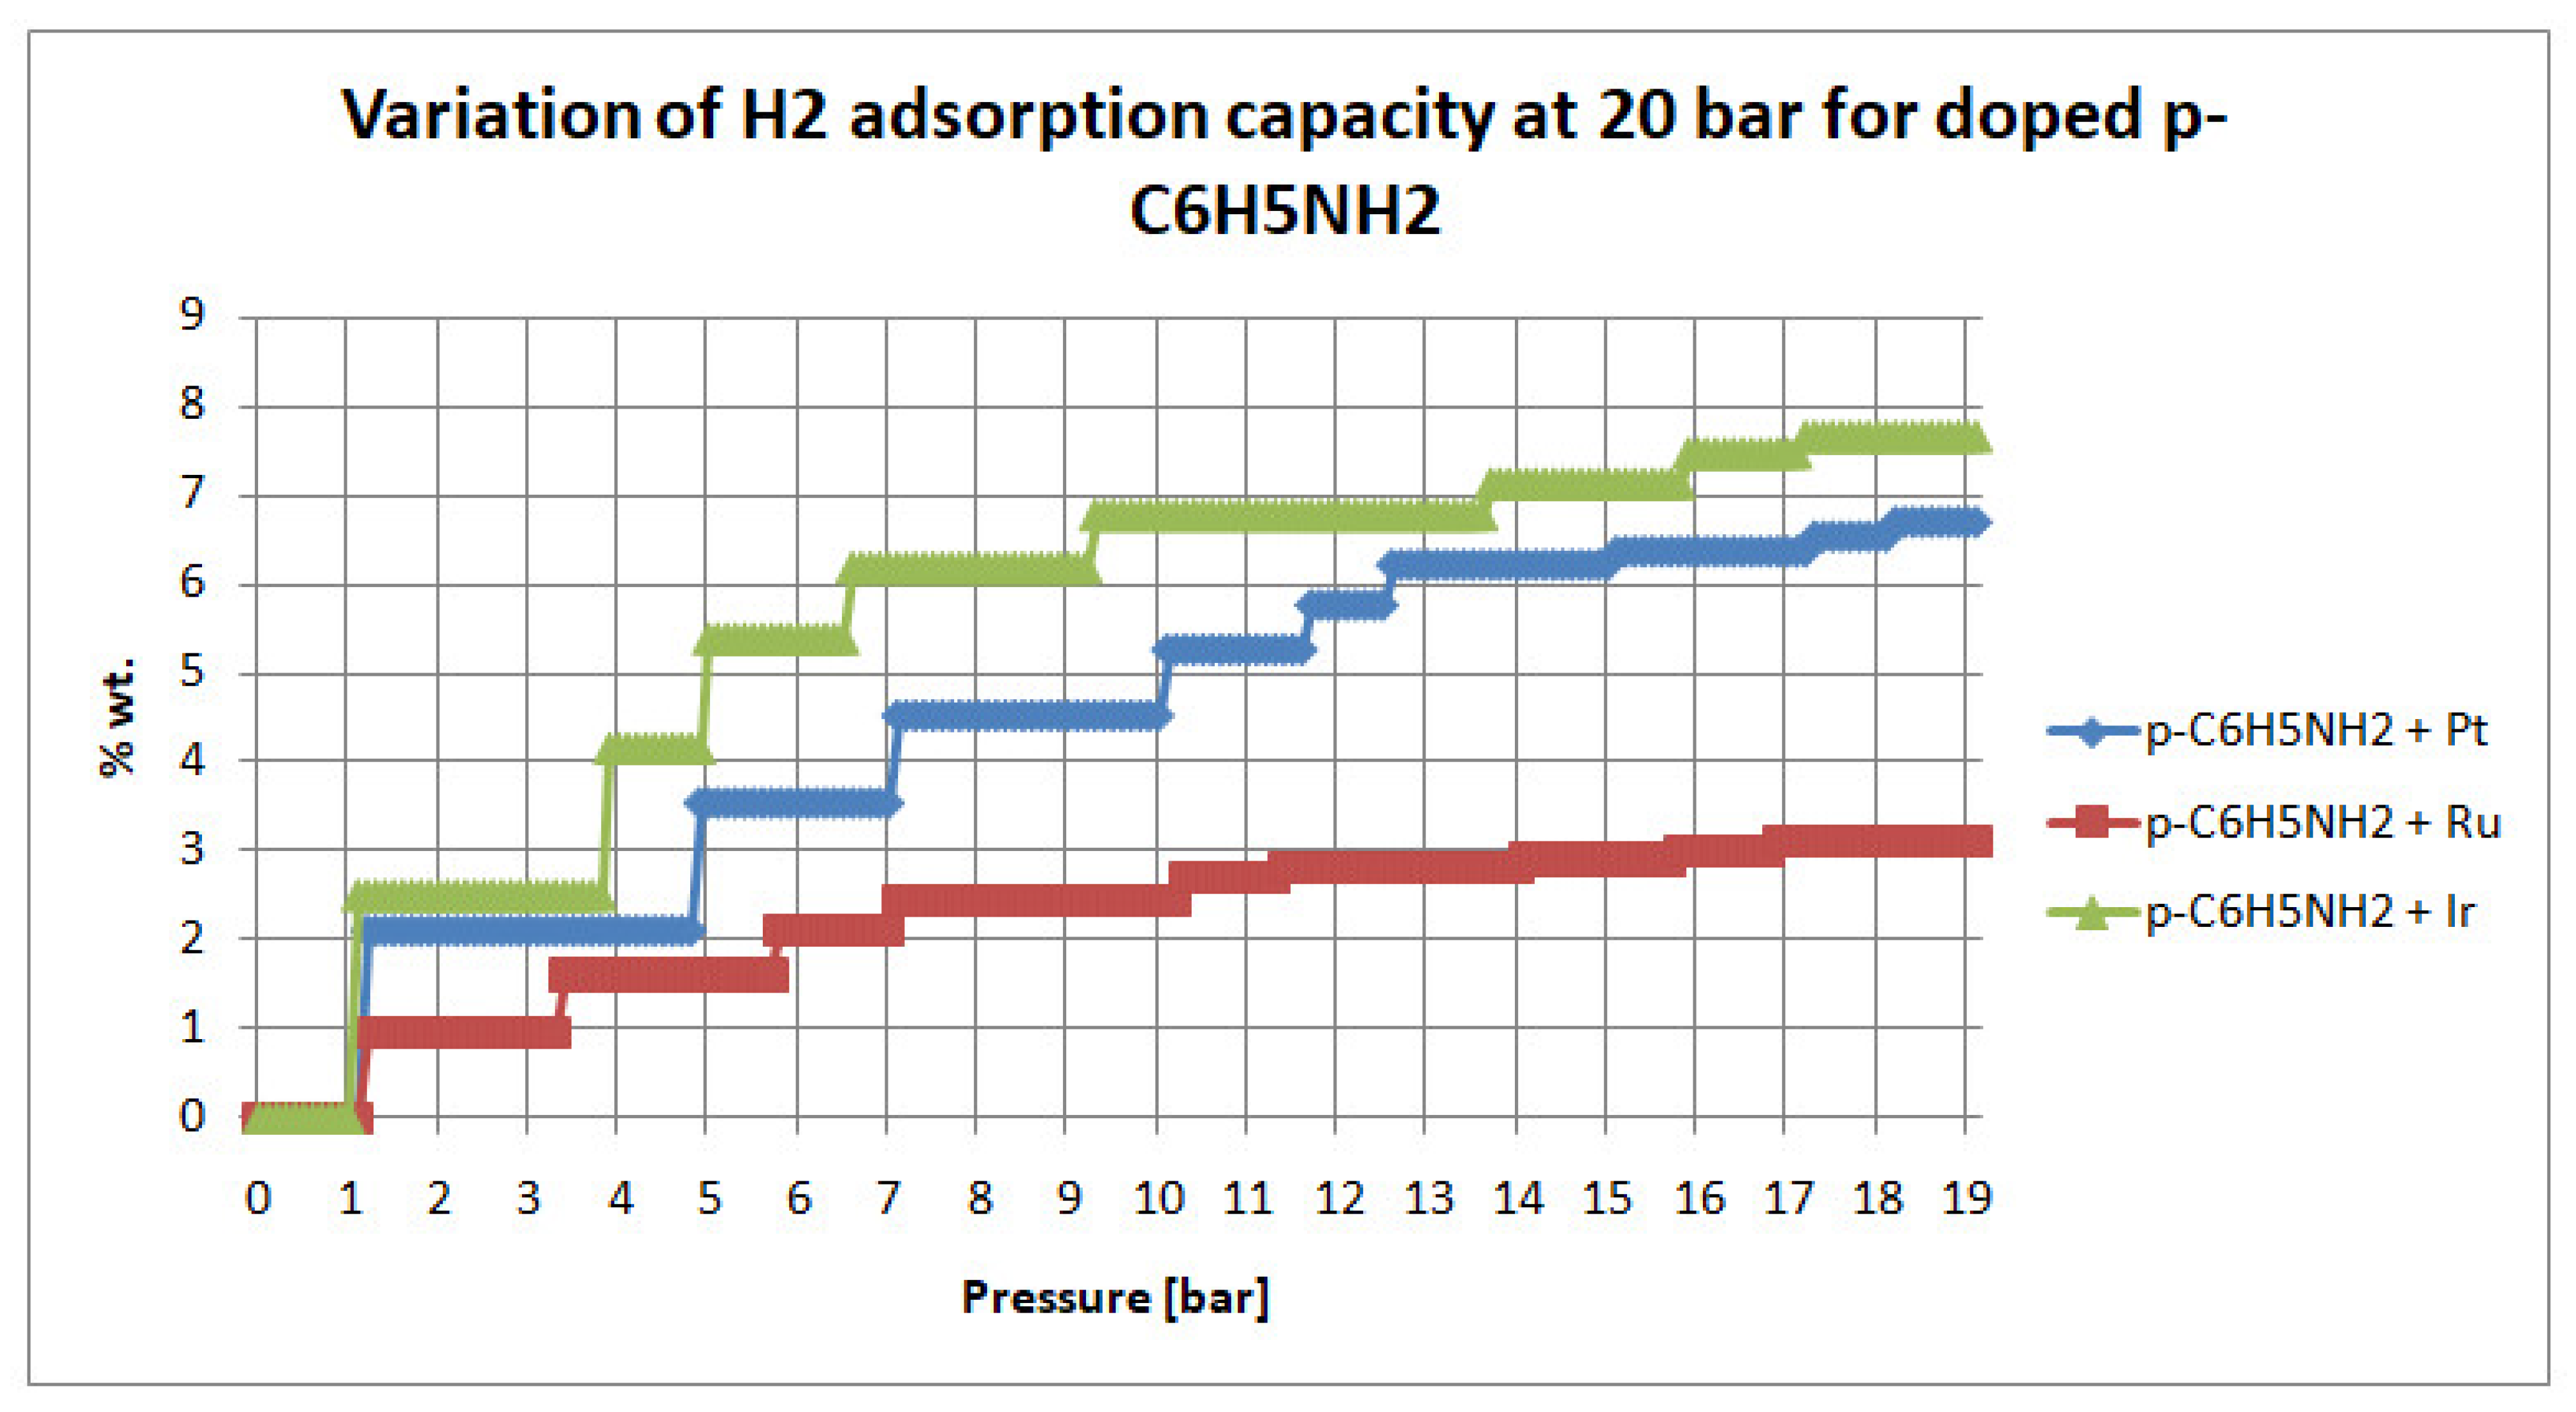
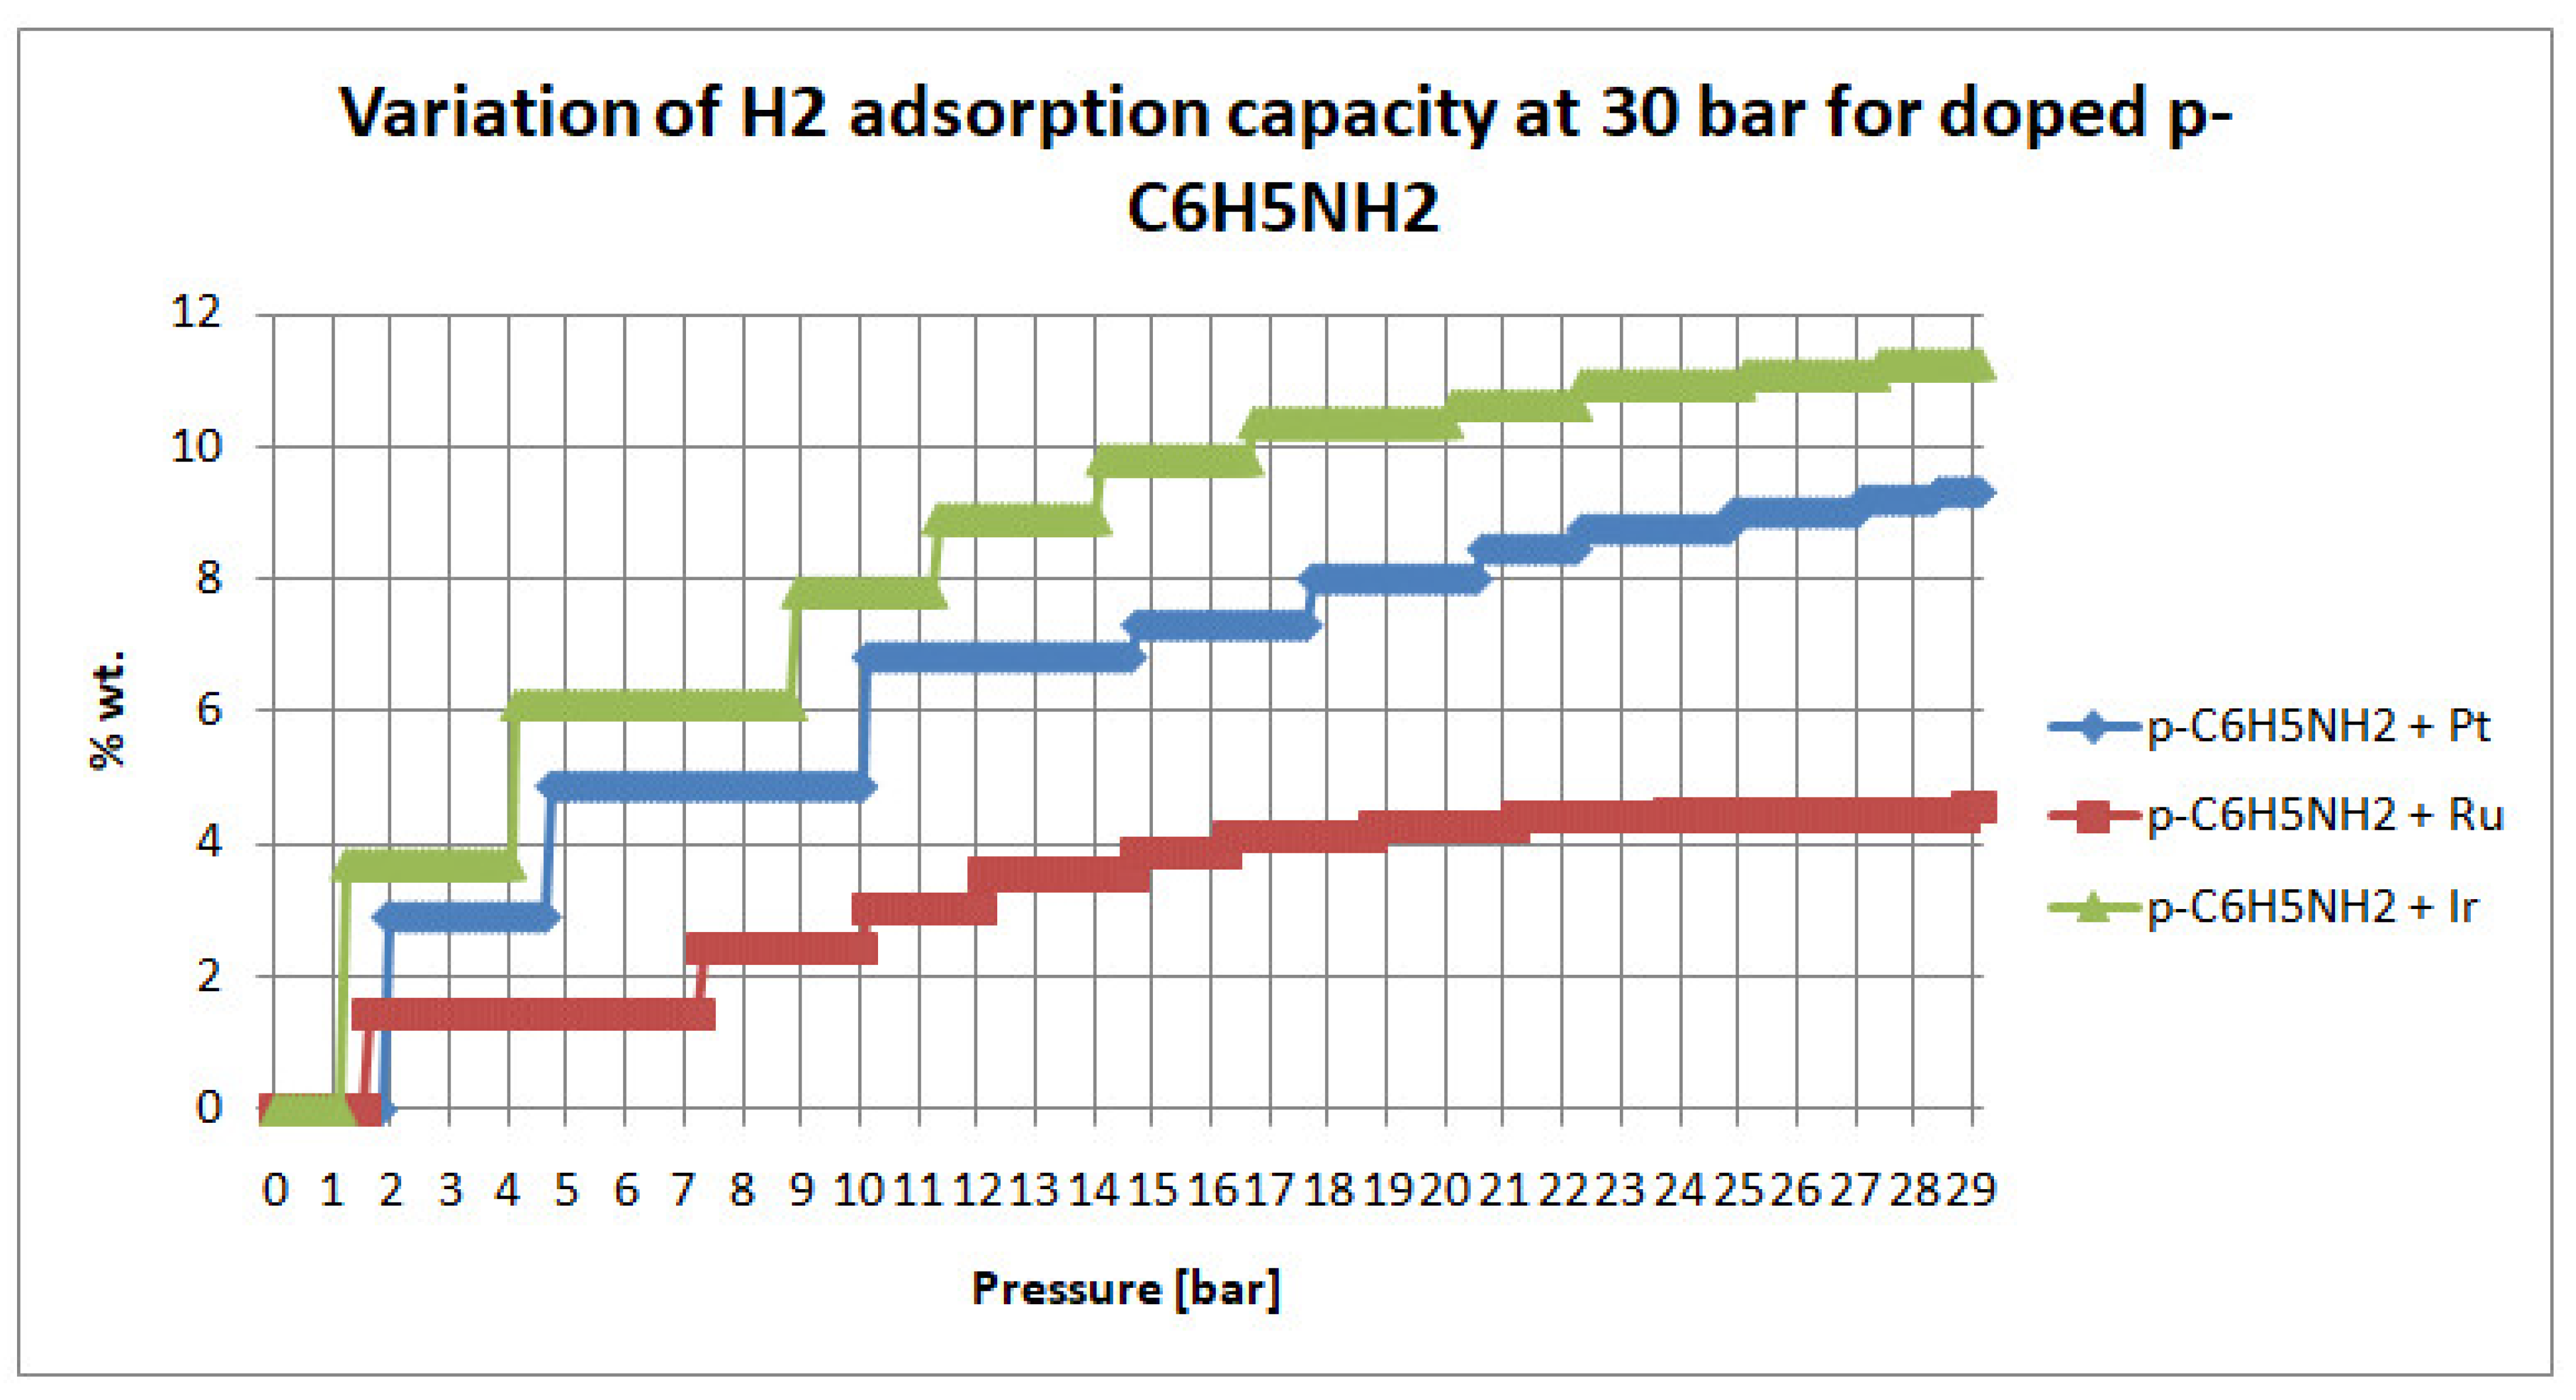
Broadly speaking, the overall tendency observed in the case of p-C6H5NH2 was similar to that observed for the MW-CNTs, but the obtained values were lower. This shows that carbon nanotubes are better for H2 adsorption than polyaniline, mainly due to their tubular structure and quasi-regulate shape, which allows, on the one hand, large BET and micropore surfaces and, on the other hand, a better anchorage for the metals within their structures.
Thus, in the case of Pt-doped p-C6H5NH2, at 10 bar, the material adsorbed 3.73 wt.%, the Ir-doped material adsorbed 4.1 wt.% and the Ru-doped material adsorbed 1.53 wt.% At 20 bar, the tendencies were maintained: the Pt-doped material adsorbed 6.68 wt.%, the Ir-doped material adsorbed 7.65 wt.% and the Ru-doped material adsorbed 3.1 wt.%. At 30 bar, the Pt-doped material adsorbed 9.31 wt.%, the Ir-doped material adsorbed 11.24 wt.% and the Ru-doped material adsorbed 4.53 wt.%. In the case of the p-C6H5NH2 substrate, Ir showed the best results, since it allowed higher adsorption capacities to be reached even at low pressures (e.g., 4.1 wt.% at 10 bar).
The shapes of the adsorption curves were due to the method used by the equipment when measuring adsorption capacity at a given pressure. Thus, the materials were put in a tightly closed recipient and pressurized hydrogen was fed in. The temperature was 293 ± 5 K, so that only the pressure influenced the adsorption capacities of the tested materials. The pressure was kept constant until equilibrium was reached. Then, a further increase in the pressure was initiated by the equipment, and so on, until the final pressure and equilibrium were reached. It is widely known that for gas molecules to “travel” within substrate materials they need some time. This is exactly what the equipment ensured: it fed gas at a set pressure, then waited until equilibrium was reached.
Table 2 shows the results obtained in this study compared with the ones reported in the literature.
Table 2 clearly shows that the presented research achieved some promising results with the working parameters of a temperature of 293 K and a pressure of 30 bar.
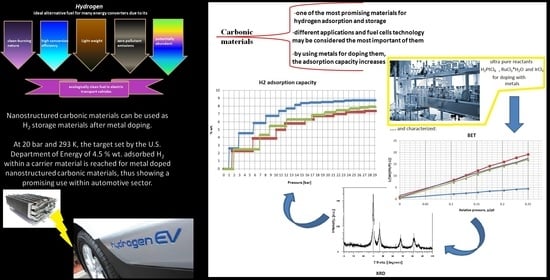
4. Conclusions
Nanostructured carbonic materials can be used as H2-storage materials after metal doping and structural modification. Thus, reactive metals, such as Pt, Ir and Ru, may allow the use of carbonic nanostructured materials for adsorption of up to 11 wt.% at room temperature and 30 bar.
Even though Pt is known as a catalyst in chemical reactions involving hydrogen and is the most reactive of all the metals used in this study, Ru seems to be a better choice when considering the financial aspect, allowing performances close to Pt in the case of the MW-CNT substrate, while Ir seems to be the better choice in the case of p-C6H5NH2 as a substrate.
The H2-adsorption capacities of all the materials increased as the pressure increased, and in terms of substrate performance, they each have their own advantages. Thus, MW-CNTs showed superior characteristics due to their tubular structure and quasi-regulate shape when doped with Ru. The main influencing factor may be considered to have been the substrate’s sp3 hybridization for the MW-CNTs vs. the sp2 hybridization for p-C6H5NH2, which allowed an easier transfer of H2 to the substrate, even though the doping metal was the same. In the case of p-C6H5NH2 doped with Ir, the adsorption capacity increased mainly due to the increase in the BET and micropore surfaces after doping.
Micropores play an essential role in carbon nanostructured materials due to the attractive potential of the pore walls.
It has been established that, at 20 bar and room temperature, the target set by the US Department of Energy of 4.5 wt.% H
2 adsorption within a carrier material [
7] was reached with the metal-doped nanostructured carbonic materials, thus showing promise for application within the automotive sector.
Polyaniline’s initial BET surface may not have been as impressive as that of the MW-CNTs but, after the doping procedure, the values became comparable.


