1. Introduction
Transit-Oriented Development (TOD) has become a much-discussed concept in recent decades. Different scholars have defined this notion in somewhat differing ways, but the majority agree that TOD focuses on the development of residential, commercial, and entertainment activities around existing and newly-developed transit nodes, such as metro stations and bus stops [
1,
2,
3,
4,
5] TOD is defined as a comparatively high-density urban development that has a variety of land uses, supported by a walkable and bike-friendly urban fabric [
6]. It should allow people a free choice of transit mode, rather than limiting them to the use of private vehicles. From this standpoint, TOD is an approach to sustainable development which is centered on the efficient integration of land use and public transport (PT) [
7].
The successful implementation of TOD results in a resilient urban fabric that can withstand the rapid changes in a city so typical of life in the 21st century. One notable example is the situation in the State of Qatar, a small Arabian Gulf country that is hosting the World Cup in 2022. Preparation for this mega-event has required massive urban development and transformation; by one measure, Qatar has seen a 285% increase in urban and infrastructure development as a result [
8]. This includes the construction of the Doha Metro, the core of a new transit system whose first phase opened in 2019. Integrating this system into the existing urban fabric has necessitated new regulations, though at each step of the ongoing expansion, it cannot be known exactly how the urban fabric will evolve and how the system can most efficiently be operated as its ridership increases. As with all vibrant complex systems, these developments are therefore something of a “work in progress.” Therefore, the present research study attempts to answer the question of how various key aspects of TOD—such as those related to urban, transport, and socio-economic issues—interact among and affect one another.
This research study contributes to the existing body of knowledge in two main ways. First, it provides an analysis of TOD from a systematic perspective in order to specify the key parameters of cause-and-effect relations. Second, it provides specific information about the case of Qatar which should also be generalizable to other countries facing similar challenges. Even setting aside the challenges specific to its hosting of the World Cup, the State of Qatar faces serious challenges as a result of rapid urbanization, a situation familiar to people in many other countries as well. As part of its efforts to manage these developments, the Qatari government has instituted a master plan, Qatar National Vision 2030 (QNV 2030), which among other things recognizes the need to adopt an approach in harmony with TOD principles. For example, it is recognized that there must be constraints on urban development such that land uses are well planned and urban sprawl is minimized. TOD aims to support mixed-use development which promotes healthy community activities and decreases traffic congestion. Although these are desirable goals in any case, the upcoming 2022 World Cup has served as a catalyst in motivating the implementation of TOD in Qatar. Addressing the needs of this international mega-event in such a way will at the same time benefit long-term residents, such as through the establishment of an efficient PT network.
2. Literature Review
TOD focuses on the implementation of increased transportation choices, reducing congestion and poor air quality while promoting pedestrian and cycling paths as community-friendly zones [
9]. The TOD approach places an emphasis on achieving a sustainable transport system, while offering freedom to work, shop, live, and relax conveniently, creating a critical pathway for community development.
Such development facilitates better linkage among streets and popular destinations, favoring integrated, direct routes and frequent services which enhance residents’ mobility. Furthermore, it encourages increased usage of PT, which can support businesses located near areas well trafficked by prospective customers, thus boosting profits. The TOD approach leads to increased public satisfaction with public areas, through means such as enhanced and secure walkable paths as well as landscaping, lighting, parks, additional trees, and enticing architectural features [
10]. Such features help a walkable city to improve its livable aspects by offering environmental benefits and enabling tourists and residents to gain a sense of place in the city [
11]. As noted by Jackson [
12], a sense of place should be considered central in the process of urban development, as it enhances livability in a given area together with its atmosphere and the perceived quality of its environment. This allows identification of a specific neighborhood as a function of its features, which provides an indefinable sense of well-being, one key aspect of sustainability. Properly implemented, TOD provides a sense of place while connecting a given location to the characteristics and social assets of a group; thus any resultant sentiment connecting the physical and social conditions of a place with members of the general populace tends to be noticed and appreciated [
13]. Furthermore, Hummon [
13] indicates that when such sentiment is developed, it tends to ground itself in a group’s reaction to the highlights of an environment. In this case, the group’s implicit acknowledgment of the end goal creates a sense of satisfaction of the human needs ascribed in a particular area to a social dimension.
As discussed in a number of case studies [
14,
15,
16,
17], TOD aims primarily at a transport mode shift, across different scales, from the use of private vehicles to that of PT. The authors of those case studies evaluate and discuss the success and failure of TODs in a variety of regions and urban areas. The discussions in these studies tend to be qualitative, with less emphasis on quantitative assessments. In contrast, the present study provides a quantitative analysis of TOD as currently implemented in Qatar. Quantitative analyses should help to establish performance thresholds through which different locations can be evaluated with respect to consistent metrics, enabling relatively objective comparisons to be made, and with the ultimate aim of improving performance where needed. Other researchers [
18,
19,
20] have tried to propose a number of indicators for the quantitative evaluation of TOD plans, but as yet these have not been used systematically.
In related work, Evans and Pratt [
21] used a limited relation between particular variables to evaluate the extent to which a given area functions as a TOD, but did not investigate how those variables might affect one another. To mitigate this problem, Evans and Pratt propose a conceptual System Dynamics (SD) model that investigates the causality relations between TOD variables, in compliance with the TOD index proposed by Singh et al. [
2]. That index quantifies key TOD characteristics and attempts to integrate these into a composite measure called the TOD Index. When calculated and/or simulated dynamically over different points in time, the TOD index can help gauge whether an area is moving toward or away from aspirational threshold values. In this way, SD analysis can serve as a very useful tool for planning a TOD and evaluating its performance.
The TOD approach favors the provision of a variety of transportation choices, such that congestion and poor air quality are reduced while pedestrian and cyclist accessibility within community-friendly zones are enhanced [
9]. The overarching objective is to achieve a sustainable transport system while maintaining convenient access to workplaces, houses, retail shops, and recreational facilities.
In an efficient transport system, streets are properly integrated with places with the provision of direct routes and frequent services that support users’ mobility. Furthermore, such a system encourages PT usage, which in turn results in increased profits and rates of business operation near heavily trafficked areas [
22]. TOD takes advantage of the existing urban environment in a way which yields increased public satisfaction; enhanced and secure walkable paths; pleasant landscaping, lighting, and green areas; and attractive architectural features [
10].
In addition, successful TOD results in environmental benefits while enabling the creation of walkable and livable cities, enabling tourists and residents to gain a sense of place [
11,
23]. As Jackson [
12] clarifies, a sense of place is crucial in the development process, supporting livability by enhancing the atmosphere and the quality of environment in a particular location. This is because a sense of place establishes identity of a specific neighborhood through the function of its unique features; this provides a sense of comfort and well-being [
12]. This sense of place can also be connected with the characteristics and social assets of a particular group of people. Hummon [
13] notes that such a connection between a group of people and a given location can create a sense of satisfaction and a resultant social benefit.
Numerous researchers have discussed how TOD planning strategies can be implemented in neighborhoods surrounding specific transport hubs. However, improvements in this kind of planning and development can still benefit from further studies on TOD. To this end, a number of authors have conducted studies discussing the development and/or implementation of such methods [
19,
24,
25,
26,
27,
28,
29,
30]. Such research has yielded numerous models and methods aimed at the development of smart transit systems, but there are some general principles that they have in common. These are summarized in
Table 1, and include PT efficiency, land use diversity and density, accessibility, connectivity, and sensitivity to property values.
In Qatar, the need to adopt a strategy for urban planning development is increasingly recognized. If successfully implemented, such planning can help solve major problems such as those related to uncontrolled urban growth, while improving livability through enhancements such as the improved PT system. As noted earlier, the adaptation of TOD principles in Qatar is supported strongly in QNV 2030, which was established to assure sustainable growth and land-use planning efficiency, and to limit uncontrolled sprawl and traffic congestion. As Qatar prepares to host the 2022 World Cup, efficient urban and infrastructural development, particularly in the establishment of a robust PT network, is all the more important [
31,
32,
33,
34,
35].
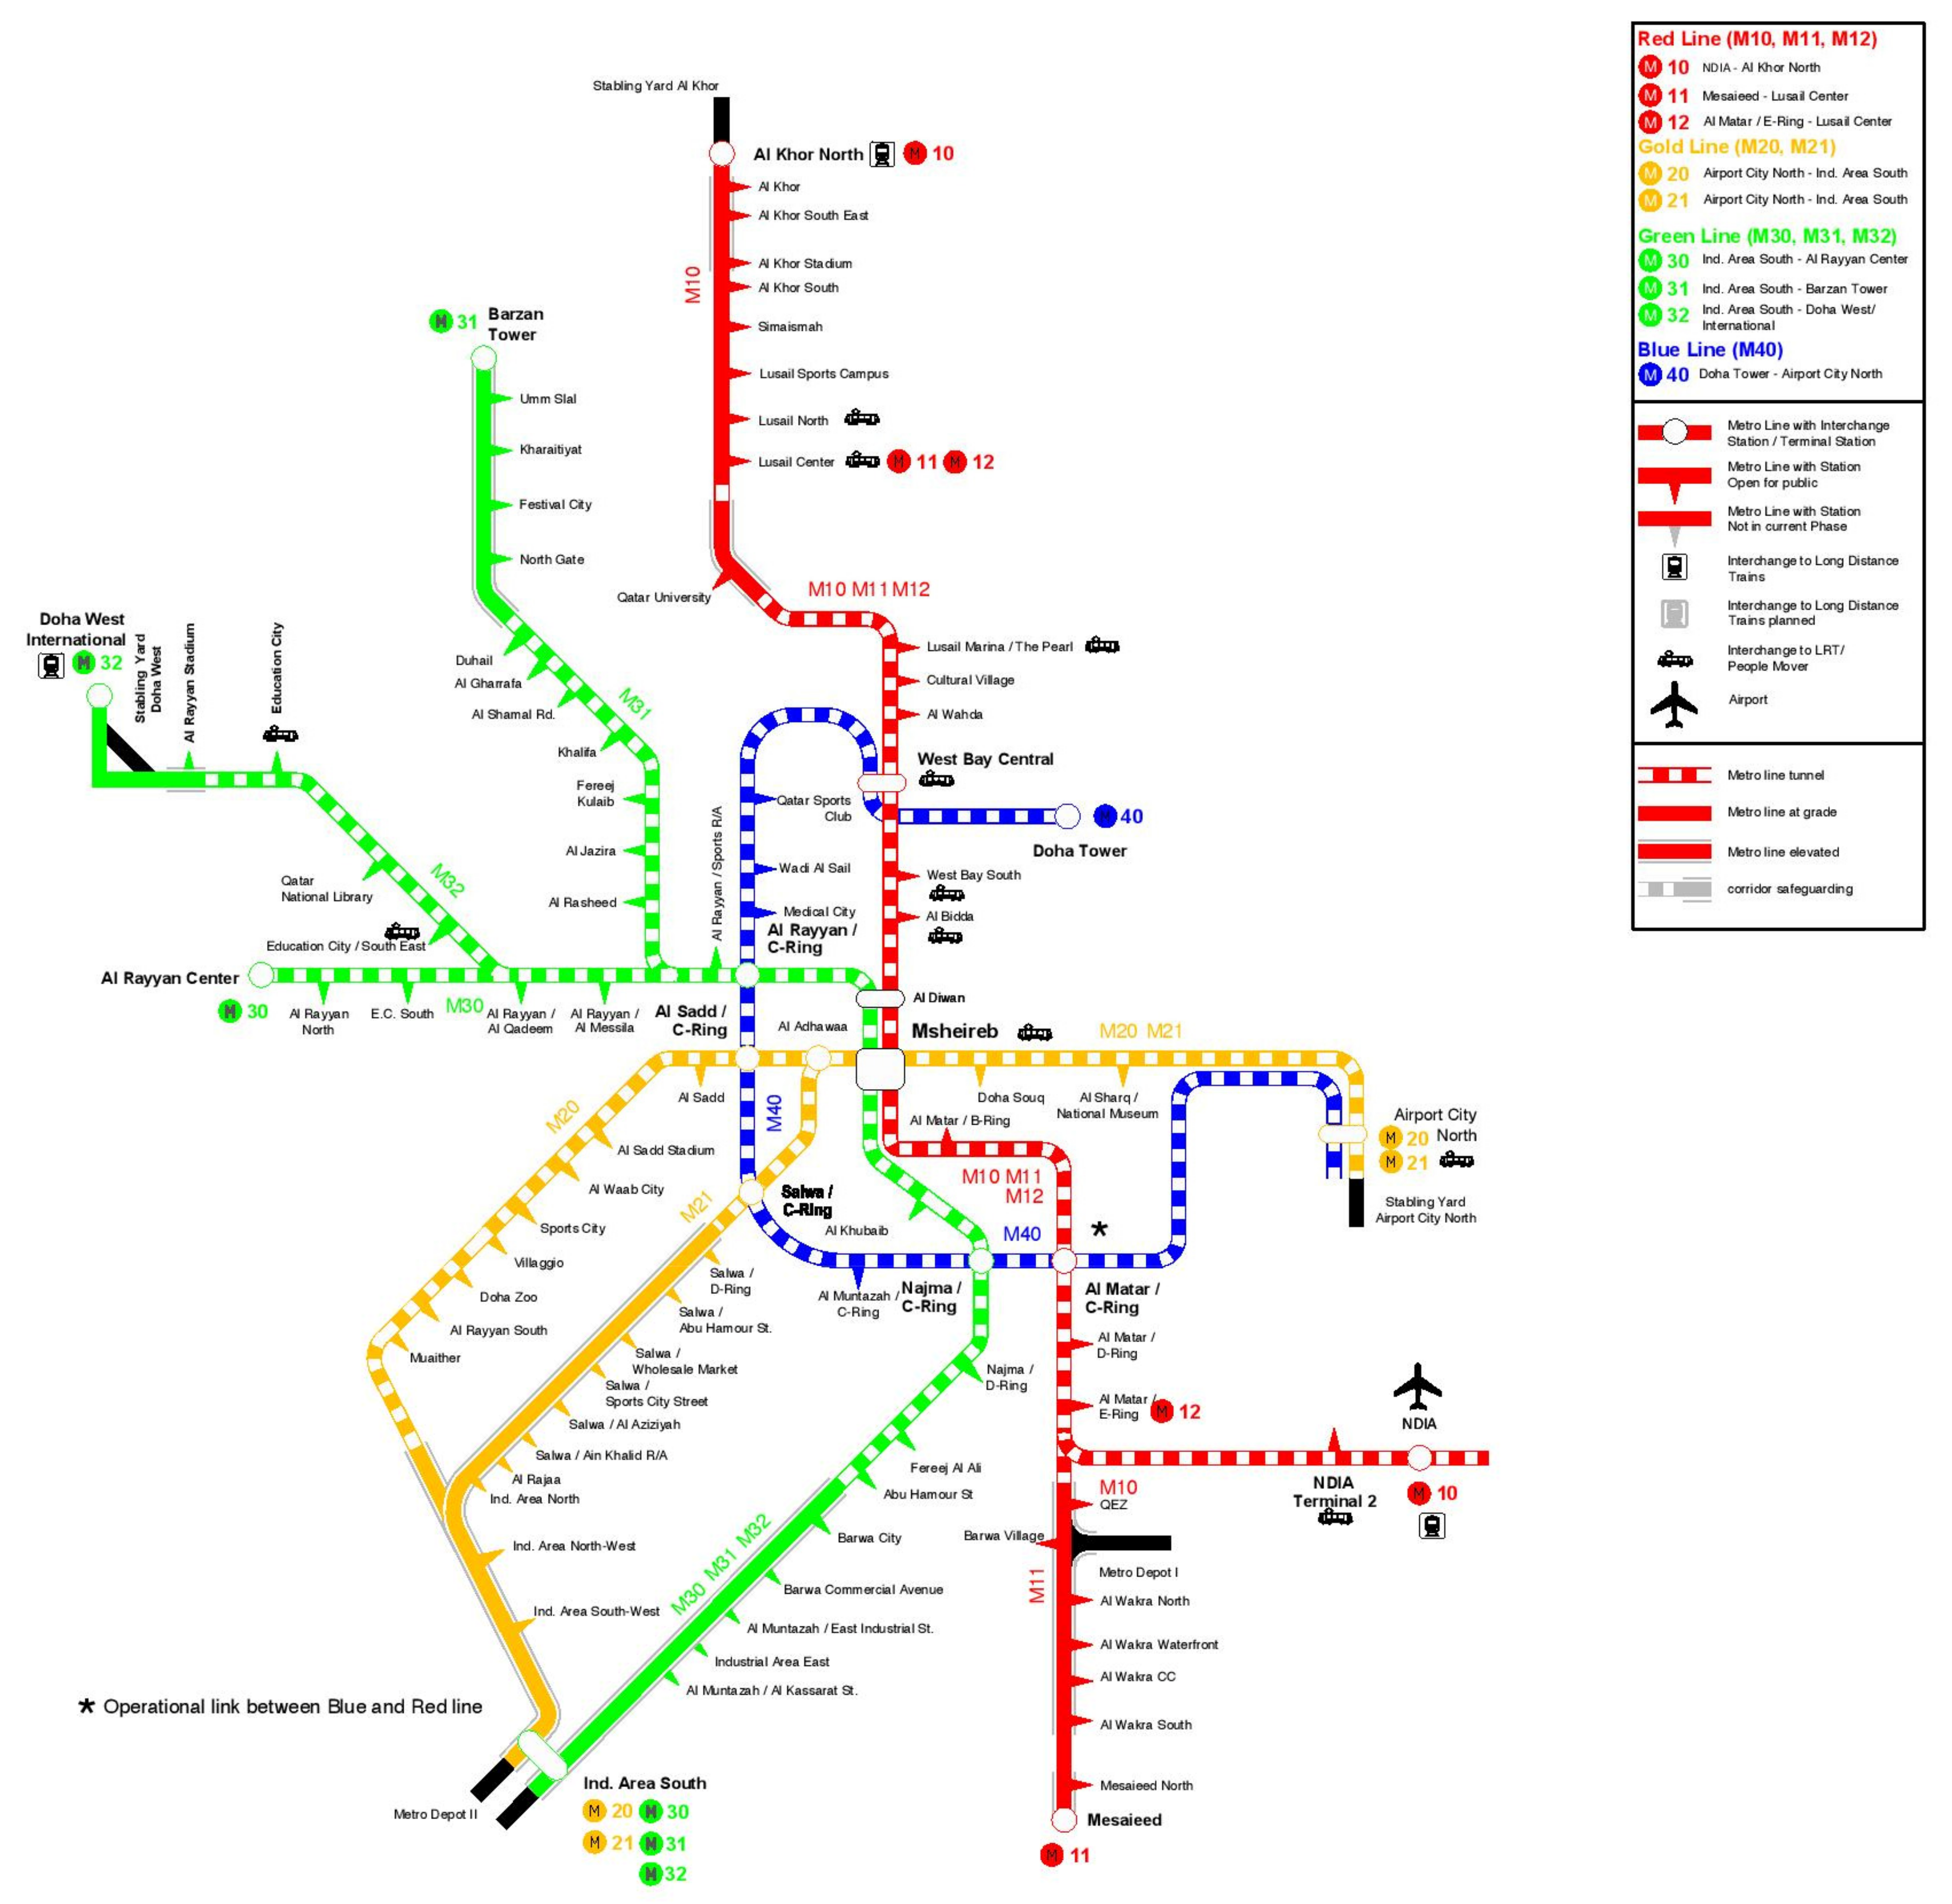
After several years of construction, the opening phase of the Doha Metro took place in late 2019. The Doha Metro project has two key phases, as shown in
Figure 1. In the first phase, 37 stations along three different lines (Red, Gold, and Green) are in operation. The second phase, planned for 2026, foresees the opening of a fourth (Blue) line and a total of 60 stations. The Red Line travels between Lusail, and Al Wakra follows a coastal route and is therefore also known as the Coast Line. The Green Line, also known as the Education Line, travels in an east–west direction and passes through the multi-campus area known as Education City. The Gold Line, also called the Historic Line, includes stops at major cultural and historical sites including Souq Waqif, Msheireb, and the Qatar National Museum (QNM). The location and the planning for each station and its environs play a crucial role in the overall plan of TOD, as the cultural importance of a given area is fundamental in creating a sense of place for that area.
For this research project, Doha’s centrally-located Al Ghanim district was chosen as the study site. The district has a population of approximately 126,000. It is one of the older parts of Doha and traditionally had an attractive urban fabric. The area hosts Souq Waqif—a traditional bazaar area and one of the best-known traditional markets in Qatar—and is near two other high-profile destinations, the Msheireb development and the Qatar National Museum. Within this study area, Ras Abu Aboud Street provides a high degree of connectivity and accessibility to many other nearby focal points.
According to the reviewed literature, and to the best of the authors’ knowledge, most existing research on TODs is based on a system dynamics approach aiming to explain the underlying mechanisms, with little or no attempt to analyze the dynamics of key variables [
17,
19,
27]. In the case of Qatar, previous TOD studies focus on a descriptive analysis of TOD from an urban perspective. Additionally, the reviewed literature [
15,
36,
37] lacks studies on how to implement a systems approach for a specific region, taking into account its unique urban, transport, and socio-economic characteristics. However, planning authorities and policymakers in Qatar generally agree that TOD-related regulations and development must be dynamic, in that they must allow for the possibility of changes “on the ground.”
This research study therefore aims to explain the underlying mechanisms of TOD around metro stations by proposing a conceptual system dynamics model seeking to achieve a number of objectives. First, it aims to study land use conditions along the transport corridor. Second, it seeks to elucidate the mechanisms supporting TOD, and determine how best to encourage TOD around metro stations. Third, it aims to investigate and evaluate relevant policy options associated with land use and PT, which, if well implemented, can foster sustainable development in developing countries in general.
For this exploration of TOD planning and implementation, Qatar is an ideal case study. The country is witnessing rapid urban development which includes large-scale investments in the construction industry, particularly in anticipation of the upcoming World Cup 2022. This research study can also serve as a guide for transportation planners and other decision-makers as they create policies and regulations for this quickly-evolving region; the insights gained here should also be applicable to other regions around the world facing similar challenges.
3. The Research Design
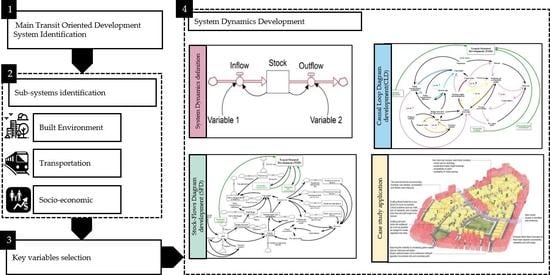
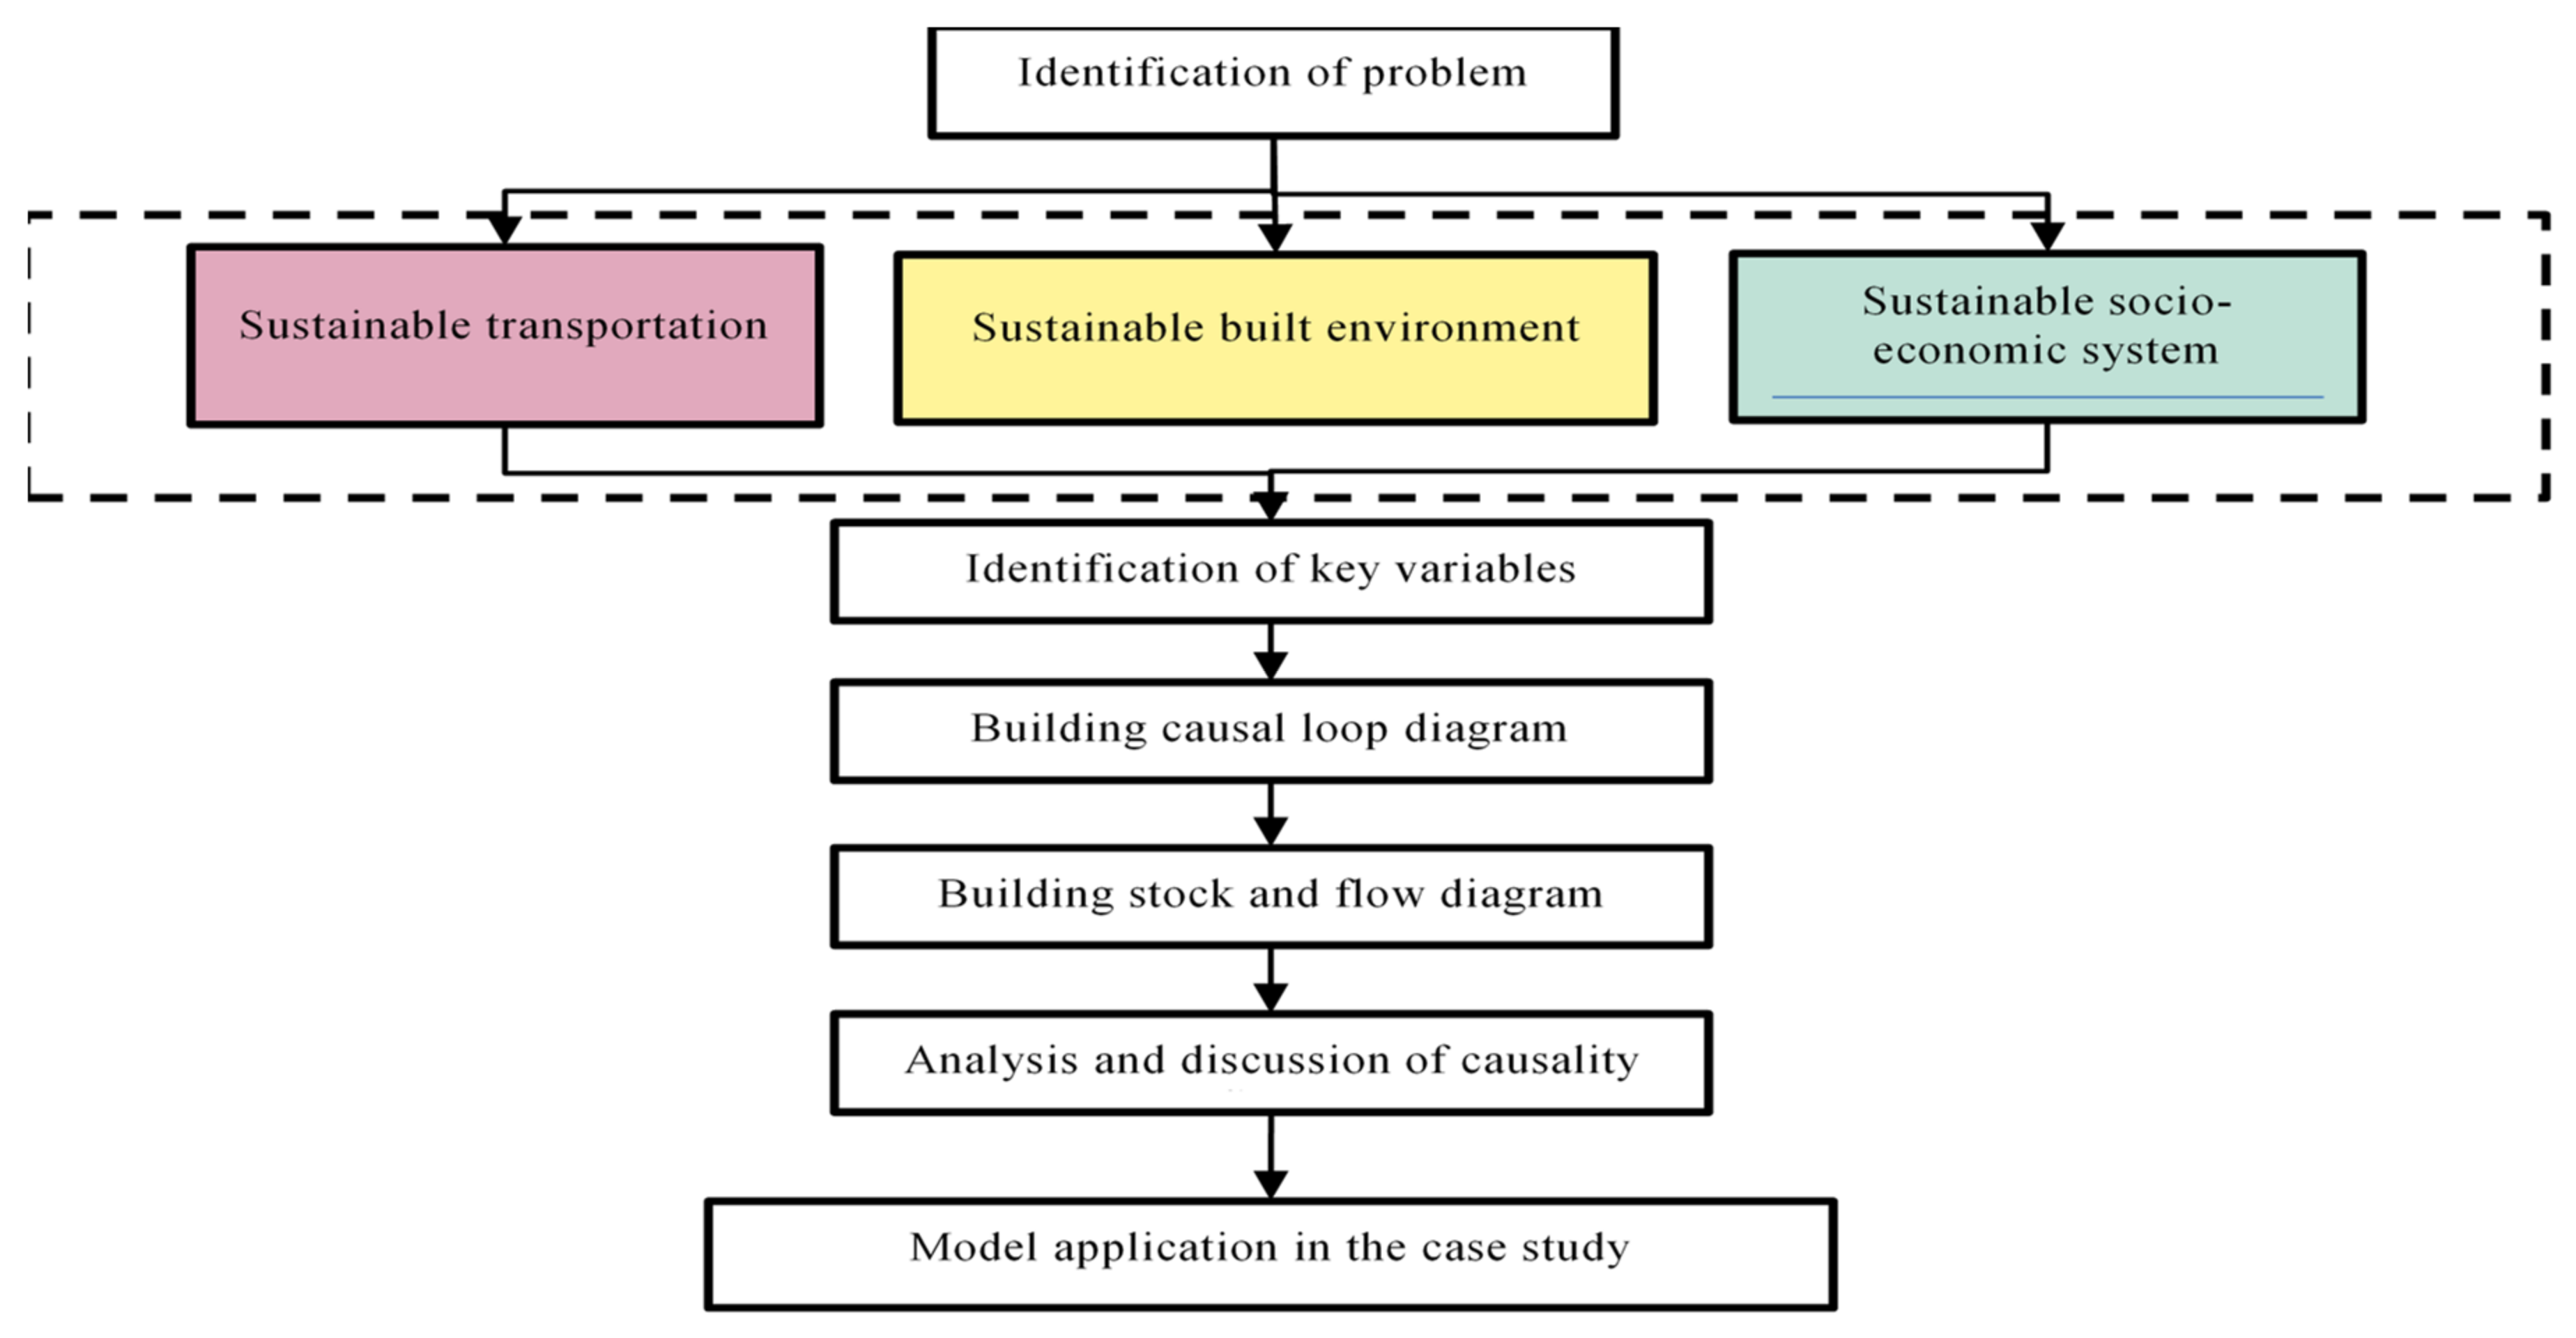
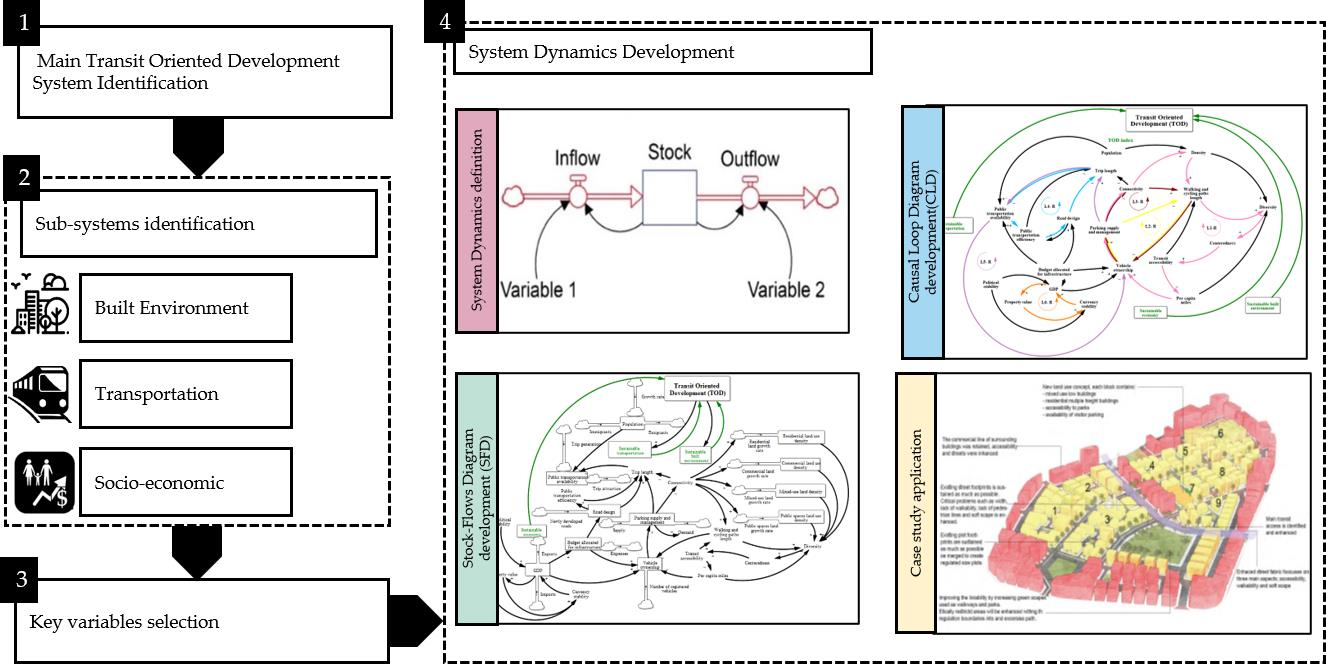
This section describes the methodology that was adopted in the building of the SD model, illustrated in
Figure 2. A sequence of steps was followed, the first of which was defining the main problem. From there, key variables were identified and selected from the three sub-systems considered in this research, namely (i) a sustainable transportation system, (ii) a sustainably built environment, and (iii) a sustainable economy. Next, a causal loop diagram was created; here, loops and causality relations among the variables were established. A stock and flow diagram was then created, which permitted an analysis and discussion of the relevant causality flows. The resulting SD conceptual model served as the basis for an analysis of Doha’s Al Ghanim district. Finally, the causality relationships identified among the variables in the causal loop diagram could be applied to the study site, and the results could be applied and discussed in detail.
The physical characteristics typical of TODs include high density and diversity as well as attractive design. Discussion and evaluation of TODs thus make frequent use of the so-called “3D” indicators of Density, Diversity, and Design. As discussed by Renne [
38], the 3Ds relate closely to transportation demand, choice of transport mode, and degree of peak-hour congestion [
20]. Since accessible transit plays a crucial role in creating TODs, researchers consider it vital to be able to evaluate the characteristics that most affect users’ travel behavior. The TOD Index developed by Singh et al. [
30] incorporates independent measures of the location of transit nodes based on grid cells, which is why development characteristics should be measured solely for this index. This identifies areas with the greatest potential for PT use, which are therefore areas for which PT availability should be maximized. Existing access to high-quality transit should also be assessed for such areas. For the present study, various indicators proposed by Singh et al. [
2] were also considered in depth in order to establish a suitable list of measurable indicators of TOD in the study area, permitting the assessment of the area’s state of development and its transit characteristics. These indicators are not specific to this research study and can potentially be used to measure TOD in the vicinity of any transit node in any city in the world.
Table 2 shows the selected variables, each listed together with its type and a more detailed description.
Singh et al. [
30] have developed the following equation for land use diversity and mix to calculate the TOD index: as shown below, Equations (1)–(3) are used to compute land-use diversity and mixedness. These two indicators are superficially similar but differ slightly. Diversity of land use is a measure of how diverse the mix of all land uses is in an area and was calculated using the entropy index [
47]:
where
i = a given area of analysis,
Lui = land-use class (1, 2, …,
n) in area of analysis
i,
Qlui = share of specific land use within analysis area
i;
Slui = total area of the specific land use within analysis area
i, and
Si = total area of analysis area
i.
A high degree of land use diversity is necessary in order for TOD to best utilize off-peak directions and/or hours of transit capacity, as well as for increasing livability in the city. The mix of land use measures wellness of residential land use mixedness along with other land uses in an area, which is significant since a better mix means that residents can walk or cycle when undertaking non-work-related trips. Therefore, the indicator in Equation (4) is used to measure the walkability or cyclability of an area. The relation is
where
i = a given area of analysis,
Sc = sum of the total area under non-residential urban land use within area
i, and
Sr = sum of the total area under residential land use within area
i.
The planning for TOD should not only strive to make newly developed areas more transit-oriented but should also assure that transit systems connect to developed places which are already transit-oriented but not easily accessible. This is where SD plays an important role, namely in the analysis of the study area’s historical data. The outcome of this analysis is an attempt to project the behavior of the analyzed system, which in turn can aid in the decision-making and policy formation processes.
Based on the information and parameter definitions outlined in
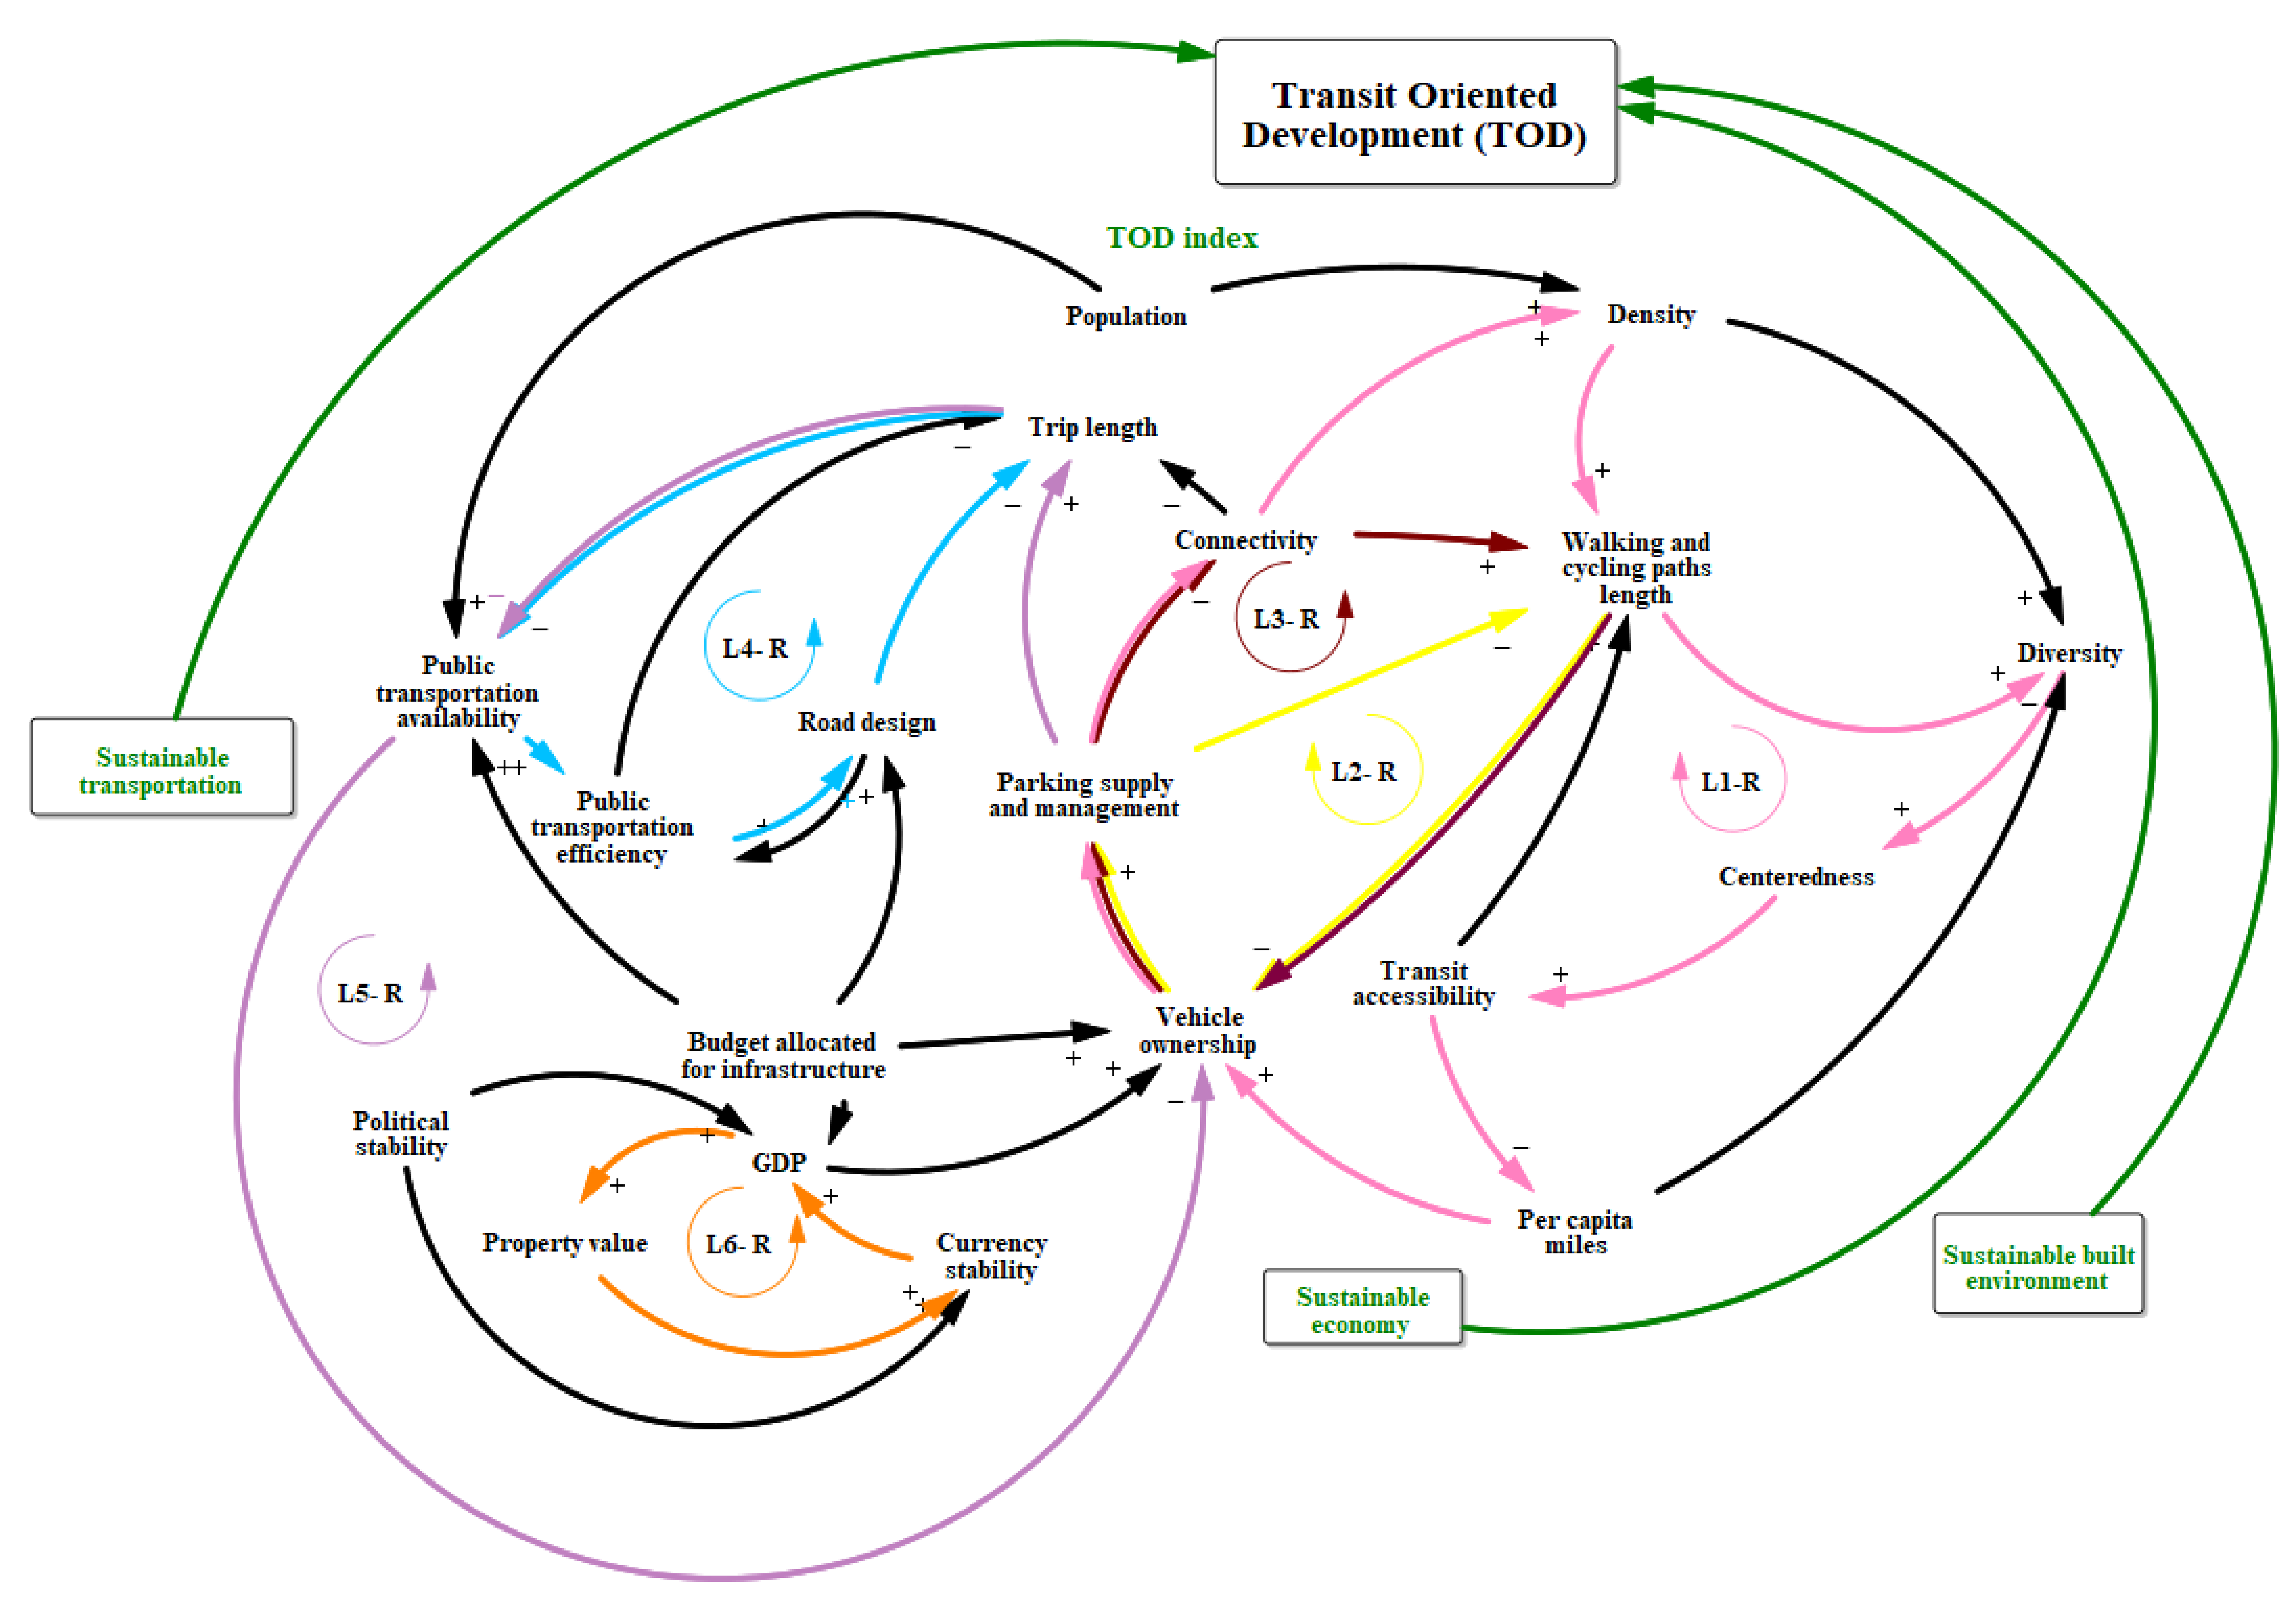
Table 2, a causal loop diagram (CLD) was developed.
Figure 3 shows the resulting CLD with corresponding relationships among parameters. “Reinforcing” loops have an even number of negative signs (i.e., polarities) within their parameters, while “balancing” loops have an odd number of negative signs. The model developed in the present study continued with the construction of the causal loop and stock and flow diagrams shown in
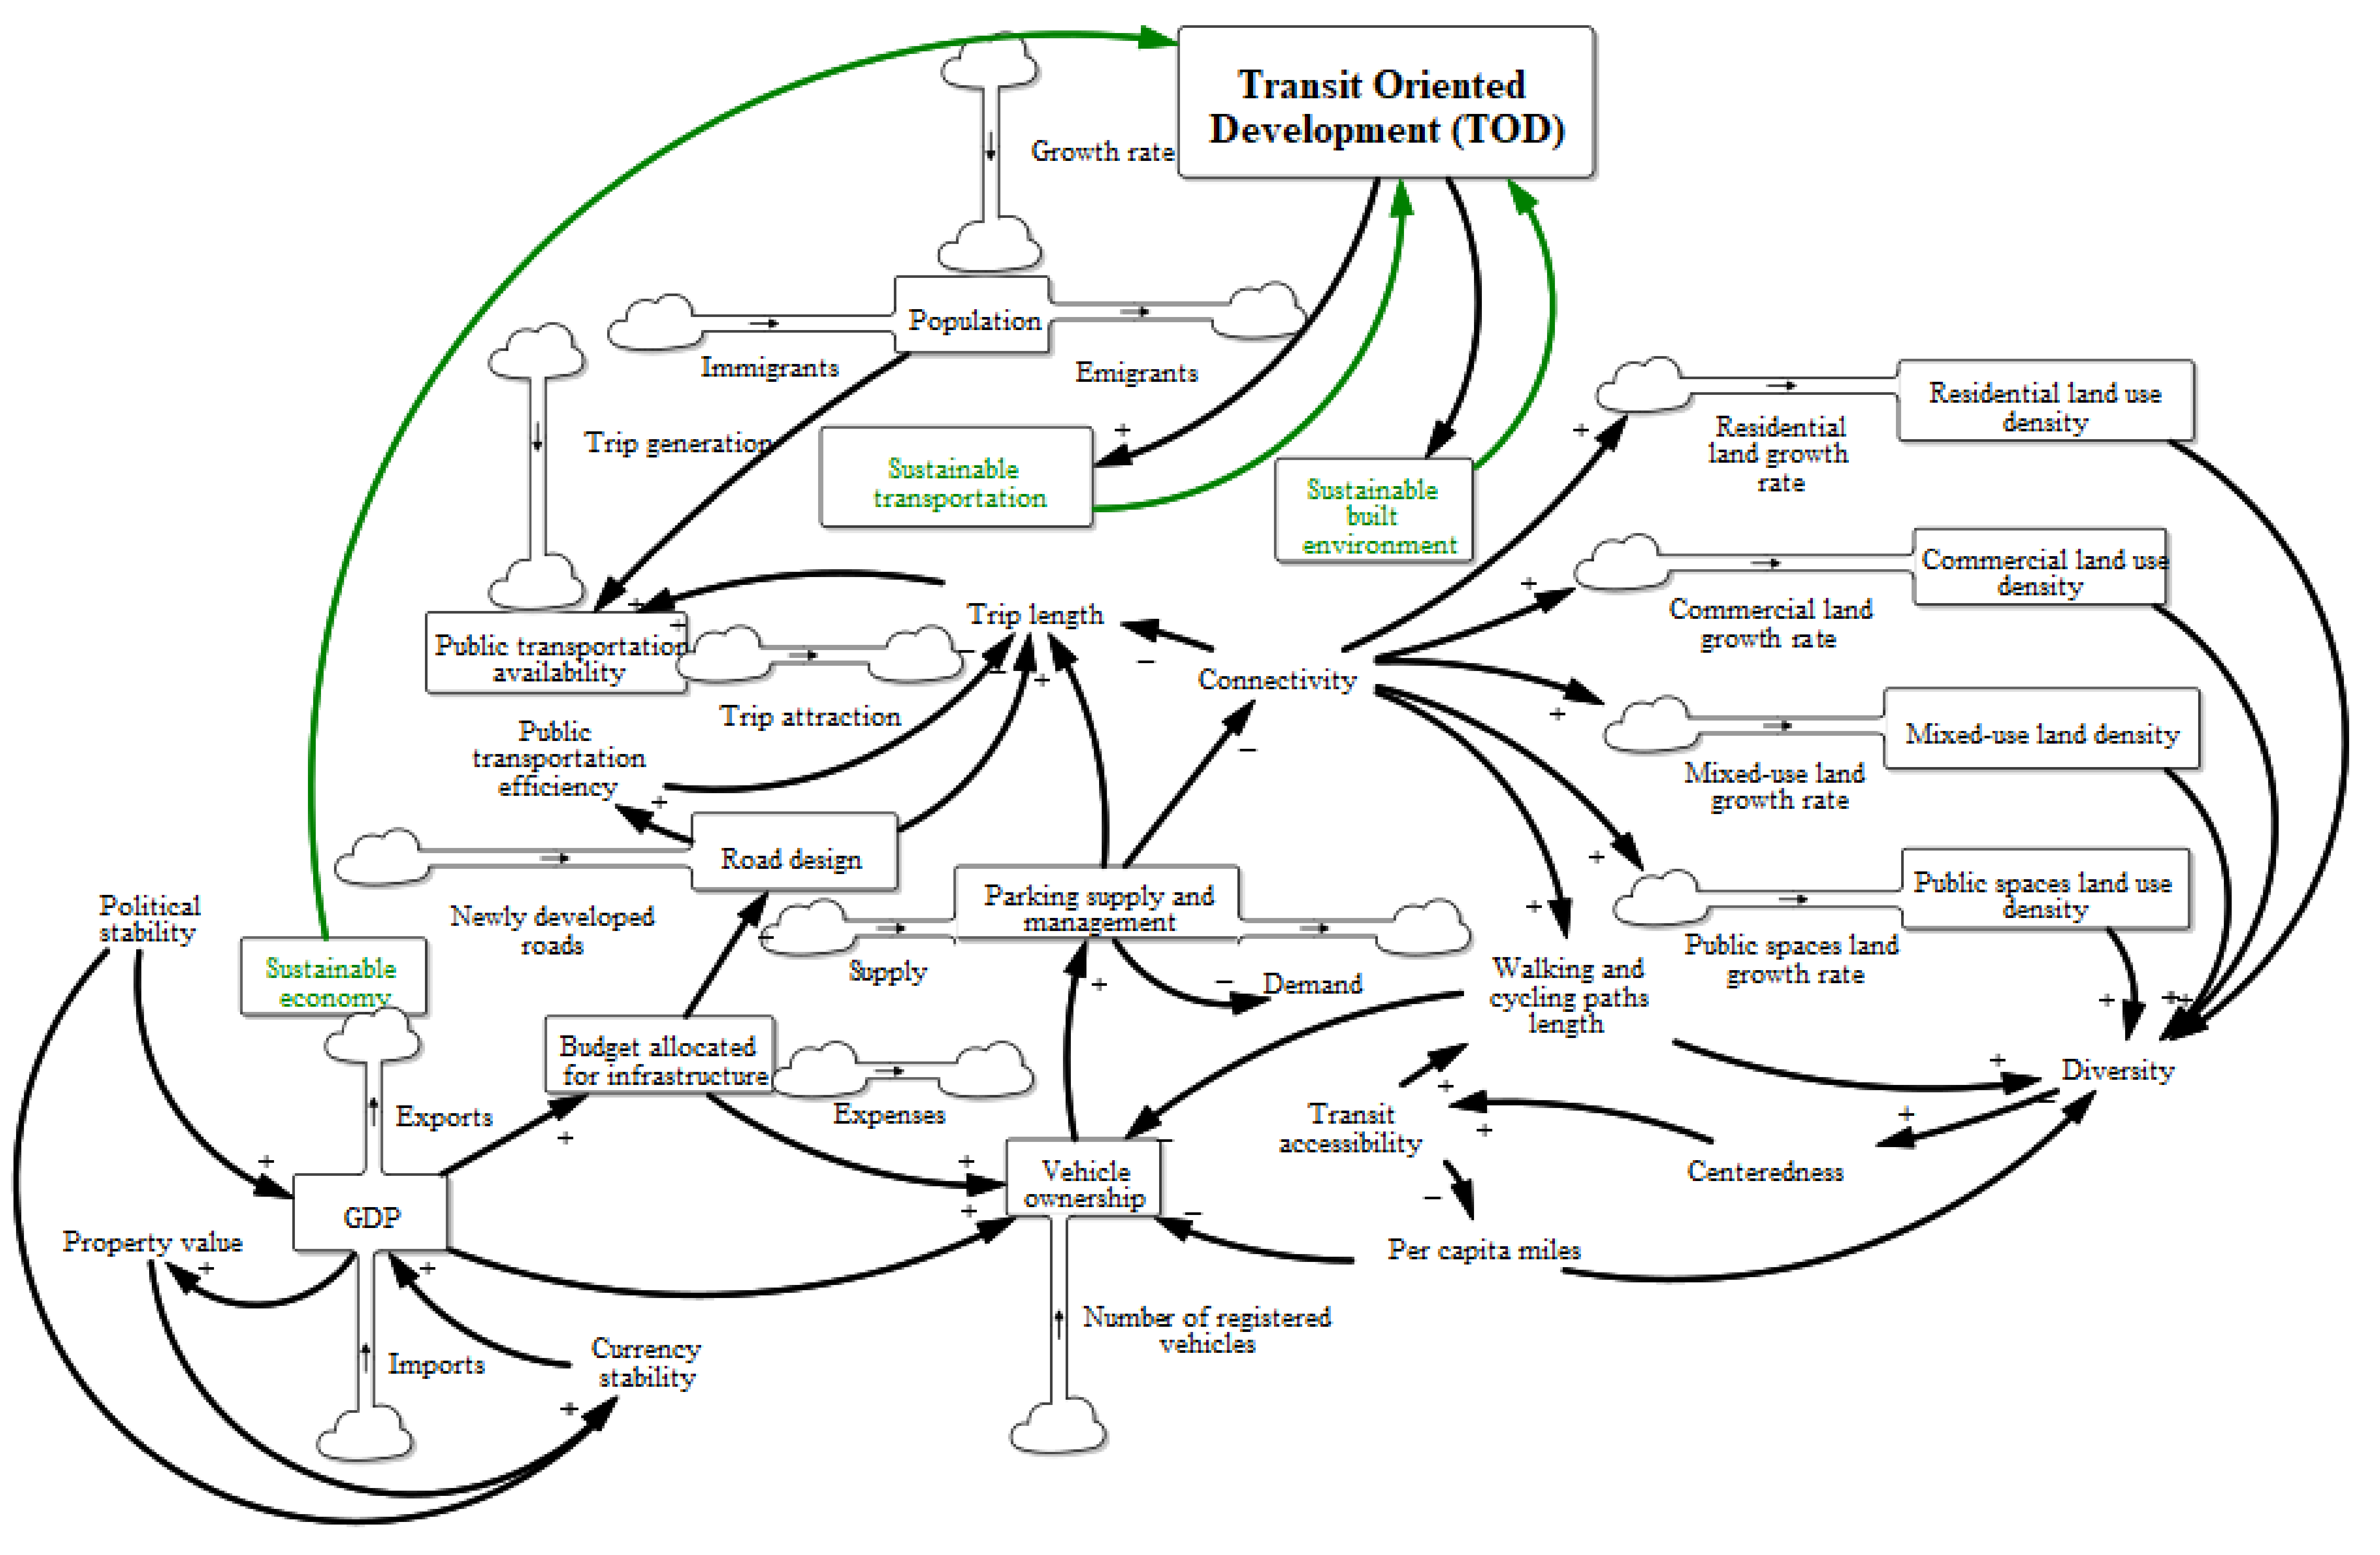
Figure 3, illustrating the causality relations among all system variables. The stock and flow diagram of the model is presented in
Figure 4, and is based on the CLD shown in
Figure 3. These images offer a visual expression of model relationships, as developed using the software Vensim. The process of defining polarities among variables is known as a “system conceptualization” phase for system dynamics modeling. Unlike in statistical models, these datasets do not imply correlation, but causation. In this study, we adopted a causal loop diagram (system conceptualization) to show these causal relationships among the important parameters. The causal relationships are justified individually (for each pair) using multiple references from the literature. In quantitative modeling, the next stage is to build stock–flow diagrams and embed numerical and time-series datasets, which is beyond the scope of this work and requires a large amount of historical data, which is generally unavailable in Qatar. However, as we collect more data, we are planning to develop stock–flow diagrams which incorporate quantitative data from Qatar.
4. Discussion and Findings
A TOD and the context in which it operates constitute a holistic system incorporating factors as varied as the built environment as well as transport and socio-economic conditions. The analysis of such a system requires a robust method of connecting the various parameters that influence decision-making via complex relations and feedback [
48]. Feedback is particularly important because it allows for continuous improvement. Analysis of how such a system functions in real-word conditions can help generate feedback for decision-making in the form of qualitative and quantitative data. The following discussion explores relevant features of the loops seen in the CLD shown in
Figure 3.
(L1—Reinforcing) Diversity → (+) Centeredness → (+) Transit accessibility → (−) Per capita miles → (+) Vehicle ownership → (+) Parking supply and management → (−) Connectivity → (+) Density → (+) Diversity.
The first implication in L1 indicates that diversity positively affects centeredness. Centeredness refers to the portion of major activities centered in a multi-modal city core, where “major” activities refer to those related to employment or commerce, or otherwise taking place in public spaces [
49]. Increased transit accessibility also negatively affects the number of per capita miles traveled. In addition, L1 findings agree in showing that vehicle ownership, vehicle mode shares, and per capita vehicle travel decline when PT accessibility increases. In addition, when urban density increases, the total daily minutes of travel significantly decrease. One of Nahlik and Chester’s [
50] most important findings is that increased density leads to a decrease in vehicle ownership, and which in turn influences regional accessibility, land use mix, centeredness, connectivity, and diversity of PT modes [
51]. Kuzmyak et al. [
52] created a comprehensive model which indicated that urban density increases street connectivity (which tends to reduce per capita miles traveled), and that land-use diversity decreases per capita miles traveled.
(L2—Reinforcing) Walking and cycling paths length → (−) Vehicle ownership → (+) Parking supply and management → (−) Walking and cycling paths length.
L2 shows that there is a negative relation between walking/cycling paths and vehicle ownership. Parking supply will increase when vehicle ownership increases, which will eventually lead to a decrease in walking and cycling. According to Ton et al. [
53], if walking and cycling increase significantly, it will lead to many potential benefits and could reduce congestion and emissions associated with car-switching to increase walking and cycling participation. Ultimately, the aim is to shift traffic from motorized modes to walking and cycling, which will eventually decrease the need for vehicle ownership and parking supply.
(L3—Reinforcing) Walking and cycling paths length → (−) Vehicle ownership → (+) Parking supply and management → (−) Connectivity → (+) Walking and cycling paths length.
L3 shows that street network connectivity influences walking and cycling in the city. Proper decision-making with respect to parking supply and management is associated with increased development density and mixed land uses, better conditions of walkability, and reduced parking supply needs [
50]. Significant factors which can reduce vehicle ownership and usage include (a) efficient parking pricing, in which vehicle owners pay the direct costs of parking facility usage; (b) unbundling, meaning that the renting out of parking spaces is a separate transaction from the fees paid to occupy or visit a building; and (c) cash-out, meaning that travelers with modes of transport other than the use of cars receive cash benefits equivalent to the parking subsidies provided to motorists. Parking supply and management are associated with increased street connectivity; more connected streets lead to an increase in density and walkability, which eventually increases land-use diversity, centeredness, and accessibility [
54].
(L4—Reinforcing) Public transportation availability → (+) Public transportation efficiency → (+) Road design → (−) Trip length → (−) Public transportation availability.
Increased PT availability increases its efficiency and decreases private vehicle ownership. At the same time, increasing PT efficiency and availability is associated with a better local infrastructure and economy. Trip length increases when connectivity decreases, and trip length decreases when PT efficiency increases (Kuzmyak et al., 2012).
(L5—Balancing) Public transportation availability → (−) Vehicle ownership → (+) Parking supply and management → (+) Trip length → (+) Public transportation availability.
A research study by Sahu [
55] shows that the residents of well-designed TODs tend to possess fewer vehicles and generate fewer vehicle trips, relying instead on cycling, walking, and PT as their primary transport modes. This is in clear contrast to inhabitants of vehicle-oriented communities. However, vehicle ownership also tends to increase in the context of increased socio-economic advancement. In general, the more advanced the economy of a country is, the better its roads’ design quality tends to be. Higher road quality in turn leads to reduced trip lengths, which is correlated with increased availability of PT. Moreover, Litman [
43] agrees with Fishman [
56] on public transportation systems availability producing a complementary ridership effect—in this context, Litman (2010) claims that this is by transporting people on PT who would otherwise travel by automobile transit. In aggregate, transit reduces the trip length, vehicle ownership, and parking supply.
(L6—Reinforcing) GDP → (+) Property value → (+) Currency stability → (+) GDP.
L6 indicates that increased GDP in a country positively affects typical property value. Moreover, a stable currency assures stability in the property value as well. L6 also shows that there is a positive correlation between GDP and currency stability.
Study Area
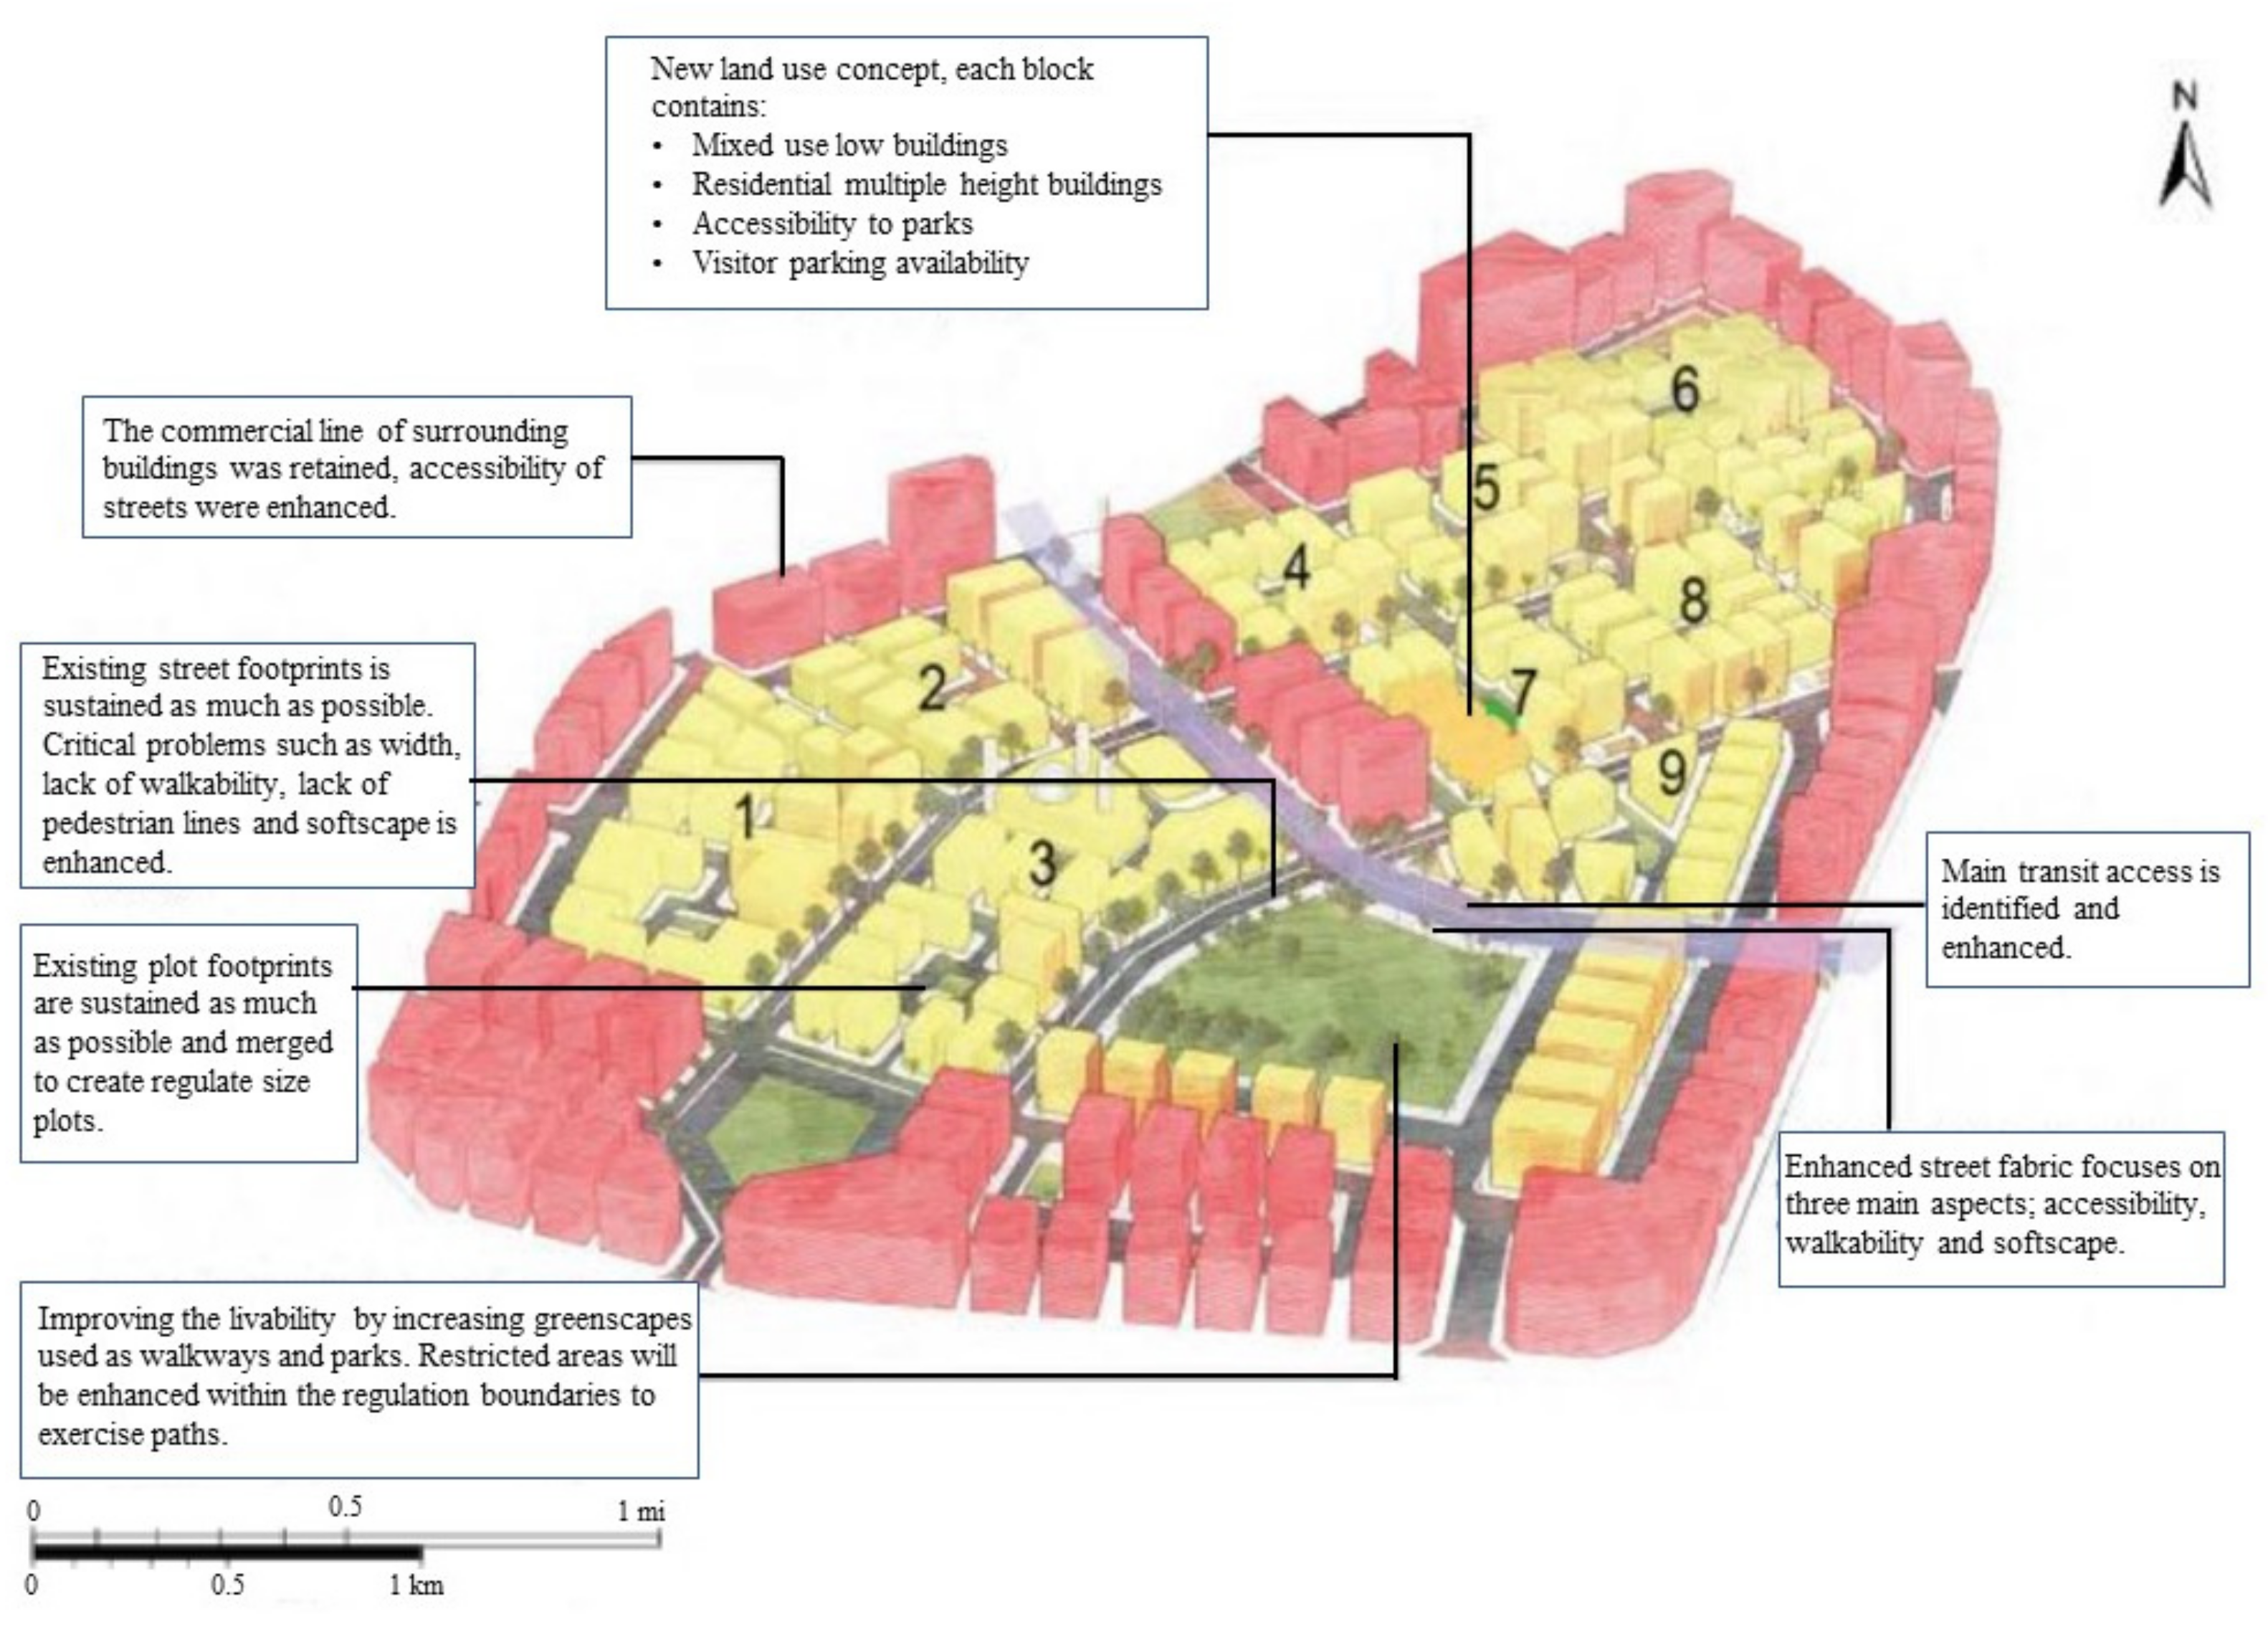
The result of applying system dynamics in this way is an informed proposal for re-planning the Al Ghanim district so that it better conforms to principles of TOD dynamicity. To facilitate deep analysis of land use in the investigated district,
Table 3 presents key characteristics of different zones within the study area, Al Ghanim district, and
Figure 5 presents the proposed improvements. The district was divided into zones, then segregated into blocks to examine the characteristics of these blocks in terms of land use. The proposed plan presented here has been developed in careful consideration of these factors. An important aim here is to redefine the district as a hub supporting an enhanced lifestyle, mitigating the stigma of the area, which is sometimes now seen by locals as a decayed old city center which is culturally detached from its context. The plan proposed in this research study establishes new standards for living, working, and development, creating a unique, vibrant, and accessible urban environment with a coherent and self-sustaining mix of land uses (i.e., residential, mixed-use, commercial, retail, and recreational areas) that will enhance residents’ perceptions of livability while bolstering the socio-economic development of the area. This is achieved by careful planning directed through a set of clearly conceived goals, as is elaborated on below. The reinvigorated district will also be able to attract visitors because of its diverse commercial and leisure establishments, while at the same time avoiding the problem of unnecessary traffic flow into its residential areas.
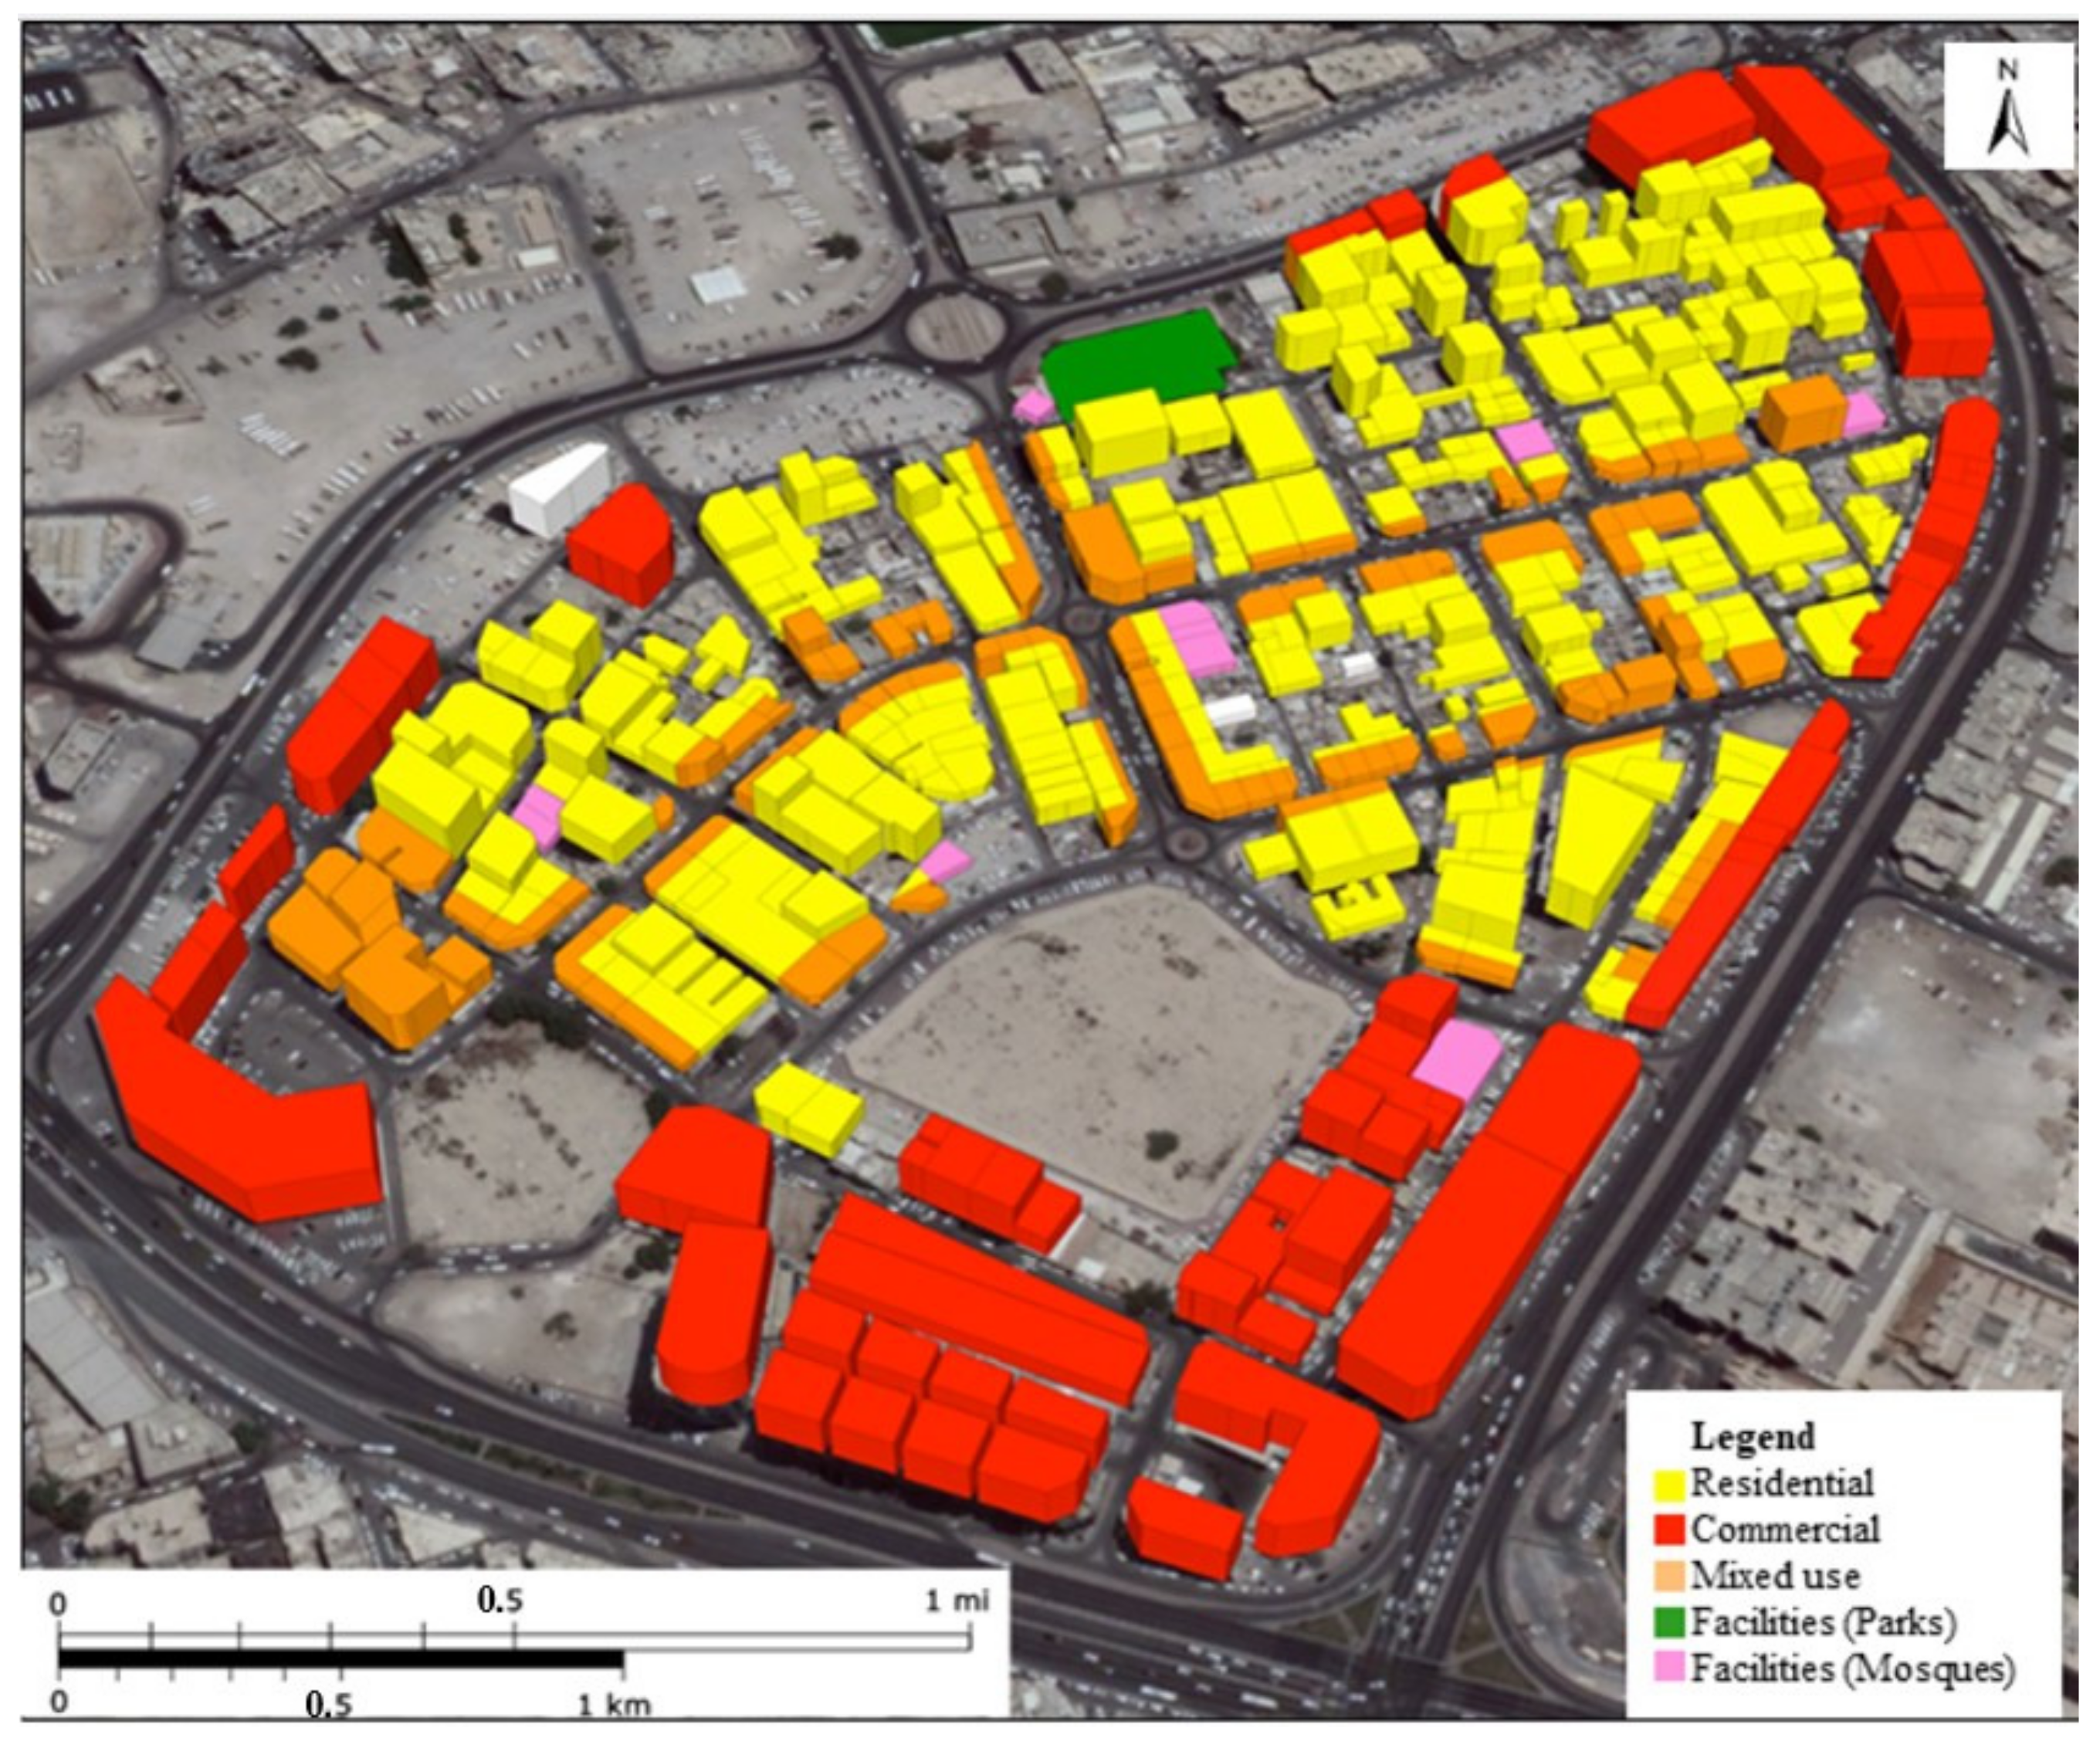
Land use and facilities. The Al Ghanim area is well known for its diverse mix of land uses, similar to many other older parts of Doha. As illustrated in
Figure 6, this diversity of land uses can be seen in the variety of commercial and governmental activities in the area. However, Al Ghanim as it currently exists suffers from a general lack of social activity and amenities such as public gathering places, parks, gardens, and green spaces. The absence of such facilities has made the area unappealing to visitors and city residents alike; in fact, Al Ghanim is considered one of Doha’s least popular residential areas for families. The demographics of the area are unusually heavy tilted toward unmarried males, with the latest statistics indicating that 87% of the area’s population is male and only 13% female. These factors collectively have had deleterious effects on the economy of this area.
Car parking supply and management. Qatar’s Ministry of Development Planning and Statistics has announced a policy, one of whose provisions is that one of Al Ghanim’s major thoroughfares, Ras Abu Abboud Road, will be upgraded and made easier to park on. The overarching objective of this policy is to rethink existing land uses in order to align with QNV 2030. Upgrades will be made so that parallel parking will be facilitated for car users. The impact of this policy will increase the density of the area and reduce path distances for car trips between residential and commercial areas, which implies that enhancements to the PT system locally will be necessary.
Traffic. The streets in the Al Ghanim district require significant upgrades to accommodate a greater variety of users, particularly pedestrians and cyclists. In fact, the existing conditions of the streets is one of the most pressing problems facing the area. At present, both visitors and residents tend to use the somewhat chaotically distributed open spaces and vacant lands as impromptu parking lots, resulting in increased traffic congestion and a corresponding lack of safety and convenience for pedestrians and others.
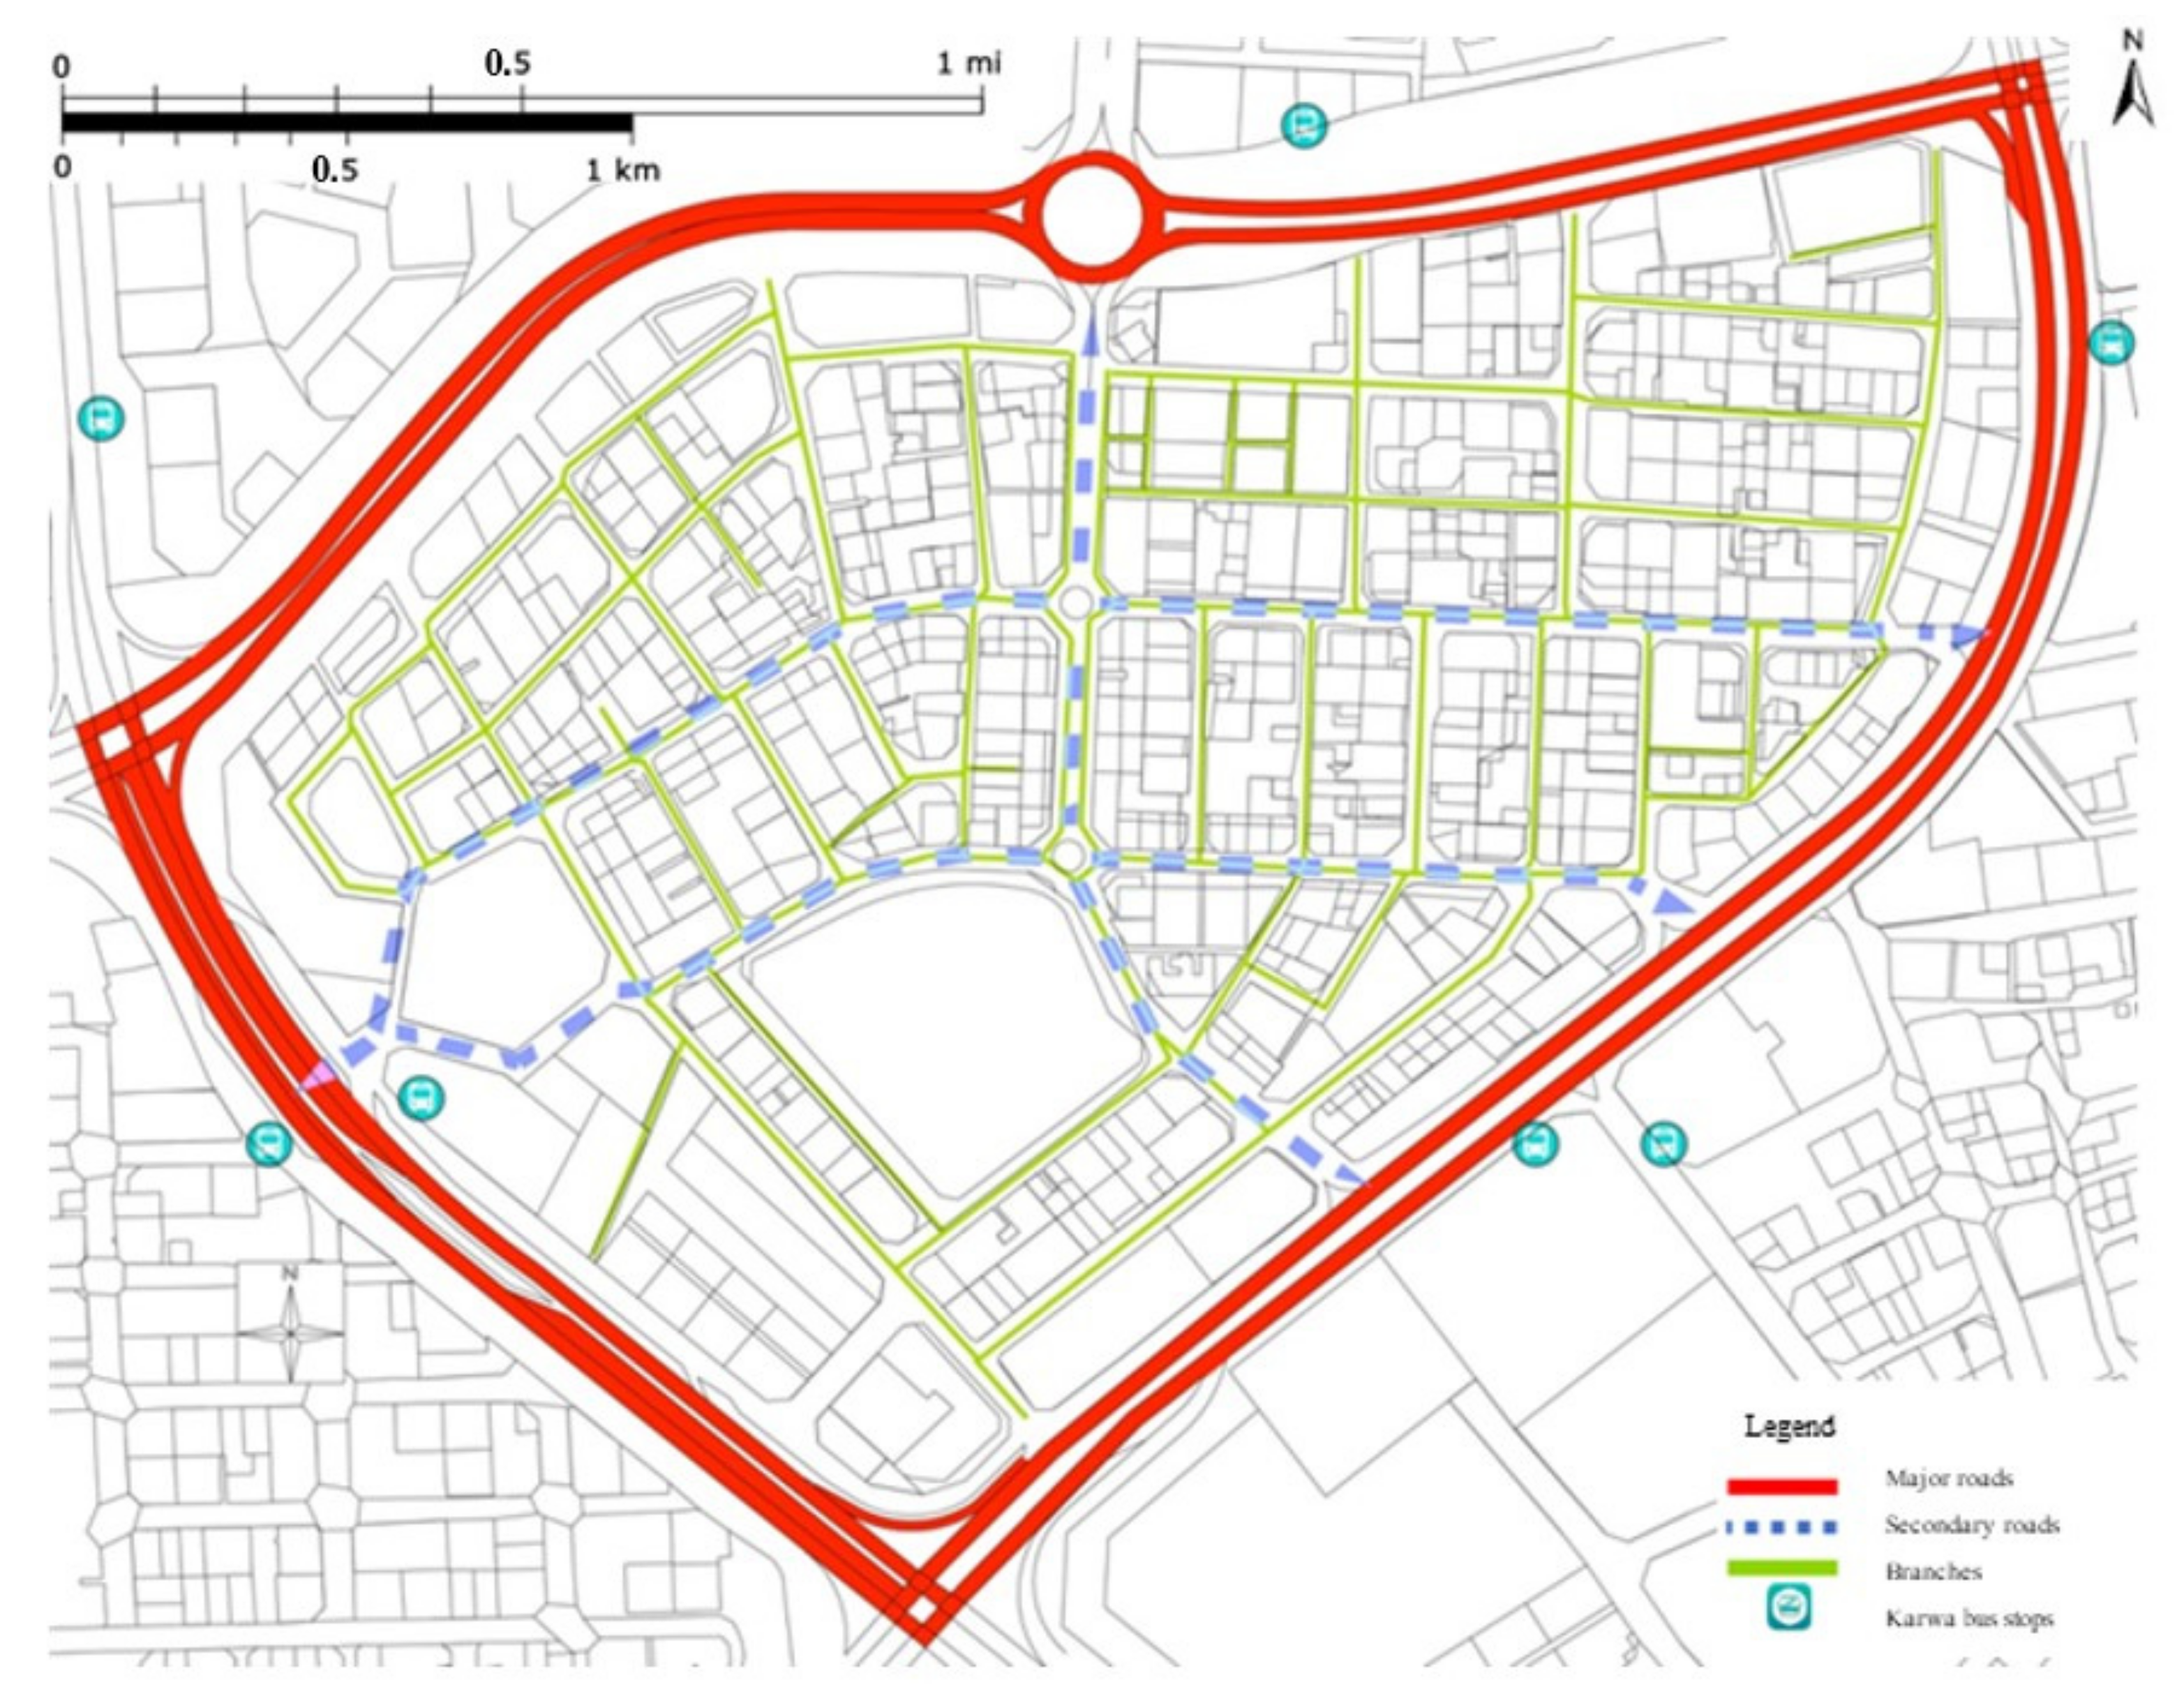
Connectivity. Until recently, the Al Ghanim district has been relatively underserved by Doha’s PT system, though the developing public bus system (Karwa buses) and the new Doha Metro are mitigating these problems somewhat. It is crucial that the area be better served by PT as the city’s transportation system continues to develop.
Figure 7 shows existing street connectivity within the study area.
Transport diversity and accessibility. Transport diversity in the present context refers mainly to the options provided by the city’s PT system. The majority of Al Ghanim residents are low-income earners relying mainly on taxis and buses. However, it is difficult to find a conventional taxi in this area, notwithstanding newer ride-hailing options such as Uber.
Public transportation. Cars, shuttles, and buses are the primary modes of transportation in Al Ghanim, which results in a great deal of traffic congestion. However, the new Doha Metro is beginning to mitigate some such transport-related challenges. However, some of these benefits have been accruing slowly, since other transportation means are still being utilized, due primarily to the distance between Al Ghanim and the metro stations in the adjoining areas of Doha.
There are two bus stops and one metro line located in the study area, which are accessed mainly by the area’s residents. However, the number of public buses provided by the local service, Mowasalat, is inadequate. Metro service is accessible at three stations, and sees the most usage during rush hours when traffic is at its peak. Passengers typically desire convenience and speed, but, overall, PT facilities in the area are insufficient to serve the large population. Therefore, as should be expected, accessible PT within this district will provide a socio-economic advantage for its residents as well as for the population as a whole.
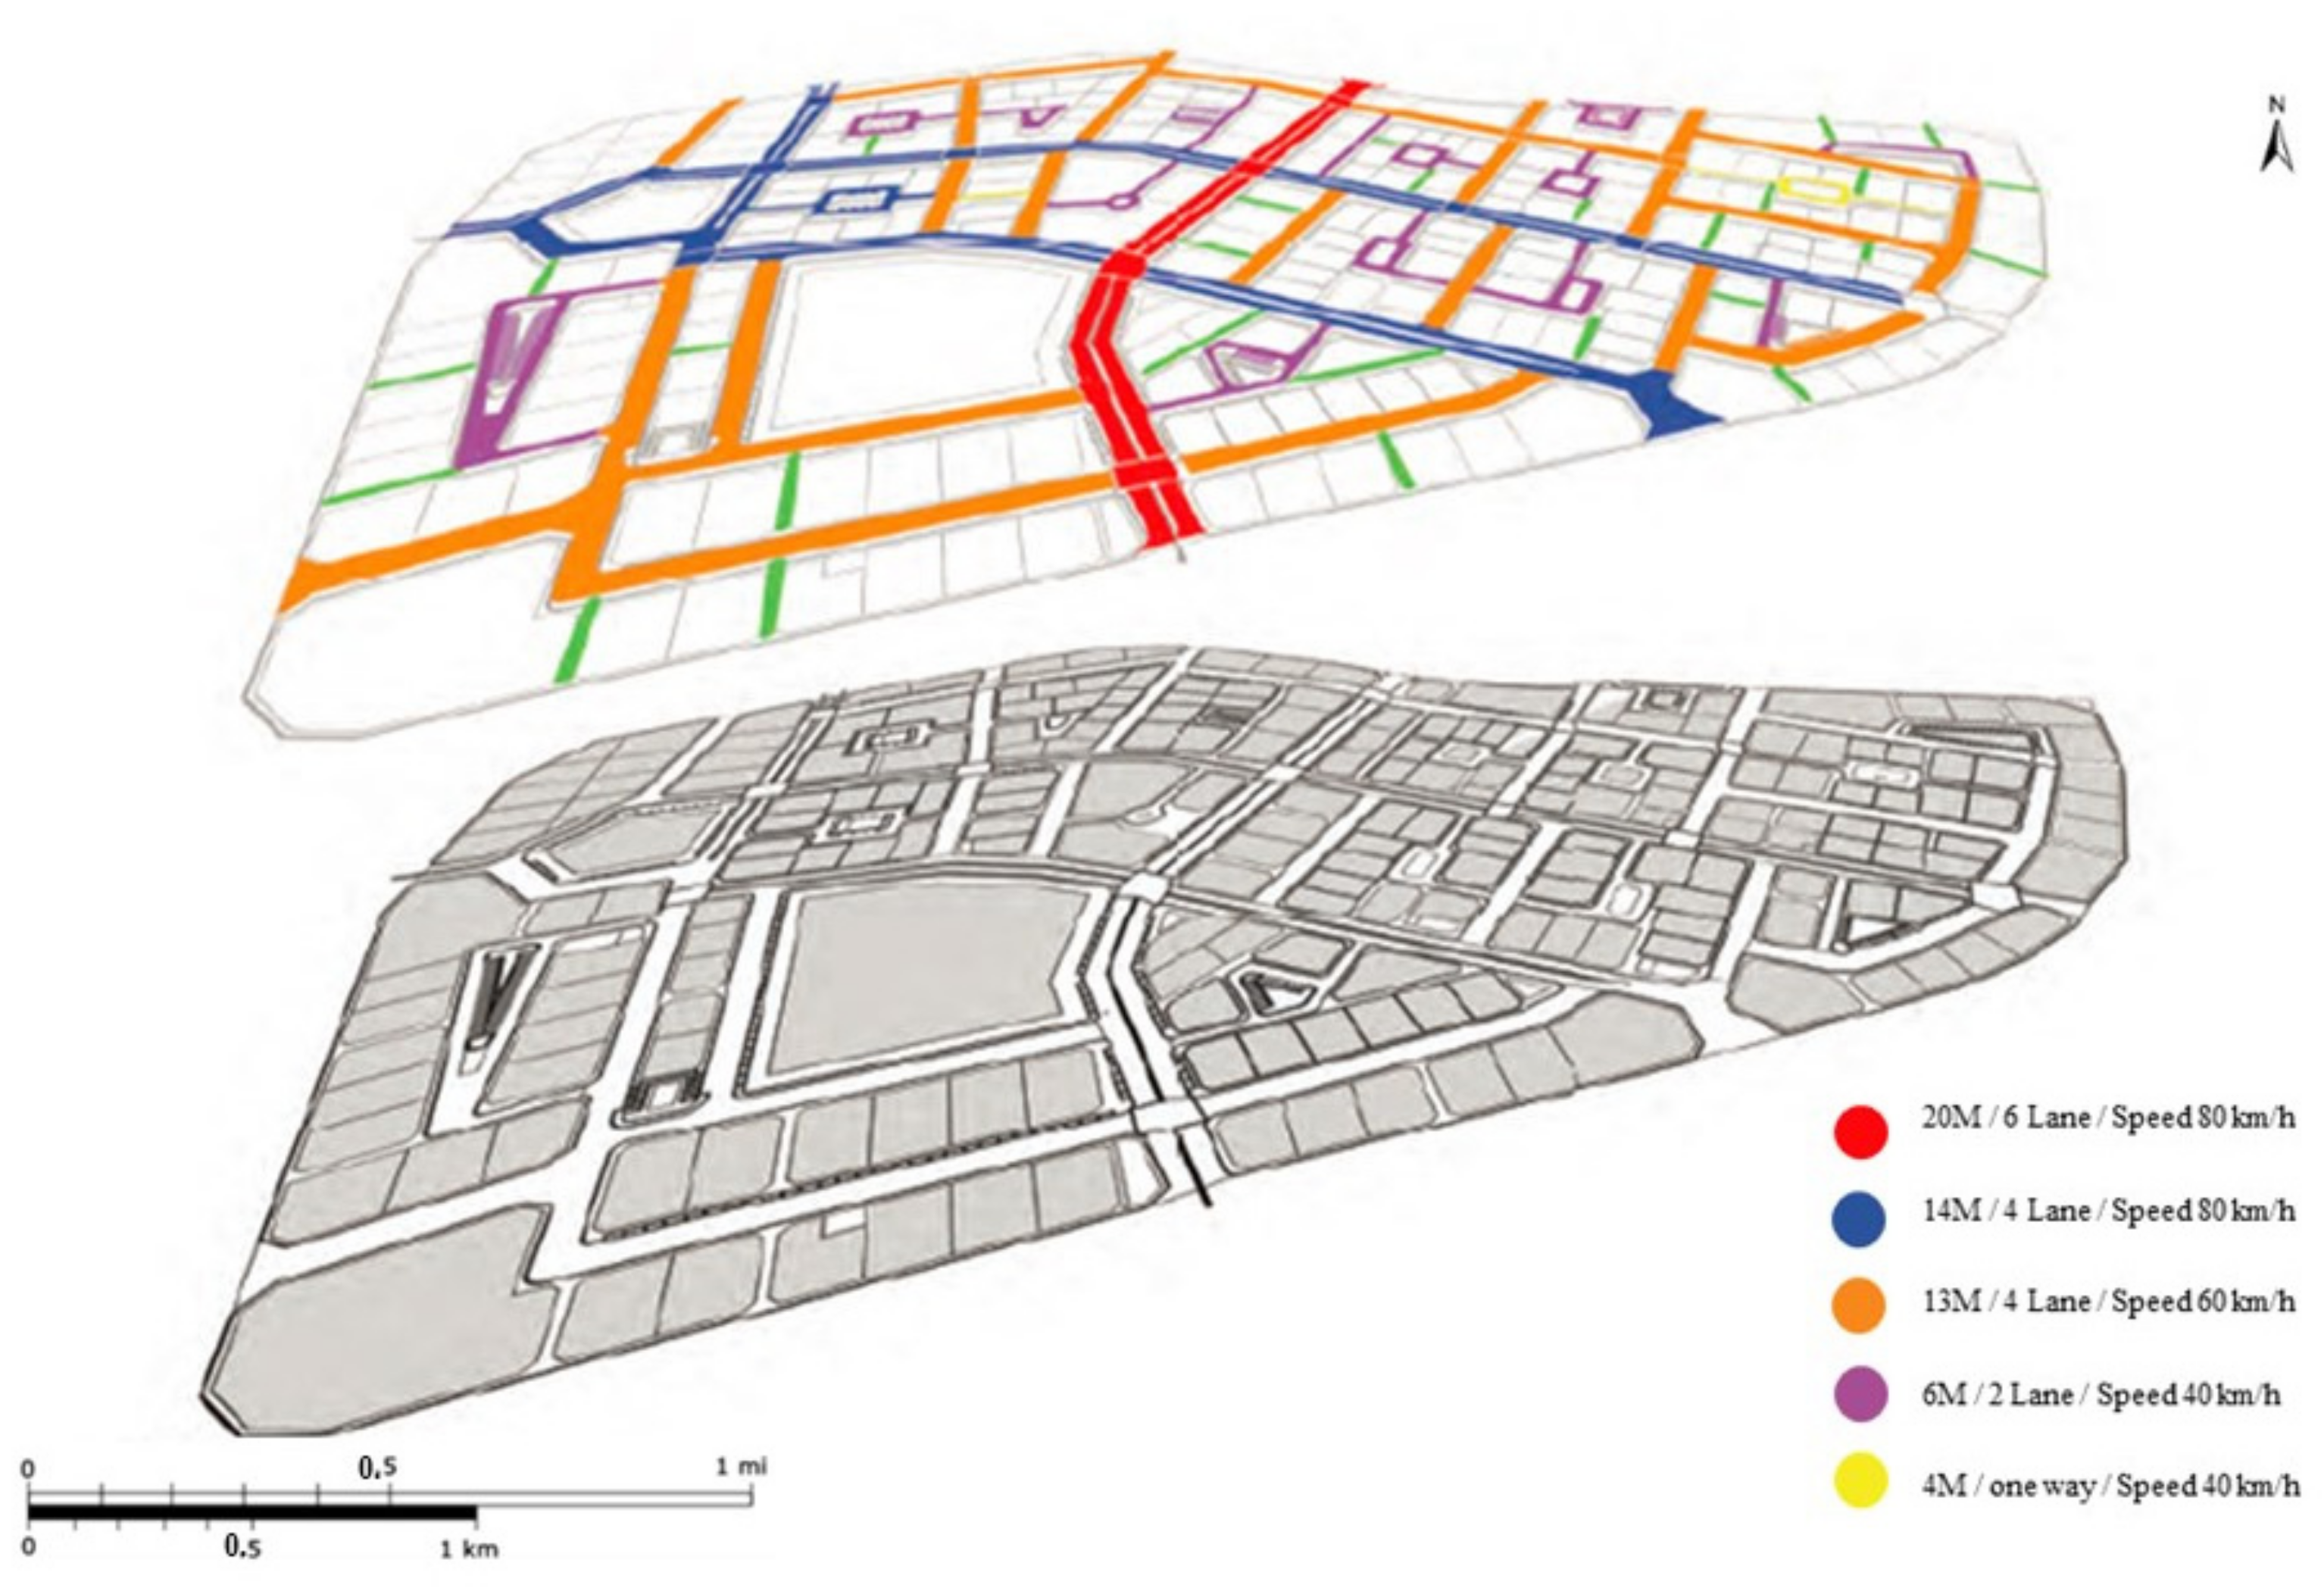
Road design. Although major roads are more useful in providing links among different areas of the city, secondary roads constitute a crucial component of the growth plan. Small thoroughfares such as alleys in the study region have a large amount of uncontrolled and confused pedestrian traffic, partially caused by a lack of sidewalks, adding to the challenges faced by both pedestrians and the area’s drivers. The alleys are small, in many cases having a capacity of only two cars (see
Figure 8), and have a general lack of movement and direction control. The overall result is a great deal of unnecessary traffic congestion and a reduction of perceived convenience on the part of the area’s users.
Landscaping and Design. The most significant ongoing change apparent in this district is the shift from older high-rise commercial buildings—owned by existing business and service center projects which define the area—to more attractive low-rise residential buildings. Automobile pathways in the area are not efficient, due to a variety of factors including a large number of ongoing construction projects and poor road design.
5. Recommendations and Conclusions
Integrating the principles of Transit-Oriented Development into urban planning in Qatar will lead to better implementation of sustainability at the levels of the built environment, transportation system, and economy. While encouraging sustainable development, it will also improve the character of local streetscapes, helping to meet the needs and objectives of Qatar’s national vision and local culture. Important components of the present study are land use and PT systems. In districts such as Al Ghanim, these systems should favor pedestrian-friendly development, as well as considering the need for sufficient off-street parking, maximization of land uses, and restricting of density to a level consistent with TOD principles.
The best approach to addressing the current issues is the implementation of “TOD-by-right,” through planning which is based on a better understanding of the causality relations among all system aspects. A key objective here is to create a system in which land can be acquired within the area, redeveloped in conformation with a TOD model, and yield profitable results. Another objective is to prevent needless complications such as site plan review processes, variances, and rezoning, which usually inhibit the development of a given area. With the need for continuously improving transport networks within neighborhoods, it is important to take actions which result in benefits for residents such as shorter and fewer daily trips. Well-planned transport networks also reduce emissions and congestion while expanding access throughout the city. The long-term outcome of TOD is a reduction of unnecessary public and individual spending, which itself ultimately leads to a better quality of life.
The design of an urban environment is successful if it creates a circulation system in which people can move about and engage with each other easily. Such a design must balance the needs of recreation, work, and housing while supporting the social characteristics of the neighborhood—togetherness and association. This can best be achieved by enhancing streets so that they serve all types of commuters, including pedestrians and cyclists, while providing freedom of choice of transport mode, suitable street designs, shaded walkways, and reduced walking distances. All of these are necessary for successful implementation of TOD in areas around transport hubs such as metro stations. It is crucial to enhance the transport system in the area, including related infrastructure such as car parking, bus stops, and buildings, so that physical movement is safe and convenient, and density and land-use diversity are maintained.
In the Al Ghanim district, it is important to incorporate designs that better support the needs and rights of pedestrians. Pedestrian-friendly urban design would greatly enhance accessibility in and around PT access points such as bus stops and metro stations, so that passengers find it easier to commute. Walking to and from transit points should be made easy and comfortable, and more bus stops should be provided, especially near metro stations.
The incorporation of mixed land uses is also vital when it comes to TOD. Affordable housing developments are often located far from commercial or urban settings, but suitable redesign of an area can allow the construction of affordable housing near needed facilities and services. Poor designs tend to result in increased transport costs in areas where people might not have enough income to cover such costs in addition to others required for day-to-day living. Conversely, mixed land uses spur socio-economic development and diversification of services and goods, making them easily accessible to all types of commuters and providing an overall boost to an area’s economy.


 ,
, 


