1. Introduction
As has been more recognized day by day, human-caused global warming and climate change over the years are pushing the world toward an apocalyptic scenario. For years, many gatherings have been held and agreements reached about environmental sustainability and measurements against global warming. For this reason, Germany has decided to focus on renewable energy in an effort to reduce greenhouse gas emissions and liaise with the Paris Agreement [
1,
2].
One of the measures taken against climate change is a focus on renewable energy such as solar power, wind power, and biogas. Biogas plants have made a considerable contribution toward this aim [
1,
3]. Due to the increasing importance of renewable energy sources, numerous studies have been conducted to optimize biogas plants’ operations. Nevertheless, Lean Six Sigma (LSS) Methodology has never been utilized as a structural and statistical approach for process optimization in biogas plants and anaerobic digestion.
Anaerobic Digestion (AD) is a complex biochemical process that degrades organic materials into biomass and biogas with the help of anaerobic bacteria in an oxygen-free environment. This degradation occurs sequentially through hydrolysis to convert complex organic materials into amino acids, sugar, and fatty acids. The next stages of anaerobic digestion include:
- (1)
Acidogenesis, where the bacteria transform the previous outputs to lower fatty acids.
- (2)
Acetogenesis, which transforms lower fatty acids into acetic acid, hydrogen, and carbon dioxide.
- (3)
Methanogenesis, where the biogas methane and carbon dioxide are produced [
3,
4,
5].
Since anaerobic digestion happens through complex biochemical reactions, operational process parameters are of utmost importance. For example, the organic loading rate (OLR), hydraulic retention time (HRT), mixing, and pH are some key operational parameters for a biogas production process. Nsair et al., reviewed the operational parameters for biogas technology in 2020, and in particular, the importance and effect of temperature and mixing have recently been intensively studied in order to simulate the best operating conditions for a biogas plant [
6,
7,
8].
Several studies have also been carried out in different types of operational environments around other operational parameters such as the total organic carbon (TOC), total nitrogen, particle size, total solids, characteristics of feeding, HRT, OLR, and pH. As mentioned above, the studies aimed to define the best individual conditions for biogas production and directly-related anaerobic digestion [
9,
10,
11,
12].
Last but not least, some modern statistical approaches such as machine learning and predictive analytics have been used to define and predict a better combination of operational parameters in several different scales of biogas production [
13,
14,
15].
For this article, laboratory experiments were studied to be able to simulate biogas plant operation for implementation of the ‘analyze’ phase of the Define–Measure–Analyze–Improve–Control (DMAIC) cycle of Lean Six Sigma (LSS) methodology. In this study, the feasibility and a possible way to apply the Lean Six Sigma methodology in a large-scale biogas plant were demonstrated using laboratory analysis. Not only the results of this study, but also the way of working can be considered as a guideline in any process optimization project in biogas plants. Since it is not always possible to simulate different scenarios for different parameters in a large-scale biogas plant, simulation of different operational and environmental parameters in a scaled-down laboratory environment is proposed.
2. Materials and Methods
Lean Six Sigma’s analyze phase aims to assess data collected from a biogas plant to determine possible causes of low efficiency and their impacts. The Lean Six Sigma method can be carried out according to the DMAIC cycle (Define–Measure–Analyze–Improve–Control). In the Define phase, the problem, the goal, the stakeholders, the project scope, and the schedule are defined. In the Measure phase, the problem is quantified and Key Performance Indicators (KPIs) are identified. In the Analyze phase, which is also the focus of this article, the root cause of the problem is identified. Solution ideas are defined for the identified cause (s) in the Improve phase, and the Control phase ensures that the achieved level of the process is maintained and the gains are sustained.
An Ishikawa Diagram is used in the beginning of the Analyze phase to determine reasons for lower-than-expected biogas production in the plant. Daily biogas generation by the studied biogas plant was approximately 20% lower than the planned capacity in 2020. This study’s experimental design is based on the following root causes for the low biogas production:
- (1)
Loss of possible substrates (which have particle sizes of 60–120 mm and >120 mm) to the composting process rather than anaerobic digestion.
- (2)
Addition of the composting leachate, which has an acidic content, to the process.
- (3)
High sand content of biowaste fed into the system.
- (4)
Long storage time of the substrate, causing degradation.
- (5)
Longer hydraulic retention time (HRT).
This section will explain the analysis for each of the above-mentioned causes. The experimental setup and materials are prepared based on the German Standard VDI 4630 for performing a biomethane potential test (BMP). Performed BMP analyses are summarized in the Table below (see
Table 1).
In addition to the BMP test, total solids (TS), volatile solids (VS), and pH analyses were conducted for the substrate, digestate, and test samples. Furthermore, the sand contents of the different substrate streams were determined in this study’s scope to design an experiment for the impact of the sand content in biomethane production efficiency. Substrate and digestate samples were collected from the industrial-scale biogas plant, and homogeneous mixtures were provided. As an inoculum, digestate samples were used. All analyses were performed in three parallels. The temperature of the tests (55 °C) was determined based on the operation temperature of the reference biogas plant. The test duration alternated between 33 to 37 days, based on the produced biomethane amount in the test period’s last days.
2.1. BMP Test Design
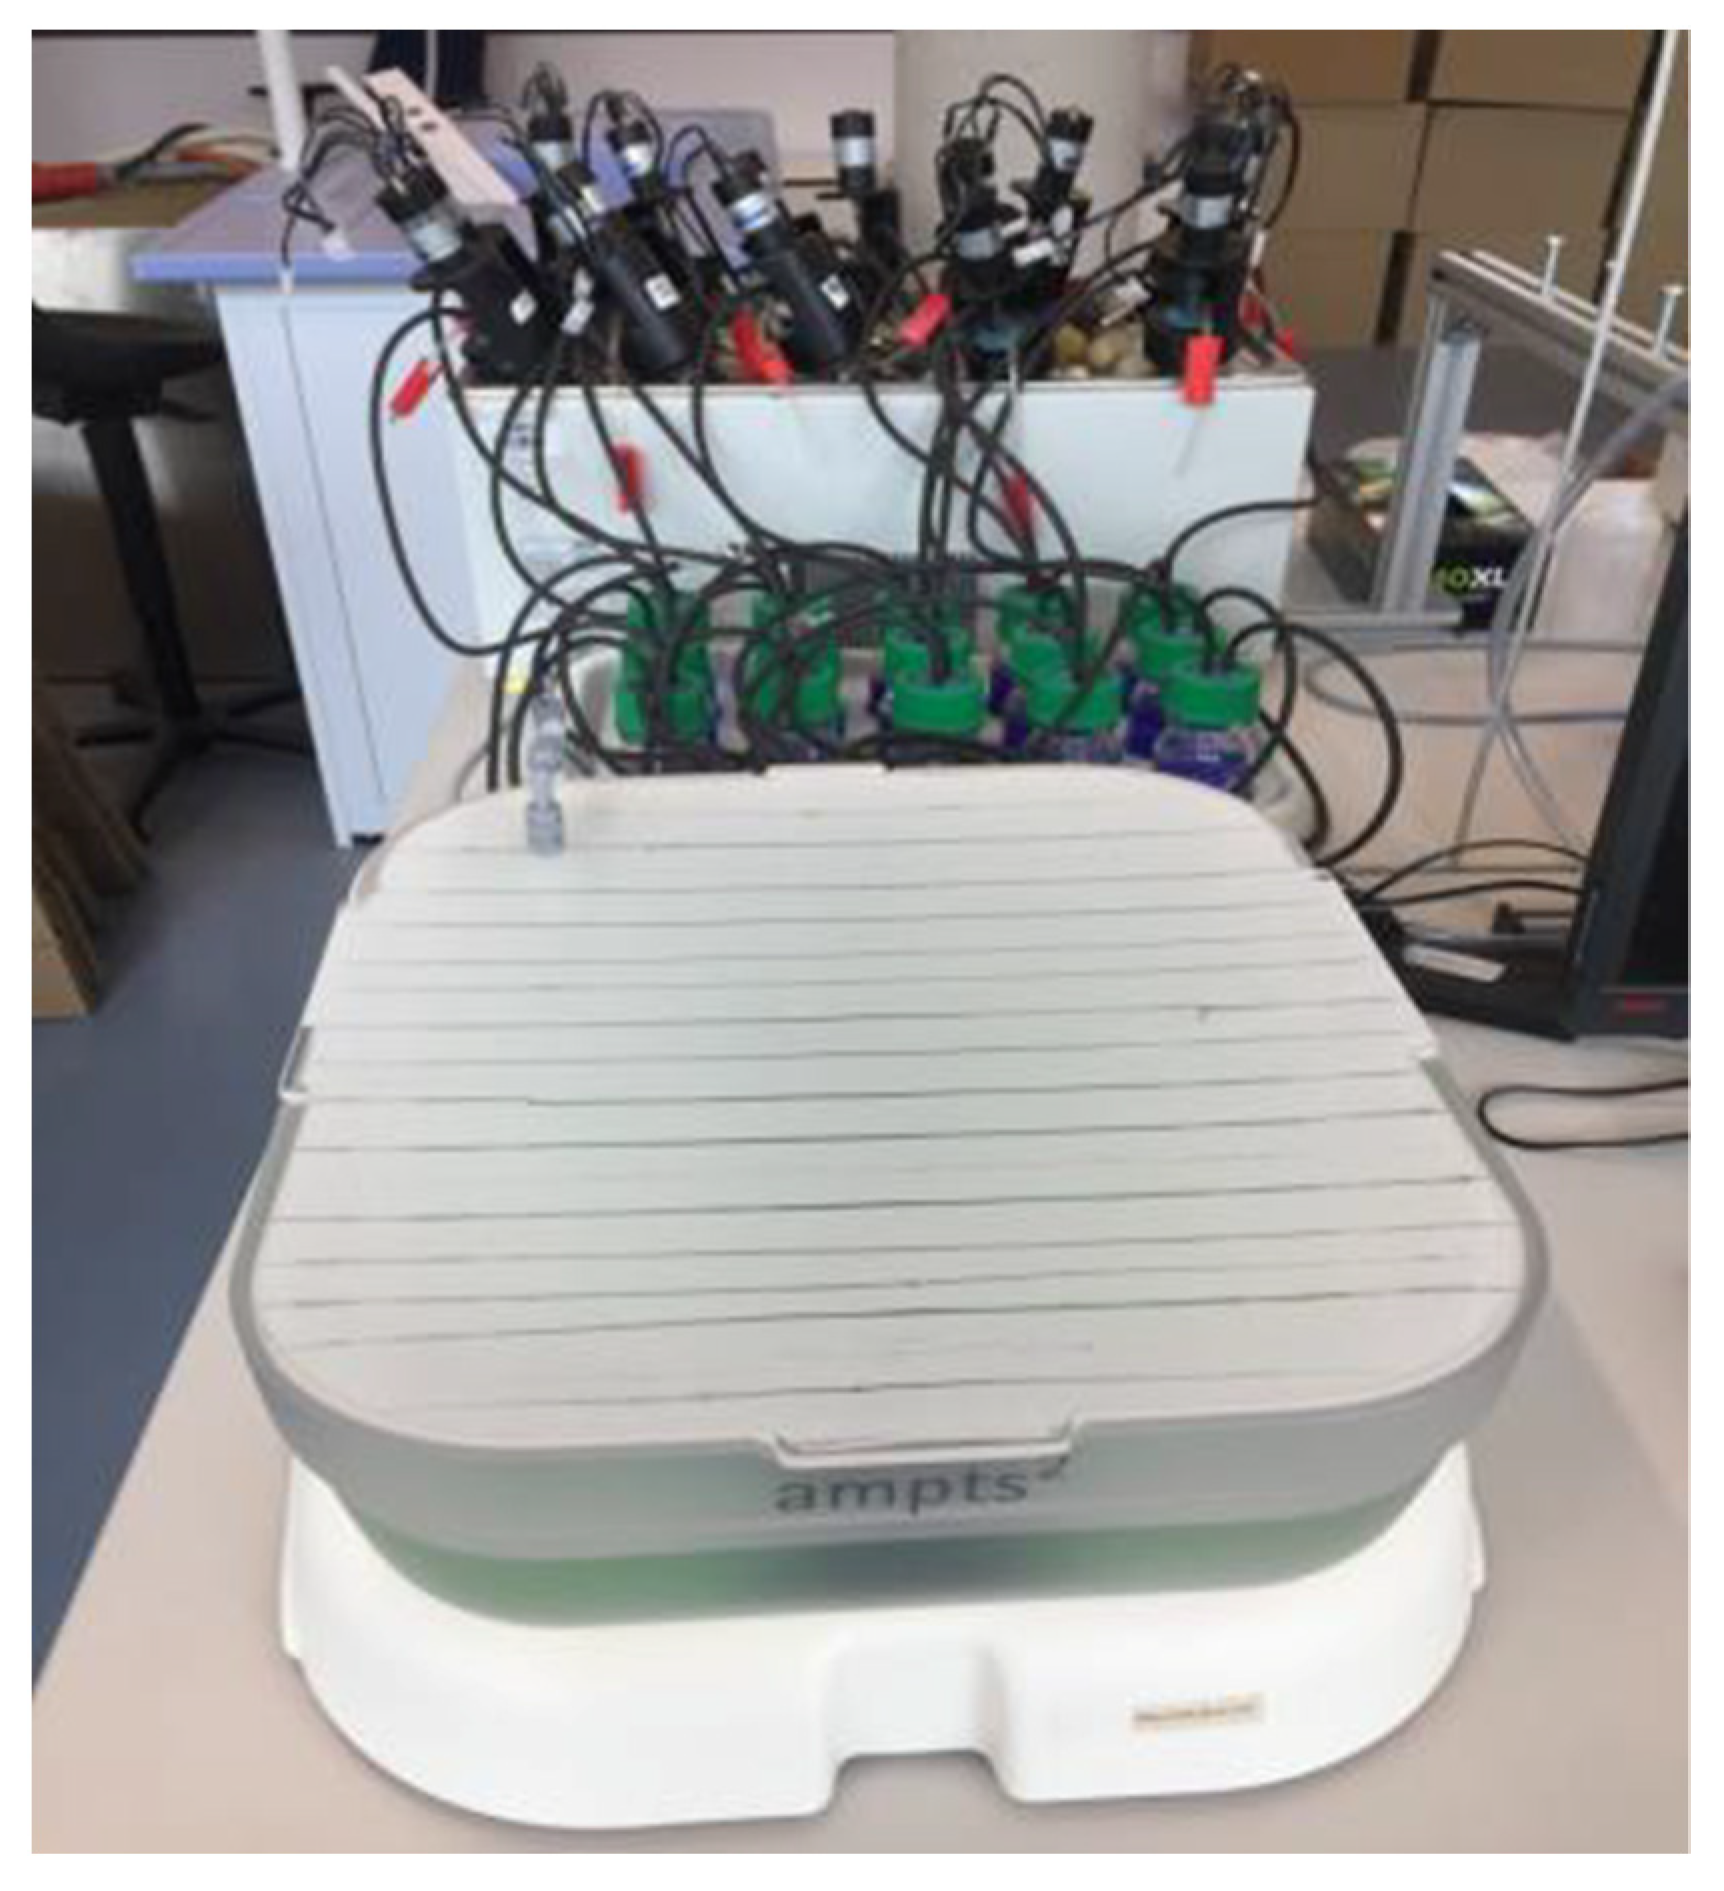
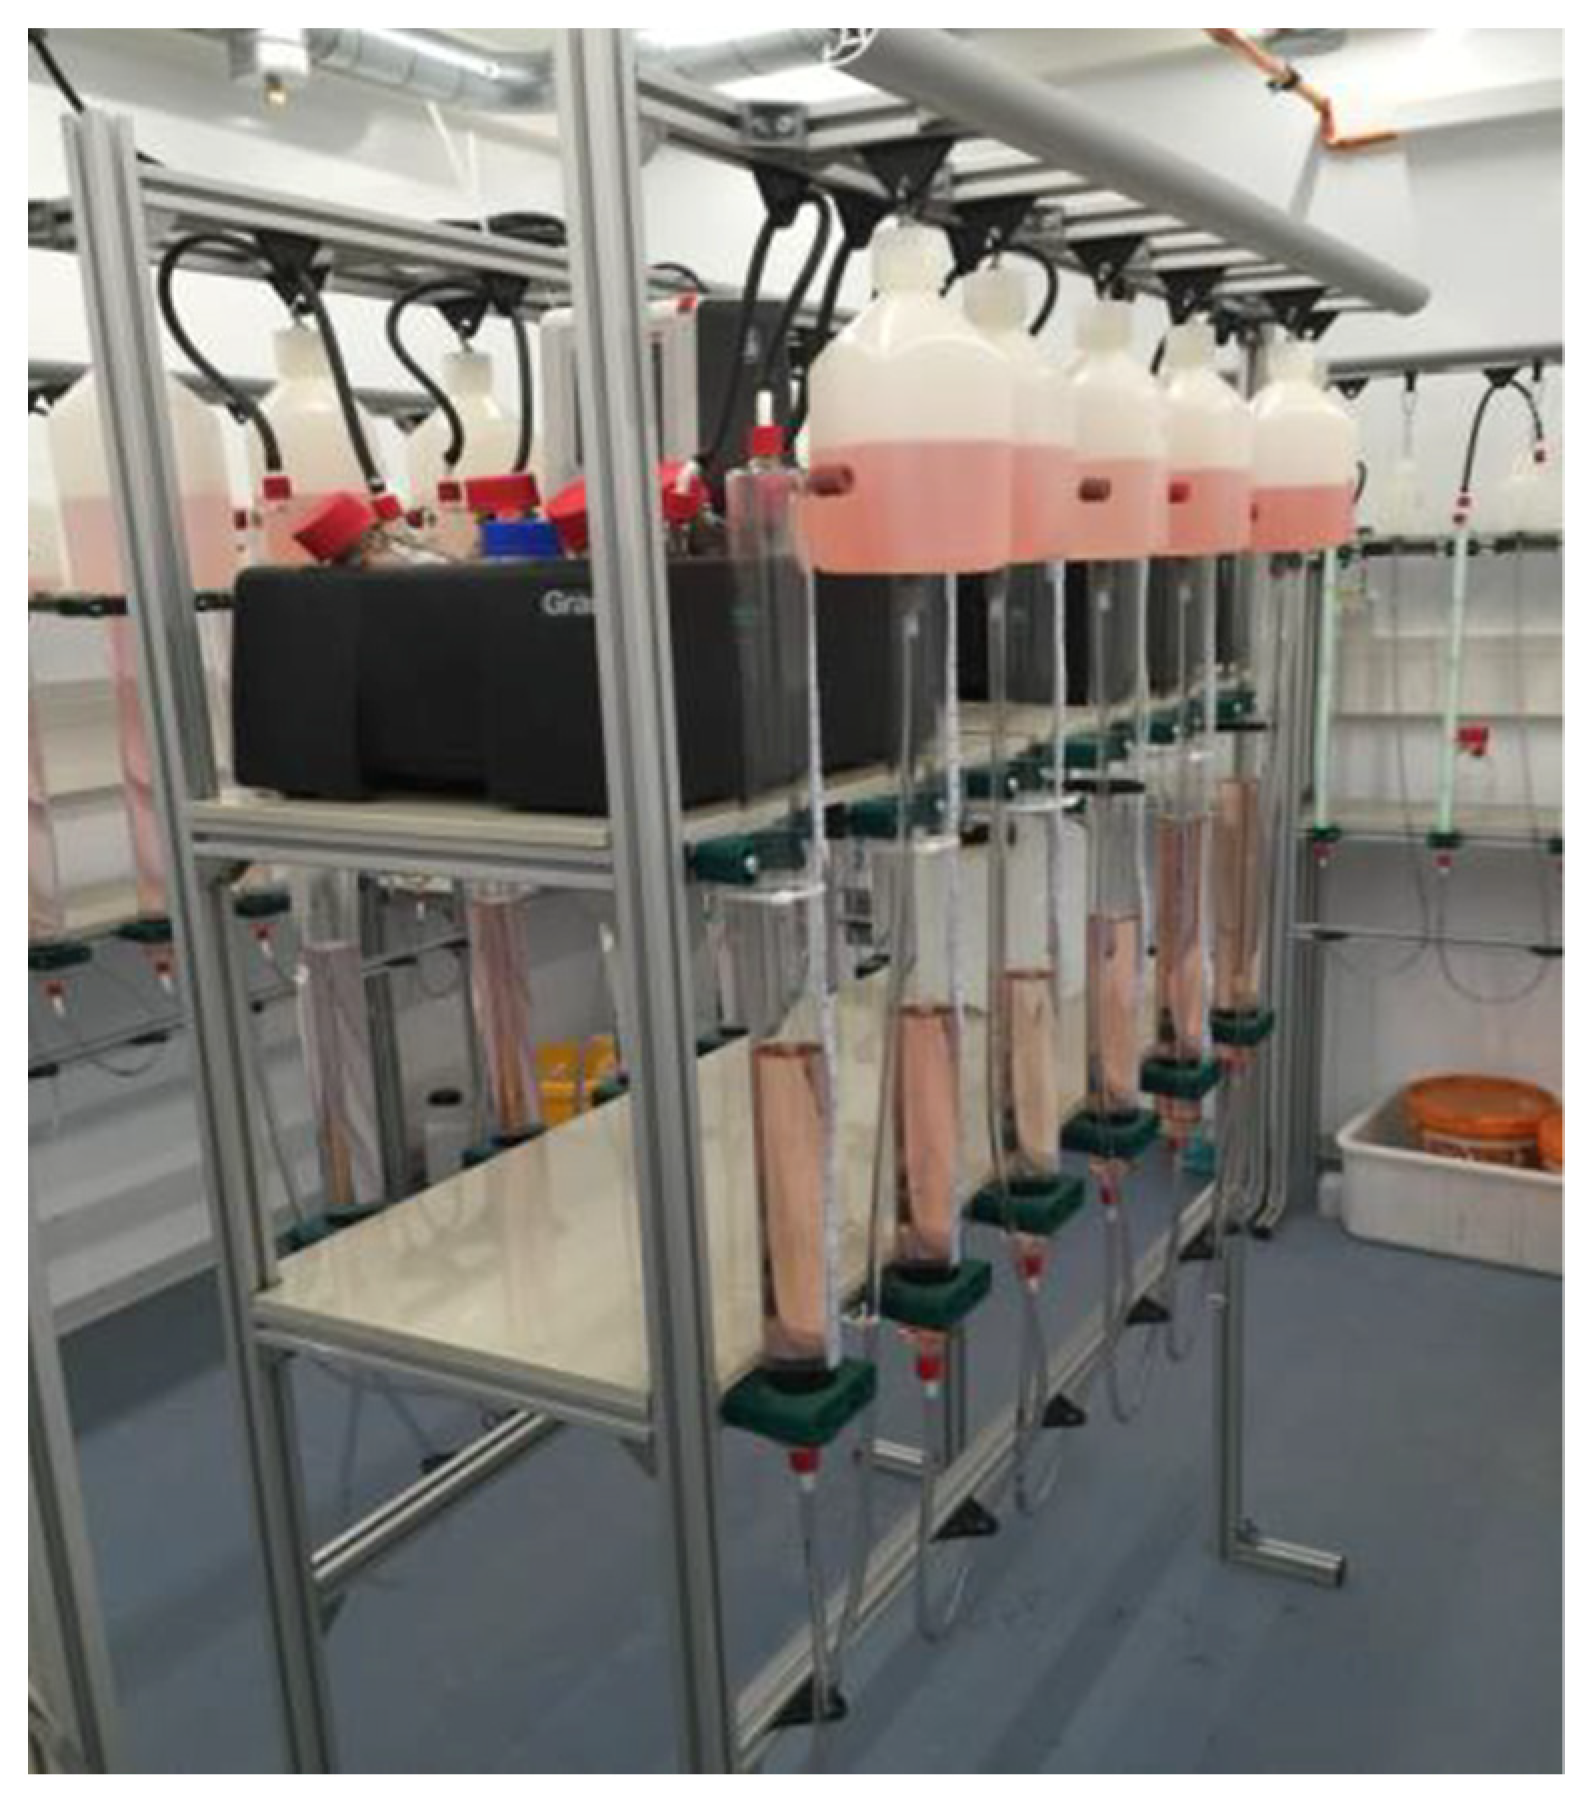
In the BMP tests, two different systems were used: AMPTS II and a climate-controlled room with a eudiometer. The details were explained in the study performed by Onen Cinar (2021) [
16]. Half-liter glass reactors were used for all analyses, and daily hand mixing was implemented in the reactors. In each section, approximate amounts are listed for the mixtures mentioned. Nevertheless, exact weight information was used for the calculations for each reactor. In the tests performed with the eudiometer, the biogas content was determined regularly by using gas chromatography (GC). In general, inoculum–digestate mixing amounts were determined based on the following equation (Equation (1)) [
17]:
2.2. Determination of the TS Content
Samples were weighed in crucibles as wet samples before putting them in a 105 °C oven. After constant weight was achieved at 105 °C, samples were kept first in a desiccator to reach room temperature and then weighed. The TS content was calculated as in Equation (2), where
W1 is the weight of the empty crucible and the dried sample,
W2 is the weight of the empty crucible, and
W3 is the weight of the empty crucible and the wet sample [
18].
2.3. Determination of the VS Content
After the TS analysis, the VS analysis was performed with the same crucibles, using a muffle oven over five hours to burn down all of the sample’s organic content. Equation (3), where
W4 is the weight of the empty crucible and the residue after ignition, was used for the calculation of the VS content in TS [
19].
2.4. Analyzing the Impact of the Substrate Waiting Time on the Biomethane Production Efficiency
In order to determine the impact of the substrate waiting time on the biomethane production efficiency, a BMP test was performed by implementing five different scenarios:
- (1)
Blank (digestate),
- (2)
Fresh biomass + digestate,
- (3)
Old biowaste + digestate,
- (4)
Biowaste from mixer + digestate,
- (5)
Reference + digestate.
A reference set was performed to evaluate the inoculum’s performance, for which cellulose was chosen as a substrate. Approximately 170 g of digestate and 20 g of substrate were added to the reactors. A reference sample was prepared by mixing approximately 2.5 g of Cellulose (Avicel® PH-101, 50 µm) and 170 g of digestate. To supply a homogeneous mixture in the reactor, materials were mixed carefully before starting the test. A pH measurement was performed in each bottle before and after the test. Before connecting bottles to the AMPTS II system, a one-minute nitrogen flush was conducted to supply anaerobic conditions. During the analysis, reactors were kept in the water bath at 55 °C. Biomethane generation data were recorded automatically in AMPTS II software.
2.5. Assessment of the Impact on the Input Stream on the Biomethane Production Efficiency
The studied biogas plant consists of a composting plant and a biogas plant. To separate input streams between these plants, sorting was implemented based on the size of the materials. This method separates the waste into three different streams:
- (1)
Smaller than 60 mm,
- (2)
Between 60 mm and 120 mm,
- (3)
Larger than 120 mm.
The aim of this analysis was to determine how much biogas potential is lost to the composting stream. To determine this amount, a BMP test was implemented with each fraction as well as the reference sample. The same amounts were implemented and the same procedure conducted with these samples as in
Section 2.4.
2.6. Determination of the Substrate’s Sand Content’s Effect on the Biomethane Generation Efficiency
Unlike the other analyses, in this section, different waste streams’ sand content was determined first. Afterwards, experiments were performed with different scenarios to evaluate the feasibility of sand pre-treatment.
2.6.1. Determination of the Sand Content in the Biowaste
No adequate method for determining impurities in wet biowaste has been in practice. Due to the fibrous components of the biowaste, performing an analysis with wet samples is very difficult and time consuming. The method used in this study was improvised from the study conducted by Jank et al., (2016). The sand content was classified as:
- (1)
>2 mm gravel,
- (2)
0.63–2 mm sand,
- (3)
0.1–0.63 mm fine sand,
- (4)
0.06–0.1 mm very fine sand [
5,
20,
21,
22].
The sand content of all substrate streams at the biogas plant was determined. The streams were:
- (1)
>120 mm biowaste fraction,
- (2)
60–120 mm biowaste fraction,
- (3)
<60 mm biowaste fraction,
- (4)
Fresh biowaste,
- (5)
Old biowaste,
- (6)
Substrate from substrate storage.
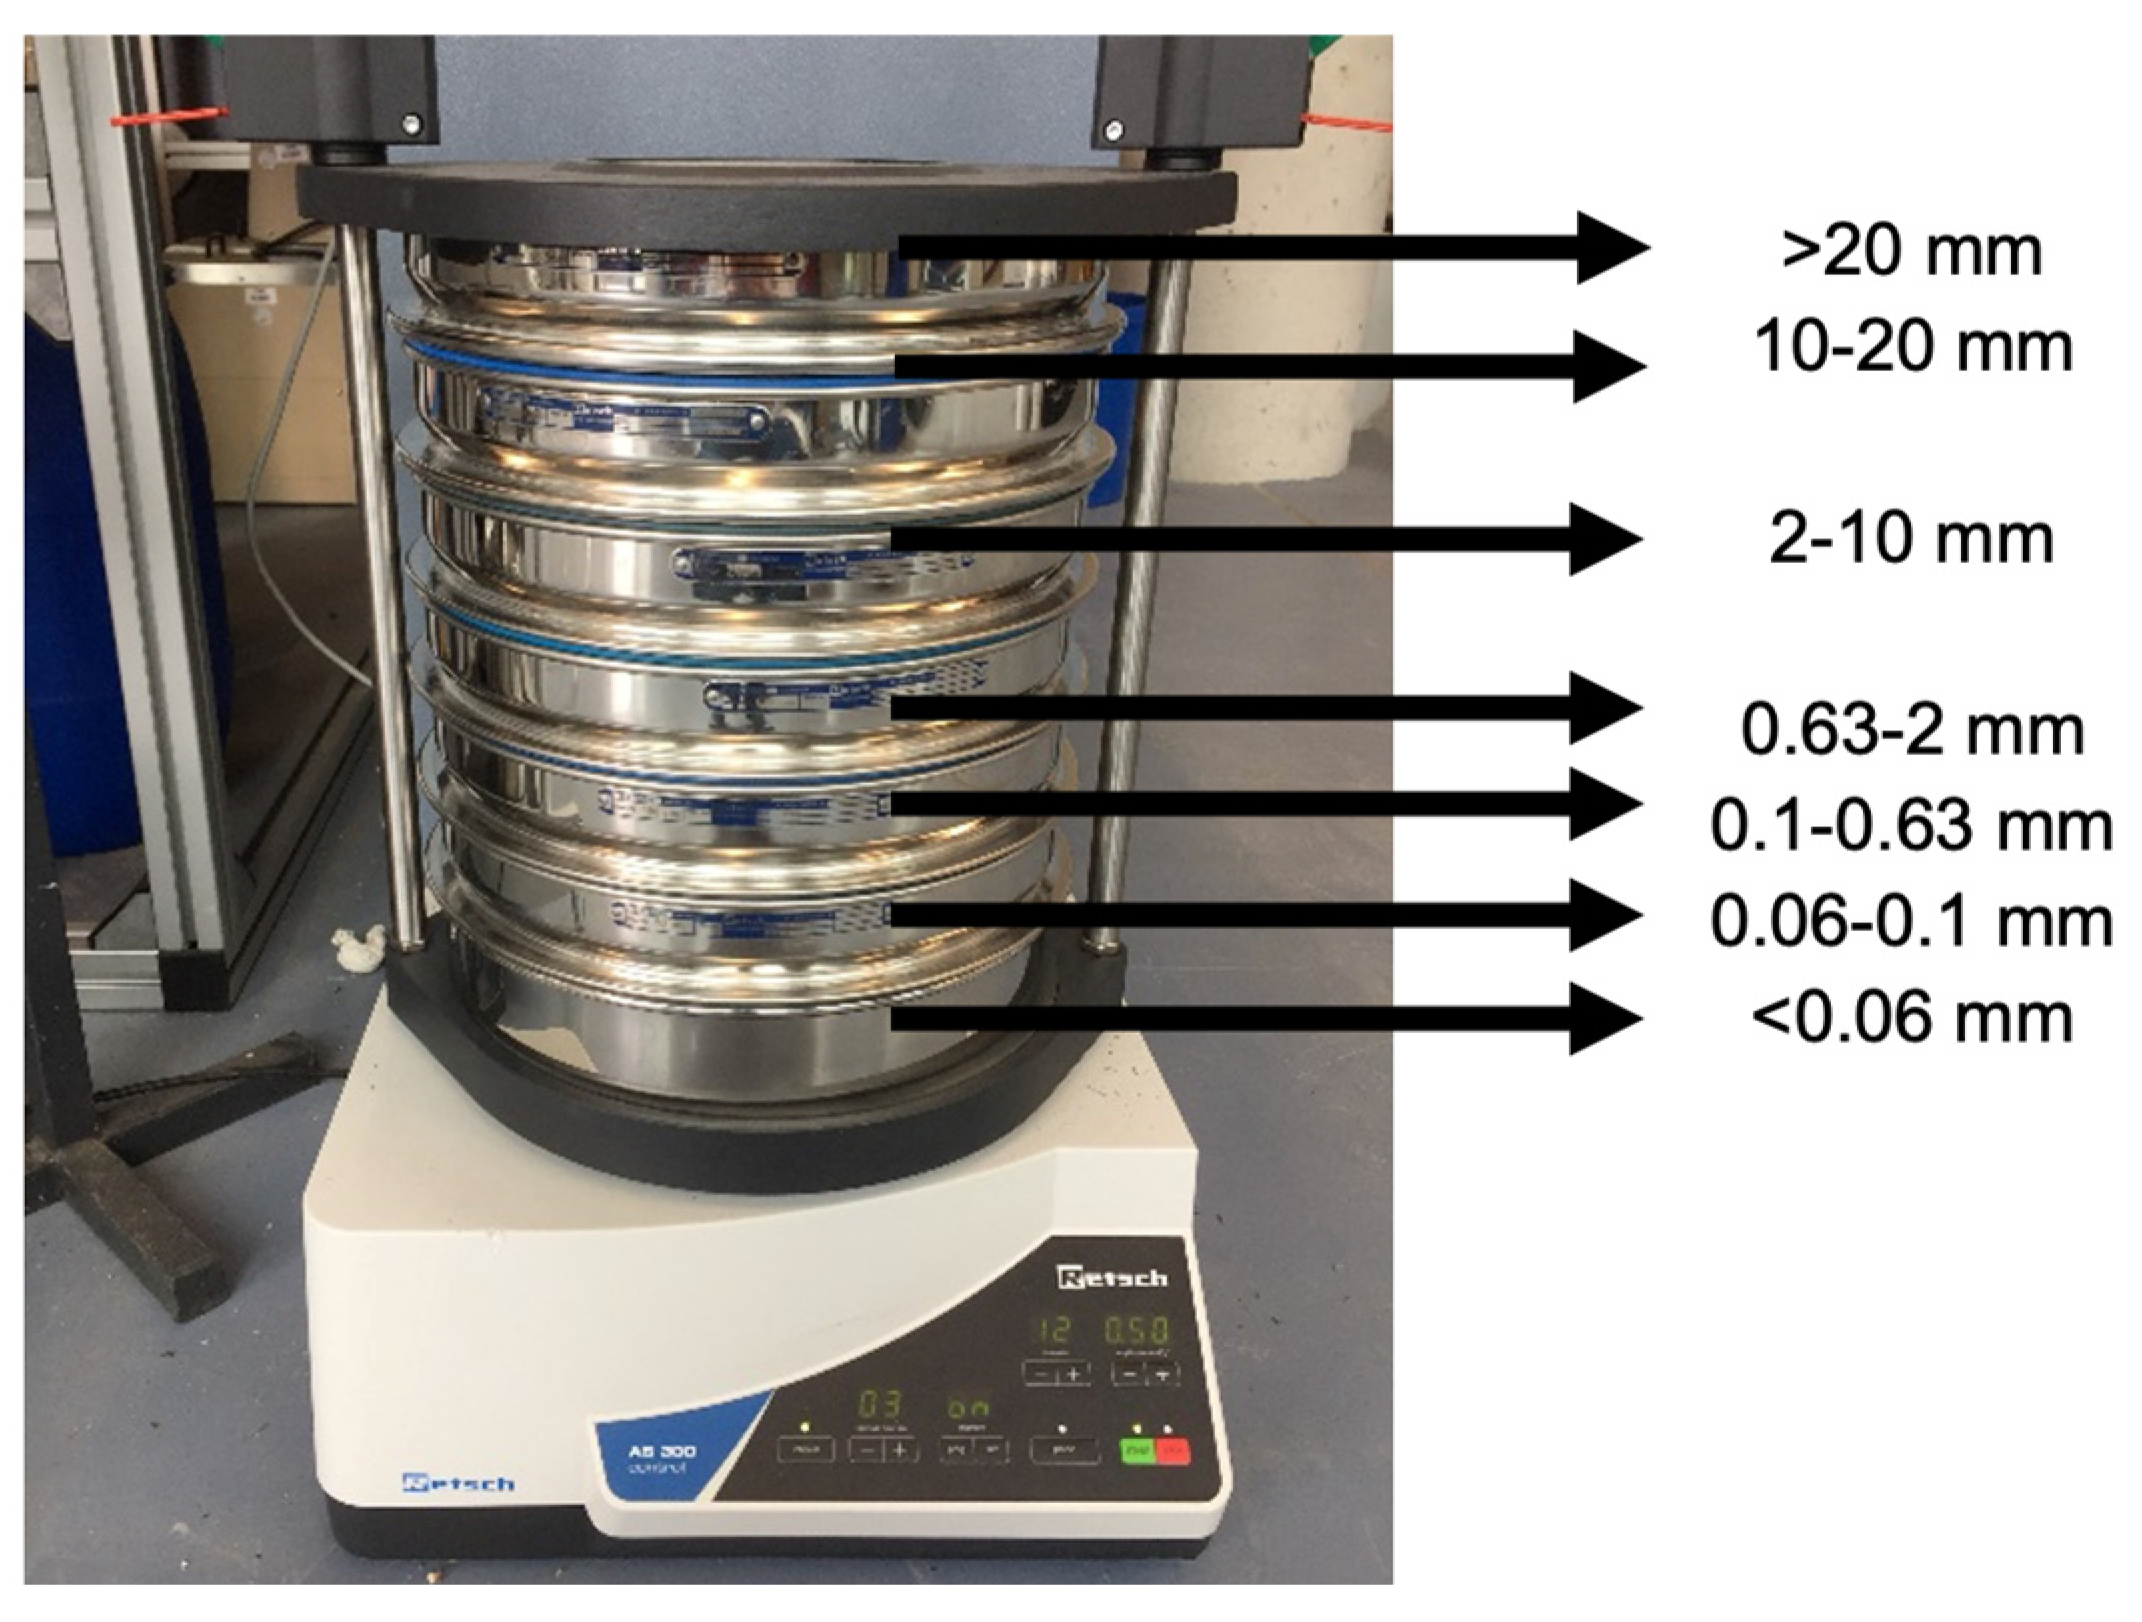
First, the substrate samples from all of those fractions were dried at 105 °C. Dried samples were analyzed in a vibratory sieve shaker (Retsch, AS 300) as represented in
Figure 1. The implemented settings were:
- (1)
0.5 mm g-1 amplitude,
- (2)
10-min duration,
- (3)
10-s interval time.
Figure 1.
Vibratory sieve shaker and sieve sizes.
Figure 1.
Vibratory sieve shaker and sieve sizes.
The contents obtained from each sieve were weighed, and a 0.06–2 mm fraction was used to obtain sand content data from the substrates. To determine and exclude organic content, the VS content of each fraction was determined, which was used to calculate the real sand content in the samples.
2.6.2. Assessment of the Impact of the Sand Content on the Biomethane Potential of the Biowaste
In this analysis, dried, ground substrate from substrate storage (which is currently fed into the biogas reactor) was used. The substrate–sand mixtures were prepared in the following way:
- (1)
Blank: Only digestate,
- (2)
No sand in the substrate: Dried substrate (100%) + digestate,
- (3)
10% (w/w) sand in the substrate: Dried substrate (90%) + sand (10%) + digestate,
- (4)
20% (w/w) sand in the substrate: Dried substrate (80%) + sand (20%) + digestate,
- (5)
40% (w/w) sand in the substrate: Dried substrate (60%) + sand (40%) + digestate.
Approximately 200 g of digestate was mixed with approximately 8.4 g of total mass (substrate–sand). The test was performed in an AMPTS II test system at 55 °C, following the same procedure mentioned above for other analyses (
Figure 2).
2.7. Determining the Impact of the Leachate Addition Amount on the Biomethane Efficiency
As has been mentioned, the studied plant consists of a biogas plant and a composting plant. To improve the efficiency of the biogas, plant leachate from the composting plant is used, which can have high acidic content. The possible negative impact of leachate on the efficiency was evaluated in this section. Four scenarios were implemented based on scaling down the reactor and leachate volumes from real scale to the laboratory reactors. The reactors were prepared as follows:
- (1)
Blank: Only digestate,
- (2)
No leachate in the system: <60 mm biowaste + digestate,
- (3)
4.5 mL leachate: <60 mm biowaste + digestate + 4.5 mL leachate,
- (4)
2.3 mL leachate: <60 mm biowaste + digestate + 2.3 mL leachate.
Approximately 200 g digestate and 20 g substrate were mixed in the 500 mL reactors. The same procedure was implemented as in the previous analyses. A BMP test system with a eudiometer was used for this analysis as can be seen in
Figure 3.
For the experiments, the samples were taken at different points in the plant at different times. The first samples were taken in July 2021 in the two-stage dewatering unit of the biogas plant, and the second sampling took place in September 2021 in the digester.
3. Results and Discussion
This section is classified under five subsections based on the defined possible root causes (in
Section 2) of inefficient biomethane generation in the biogas plant. The possible reasons are:
- (1)
Loss of possible substrates due to the different biowaste streams,
- (2)
Addition of leachate to the system,
- (3)
High biowaste sand content,
- (4)
Long biowaste storage time after arriving at the plant,
- (5)
Short HRT.
3.1. Results of Evaluating the Impact of the Substrate Waiting Time
In general, biowaste is collected once a week from households and brought to the studied biogas plant. Varying amounts of waste collected in different seasons causes the accumulation and a long waiting time (up to 21 days) of biowaste. The aim of this experiment was to determine the impact of the substrate waiting time on the biomethane generation efficiency. From the first storage area, fresh substrate (which had arrived on the analysis day) and stored substrate (which had waited 14 days) were analyzed. In addition, to evaluate the current situation, old substrate from substrate storage (just before feeding it to the fermenter) was collected.
The TS contents of the analyzed substrates were as follows in
Table 2:
In addition, VS analyses were as follows in
Table 3:
As represented in
Table 4, the highest specific biomethane production was obtained from fresh substrate:
The results showed that almost half of the biogas capacity of the substrate was lost due to the waiting time in the arrival/storage area. Furthermore, the loss could also be caused by the inclusion of 60–120 mm and >120 mm particles in the fresh substrate as well as in the old substrate.
From biowaste’s generation to its arrival at the facility, its water content starts to evaporate and its material starts to degrade [
23]. The physicochemical characteristics of the biowaste change and the hydrolysis process starts, which leads to aerobic and anoxic conditions that are already in the produced biowaste within the storage time. A study performed by Degueurce et al., (2020) showed that 61–70% of the initial material remains at the end of the storage period and leads to a 44% decrease in the BMP potential [
24]. This study’s results show a similar trend that must be optimized for a more efficient process.
3.2. Results of the Impact of Input Streams on the BMP Potential
At the biogas plant being studied, the input stream is sorted based on the size of the material—<60 mm, 60–120 mm, and >120 mm. The fractions 60–120 mm and >120 mm are sent directly to the composting plant. This test’s target is to evaluate the usage possibility of these two streams in the biogas plant and compare them with the current situation. The specific BMP results of these streams are as follows:
- (1)
770.6 ± 93.3 NmL (g VS)−1 for the stream >120 mm,
- (2)
441.8 ± 41.3 NmL (g VS)−1 for the stream 60–120 mm,
- (3)
242.2 ± 44.4 NmL (g VS)−1 for the stream <60 mm.
The results show that unused substrate streams at the biogas plant have greater BMP potential than the used stream, as represented in
Table 4.
The TS and VS contents of those streams are:
- (1)
39.14 ± 0.92% TS and 56.24 ± 1.47 VS for <60 mm,
- (2)
37.93 ± 1.21% TS and 26.74 ± 0.44 VS for 60–120 mm,
- (3)
28.14 ± 3.13% TS and 22.53 ± 0.65% VS for >120 mm.
3.3. Results of Sand Analysis
Impurities (plastic bags, glass, stone, sand) in the biowaste can cause component failure and pipeline blockage [
5,
20,
21,
22]. This test aimed to measure the biowaste’s sand content and determine how it impacts the BMP capacity.
3.3.1. Results of the Sand Fraction Determination
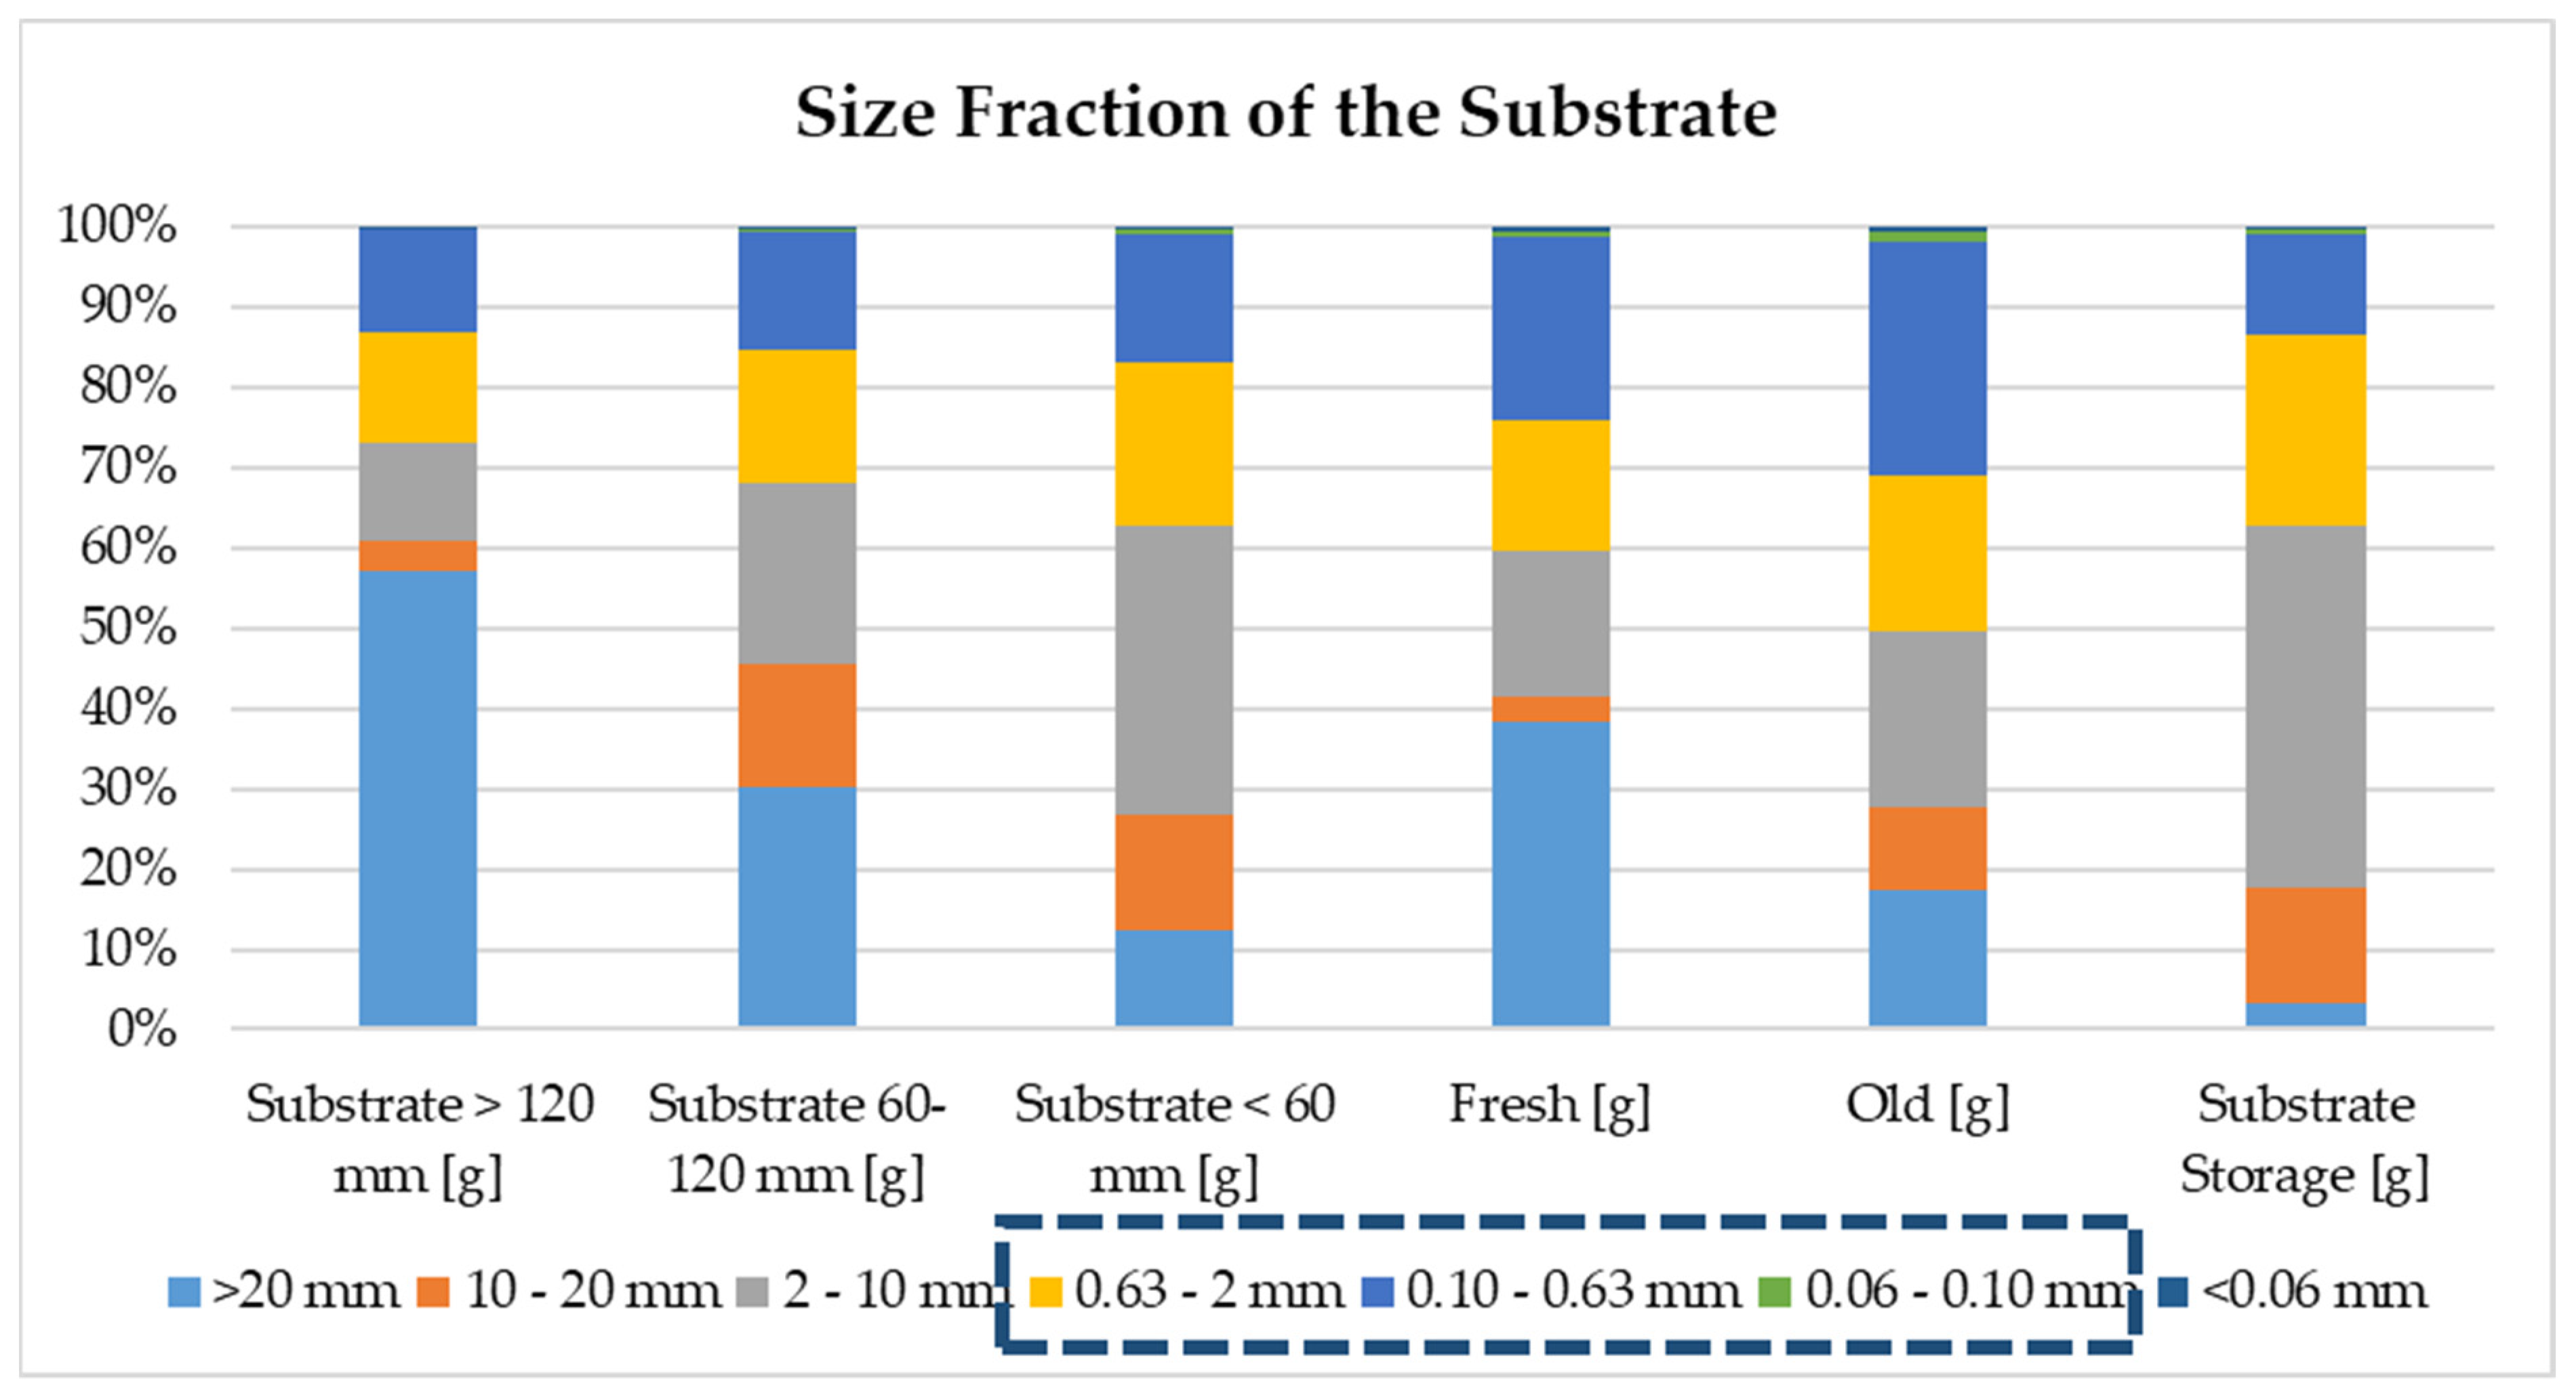
As mentioned in this paper’s
Section 2, the dried biomass was classified under seven different sizes, and three different sizes are used to determine the biowaste’s sand content. All fractions detected in biowaste are summarized in
Figure 4.
After the VS and TS analyses of each fraction, sand in TS and sand in VS were obtained as a mass percentage (see
Table 5). The highest sand content was obtained from old substrate, followed by fresh substrate.
3.3.2. Results of the Determination of the Biowaste Sand Content Impact on the BMP Efficiency
Since different substrate streams contain varying sand contents, the impact of the sand content on the biomethane production efficiency is an important parameter for a biogas plant. Four different scenarios were used in this test to analyze the necessity of pretreatment to remove sand from the biowaste. The chosen sand contents (%, w/w) were:
- (1)
No sand,
- (2)
10% sand,
- (3)
20% sand,
- (4)
40% sand.
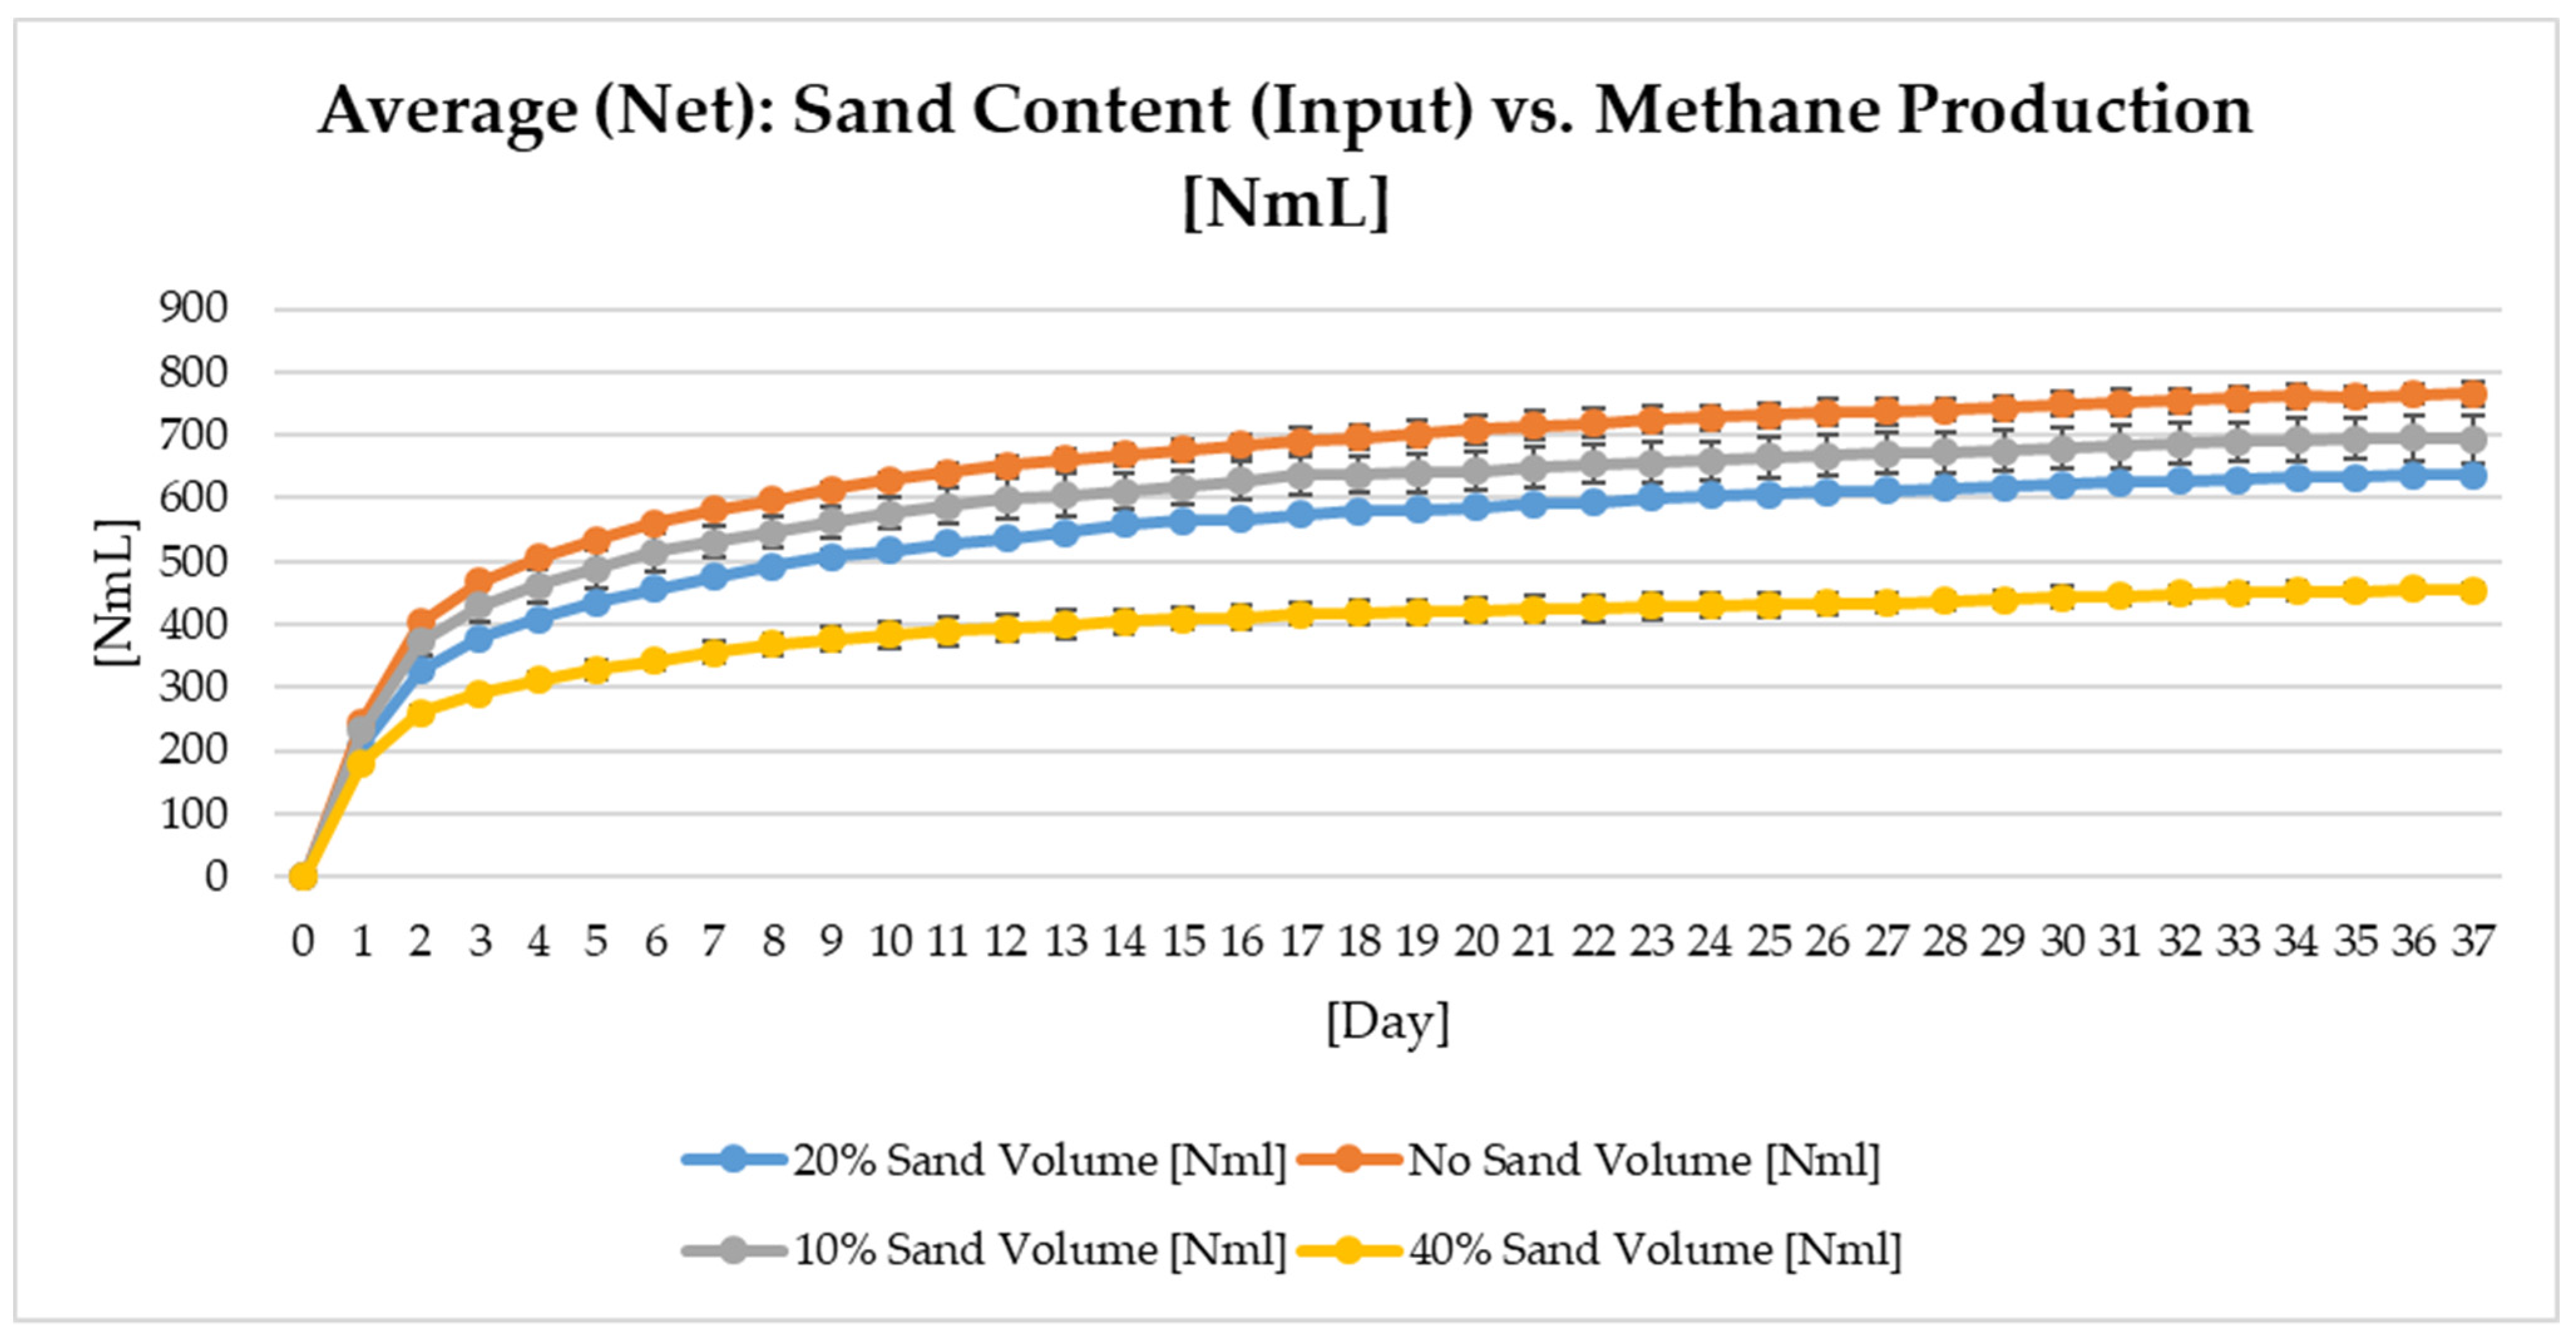
As displayed in
Figure 5, an increase in the sand content and a decrease in the organic content in the biowaste led to a decrease in the daily/cumulative biomethane generation.
Since the same biomass was used in each reactor, specific biomethane generation under different sand concentrations did not vary much, which shows that the sand content’s impact on the contact between microorganisms and the substrate was negligible in small-scale reactors. However, this kind of problem may occur in a large-scale plant as well as the accumulation of inorganics in the reactor within the operation time [
16].
3.4. Results of the Impact of Leachate Recirculation on the Biogas Reactor
Leachate in a composting plant is generated from the biowaste’s water content. To improve the microbial community in the anaerobic digestion process, leachate is added to the substrate before feeding it into the digester. Three different leachate concentrations were determined by scaling down the reactor size and the substrate feeding amount. The amounts of leachate were determined as:
- (1)
0 mL,
- (2)
2.3 mL,
- (3)
4.5 mL.
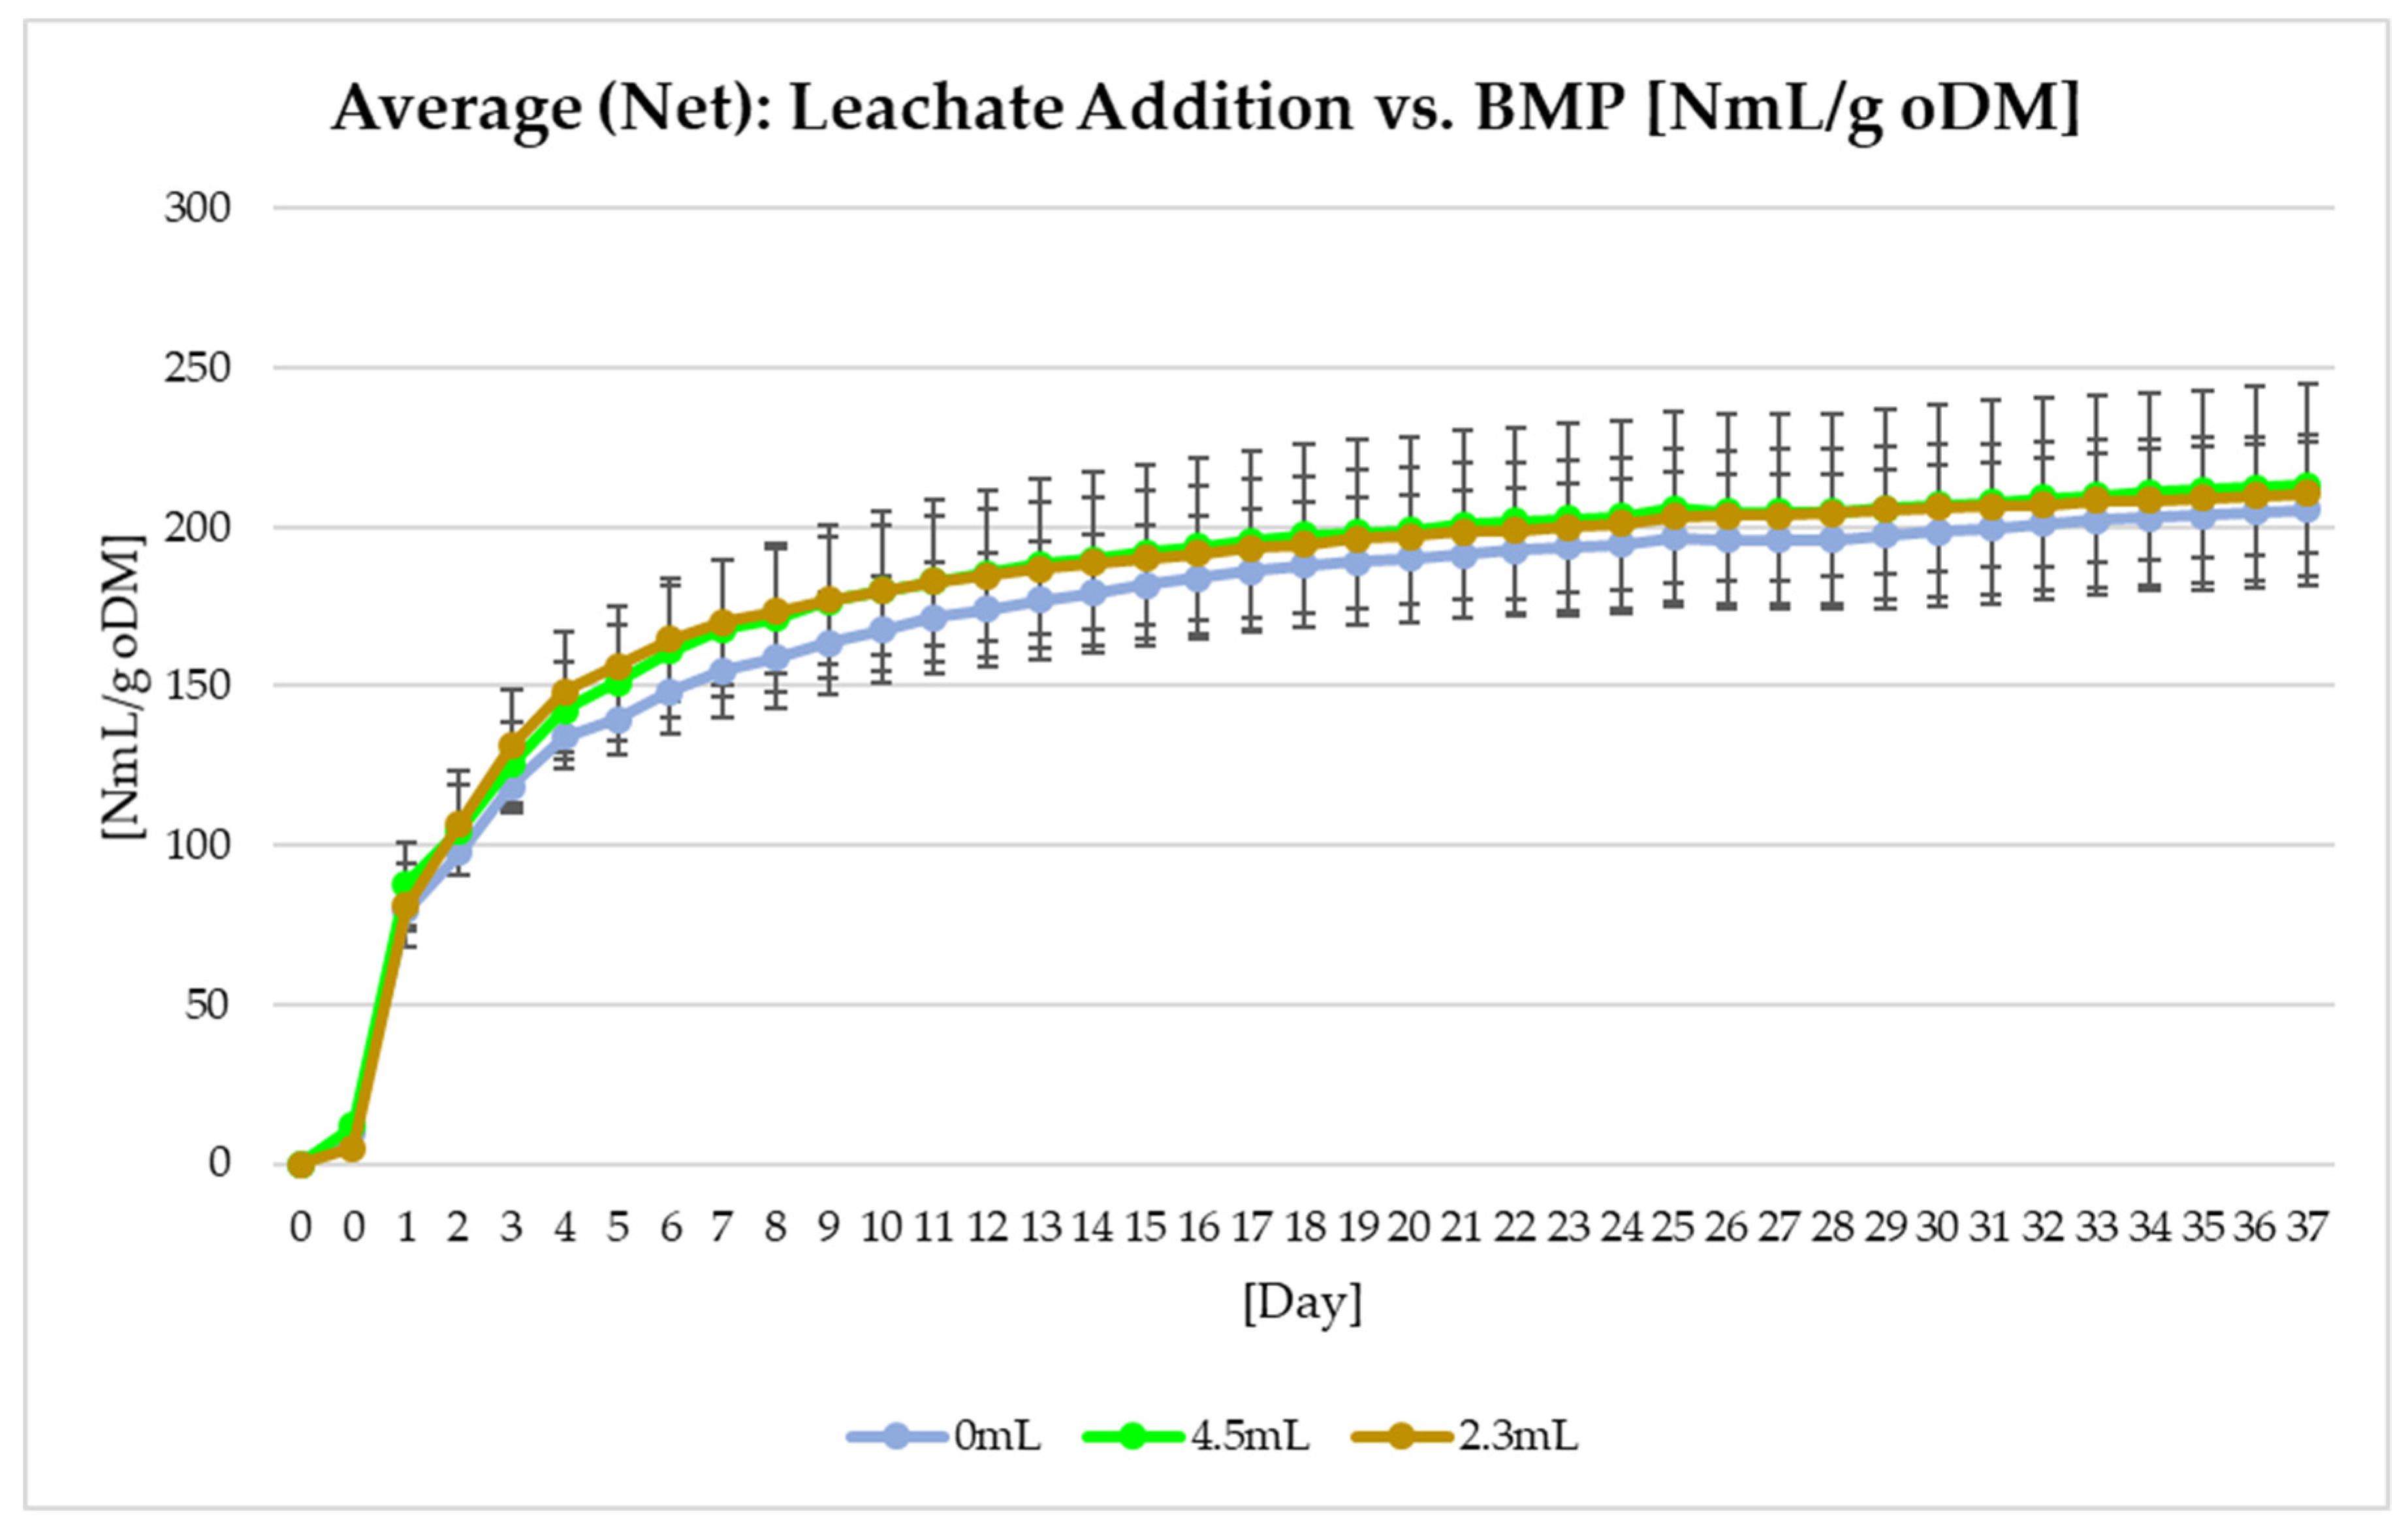
Figure 6 displays the results of the BMP test with different leachate concentrations. The specific BMP under varying leachate concentrations had negligible differences:
- (1)
205.6 ± 21.3 NmL g VS-1 from the reactor with no leachate,
- (2)
210.5 ± 18.7 NmL g VS-1 from the reactor with 2.3 mL leachate,
- (3)
213.3 ± 31.9 NmL g VS-1 from the reactor with 4.5 mL leachate.
Figure 6.
BMP under different leachate amounts.
Figure 6.
BMP under different leachate amounts.
The addition of leachate led to a slight increase in the specific biomethane generation from biowaste.
Composting leachate results in a high amount of dissolved salts, organic matter, ammonia, pathogenic microorganisms, and heavy metals. Immature composted leachate has an acidic pH, and mature leachate has an alkaline pH [
25]. The pH of the leachate sample in the biogas plant showed that the leachate was mature leachate with a pH value of 8.54 [
25]. Therefore, an increased amount of leachate did not cause an acidic environment or a negative impact on the system.
3.5. Results of Current HRT Evaluation in the Studied Biogas Plant
Another potential reason of inefficient biogas production was the HRT of the biogas plant, which could be too short for the processed substrate. The samples from the digester were collected in two different months (July and September). Since aerobic/anerobic digestion in the storage of biomass happens especially in summer, different results from those two samples were obtained as presented in
Table 6. Similar results to the biogas generation results of an industrial-scale digester were obtained from those samples with lower production in summer months. The biogas generation from residual biomass was not high and did not increase the capacity of the digester.
As explained in
Section 2 of this paper, pH measurements were performed before and after BMP analyses, and the results are displayed in
Table 7. The pH value in the reactors fluctuated between 7.93 and 8.24, and pH measurements before and after the test showed that the pH value within the test period stayed almost stable. The reason for high pH in the second set of experiments at the beginning was the delayed start of this test compared to others. The two-day incubation of the inoculum at 55 °C increased the pH value.
In order to interpret all experiments conducted in this study in light of the LSS methodology, the p-value for each experiment should be calculated using hypothesis testing. Due to the nature of the factors compared in the experiments, one-factor ANOVA and 1-sample Z-test were used to calculate the p-value for each possible cause. Since three or more factors were compared in the experiments, except for the effect of HRT, one-factorial ANOVA was used to calculate the p-value for examining the effects of possible causes such as the waiting time of the substrates, addition of leachate to the system, sand content, and different sizes of substrates. A 1-sample t-test was used for the effect of HRT since only one factor was involved in this analysis. Each possible cause that has a p-value less than 0.001 can be considered the cause of the problem. In our study, the particle size of the substrate, the freshness of the substrate, and the sand content were the root causes, which underlines the importance of pretreatment methods in a biogas plant.
4. Conclusions
This work studied the DMAIC methodology’s analysis phase in an effort to improve biogas production in a biogas plant in a laboratory environment. Our results demonstrate the importance of pretreatment methods in terms of impurities and particle size, as well as the substrate’s waiting time for the optimization of biogas production. With the collected results of the experiments, it is possible to perform hypothesis testing to determine the p-value for each scenario. However, as mentioned earlier, the objective of this study is to provide an aspect for the analysis phase of the Lean Six Sigma methodology. By using the scaled-down approach, it is possible to sample the entire system in a laboratory setting. As a whole, this work provides a new perspective on process optimization in anaerobic digestion. Statistical approaches in biogas technology can be applied using laboratory experiments without disturbing day-to-day operations, as long as a logical scale-down is possible.
For future research, a wider range of operating procedures could be used for different problems to determine a better biogas production environment. In addition, for accuracy in further studies and applications, experiments could be conducted in continuously stirred-tank reactors (CSTR).
Author Contributions
Conceptualization, S.C. and S.Ö.C.; methodology, S.C.; software, S.M.N. and S.C.; validation, S.M.N., S.Ö.C. and K.K.; formal analysis, K.K.; investigation, S.M.N.; resources, S.C.; writing—Original draft preparation, S.C. and S.Ö.C.; writing—Review and editing, S.C., S.Ö.C., S.M.N. and K.K.; visualization, S.C.; supervision, S.M.N., S.Ö.C. and K.K.; project administration, K.K.; funding acquisition, K.K. All authors have read and agreed to the published version of the manuscript.
Funding
This research received no external funding.
Institutional Review Board Statement
Not applicable.
Informed Consent Statement
Not applicable.
Data Availability Statement
Not applicable.
Acknowledgments
Publishing fees were supported by the Funding Programme “Open Access Publishing” of the Hamburg University of Technology. We would like to thank the German Academic Exchange Service (DAAD) for their scholarship awarded to Senem Önen Cinar.
Conflicts of Interest
The authors declare no conflict of interest.
References
- Fachagentur Nachwachsende Rohstoffe e.V. Guide to Biogas. Available online: https://mediathek.fnr.de/guide-to-biogas-from-production-to-use.html (accessed on 10 February 2022).
- Birol, F. Germany 2020—Energy Policy Review. Available online: https://www.bmwk.de/Redaktion/DE/Downloads/G/germany-2020-energy-policy-review.pdf?__blob=publicationFile&v=4 (accessed on 10 February 2022).
- Vögeli, Y.; Lohri, C.R.; Gallardo, A.; Diener, S.; Zurbrügg, C. Anaerobic Digestion of Biowaste in Developing Countries: Practical Information and Case Studies. Available online: https://www.eawag.ch/fileadmin/Domain1/Abteilungen/sandec/publikationen/SWM/Anaerobic_Digestion/biowaste.pdf (accessed on 1 March 2022).
- Deng, L.; Liu, Y.; Wang, W. Biogas Technology; Springer Singapore: Singapore, 2020; ISBN 978-981-15-4939-7. [Google Scholar]
- Gould, M.C. Bioenergy and Anaerobic Digestion; Bioenergy; Elsevier: Amsterdam, The Netherlands, 2015. [Google Scholar]
- Önen, S.; Kuchta, K. Evaluation of temperature changes in anaerobic digestion process. Detritus 2020, 10, 11–18. [Google Scholar] [CrossRef]
- Önen, S.; Nsair, A.; Kuchta, K. Innovative operational strategies for biogas plant including temperature and stirring management. Waste Manag. Res. 2019, 37, 237–246. [Google Scholar] [CrossRef] [PubMed]
- Nsair, A.; Cinar, S.Ö.; Qdais, H.A.; Kuchta, K. Optimizing the performance of a large scale biogas plant by controlling stirring process: A case study. Energy Convers. Manag. 2019, 198, 111931. [Google Scholar] [CrossRef]
- Deepanraj, B.; Sivasubramanian, V.; Jayaraj, S. Effect of substrate pretreatment on biogas production through anaerobic digestion of food waste. Int. J. Hydrogen Energy 2017, 42, 26522–26528. [Google Scholar] [CrossRef]
- Pham, C.H.; Saggar, S.; Vu, C.C.; Tate, K.R.; Tran, T.T.T.; Luu, T.T.; Ha, H.T.; Nguyen, H.L.T.; Sommer, S.G. Biogas production from steer manures in Vietnam: Effects of feed supplements and tannin contents. Waste Manag. 2017, 69, 492–497. [Google Scholar] [CrossRef] [PubMed]
- Seno, J.; Nyoman, I. The effect of feed to inoculums ratio on biogas production rate from cattle manure using rumen fluid as inoculums. Int. J. Sci. Eng. 2010, 1, 41–45. [Google Scholar]
- Liu, G.; Zhang, R.; El-Mashad, H.M.; Dong, R. Effect of feed to inoculum ratios on biogas yields of food and green wastes. Bioresour. Technol. 2009, 100, 5103–5108. [Google Scholar] [CrossRef] [PubMed]
- de Clercq, D.; Jalota, D.; Shang, R.; Ni, K.; Zhang, Z.; Khan, A.; Wen, Z.; Caicedo, L.; Yuan, K. Machine learning powered software for accurate prediction of biogas production: A case study on industrial-scale Chinese production data. J. Clean. Prod. 2019, 218, 390–399. [Google Scholar] [CrossRef]
- Cinar, S.Ö.; Cinar, S.; Kuchta, K. Machine Learning Algorithms for Temperature Management in the Anaerobic Digestion Process. Fermentation 2022, 8, 65. [Google Scholar] [CrossRef]
- Cinar, S.; Cinar, S.O.; Wieczorek, N.; Sohoo, I.; Kuchta, K. Integration of artificial intelligence into biogas plant operation. Processes 2021, 9, 85. [Google Scholar] [CrossRef]
- Onen Cinar, S.; Nsair, A.; Wieczorek, N.; Kuchta, K. Long-Term Assessment of Temperature Management in an Industrial Scale Biogas Plant. Sustainability 2022, 14, 612. [Google Scholar] [CrossRef]
- Verein Deutscher Ingenieure e.V. Fermentation of Organic Materials—Characterization of the Substrate, Sampling, Collection of Material Data, Fermentation Tests; Verein Deutscher Ingenieure e.V.: Dusseldorf, Germany, 2016. [Google Scholar]
- Deutsches Institut für Normung e.V. Soil—Investigation and Testing—Determination of Ignition Loss; 18128:2002-12; Beuth Verlag GmbH: Berlin, Germany, 2002. [Google Scholar]
- Deutsches Institut für Normung e.V. German Standard Methods for the Examination of Water, Waste Water and Sludge; Sludge and Sediments (Group S); Determination of Water Content, of Dry Residue and of Solids Content (S 2); 12880:2001-02; Beuth Verlag GmbH: Berlin, Germany, 2001. [Google Scholar]
- Puig-Ventosa, I.; Freire-González, J.; Jofra-Sora, M. Determining factors for the presence of impurities in selectively collected biowaste. Waste Manag. Res. 2013, 31, 510–517. [Google Scholar] [CrossRef] [PubMed]
- Kim, J.; Kim, H.; Baek, G.; Lee, C. Anaerobic co-digestion of spent coffee grounds with different waste feedstocks for biogas production. Waste Manag. 2017, 60, 322–328. [Google Scholar] [CrossRef] [PubMed]
- Giuliano, A.; Cavinato, C.; Bolzonella, D.; Pavan, P.; Cecchi, F. SS-OFMSW sorting approaches oriented to anaerobic digestion: Preliminary comparison for full scale implementation. In Proceedings of the Latin American Anaerobic Digestion Symposium, Latin American Anaerobic Digestion Symposium, Ouro Preto, Brazil, 23–27 October 2011. [Google Scholar]
- Påledal, S.N.; Hellman, E.; Moestedt, J. The effect of temperature, storage time and collection method on biomethane potential of source separated household food waste. Waste Manag. 2018, 71, 636–643. [Google Scholar] [CrossRef] [PubMed]
- Degueurce, A.; Picard, S.; Peu, P.; Trémier, A. Storage of food waste: Variations of physical–chemical characteristics and consequences on biomethane potential. Waste Biomass Valoriz. 2020, 11, 2441–2454. [Google Scholar] [CrossRef] [Green Version]
- Siciliano, A.; Limonti, C.; Curcio, G.M.; Calabrò, V. Biogas generation through anaerobic digestion of compost leachate in semi-continuous completely stirred tank reactors. Processes 2019, 7, 635. [Google Scholar] [CrossRef] [Green Version]
| Publisher’s Note: MDPI stays neutral with regard to jurisdictional claims in published maps and institutional affiliations. |
© 2022 by the authors. Licensee MDPI, Basel, Switzerland. This article is an open access article distributed under the terms and conditions of the Creative Commons Attribution (CC BY) license (https://creativecommons.org/licenses/by/4.0/).


