Abstract
The Search for Hidden Particles (SHiP) experiment is a new purpose fixed target facility proposed for the CERN Super Proton Synchrotron accelerator to search for long-lived exotic particles associated with Hidden Sectors and Dark Matter. This paper reports on the development of BIM integrated design for the SHiP experiment, applied initially to the Decay Volume, a >2000 m3 conical steel vessel under a vacuum hosting several large particle physics detector systems. A BIM methodology is used to address all the design phases of the Decay Volume of the SHiP experiment from the conceptual planning to the constructive drawings production. This proposed workflow is a basic plan to be repeated for each sub-component of the SHiP experiment in order to have a full and overall integration of the experiment. In particular, the Decay Volume’s geometrical and structural design and the simulation of its assembly process, both in factory and on site, are proposed. Moreover, the use of collaborative platforms to speed up the ideas exchange, as the basis of a highly multidisciplinary and complex project, is discussed. The complexity, multidisciplinary nature, and size of the SHiP project severely challenge design information management. The final plan to solve this issue is to have a BIM integrated design of each experiment sub-component, such as that demonstrated in this work for the Decay Volume, in order to have a full and multidisciplinary integration of the overall project.
1. Introduction
The Search for Hidden Particles (SHiP) experiment [1,2,3,4,5] is a new general purpose fixed target facility proposed for the CERN Super Proton Synchrotron (SPS) accelerator to search for long-lived exotic particles associated with Hidden Sectors and Dark Matter. This paper reports on the development of BIM integrated design for the SHiP experiment, applied in the first phase to the biggest SHiP component, the Decay Volume, a >2000 m3 conical steel vessel under a vacuum that should host several large particle physics detector systems. The approach to design based on the Building Information Modelling (BIM) methodology (AIA 2013, [6]) turns out to be of fundamental importance in the context of a complex, multidisciplinary, and international project. Even at the first level of modelling and design, it is necessary to have an integrated design that incorporates all of the sub-components coming from groups of different disciplines to guarantee the exchange and control of information between the various stakeholders. The BIM methodology allows for the creation of virtual models of the different sub-components that may be extended to store associated key information. The models provide mechanisms to ensure that updates over time are coherently propagated and, above all, that consistent sets of information are retrievable by the different actors of the process through the use of platforms by which it is possible to share the work flow and collaborate in real time. However, it should be underlined that the BIM process proposed needs an accurate analysis of the information to be exchanged to achieve these goals. This means that the information exchange between project participants must be clearly identified. The author and receiver of each transaction of information need to clearly understand the information content [7]. A correct procedure for the exchange of information must also consider the interoperability and compatibility between the design software used by the project participants. Then, the procedure of information exchange and the file formats need to guarantee the interoperability. Moreover, the use of BIM and the automation of the global model reduce the design time and the non-conformities risk. It also allows for the projection of the construction and the planning of services and future maintenance. This approach ensures that the design solution meets the requirements from internal and adjacent systems and that the planning and costs for the construction, operation, and maintenance of the device are under control. Often, these aspects are otherwise defined only after the construction [8,9].
The use of BIM characterised the design of the Decay Volume in both the modeling and structural design phases, as well as in the process definition phase for the realisation and implementation of the device in the facility. The design of the Decay Volume has been characterised by the writing of a visual scripting algorithm that allows for the creation of complex geometries. This algorithm allows for the passing from static to dynamic design, reducing the time for geometrical and structural modelling and optimising the model through a series of comparisons between the different design solutions. The realisation of the Decay Volume, from the production in the workshop of the various panels to the assembly in the experimental area, has been divided into several work phases. This procedure is very important since the manufacturing of the Decay Volume must respect a high level of precision in the welding of the different pieces, and it is the most critical step of the overall procedure. A failure to manage tolerances would build up to a level at which the volume could not be fitted with the upstream vacuum end-caps and the downstream flange towards the adjacent vacuum tank. Moreover, during each phase, using the digital prototype, all the individual processes leading to the construction of the device have been defined and designed, focusing on possible interferences that can arise during the whole process and which could lead to incorrect execution with an increase in time and costs.
In summary, the BIM approach to support the integrated design of the SHiP experiment, with particular focus on the Decay Volume from the conceptual planning to the construction phase, is shown in this work. The Decay Volume’s geometrical and structural design and the simulation of its assembly process, both in factory and on site, are presented (Supplementary Materials). Moreover, the use of collaborative platforms improves and speeds up the exchange of ideas, which is the basis of a highly multidisciplinary and complex project. The final plan is to have a BIM integrated design of each sub-component of the experiment, such as that demonstrated in this work for the Decay Volume, in order to have a full and multidisciplinary integration of the overall project available to all the stakeholders.
2. General Overview of the SHIP Project
The SHiP research facility is composed of a large infrastructure with a dual detector system (Figure 1). The upstream system is specialised in the direct detection of Dark Matter and in performing measurements on neutrinos. The second detector system is dedicated to searching for decays of so-called Hidden Particles. It consists of a 50 m long Decay Volume (hereafter “DV” for brevity) followed by a spectrometer with an aperture of 5 m × 10 m and by detectors for particle identification. Then, the muon shield is a crucial element of SHiP [3,10,11]. It consists of a chain of magnets that deflect away from the detector of the beam target’s high flux of muons. The deflected flux of muons defines a conical region in which the DV and the detector systems are placed. To suppress the background from neutrinos interacting in the fiducial volume, the DV must be maintained at a pressure of <10-3 bar by means of a vacuum vessel. The downstream spectrometer is designed to accurately reconstruct the decay of the particles of interest and reject residual background particles.
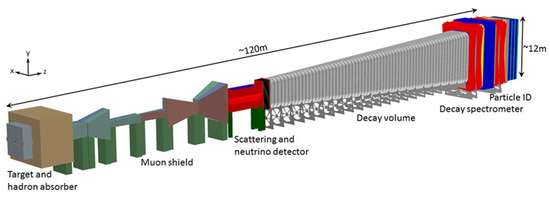
Figure 1.
Overview of the SHiP experiment.
The SHiP’s vacuum vessel has a total volume of ~2040 m3 and consists of two parts: the volume in which a decay vertex is accepted and the spectrometer section. An upstream and a downstream end-cap close off the ends of the vacuum vessel. The current baseline for the background tagger system is based on a “Liquid Scintillator detector” [12], which fills the compartments in the wall structure of the DV. The liquid scintillator is based on the solvent Linear Alkyl-Benzene (LAB), adding 2 g/L Di-Phenyl-Oxazole (PPO) as fluorophore. The detection of particles crossing the liquid scintillator is performed with two photodetectors mounted to the outer wall of each compartment through holes of small diameter. Moreover, the compartments will need hydraulic fittings for the circulation of the liquid scintillator.
The dimensions of the experimental area (Figure 2) have been determined, starting from the dimensions of the whole SHiP detector, including the services and the needs during the assembly and installation.
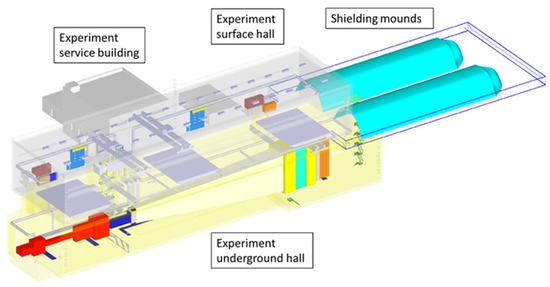
Figure 2.
Layout of the SHiP experimental area.
The total length of the detector is around 120 m (Figure 3). In order to reduce the background from the interactions of particles in the walls of the underground hall, the width of the cave is 20 m, with the detector positioned in the centre. The assembly of the entire detector determines the arrangement of the ground floor, access doors, and cranes that will be used for handling loads. The various elements that make up the SHiP detector will be present in parallel and assembled in the underground experimental hall. The DV will be pre-assembled on site in a few large panels, which will be then lowered in the underground experimental area, where they will be welded together and connected with the other sub-components of the whole SHiP detector.
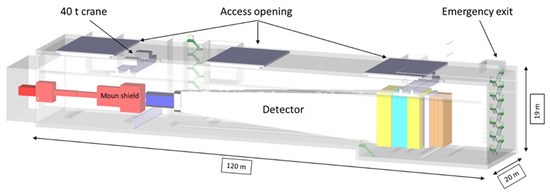
Figure 3.
The experimental underground hall.
In designing the experimental area, both the implementation phase of the SHiP and the maintenance and dismantling phase of the detector were taken into account. Furthermore, a future reuse of the structure is foreseen [4].
3. Proposed BIM Workflow
This section presents the BIM procedure to address all the design phases of the DV of the SHiP experiment from conceptual planning to constructive drawings production. This proposed workflow is a basic plan to be repeated for each sub-component of the SHiP experiment in order to have a full and overall integration of the experiment. The novelty of the proposed BIM workflow is the implementation of a coded procedure that can work independently in different fields of a multidisciplinary project. With the automation of the design process through the virtual model and the use of interoperable software, it is also possible to export the detailed information of the structural design directly to the numerical control machines for the prefabrication of the various modules in the workshop [13,14,15]. It is obvious to say that preliminary work should be done to set up the chain of the BIM oriented software to be used by all the stakeholders of the project belonging to different subject areas. Moreover, through the BIM methodology, it is possible to detect the interferences that may occur during the construction of each sub-component of the experiment (in this work, presented for the DV), such as checking if the components of the devices can be transported within the experimental area through the access door of the experimental area.
A particular focus of this procedure is related to the design of the DV based on the writing of a visual scripting algorithm in a visual programming environment (Dynamo Software 2021, Autodesk, San Rafael, CA, USA, [16]), which allows for the creation of complex geometries. This algorithm allows for the passing from static to dynamic design, reducing the time for modelling and optimising the model through a series of comparisons between the different design solutions. The data contained within the Revit Autodesk 2021 [17] software adaptive families, used to model the individual elements that make up the DV, have been exported with the use of a specific scripting algorithm for this operation. The structural analysis has been performed with the Robot Autodesk 2019 [18] software, importing the geometric model of Revit into the software, which was transformed into a structural model using the Analyse nodes contained in Dynamo. The realisation of the DV, from the production in the workshop of the various panels to the assembly in the experimental area, has been divided into several work phases. During each phase, using the digital prototype, all the individual processes leading to the construction of the device were defined and designed, focusing on possible interferences that can arise during the whole process and which could lead to incorrect execution with an increase in time and costs. To study this process, the Navisworks (2021) [19] software has been used in order to combine the information from different software (information of the terrain model created in the Infraworks (2021) [20] software, the experimental area model designed with the CATIA (2019) [21] software, and the DV modelled in Revit). The data contained within the Revit (2021) [17] software adaptive families, used to model the individual elements that make up the DV, have been exported with the use of a specific scripting algorithm for this operation. The complete digital model has been connected to the construction schedule defined in the Microsoft Project (2021) [22] software and imported into Navisworks. Navisworks also identifies and corrects the interferences between the various models and those that can occur during the assembly operations of the structural elements of the device. The federated model in Navisworks has finally been imported in the Autodesk BIM 360 (2021) [23] software for the purpose of sharing information and coordinating models with all stakeholders, as presented in another case in [24]. A Timeliner can be also added, displaying all the work phases on the screen in relation to the estimated time for each of them. Then, it is possible to monitor the progress of the construction in real time and intervene to restore any delays that could lead to an increase in construction costs [25,26,27]. This whole procedure helps to minimise the risks of the incorrect design and construction of the device during the whole process. The described procedure is summarised in the flowchart presented in Figure 4.
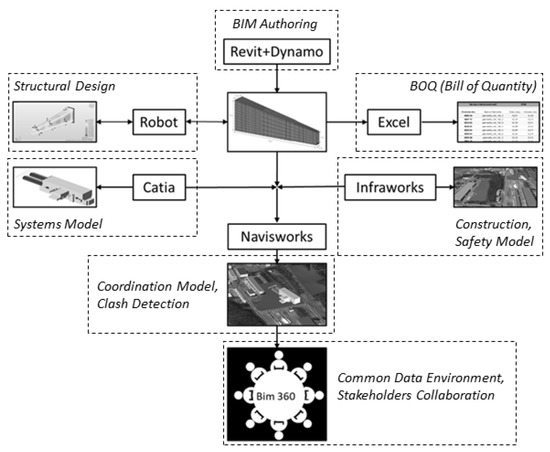
Figure 4.
Flowchart of the proposed BIM process.
4. Integrated Design Development of the Decay Volume
The DV has been designed with a steel structure in order to minimise the masses and respect the geometry inputs of the experiment. The steel advantages are related to its mechanical efficiency, lightness, ductility, the speed and accuracy of assembly on site, the possibility of transformations and repairs, and the environmental sustainability for its characteristics of recyclability. The more important conditions in the design process were the allocation space for the liquid scintillator inside specific compartments around the DV and the minimisation of the mass and width of the wall structure. Then, a box section based on S355JO(J2/K2)W Corten steel elements has been chosen.
4.1. BIM Geometrical Model
One particularity of the context of the Decay Volume project is the lengthy optimisation process to determine the design parameters. It involves several iterations of detailed physics simulations, leading to recurrent changes and erasing or redrawing in order to evaluate different alternative solutions. As a result, the chosen method is based on Parametric Design with the help of Parametric Models that numerically represent the project’s geometry. The parametric models have attributes (properties) that are fixed, called constrains, and others that can vary, called parameters. The designer changes the parameters in the parametric models to adapt or reconfigure for alternative solutions in order to avoid erasing or redrawing [28].
The parameters can be changed through the use of several drawings or modelling functions. These functions can be activated through the implementation of an algorithm that aims to speed up the process.
With the proposed workflow (see Section 3), the BIM computational design allows for the design of highly flexible parametric geometries. In fact, the parameters are always editable within the chain of nodes in which they are structured. Any changes to these parameters are directly reflected on the geometry, allowing the user to dynamically analyse all the possible options. The Dynamo work environment is structured with nodes and relationships; the nodes manage specific functions (parameters, geometries, etc.), and are connected to the other nodes, composing an uninterrupted flow of data.
Writing this algorithm avoids the manual insertion of all the elements that form the Decay Volume, reducing the time for modelling. In addition, with this modelling approach, the accuracy of the model increases and the modelling errors are reduced during the insertion of the various elements. The fundamental nodes for writing the algorithm are the Code Blok and Point.ByCoordinates nodes, used to create points in space. By entering the coordinates in the first node and connecting it to the second node, the user can view the points in the x, y, and z plan. The Line.ByStartPointEndPoint node allows for the drawing of a line between two nodes, specifying the initial and final nodes. After drawing the external lines of the Decay Volume and inserting the PolyCurve.ByPoints node (Figure 5a,b), the points in the y-z plane are connected through a polyline.
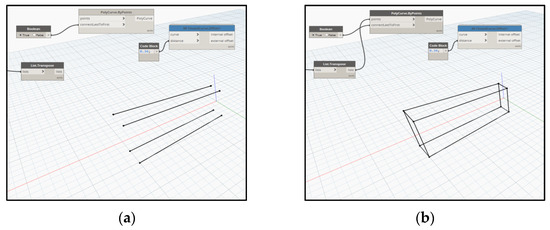
Figure 5.
(a) PolyCurve.ByPointsnode; (b) Connection between the initial the final nodes.
TheClosedCurve.Offset + node allows for the production of an offset of the polyline inside or outside, as needed. In the specific case, an internal offset of 0.34 m is made, equal to the height of the vertical stiffening member. To increase the number of polylines, the Number Slide node is used. After drawing the polylines, with the relative offsets, an internal surface through the Surface.ByLoft node is created. The Surface.PerimeterCurves node (Figure 6a,b) divides the surface in correspondence to the external and internal nodes of the polylines.
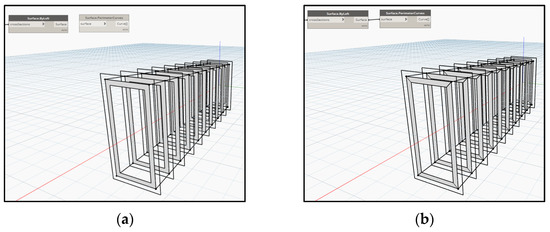
Figure 6.
(a) Surface.ByLoft node; (b) Surface.PerimeterCurves node.
The Family Types node allows the user to select the families of elements contained in Revit for the modelling of the objects. The Decay Volume consists of steel panels, which form the internal sheet, the external sheet, and the vertical and longitudinal stiffening members. All these elements, despite having a shape similar to a trapezoid, are different from each other in size. Then, it is necessary to use the families of loadable elements, which, unlike the system families, are created in external RFA files and imported into the design project. Loadable families use an adaptive component called Generic Model Adaptive.rft. They are flexible components and can adapt to different design scenarios. Adaptive components are made up of adaptive points that can be used to position the components or can act as manipulation points. Using the Adaptive.Component.ByPoint node (Figure 7), an adaptive component is assigned to each group of nodes.

Figure 7.
Adaptive.Component.ByPoint node for the insertion of adaptive families within the generated surfaces. As the conclusion of this phase, a 3D model of the Decay Volume is obtained in Revit, and its view is presented in Figure 8.
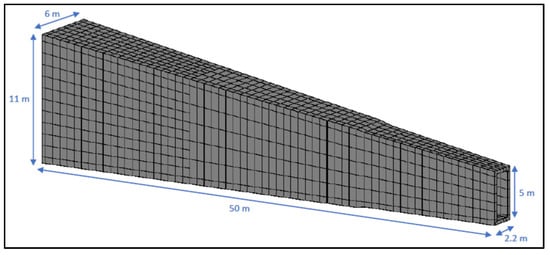
Figure 8.
3D view of the Decay Volume as implemented in the structural analysis. The box section is made up of the following members.
Figure 7.
Adaptive.Component.ByPoint node for the insertion of adaptive families within the generated surfaces. As the conclusion of this phase, a 3D model of the Decay Volume is obtained in Revit, and its view is presented in Figure 8.

The inner and outer steel sheets possess a thickness of 20 mm, with the exception of the last 16.4 m, along which the thickness is 30 mm (see Figure 9a).
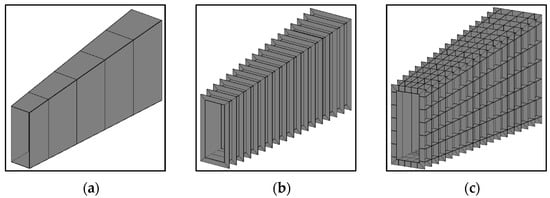
Figure 9.
(a) Inner steel sheet; (b) Transversal stiffening members; (c) Longitudinal stiffening members. The dimensions of the double wall structure change along the 50 m length of the Decay Volume. The initial cross-section of the Decay Volume is about 3 m × 5.5 m (external steel sheet). The final cross-section is about 6 m × 12 m (external steel sheet). The design of the structure leads to a total of 1848 compartments for the liquid scintillator detector. Studies with a prototype compartment in the test beam have verified that the dimensions given by the vessel skeleton of about 800 mm × 1200 mm are acceptable. The total weight of the structure and plates forming the Decay Volume is about 550 tonnes.
The transversal stiffening members are spaced by 800 mm, with a thickness of 10 mm and a height of about 400 mm (see Figure 9b). In particular, the height is equal to 300 mm in the first 14.4 m due to a specific requirement of remaining inside the envelope defined by the deflected muons background, while it is 410 mm for the following 19.2 m and 390 mm for the last 16.4 m.
The longitudinal stiffening elements possess a thickness of 10 mm and an interspacing varying from 804 mm to 1702 mm (see Figure 9c).
4.2. BIM Structural Model
The model generated in Revit through the use of the Dynamo has been imported into Robot using a node called AnalyticalPanel.ByCurves, which is located in a Dynamo package. By inserting this node within the visual script algorithm, it is possible to create a direct connection between Revit and Robot.
The structural analysis has been implemented with the finite elements software Robot [29]. The steel plates have been modelled as two-dimensional shell members incorporating all the properties of the plate behaviour. The plates have the two main stresses in the plane of the plate, and there are axial load, shear, and flexure in the thickness of the plate. A fine mesh has been used in the calculations. Figure 10, Figure 11, Figure 12 and Figure 13 present the stress paths on internal and external steel sheets and transversal and longitudinal steel elements, respectively. With respect to the local axes shown, x is represented with cyan colour, y with green colour, and z with red colour. The Figures refer to the ultimate condition combination (UC in the Figures) of the loads (Eurocode 0, 2002, [30]), which has been proven to be the most critical for the verification. However, the same maps have also been obtained for the seismic condition and serviceability combinations of the loads (Eurocode 0, 2002 and Eurocode 8, 2004, [31]). The stresses’ safety verifications performed in accordance with the international standards for the steel plates (Von Mises equivalent stress and critical instability stress verifications, Eurocode 3, 2006, [32]) are satisfied. The serviceability verifications on the maximum displacements are also satisfied.
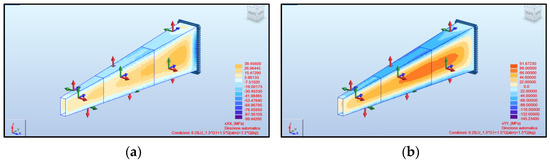
Figure 10.
Internal steel sheet stress path: (a) UC σx; (b) UC σy.
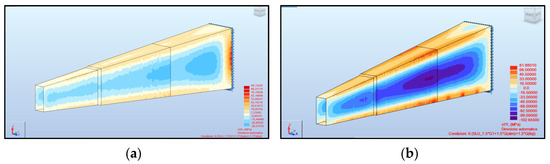
Figure 11.
External steel sheet stress path: (a) UC σx; (b) UC σy.
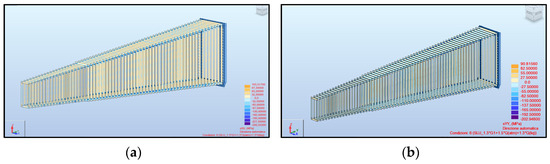
Figure 12.
Transversal stiffening members stress path: (a) UC σx; (b) UC σy.
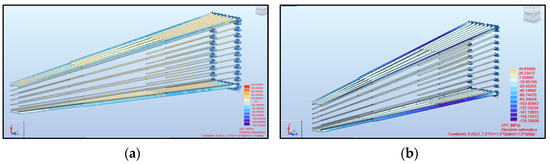
Figure 13.
Longitudinal stiffening members stress path: (a) UC σx; (b) UC σy.
4.3. BIM Model Rapid Visualisation
The data contained within the elements of the model generated in Revit were exported using a Dynamo script. The script allows the user to export the output data and directly report them on a Microsoft Excel (2021) [33] type spreadsheet format. The various elements contained within the Generic Models category have been called up using the All Element of Category node. They have been connected with a series of nodes to know the surface, the volume, the element ID, and the name. All this information has been sent to the Data.ExportExcel node through the List Create node. The Data.ExportExcel is used to write information in an Excel sheet. To use this node, it is necessary to specify, through the File Path node, the Excel file on which to write the information. The sheet name is indicated with the String node connected to the sheet name, while two Code Block nodes have been used for startRow and startCol, respectively, to indicate at which row and column to start compiling the file. The data are written in the order to be used in the List Create node. With the All Element of Category node, all elements within the Revit Generic Models category are recalled. The nodes have been used to extrapolate different information: the total number of elements, the ID of each individual element, the name, the area, and the volume. The Data.ExportExcel node exports the selected data to an Excel file. Table 1, moreover, shows a part of the Excel file written with Dynamo.

Table 1.
Excel sheet written with Dynamo.
4.4. Issues Solved through the BIM Methodology
With the use of BIM, the solution of a series of potential problems that would have emerged with a traditional design can be simplified. The DV has been modelled with the use of BIM software, trying to reach a level of development comparable to the construction level (LOD, 2020, [34,35]), which allows the manufacturer to have all the information necessary to make each single element of the DV. To achieve this goal, a Dynamo algorithm has been written, which, in addition to reducing the time for modelling, increased the geometric precision of the model. Furthermore, with the automation of the modelling process, it has been possible to make various comparisons between the different structural models, supporting the designers in choosing the most performing geometry. Figure 14a–c show three different models used during the optimisation phase. By changing the parameters in Dynamo, the external dimensions can easily be varied, the number and position of the longitudinal and vertical stiffening members can be changed, existing elements can be removed, and new elements can be inserted. These operations can be done quickly and easily because the software used is BIM oriented. Moreover, the use of this BIM oriented software permits the exchange of information through the use of open IFC (2020) [36] formats, which allow for interoperability between the various software.
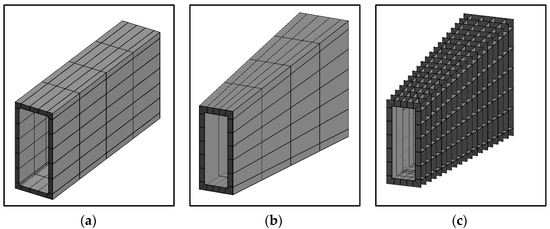
Figure 14.
(a) Changes in the external dimensions; (b) Changes in the number of vertical stiffeners; (c) Model without external panels.
5. Integrated Construction Design of the Decay Volume (DV)
The presented study, in addition to providing a high level of detail useful for the construction phase of the DV, also focuses on a careful assessment of the assembly phases in the factory and in situ. The fundamental principle is to give preference to a high level of prefabrication in the factory since it gives access to multiple equipment (different deformation control devices/tools) and production machines with already established process control protocols. In fact, there are many more possibilities and machines to correct unexpected deformations in the factory than in situ. This choice is assumed to allow for the reduction of imperfections/errors in the assembly phase on site. Consequently, the proposed fabrication processes are divided into two phases. The first one concerns the prefabrication in the factory of all the components necessary to construct the device from as few components as possible. The second phase is the on-site assembly process requiring manual processing. The first phase is subject to a high level of control in terms of both precision for the production of all the components of the device (numerical control machines, laser cutting, etc.) and of the working environment, such as temperature, powders, and external agents. The second phase carried out on site consists of joining together the basic modules produced in the factory, following a certain assembly scheme, to form the 16 panels that will subsequently be welded together underground in the final location of the SHIP detector, as discussed below. Even if the second phase will be accompanied by a tight survey and process control, the manual processing on site makes it more susceptible to inaccuracies in the assembly phase. Hence, the development study for the DV focuses on reducing the operations to be carried out in the second phase. The BIM strategy proposed has allowed for the efficient optimisation of all the construction details in order to design the DV with as few points of insertion and conjunction as possible, so as to reduce the number of assembly operations on site and within the experimental area. In addition, BIM has allowed for the iteration of the complete construction sequence from the factory to the final installation through virtual assembly simulations. This has also been indispensable to exchange information with the stakeholders of associated and adjacent systems in order to discuss the global installation scenario, required equipment, and tooling, as well as possible interferences with the other planned operations.
5.1. Factory Production
The BIM integration aims to guarantee the quality of the process and to reduce the errors during the factory production. In fact, the BIM automatically generates the production files for the control production machines. The automation in the file transmission guarantees a higher quality level with respect to the simple papers with the drawings transmission. Additionally, the tolerances should be put in the integrated BIM model and controlled during the production process, such as the quality control on the used steel. The construction sequence envisages production in the factory workshop of basic modules with a width of 2.4 m and variable heights, using numerical control machines with a thermal break (laser, plasma, ox fuel). The width is chosen to respect transport standards, and the variable heights correspond to the full dimensions of the lateral sides of the DV, varying between 5.50 m and 11.90 m (external steel sheet). The welds will be carried out following specific procedures and sequences that allow for controlled and programmed thermal contributions for the parties involved in this process, and they will finally be verified with appropriate techniques to check that the welding respects the required standards. During the assembly phase of the individual modules in the workshop, any deformations will be corrected by means of special procedures (“localised heating” and similar procedures), which are shared and endorsed by the Italian Institute of Welding in Genoa, which is authorised to produce structures and equip them with CE mark up to the most severe execution class (EXC4) foreseen by UNI EN 1090-1 (2012) [37] and -2 (2018) [38]. The basic modules that make up the DV consist of an internal panel, a series of vertical and horizontal stiffeners, and external panels for closing the individual cells in order to contain the liquid scintillator, as presented in Figure 15a–d.
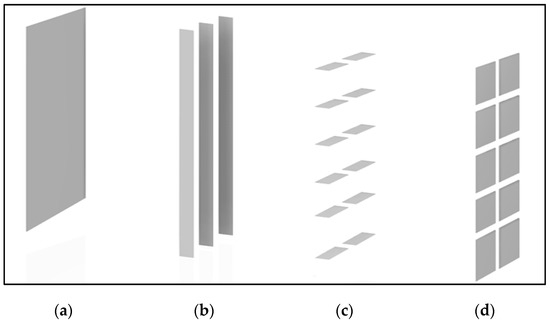
Figure 15.
Single panel: (a) internal panel; (b) vertical stiffening; (c) horizontal stiffening; (d) external panels.
The realisation of the single module will be carried out with numerical control and laser cutting machines, using data from the parametric objects that make up the 3D model of the DV and extrapolating the necessary information with the use of a special algorithm created in Dynamo, as shown in Figure 14. The assembly sequence first involves joining the vertical stiffeners (Figure 16a) previously subjected to chamfering on the internal panel by means of welds with complete penetration of filler material. The next step consists of inserting and welding the horizontal elements that define the individual cells (Figure 16b). All chamfered elements are full penetration welded. The external panels are welded in the last step following the procedure previously described (Figure 16c). The welds will be carried out in multiple passes to avoid the excessive heating of some areas, which could modify the mechanical characteristics of the steel material.
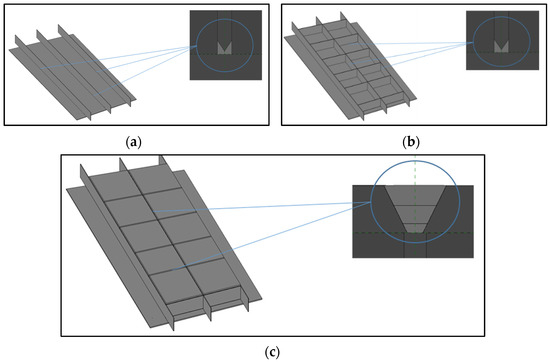
Figure 16.
(a) Vertical stiffener welding; (b) Welding of horizontal stiffening elements; (c) Welding of external panels.
The assembly in the workshop allows for the checking for defects and the quality assurance of the welds through a series of specific tests and techniques such as penetrating liquids, ultrasound, and radiography. The liquid scintillator detector relies on the continuous circulation and purification of the liquid. Vertical flow paths for the lateral DV walls and horizontal flow paths for the bottom and top walls have been envisaged with the help of holes in the longitudinal and lateral stiffening members, respectively. Detailed hydraulic simulations and the optimisation of the sizes and locations of the holes are required to achieve efficient and complete circulation with no formation of bubbles. At the same time, the flow paths have non-negligible impacts on the structural optimisation and safety checks of the DV. The BIM procedure has been indispensable in allowing for many schemes to be evaluated. The most promising scheme consists of quarter-circle shaped holes with a radius of 30 mm located at the edges of the stiffeners, as presented in Figure 17. This configuration minimises the risk of air bubbles trapped inside the corner welds, where they could lead to oxidation of the weld. Furthermore, this scheme ensures the proper sealing of the connected plates as well as the cleaning of the areas affected by the holes.
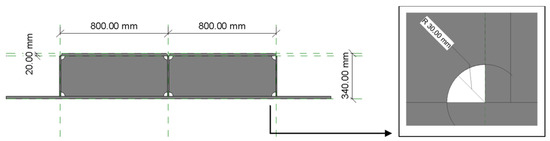
Figure 17.
Detail of the internal holes at the corners with a radius of 30 mm.
In addition, the liquid scintillator detector requires that the external panels of each compartment are fitted with two Wavelength-shifting Optical Modules (WOMs) for the detection of light generated by particles crossing the compartments. The specifications for the required holes and the fittings on the external panels (Figure 18) are the result of studies and optimisation by the detector team.
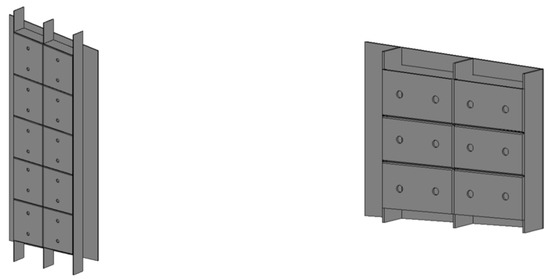
Figure 18.
Holes on external panels with a diameter of 70 mm for inserting the liquid scintillator light detection devices.
5.2. In-Situ Assembly Procedures
The number of basic modules that can be pre-assembled into wall sections at the surface assembly area on-site depends on the maximum capacity of the bridge crane that will be used for manipulating and lowering the pre-assembly into the underground experimental hall. For the specific case, a bridge crane with a capacity exceeding 44 tonnes has been agreed to. In this scheme, the DV has been divided into four sections to minimise the number of welds to be made within the underground experimental hall. As a result, the 2.4 m factory-made basic modules will be transported to the construction site (expected distance of 1000 km) to be assembled into wall sections of a maximum of six modules. This strategy is considered optimal to ensure the exact dimensions and flatness of the wall sections. An alternative based on the pre-assembly of DV sections, each with a length of 3 × 2.4 m basic modules, has been studied. Simulations of the construction scenario indicate that this could lead to misalignments (max 1–2 mm) between the adjacent sections that are difficult to correct. The problem is mitigated with the 12 m continuous flat wall section in the baseline scenario. Figure 19 shows the various elements used to join the two basic modules.
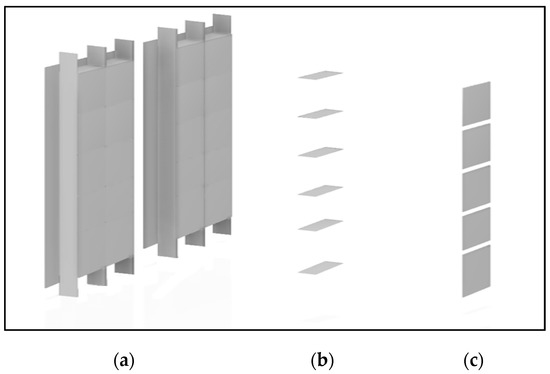
Figure 19.
Joining between 2.4 m basic modules: (a) 2.4 m panels; (b) horizontal stiffening; (c) external panels.
The first operation is the welding between the basic modules. This is followed by the insertion of the horizontal stiffening members and the fitting of the external panels. As in the factory, the welds will be completely penetrated with filler material on elements subjected to chamfering. To ensure perfect flatness between the various modules assembled on site, a straightening process will be performed by applying localised heating in specific points. It is a procedure to correct an unexpected deformation. Figure 20 shows the main phases that lead to the complete union between two basic modules.
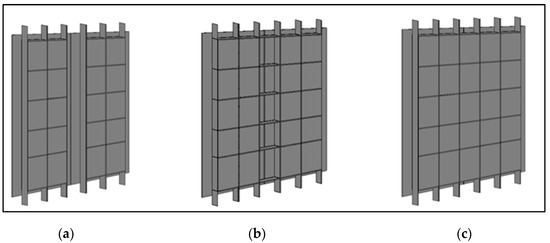
Figure 20.
(a) Internal welding; (b) Horizontal stiffening; (c) External panels.
It is crucial to plan the mounting sequence underground. After the transport within the experimental area by mechanical means and the lowering underground with the bridge crane, the wall sections will be positioned at the planned location using slides and an accurate survey. The whole process has been simulated to identify the possible interferences that can occur during the entire construction phase of the device. In particular, the pre-assembled wall sections are transported within the experimental area by means of a mammoth-type mechanical device into the surface hall on top of the underground hall. It is first raised and then moved to the opening that connects the ground floor with the basement, and it is finally lowered and positioned on special slides to be brought to the final position where it will be mounted. The most important operations are the transport within the experimental area, the handling of loads with the use of the bridge crane, and the insulation of the panel on the SHIP detector (Figure 21). The operation is shown in Figure 22 for the vertical wall sections (the lateral walls), but the same approach is also used for the horizontal wall sections (the upper and lower walls).
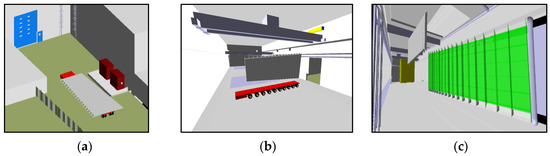
Figure 21.
Assembly of the DV as simulated by Navisworks: (a) panel transport in the experimental area; (b) panel lifting by means of the bridge crane; (c) panel assembly at the location of the SHIP detector.
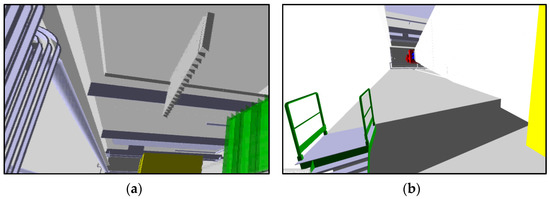
Figure 22.
Interference between models in Navisworks: (a) size of the access opening; (b) the height of the underground hall.
5.3. BIM Construction Scheduling
The entire construction site with DV pre-assembly and final assembly has been simulated using Navisworks with the goal of optimising the management of the entire construction process. The integrated model, including the experimental area, with the terrain, road infrastructures, and buildings surrounding the area has been created using virtual models generated with different software. All these models, once imported into Navisworks, have been federated into a single model, as presented in Figure 23.
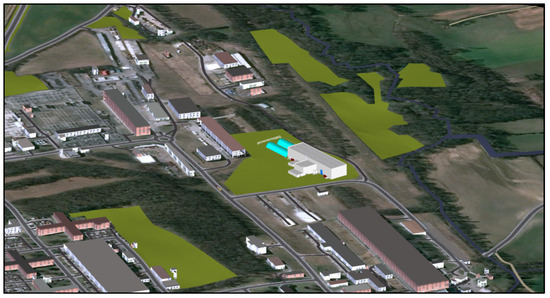
Figure 23.
Image of the experimental area with Autodesk Navisworks.
After the model import phase, the following step regards the Timeliner tool settings using the Work Breakdown Structure (WBS) created with Microsoft Project. It reports all the main processing phases associated with a certain time for the realisation. It starts from the construction of the on-site infrastructure up to the assembly of the DV at the final location of the SHIP detector. A work-breakdown structure (WBS) in project management and systems engineering is a deliverable-oriented breakdown of a project into smaller components. A work breakdown structure is a key project deliverable that organises the team’s work into manageable sections. Each work is assigned to a BIM element in Navisworks corresponding to a specific phase in the time of the realisation of the entire system.
5.4. Interferences between Construction Tasks
The verification of the interferences between the various models has been done through Navisworks using the Clash detection function. It allows for the setting of a series of rules to check for interferences throughout the construction process. Each update of the specific in situ mounting operations of the other sub-components of the experiment is followed by a check of the full compatibility with the operations related to the other sub-components and to their timeline. Examples of problems are identified here only with reference to the assembly strategy of the DV. The tolerance management and the size of the access opening (Figure 22a) between the surface hall and the underground area have been studied. For example, it was found that the height of the underground area had to be increased to allow for the assembly of the last DV sections (Figure 22b).
The interferences have been evaluated with the Navisworks clash detective function, with which, by setting a series of rules, it is possible to verify the interferences between the various objects. For example, the rules have been defined to check if there is an interpenetration between the elements of the decay and the flooring of the experimental area. A tolerance of 0.01 m has been set for this verification. This means that if the distance between the decay elements and the floor is less than 0.01 m, the software reports an error. As an example, an image has been shown (Figure 24) corresponding to a clash of the panel and floor. The image shows two elements of different colours that do not respect the minimum distance of 0.01 m. This issue was addressed by changing the elevation of the Decay Volume.
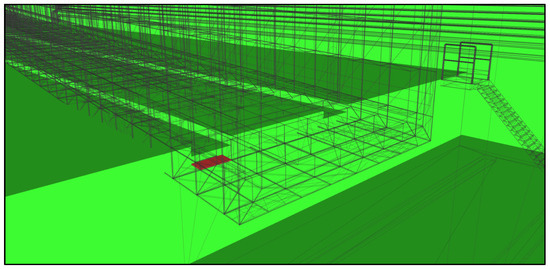
Figure 24.
Results Clash detective between decay and flooring experimental area.
5.5. Repository of All the Information for All the Stakeholders of the Project
The models generated through the BIM methodology during the whole design and realisation process of the DV will be shared in a virtual work area in order to produce a common management and coordination with all the various stakeholders. The projects can be viewed directly through a browser, which allows the user to interact with the 3D models by browsing and searching for information and also to view them from any device, including mobile devices. Within specific review areas, all changes made to the project will be visible in real time, and reports will be sent to all team members. Specific authorisations will also be issued to determine who can download the files and for how long. All data are protected, backed up, and recoverable. In this paper, this aspect of the BIM methodology was dealt with only theoretically, as it is not yet a subject of the study and because information about the other sub-components has not yet been implemented.
5.6. Summary of Issues Solved through the BIM Methodology
With the BIM methodology, it has been possible to study, define, and optimise all the assembly phases of the DV, starting from the construction phase to the phase of joining the various panels within the experimental area. The main objective has been to verify that the hypothesised assembly procedure is feasible and to determine how it affects the entire process of making the device. With the use of Navisworks, the assembly phases within the experimental area were verified through the timeline.
6. Conclusions
This paper reports on the development of BIM integrated design for the SHiP experiment, applied in the first phase to DV, a >2000 m3 conical steel vessel under a vacuum that should host several large particle physics detector systems. The BIM approach to support the integrated design of the DV from the conceptual planning to the construction phase is shown. The geometrical and structural design of the DV has been presented. The BIM geometrical model has reduced the time required for modelling and has increased the geometric precision of the model. Moreover, with the automation of the modelling process, it has been possible to make various comparisons between the different structural models, supporting the designers in choosing the most performing geometry. The simulation of the assembly process of the device is proposed, both in factory and on site. The assembly phases within the experimental area were also verified through the timeline. The use of collaborative platforms to speed up the exchange of ideas, as a basis for a highly multidisciplinary and complex project, is discussed. The final plan for the entire SHiP experiment project is to have a BIM integrated design of each sub-component of the experiment, such as that demonstrated in this work for the DV, in order to have a full and multidisciplinary integration of the overall project.
Supplementary Materials
The following supporting information can be downloaded at: https://www.mdpi.com/article/10.3390/designs6030048/s1, Video S1: Assembly of the DV.
Author Contributions
Conceptualization, A.S., A.M., A.P. and R.J.; methodology, A.S. and A.M.; software and applications, A.S. and A.M.; supervision, A.P. and R.J. All authors have read and agreed to the published version of the manuscript.
Funding
This research received no external funding.
Institutional Review Board Statement
Not applicable.
Informed Consent Statement
Not applicable.
Data Availability Statement
Some or all of the data, models, or code that support the findings of this study are available from the corresponding author upon request.
Acknowledgments
The authors would like to thank Giuseppe Porfidia, who has contributed to the development of the presented work. Moreover, the authors would like to thank CASTALDO SpA for the valuable input on the welding techniques and the assembly procedures. Finally, the authors would like to thank Pablo Santos Diaz for the crucial input on the experimental area description and models.
Conflicts of Interest
The authors declare no conflict of interest.
References
- Bonivento, W.; Boyarsky, A.; Dijkstra, H.; Egede, U.; Ferro-Luzzi, M.; Goddard, B.; Golutvin, A.; Gorbunov, D.; Jacobsson, R.; Panman, J.; et al. Proposal to search for heavy neutral leptons at the SPS. arXiv 2013, arXiv:1310.1762. [Google Scholar]
- Anelli, M.; Aoki, S.; Arduini, G.; Back, J.J.; Bagulya, A.; Baldini, W.; Baranov, A.; Barker, G.J.; Barsuk, S.; Battistin, M.; et al. A facility to Search for Hidden Particles (SHiP) at the CERN SPS. arXiv 2015, arXiv:1504.04956. [Google Scholar]
- Akmete, A.; Alexandrov, A.; Anokhina, A.; Aoki, S.; Atkin, E.; Azorskiy, N.; Back, J.; Bagulya, A.; Baranov, A.; Barker, G.; et al. The active muon shield in the SHiP experiment. J. Instrum. 2017, 12, P05011. [Google Scholar] [CrossRef][Green Version]
- Ahdida, C.; Albanese, R.; Alexandrov, A.; Anokhina, A.; Aoki, S.; Arduini, G.; Atkin, E.; Azorskiy, N.; Back, J.; Bagulya, A.; et al. The experimental facility for the Search for Hidden Particles at the CERN SPS. J. Instrum. 2019, 14, P03025. [Google Scholar] [CrossRef]
- Ahdida, C.; Albanese, R.; Alexandrov, A.; Anokhina, A.; Aoki, S.; Arduini, G.; Atkin, E.; Azorskiy, N.; Back, J.J.; Bagulya, A.; et al. SHiP Experiment|Progress Report. CERN-SPSC-2019-010. 2019. Available online: https://cds.cern.ch/record/2654870 (accessed on 31 January 2021).
- AIA Contract Document G202. In Building Information Modeling Protocol Form; AIA: Washington, DC, USA, 2013.
- Messner, J.; Anumba, C.; Dubler, C.; Goodman, S.; Kasprzak, C.; Kreider, R.; Leicht, R.; Saluja, C.; Zikic, N. BIM Project Execution Planning Guide, Version 2.2–Computer Integrated Construction Research Program; The Pennsylvania State University: University Park, PA, USA, 2019. [Google Scholar]
- Eastman, C.; Teicholz, P.; Sacks, R.; Liston, K. BIM Handbook–A Guide to Building Information Modeling for Owners, Managers, Designers, Engineers, and Contractors; John Wiley & Sons Inc.: Hoboken, NJ, USA, 2011. [Google Scholar]
- Salzano, A. Metodologie BIM per la Progettazione Integrata di Interventi di Riqualificazione e Rinforzo Strutturale Orientati alla Sostenibilità Ambientale. Ph.D. Thesis, University of Naples Federico II, Naples, Italy, 2015. (In Italian). [Google Scholar]
- Ahdida, C.; Albanese, R.; Alexandrov, A.; Anokhina, A.; Aoki, S.; Arduini, G.; Atkin, E.; Azorskiy, N.; Back, J.; Bagulya, A.; et al. Fast simulation of muons produced at the SHiP experiment using Generative Adversarial Networks. J. Instrum. 2019, 14, P11028. [Google Scholar] [CrossRef]
- Ahdida, C.; Akmete, A.; Albanese, R.; Alexandrov, A.; Anokhina, A.; Aoki, S.; Arduini, G.; Atkin, E.; Azorskiy, N.; Back, J.J.; et al. Measurement of the muon flux from 400 GeV/c protons interacting in a thick molybdenum/tungsten target. Eur. Phys. J. C 2020, 80, 1–11. [Google Scholar] [CrossRef]
- Ehlert, M.; Hollnagel, A.; Korol, I.; Korzenev, A.; Lacker, H.; Mermod, P.; Schliwinski, J.; Shihora, L.; Venkova, P.; Wurm, M. Proof-of-principle measurements with a liquid-scintillator detector using wavelength-shifting optical modules. J. Instrum. 2019, 14, P03021. [Google Scholar] [CrossRef]
- Lin, Y.-C.; Jung, S.; Su, Y.-C. Construction database-supported and BIM-based interface communication and management: A pilot project. Adv. Civ. Eng. 2019, 2019, 8367131. [Google Scholar] [CrossRef]
- Lin, Y.-C.; Lin, C.-P.; Shueh, T.-S.; Hu, H.-T. Collaboration-Based BIM Model Development Management System for General Contractors in Infrastructure Projects. J. Adv. Transp. 2020, 2020, 8834389. [Google Scholar] [CrossRef]
- Qiu, Q.; Zhou, X.; Zhao, J.; Yang, Y.; Tian, S.; Wang, J.; Liu, J.; Liu, H. From sketch BIM to design BIM: An element identification approach using Industry Foundation Classes and object recognition. Build. Environ. 2021, 188, 107423. [Google Scholar] [CrossRef]
- Dynamo. Autodesk Dynamo. 2021. Available online: https://dynamobim.org/credits/ (accessed on 31 January 2021).
- Revit. Autodesk Revit Architecture, Developer Autodesk Inc. 2021. Available online: https://www.autodesk.com/products/revit/overview (accessed on 31 January 2021).
- Robot. Autodesk Robot Structural Analysis Professional, Developer Autodesk Inc. 2019. Available online: https://www.autodesk.com/products/robot-structural-analysis/overview (accessed on 31 January 2021).
- Navisworks. Autodesk Navisworks, developer Autodesk Inc. 2021. Available online: https://www.autodesk.com/products/navisworks/overview (accessed on 31 January 2021).
- Infraworks. Autodesk Infraworks. 2019. Available online: https://help.autodesk.com/view/INFMDR/ITA/ (accessed on 31 January 2021).
- Catia. Version 3d Experience, Dasault Systemes, Developer Autodesk Inc. 2019. Available online: https://www.autodesk.com/products/character-generator/overview (accessed on 31 January 2021).
- Microsoft Project 365. Developer Microsoft Corporation. 2021. Available online: https://www.microsoft.com/en-us/microsoft-365/project/project-management-software (accessed on 31 January 2021).
- Autodesk BIM 360. Autodesk BIM 360, Developer Autodesk Inc. 2021. Available online: https://www.autodesk.com/products/bim-collaborate/overview (accessed on 31 January 2021).
- Lopez, R.; Chong, H.Y.; Wang, X.; Graham, J. Technical review: Analysis and appraisal of four-dimensional building information modeling usability in construction and engineering projects. J. Constr. Eng. Manag. 2016, 142, 06015005. [Google Scholar] [CrossRef]
- Park, J.; Cai, H.; Dunston, P.S.; Ghasemkhani, H. Database-supported and web-based visualization for daily 4D BIM. J. Constr. Eng. Manag. 2017, 143, 04017078. [Google Scholar] [CrossRef]
- Song, J.; Migliaccio, G.C.; Wang, G.; Lu, H. Exploring the Influence of System Quality, Information Quality, and External Service on BIM User Satisfaction. J. Manag. Eng. 2017, 33, 04017036. [Google Scholar] [CrossRef]
- Ma, X.; Xiong, F.; Olawumi, T.O.; Dong, N.; Chan, A.P. Conceptual framework and roadmap approach for integrating BIM into lifecycle project management. J. Manag. Eng. 2018, 36, 05018011. [Google Scholar] [CrossRef]
- Hernandez, C.R.B. Thinking parametric design: Introducing parametric Gaudi. Des. Stud. 2006, 27, 309–324. [Google Scholar] [CrossRef]
- Miano, A.; Fiorillo, A.; Salzano, A.; Prota, A.; Jacobsson, R. The structural design of the decay volume for the Search for Hidden Particles (SHIP) project. Arch. Civ. Mech. Eng. 2021, 21, 3. [Google Scholar] [CrossRef]
- EN 1990; Eurocode 0: Basis of Structural Design. European Committee for Standardization: Brussels, Belgium, 2002.
- EN 1998-1; Eurocode 8: Design of Structures for Earthquake Resistance–Part 1: General Rules, Seismic Actions and Rules for Buildings. European Committee for Standardization: Brussels, Belgium, 2004.
- EN 1993; Eurocode 3: Design of Steel Structures–Part 1–3: General Rules–Supplementary Rules for Cold-Formed Members and Sheeting. European Committee for Standardization: Brussels, Belgium, 2006.
- Microsoft Excel 365. Developer Microsoft Corporation. 2021. Available online: https://www.microsoft.com/en-us/microsoft-365/excel (accessed on 31 January 2021).
- LOD. Level of Development Specification–For Building Information and Data–BIM Forum for General Information on the Documents. 2020. Available online: https://bimforum.org/LOD/ (accessed on 31 January 2021).
- Zhou, X.; Zhao, J.; Wang, J.; Su, D.; Zhang, H.; Guo, M.; Li, Z. OutDet: An algorithm for extracting the outer surfaces of building information models for integration with geographic information systems. Int. J. Geogr. Inf. Sci. 2019, 33, 1444–1470. [Google Scholar] [CrossRef]
- IFC. Industry Foundation Classes for Data Sharing in the Construction and Facility Management Industries–Part 1: Data Schema. 2020. ISO 16739-1:2020. Available online: https://www.iso.org/standard/70303.html (accessed on 31 January 2021).
- EN 1090-1; Execution of Steel Structures and Aluminium Structures–Part 1: Requirements for Conformity Assessment of Structural Components. European Committee for Standardization: Brussels, Belgium, 2012.
- EN 1090-2; Execution of Steel Structures and Aluminium Structures–Part 2: Technical Requirements for Steel Structures. European Committee for Standardization: Brussels, Belgium, 2018.


Publisher’s Note: MDPI stays neutral with regard to jurisdictional claims in published maps and institutional affiliations. |
© 2022 by the authors. Licensee MDPI, Basel, Switzerland. This article is an open access article distributed under the terms and conditions of the Creative Commons Attribution (CC BY) license (https://creativecommons.org/licenses/by/4.0/).