Article

A Framework for CO2 Emission Reduction in Manufacturing Industries: A Steel Industry Case

by
Panagiotis Stavropoulos
1,*,
Vasiliki Christina Panagiotopoulou
1,
Alexios Papacharalampopoulos
1,
Panagiotis Aivaliotis
1,
Dimitris Georgopoulos
1 and
Konstantinos Smyrniotakis
2
1
Laboratory for Manufacturing Systems and Automation, University of Patras, 26504 Patras, Greece
2
SIDENOR S.A., Mesogeion 2-4, 11527 Athens, Greece
*
Author to whom correspondence should be addressed.
Designs 2022, 6(2), 22; https://doi.org/10.3390/designs6020022
Submission received: 14 January 2022 / Revised: 21 February 2022 / Accepted: 24 February 2022 / Published: 1 March 2022
(This article belongs to the Section Energy System Design)

Abstract

:
Rising carbon emissions are linked to the increase in global temperature, because of increasing human activities and increasing greenhouse gas emissions. Since manufacturing is one of the most carbon intensive sectors, it is vital to suggest solutions that lead to carbon emission reduction in all sectors, among which is the steelmaking manufacturing sector. The present study focuses on presenting a framework for energy intensive industries introducing digitalization and energy efficient equipment in the production line. The current framework proposes different metrics, both from carbon emissions and cost viewpoints. A secondary steelmaking industry was used as a case study, showcasing the impact of digitalization and energy efficient equipment towards the reduction of carbon emissions. In addition, different metrics were calculated with energy efficient scenarios providing the lowest energy consumption metric, but their high purchasing costs make these scenarios less attractive. However, if carbon emission reduction per cost is the metric, a combination of digital tools and energy efficient equipment is the answer to the company’s needs. Applying the concepts of innovation absorption and digitalization, the number of alternatives is kept low, however, the impact on the line is quite large. The introduction of new technologies is also supported by training of the workforce, aligning the framework with current industrial trends.

1. Introduction

Increasing global temperature is linked to high greenhouse gas emissions due to human activities. Carbon dioxide is the gas with the highest concentration; hence, it is used to calculate carbon footprint, a metric used to quantify the environmental impact of products, services, infrastructures or even individuals [1,2]. The EU Commission is supporting the transition towards clean production via the Green Deal strategy [3] which outlines the medium-term goals (until 2030) and long-term goals (2050), in order for Europe to become the first climate-neutral continent by 2050. In the European industrial sector, the top three sectors in terms of their contribution to energy consumption and carbon emissions are: iron and steel (22%), refineries (19%), and cement (18%) [4]. Applying EU policies and carbon decreasing technologies, emissions dropped by 40% in the iron and steel sector between 1990 and 2018, with carbon emissions in cement decreasing by 30% and 5% in refineries [4]. The European steel industry accounted for 7% of verified emissions of non-mobile installations within EU. The greatest contributor is primary steelmaking which is based on the use of ore and refers to 60% of steel production. The secondary route is using scrap metals and results in fewer carbon emissions, hence, there is a shift from the primary to secondary route. This shift along with technological improvements has led to a reduction of the sector emissions by 25–30% compared to the 2010 values [5].
The Fourth Industrial Revolution (from now on referred to as Industry 4.0) focuses on the digital transformation of the manufacturing and industrial sector. The main attributes of Industry 4.0 are the automation of the production line and the development of cyber-physical systems with ability for communication and interaction between the physical and the cyber components. Industry 4.0 approaches have already been implemented in manufacturing settings, either in case examples [6] or in developing modeling methods and virtual technologies [7], such as Internet of Things, big data analytics, smart and cloud-based manufacturing [8]. A variety of technologies have been identified that will further decrease the carbon footprint and these are divided into two groups: (a) technologies that reduce the carbon emissions of current processes, via improving energy efficiency, electrification, use of renewable sources such as biomass and deep geothermal energy, and carbon capture and storage; (b) new production pathways with a lower carbon footprint via carbon capture and utilization, process intensification and circular economy.
Human integration in the manufacturing processes is a critical aspect of Industry 4.0, in order to continuously improve and focus on value adding industries and eliminating wastes within the concept of Industry 4.0. Digitalization is estimated to lead to a 32% productivity increase until 2025 [9]. This increase is linked to an improved data collection, distribution, analysis, and usage [10,11,12,13]. This social aspect of Industry 4.0 is integrated into Industry 5.0, where the use of technology targets the return of added human value to manufacturing, going from a digital manufacturing era to a digital society era [14].
Green manufacturing is defined as the effort to reduce the environmental impact of human activities, and to create a more resource efficient and competitive economy [15,16]. This is feasible via integrating technological advancements in current manufacturing practices, while following an action plan that aims at a better use of resources, within the context of carbon neutrality, circularity, and restoration of biodiversity. Carbon neutrality refers to the lowering of carbon emissions until the EU becomes the first continent with zero carbon emissions by 2050, as determined by Green Deal. Circularity, on the other hand, invests in recycling materials, in order to decrease the extraction of raw materials. Last but not least, restoration of biodiversity is a direct result of introducing environmentally friendly approaches and by respecting the ecosystem and the environment in general. Green manufacturing is not only investing in environmentally sustainable technologies, supporting innovative solutions in industry, decarbonization, and cross-sectoral collaboration, but also aims to use resources in closed-loop systems to minimize pollution and carbon footprint and to address resource leakage through the sustainable economic growth. The transition towards circular economy involves the implementation of systematic approaches and policies at a regional level and performing practice-based business development with a long-term perspective. Some of the digital tools that support technology metamodeling are Life Cycle Analysis (LCA), Industrial Symbiosis, Circularity Performance Assessment, and new business models evaluation. There are also other aspects of manufacturing, such as sustainable manufacturing, e.g., process planning and scheduling, or remanufacturing/recycling, where quality criteria are used in digital optimization tools. The social and humanitarian aspects of green manufacturing consist of digital tools that support green customization and social awareness, considering regions and people, with private and public stakeholders, and raising awareness of the citizens towards sustainability. The energy demand of the industrial sector accounts for 25% of the entire EU energy demand [17]. Bearing in mind that energy consumption contributes up to 73.2% of the global greenhouse gas emissions [18] and that one of the main contributors is the industrial sector [19], it is clear that a decrease in energy consumption and carbon emissions in manufacturing will have a large impact on the overall reduction in carbon emissions in the EU.
Examples of ways to reduce the carbon emissions by using available technologies were presented by the EU Commission [4]. Namely, more scrap recycling is a manifestation of circular economy in action, while in terms of electrification, use of an electric arc furnace or electrolysis of iron ore are potential ways to decrease the carbon footprint. There are also options to use carbon storage solutions, or use alternative power sources, such as hydrogen or biomass. The combination of different measures can reduce the emissions of the sector by 75%. A roadmap commissioned by the steel industry predicted reductions ranging from 10% to 36% by 2050 compared to 2015 [20], without any use of carbon capture or storage techniques. When these technologies are successfully implemented, the carbon emissions will be further reduced. In parallel, the secondary steelmaking route is expected to increase its share up to 85% by 2050 [20], leading to an additional reduction in carbon emissions of the steel industry sector. According to WEF, investment in digital technologies is necessary for the mining and metal community, for the industry to remain relevant, competitive, and sustainable, to create cross-industrial partnerships with other industries, and to engage in public–private collaborations [21].
In the literature, there are frameworks for energy consumption reduction in sheet metal forming [22] or manufacturing scheduling strategies, with the most important parameters being power load, energy consumption, and environmental impact for modeling the flow shop scheduling problem [23]. With the use of IoT, the model aims to increase the visibility and awareness of energy consumption, using smart sensors and meters at both machine and production line levels. Real-time energy consumption data from MFG processes can be easily collected and analyzed to improve decision making. This framework supports the integration of already collected energy data into company databases and software solutions. In this way, the framework highlights which data should be used as decision-making parameters to improve energy efficiency, and the competitiveness of the companies. Within the company infrastructure, energy managers can use this framework, to address those energy management practices that are more aligned with company maturity, measurable data, and available information systems and tools [24].
A more realistic workshop model known as ultra-flexible job shop (uFJS)-sequence can be altered adding certain constraints, in order to formulate this energy-efficient scheduling problem. The basis of the model includes a mixed integer linear programming model, to address large-sized problems, followed by proposing a genetic algorithm (GA). The implementation of the modeling approach led to numerical results showing that the proposed solution was effective and efficient. Adding flexibility into the operation sequencing, the uFJS includes process planning and scheduling, thus providing more information and more energy-efficient solutions. Therefore, the approach provides an ideal platform for decision-makers when developing energy-efficient techniques and strategies [23]. Most frameworks in the literature are problem-based, focusing on a specific product/process and addressing a well-defined need, e.g., improving the energy efficiency of the process. In this way, each framework was developed to fit a specific problem, and cannot be adapted in other processes or production lines. Therefore, there is no generalized approach that can be easily applied to a variety of cases.
This paper aims to formulate a general framework for decreasing the carbon emissions in manufacturing, by identifying the carbon intensive parts and implementing concepts from Industry 4.0 that can be easily introduced in the industrial setting, despite the type or category of industry. The example of a steelmaking factory is used to showcase the applicability of the framework, since it is considered one of the most energy-intensive industries.

2. Approach

The hierarchical approach in manufacturing, as indicated in the Figure 1, is highly useful for the current case. Any entity can be studied under this framework, as well as the interactions between the entities. Process-level is the lowest level, however, in reality it cannot be decoupled from the machine itself since the process mechanism involves specific delivery from the machine modules. Additionally, the Cyber–Physical System concept interrelates machines into a production line and they interact with the whole factory through the Industry 4.0 or even the Industry 5.0 concept.
As a matter of fact, this has been devised for the case of discrete manufacturing, however, it seems that it can be generalized (Figure 2); metrics, either per part, or per spatial unit, can be unified utilizing the concept of production rate. Thus, temporal rates of metrics can be used instead.
Furthermore, there is a plethora of sustainability metrics that predate the Green Deal, such as Triple ‘P’ Sustainability [23]. These can all be used under the prism of interconnected subsystems implied above and the cascaded Key Performance Indicators (KPIs) [24]. Furthermore, the use of local changes renders the optimization feasible and implementable; the theoretical background behind this could be considered to be the concept of the optimal substructure [25,26] and the application of Bellman’s principle of optimality [27]. Finally, it is worth mentioning that the Pareto-optimality is applied at its best in similar cases [28] as the feasibility of a solution can be used to justify the integration of the “invasiveness” of an alternative scenario. In the same sense, a modified version of the 80-20 rule [29] can be integrated under the framework of feeding the discrete optimization algorithm with engineers’ knowledge and transforming it into a heuristic algorithm towards faster execution.
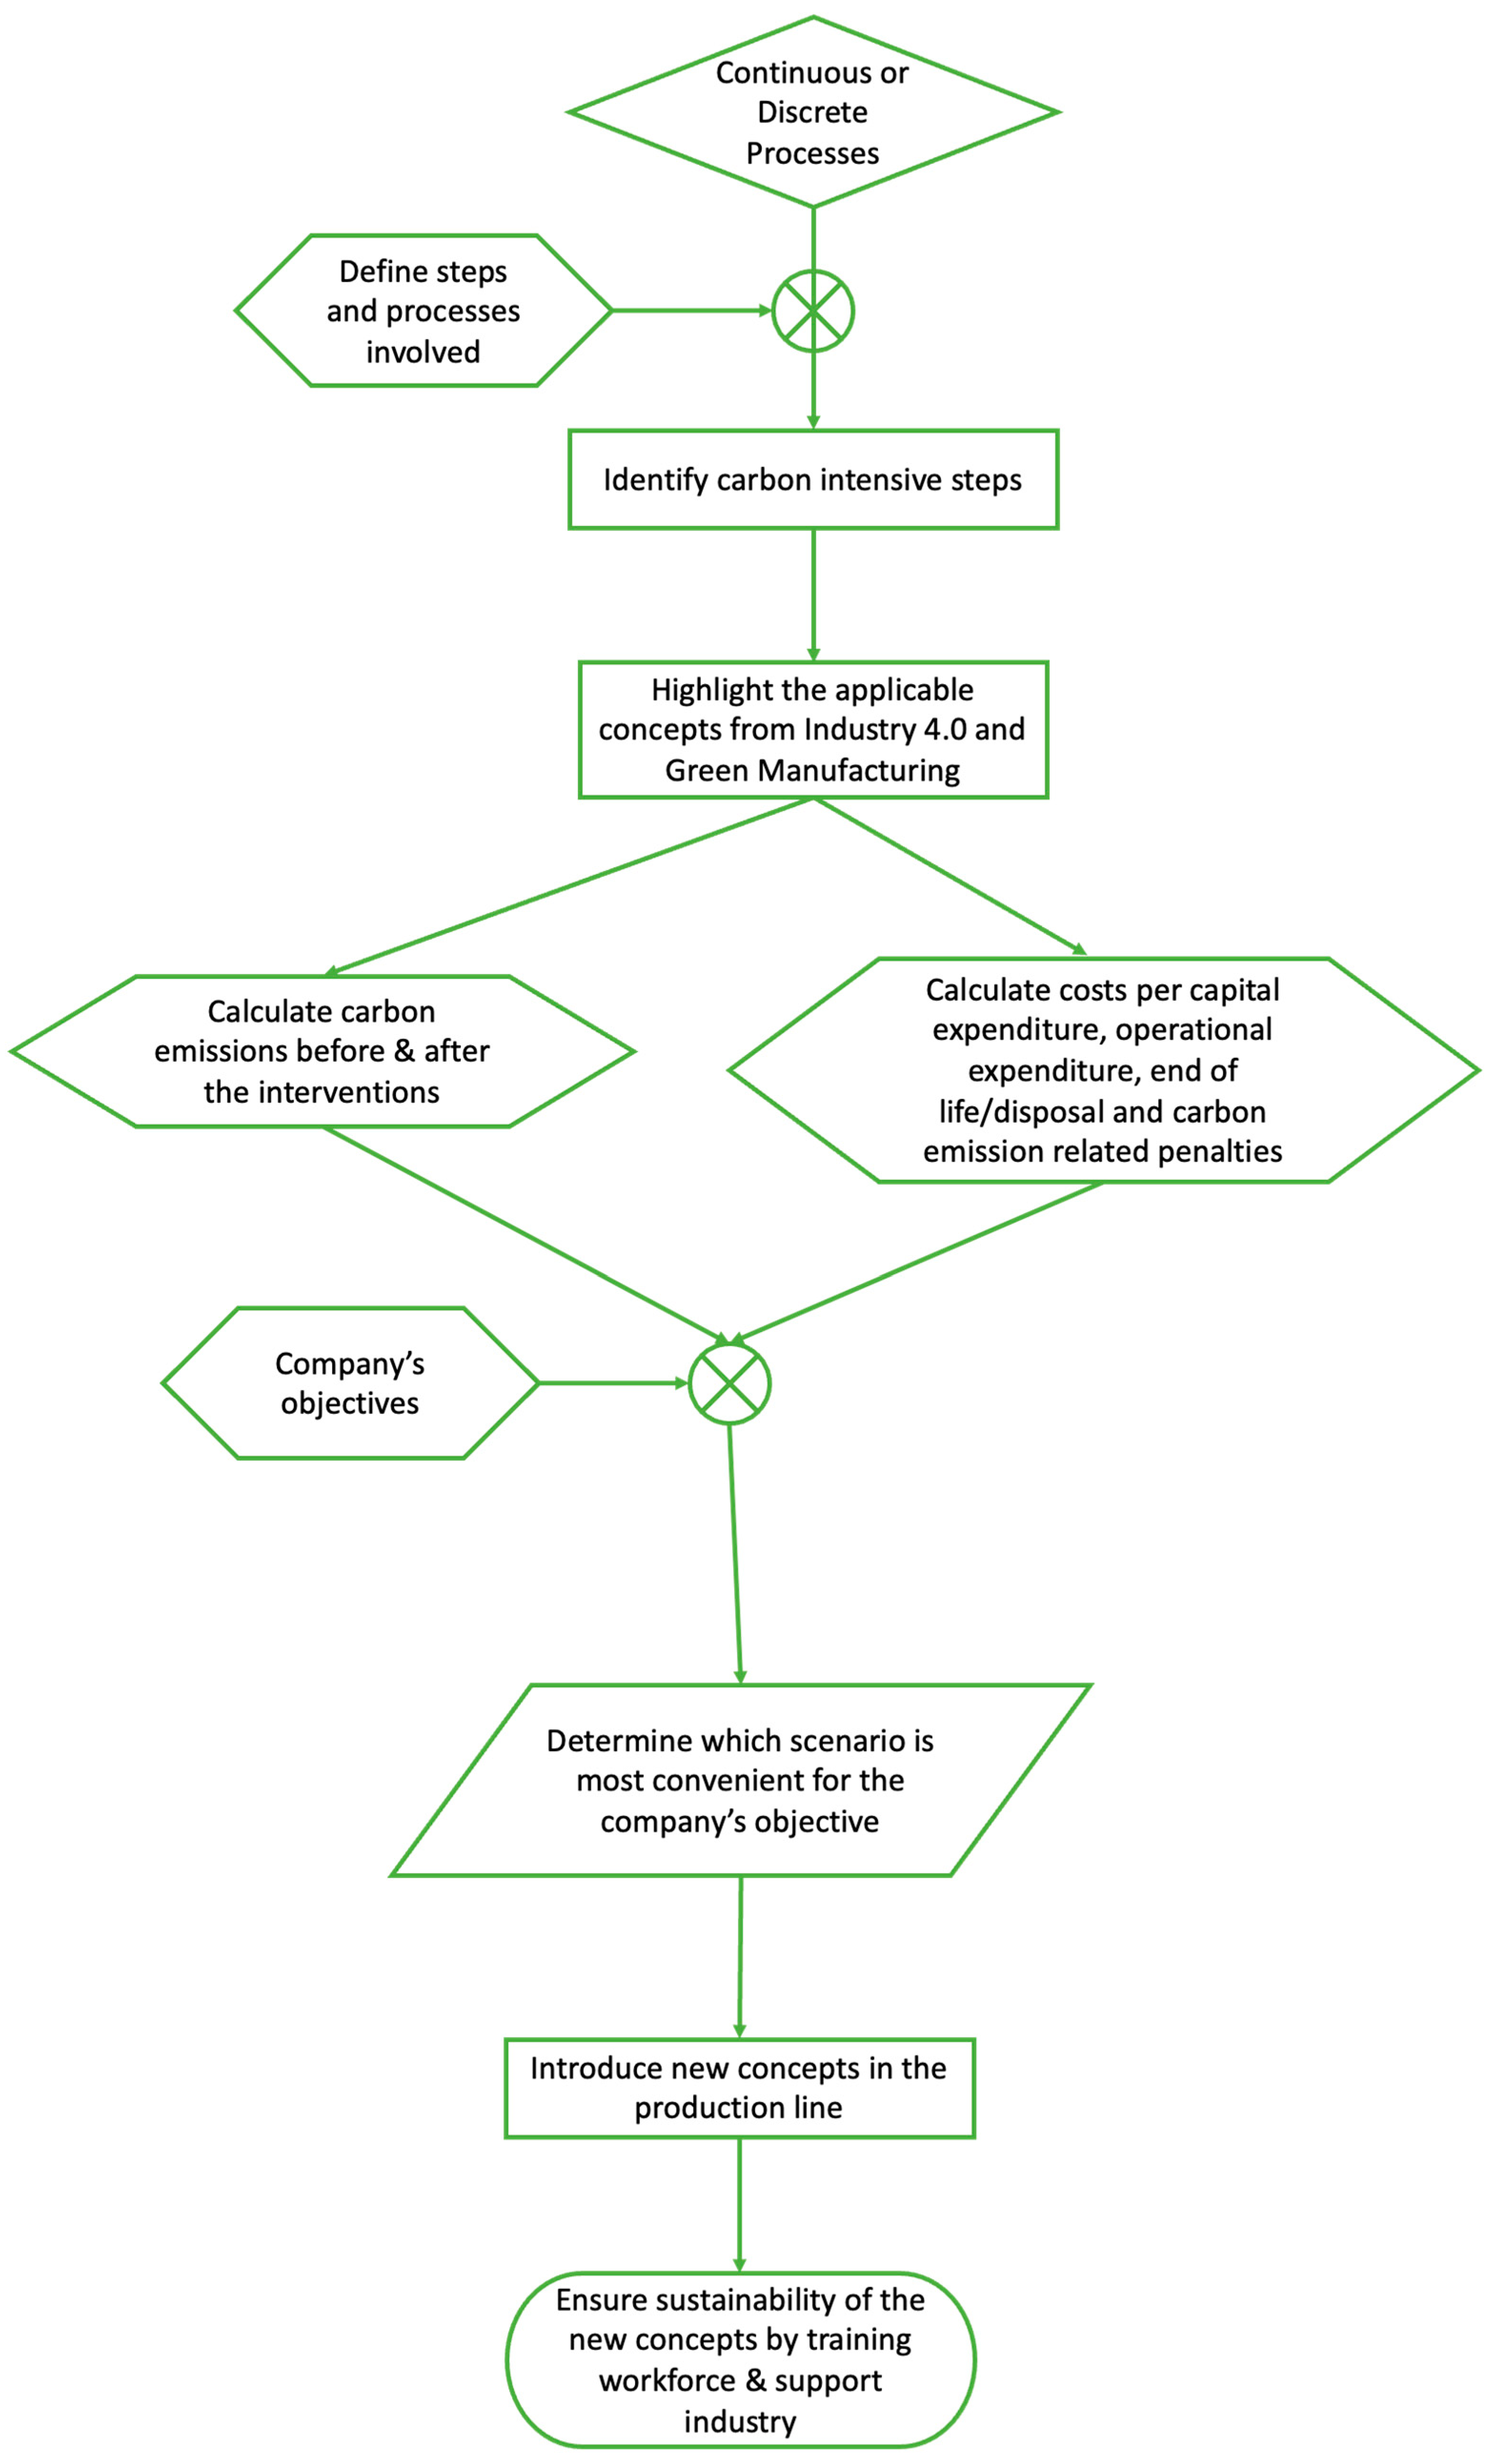
As seen in Figure 2, the next step is the definition of steps and processes that are included in the framework calculation. The different steps, inputs and outputs in each part of the process and production are defined in this step. A Life Cycle Analysis (LCA) can provide a detailed description of all steps and is used in many approaches. Life Cycle Assessment is a standardized methodology that quantifies the potential environmental impacts of manufacturing at the level of a product or a system, taking into consideration the different steps of the development of the product, from extraction of raw materials, transport, production, assembly, to use and end-of-life treatment. This allows for an in-depth description of the environmental performance of the system to support decision-making processes. It is important to define the boundaries of the system in question, since the carbon emissions of transporting materials to and from the industry, the production of raw materials, or the disposal of waste can largely contribute to the carbon footprint of the product [1,30,31,32]. Most studies restrict the system to the physical environment of the factory, hence, transport to/from the site, production or disposal are excluded from the calculation of the carbon footprint.
It is equally important to define the objectives of the application example, in other words to describe what goals in each case study are because of the different needs and aspirations of each company. Some companies are more interested in becoming green manufacturers, by improving their energy efficiency or even switching to renewable sources, while others are more interested in maintaining the product cost at the same levels.
Once all steps of the production line have been identified, it is critical to identify which parts/steps require improvement. The steps and processes that are the most energy-intensive and/or with the highest carbon emissions will then be identified. The concepts from Industry 4.0 and green manufacturing that are relevant to the case and are applicable will be listed, to provide solutions both from the digitalization aspect and the energy-efficient point of view. A description of the concepts of Industry 4.0 that can be used in each part/step is provided and rated according to how easily it is applied and what alterations need to be done prior to their integration. Fundamental concepts from Industry 4.0 [33] are as follows:
  • Smart Factory: sensors, actors, and autonomous systems will be implemented in MFG. “Smart technology” includes digital models of products and factories (digital factory) and uses various technologies of computing.
  • Cyber Physical Systems: where the physical systems are modeled and a cyber model has been developed. At a production level, new systems are developed with both aspects including physical and digital representation which cannot be distinguished.
  • Self-organization: decentralization as a new aspect of MFG systems is accompanied by a decomposition of classic production hierarchy.
  • New systems in the development in distribution and procurement: distribution will become individualized and processes will be handled via using different channels.
  • New systems in the development of products and services: product and service development will be individualized.
  • Adaptation to human needs: new approaches should follow and adapt to human needs instead of the reverse.
  • Social responsibility on the corporate level: sustainability and resource-efficiency are the new focus of the design of industrial MFG processes.
Energy consumption and carbon emissions are calculated for the reference case and the different solutions, followed by the cost calculation. The costs include capital expenditure, operational expenditure, end of life/disposal cost, and carbon emission related penalties before the introduction of new solutions (reference case) and after the new solutions (digital or energy efficient scenarios). The company needs to define its goals and metrics to adapt the new technologies, whether that is the ultimate reduction of carbon emissions, or the lowest ratio of carbon emissions per required cost. This will help them to determine what scenario aligns with the company’s vision. Similarly, the relevant concepts from Green Deal, Carbon Neutral Economy, and Circular Economy should be listed and rated for their applicability in each part/step.
In each step, concepts from both Industry 4.0 and green manufacturing should be merged and used to determine what criteria from the list will be used. Criteria for the selection of the concepts are as follows: (1) the maturity of the solution, e.g., is it still at research level or is there a product available in the market? (2) is it preferable to go for an energy efficiency approach or for a digitalized methodology? (3) if there is no available market ready solution, is it possible to initiate industry–academia collaboration to make this product? Once the concepts are identified, a list of the software and hardware solutions will be made, to provide information about their aim and impact on the production line.
The next steps include the introduction of the new concepts in the production line, but also to ensure the sustainability of the new solutions by training the workforce and support the company applying concepts from Education 4.0 and Teaching Factories.

3. Case Study

The case example that will illustrate the applicability of the abovementioned framework is a secondary steelmaking industry in Europe. Scrap material is transferred to the site and categorized, melted in the meltshop using an electric arc furnace (EAF), then rolled in round bars of specific dimensions in the rolling mill and further post-processed to ensure the optimal characteristics of the steel bars.
It seems that sustainability can be achieved through optimization. Under the concept of Industry 4.0, various Key Enabling Technologies (KETs) can be used to this end. A quick recap can bring into spotlight two of them, under the use of which the others can be considered auxiliary. Namely, the two important KETs are integration and Digital Twin, corresponding to hardware and software changes, respectively, for each one of the manufacturing stations, regardless of the production being discrete or continuous.

3.1. Define Steps and Processes Involved

In this case example, the boundaries of the system coincide with the physical boundaries of the factory, meaning that production, disposal and transport of materials are not taken into consideration. There are four main stages in the production of steel bars:
  • Scrap yard, where the material is collected prior to melting.
  • Melt shop, where the scrap material is melted.
  • Rolling mill, where the melted steel takes the form of rolling bars.
  • Downstream processing, where steel products obtain their finished properties.

3.2. Identify Carbon Intensive Steps

The most energy demanding and carbon intensive stages are the meltshop, the rolling mill, and the downstream processing. In detail, the meltshop includes an EAF that consumes a significant amount of energy in order to reach the melting temperature of the scrap material. In the rolling mill, the highest energy demand is from the reheating furnace that is used for the melted steel to reach the optimal temperature for the rolling, in a homogeneous way that does not create scales on the roller’s surface. A furnace also exists in the downstream processing for the final processing of the rolling bars. Therefore, the energy consumption and carbon emissions are linked to the heating of the metal components and the operation of different furnaces along the production line. These furnaces either use natural gas or electrical energy from the national grid to operate, but still both energy sources have a high environmental impact.
The company of the case example was interested in lowering the carbon emissions of its facilities, but most importantly, it was interested in lowering the consumption of natural gas. The reduction of electrical energy consumption was not a priority since renewable sources can be used in the future to move from national grid usage to local solar or biomass energy generation.

3.3. Highlight the Applicable Concepts from Industry 4.0 and Green MFG

Digitalization offers the possibility of control over the production of steel, in terms of identifying the needed melting temperature for both the scrap material available and the final product requirements. It provides real-time information regarding the progress of the production, which can be used to simulate what-if scenarios and re-adapt the processes to ensure that the requested steel bar is produced.
Despite the scrap yard not being an energy intensive step or cause for carbon emissions, the quality of the scrap material affects the melting temperature, melting time and safety in the EAF of the meltshop. Therefore, it was considered critical to improve the identification and classification of scrap material prior to their transport to the melt shop. Software for automated identification and classification will be developed, processing images of the scrap material and categorizing the scrap using artificial intelligence and machine learning. The software will go through a training phase to be able to identify the purity, shape and concentration of the material, while also having the ability to retrain itself as needed. However, circularity concepts are introduced in the meltshop, where recycled scrap material is used. In the meltshop, a digital twin of the EAF will be developed, which will collect data from the EAF, run what-if scenarios to predict the outcome and provide information back to the EAF. Sensors will be added to the EAF, in addition to the ones already existing if required. The energy efficient scenario involves purchasing an energy efficient EAF.
Revamping of the rolling mill will take place to improve the energy efficiency of this stage, as the equipment there is already based on electrical energy. In the downstream processing, an induction furnace will be placed, to decrease the consumption of natural gas, but also boost the efficiency of the process since the induction furnace provides more homogeneous heating of the material.
In all solutions, both energy efficient and digital tools, the aim will be to reduce energy consumption and carbon emissions significantly, aligning with Green Deal and Carbon Neutral Economy.

3.4. Description of Scenarios

The impact of the use of the AI in the scrap yard cannot be quantified prior to its implementation in the production line, hence it was taken out of the calculations in this paper. The focus will be the use of digital tools or the purchase of energy efficient equipment in the meltshop, for the preheating ladles or for the EAF, the rolling mill and the ball mill, for the furnace.
Since there are two options per energy intensive equipment, either via use of digital tools or via purchasing of energy efficient equipment, and the number of energy intensive parts is four, (1) meltshop burners, (2) meltshop EAF, (3) rolling mill and (4) ball mill, the number of scenarios will be 16. This was calculated considering all possible combinations, from scenarios with all steps being digitalized or using energy efficient equipment to scenarios with all possible combinations of digital tools and energy efficient equipment substitution (Table 1).

4. Results

4.1. Calculate Carbon Emissions before and after Interventions

The calculations for energy consumption and fuel consumption were performed using annual values from the steelmaking industry (Table 2). The annual fuel consumption was given in Nm3 for the natural gas for all equipment and in kg for the anthracite consumption of the EAF. The energy consumption was calculated based on the fuel consumption, with the coefficient for the natural gas being 11 kWh/Nm3 and for the anthracite being 9.234 kWh/kg. The carbon emissions were calculated based on the fuel consumption with the coefficient for the natural gas being 0.0019 tons e-CO2/Nm3 of natural gas and the coefficient for the anthracite being 0.0029 e-CO2/kg of anthracite.
In terms of fuel consumption, rolling mill has the highest consumption of natural gas (13,598,920 Nm3), followed by the meltshop burners (4,392,830 Nm3), the ball mill (3,858,660 Nm3) and the EAF in the meltshop (2,109,330 Nm3). The consumption of anthracite by the EAF at the meltshop was calculated as 4,176,000 kg. The energy consumption was then calculated, with 149,588,120 kWh at the rolling mill per year, 48,321,130 kWh at the meltshop burners, 42,445,260 kWh at the ball mill, while at the EAF the energy consumption was calculated as 23,202,630 kWh for the natural gas and 38,561,184 for the anthracite. The carbon emissions per stage were found to be, in order from highest to lowest, 25,837.948 tons eCO2 at the rolling mill, 8346.377 tons eCO2 from the meltshop burners, 7331.454 tons eCO2 at the ball mill. The carbon emissions from the meltshop EAF account for 16,118.127 tons eCO2, with 25% coming from the natural gas consumption, while the rest (75%) originates from the anthracite.
Similar calculations were performed for the case of digitalization of the energy intensive steps (Table 3) and for the case of purchasing energy efficient equipment (Table 4). For the digital tools case, fuel consumption, energy consumption and carbon emissions were reduced by 15% compared to the reference case [34], while energy efficiency resulted in 25% reduction in values compared to the reference case [35].

4.2. Calculate Costs per Capital Expenditure, Operational Expenditure, End of Life/Disposal and Carbon Emission Related Penalties

Based on a recently published framework [36], the cost of an investment consists of costs related to capital expenditure, costs related to operational expenditure, costs from end of life or disposal management and costs from penalties due to carbon emissions. The cost for the reference scenario is summarized in Table 5, for the digital tools solutions in Table 6 and for the energy efficient solutions in Table 7. The full calculation can be found in the Appendix A and Appendix B.

4.3. Company’s Objectives

The highest reduction in carbon emissions may be the starting aim for the company to restructure its production line and to introduce new technologies, but it is not always the driving force for changes. Integration of new technologies requires resources for the capital expenditure to begin with, however, new equipment may also require additional costs for their operation. On the other hand, both digital tools and energy efficient equipment consume less fuel resulting in lower cost regarding the carbon emissions trade system.
Therefore, new metrics such as the following, were calculated (both in absolute values and percentage reduction when compared to the relevant reference value):
  • Carbon emissions.
  • Carbon emissions per fuel consumption.
  • Carbon emissions per capital expenditure.
  • Carbon emissions per operational expenditure.
  • Carbon emissions per cost for emissions trade system.
  • Carbon emissions per total cost.
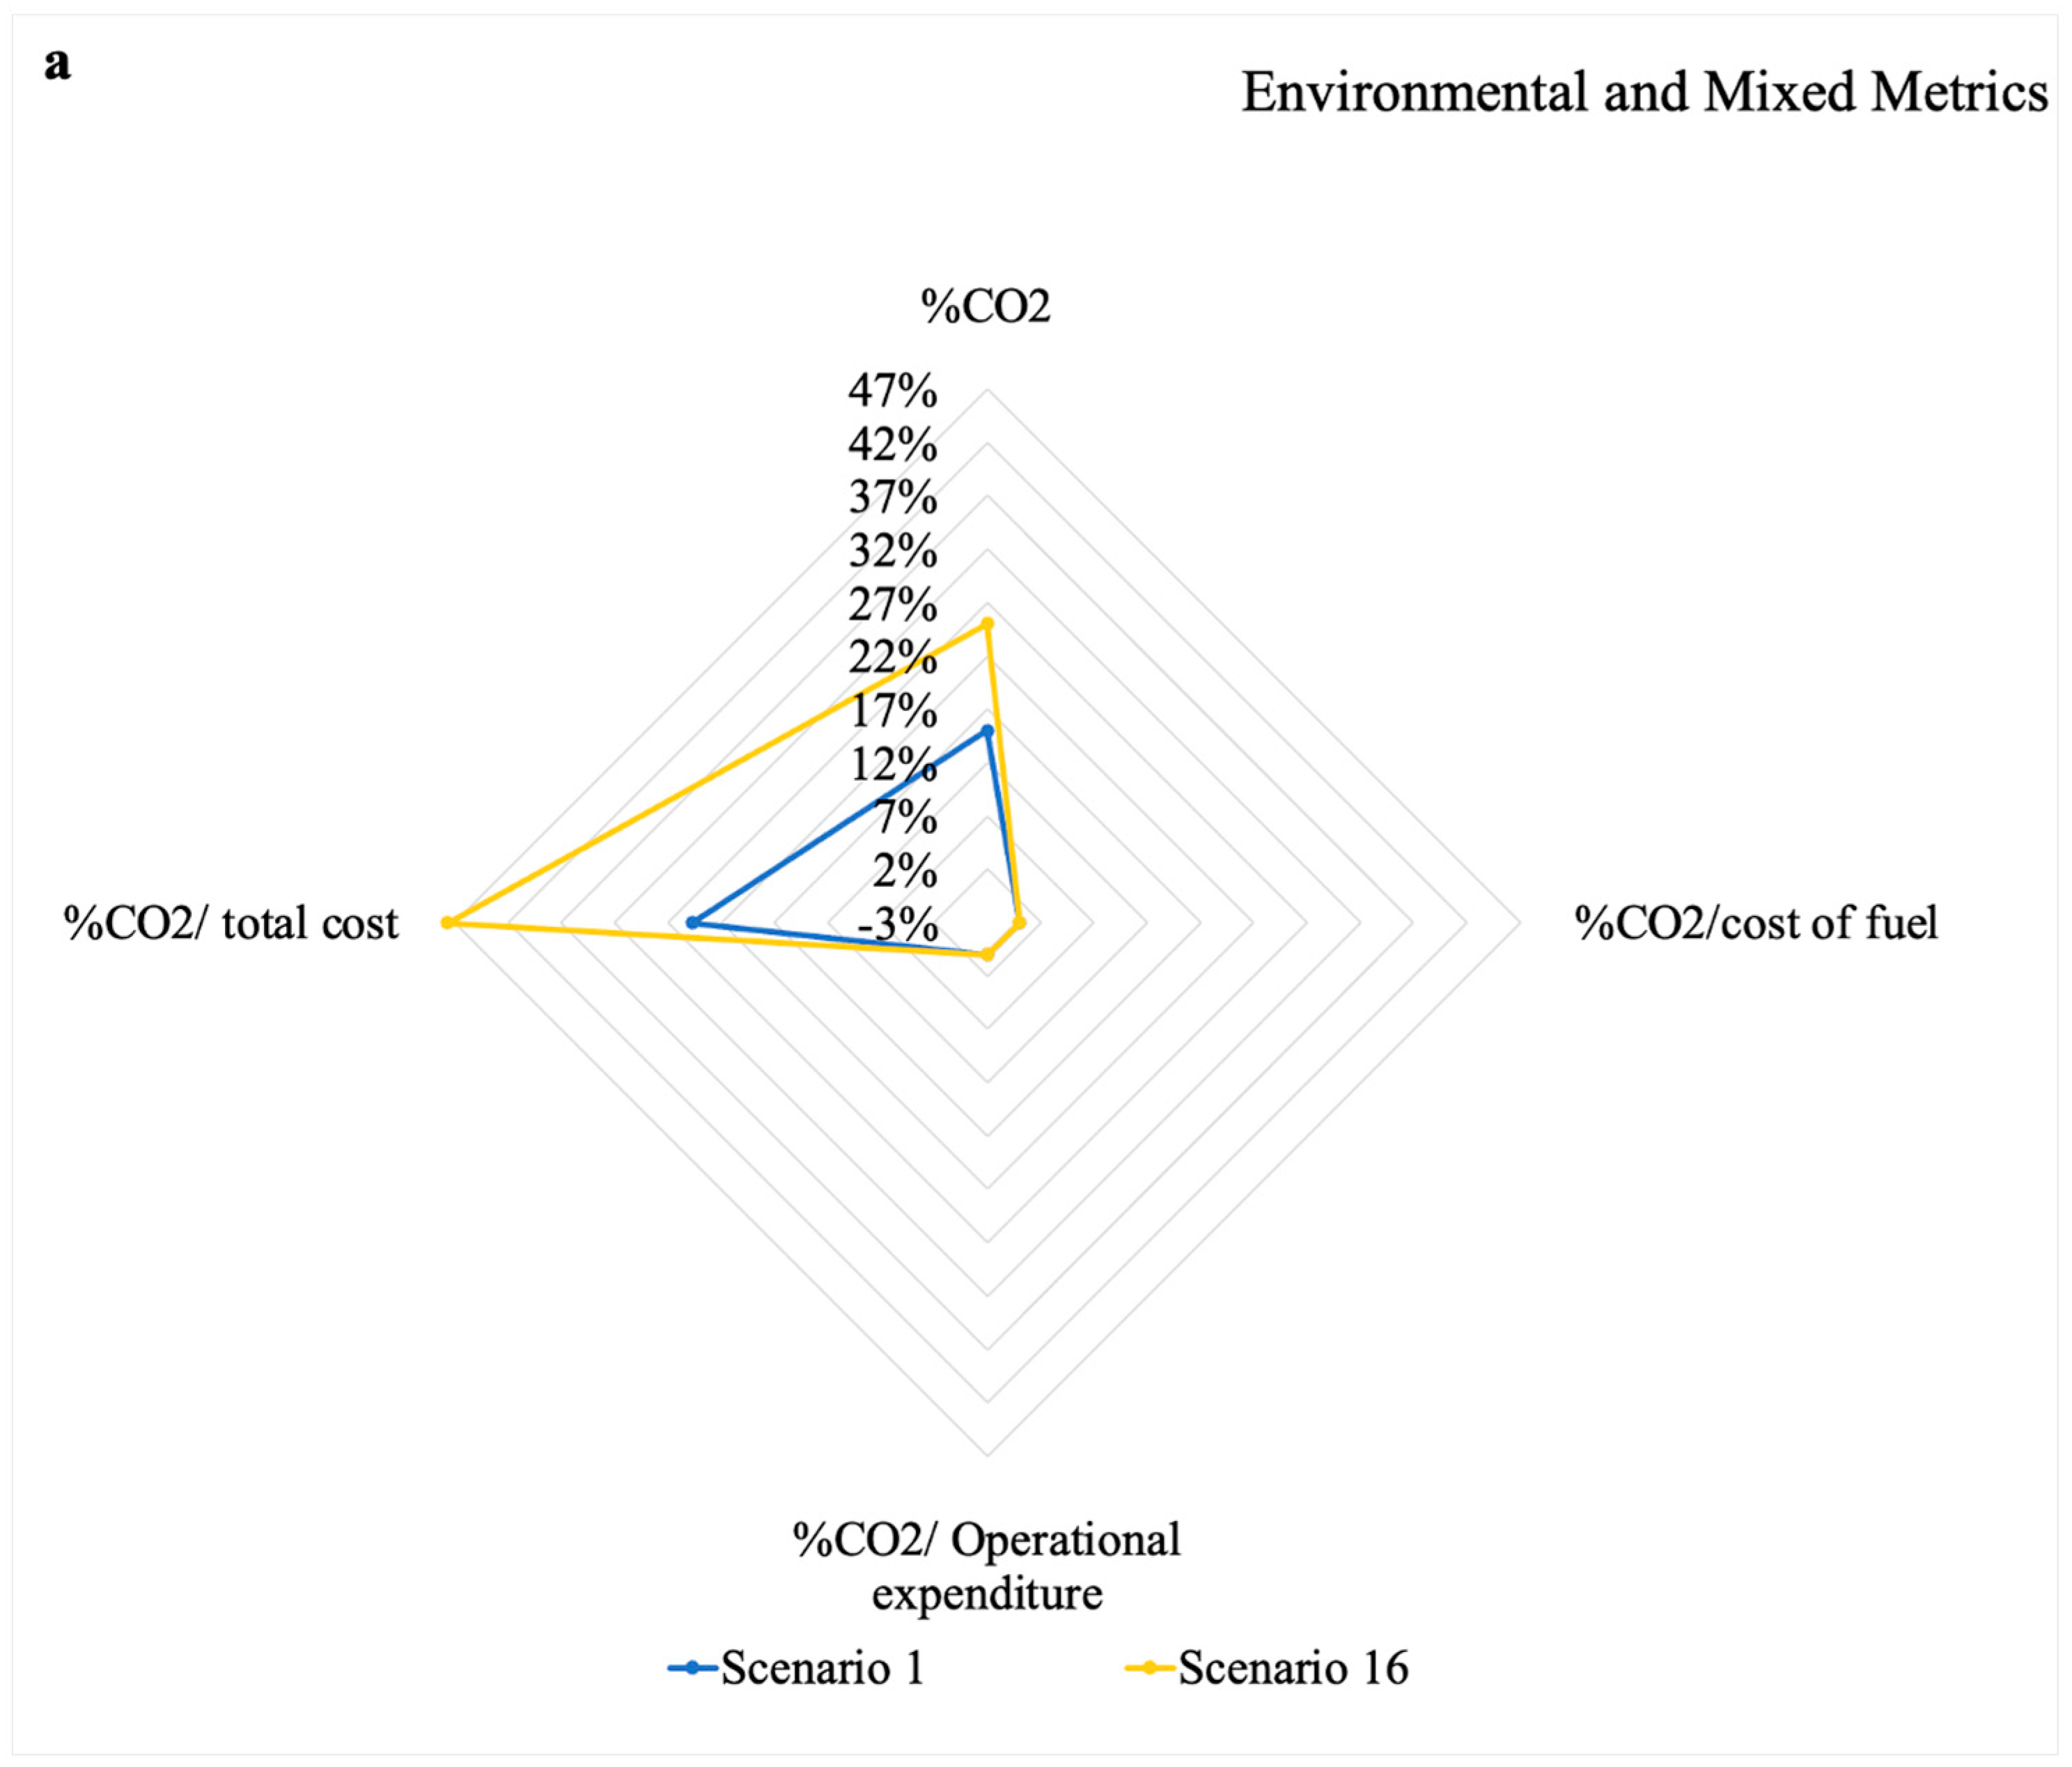
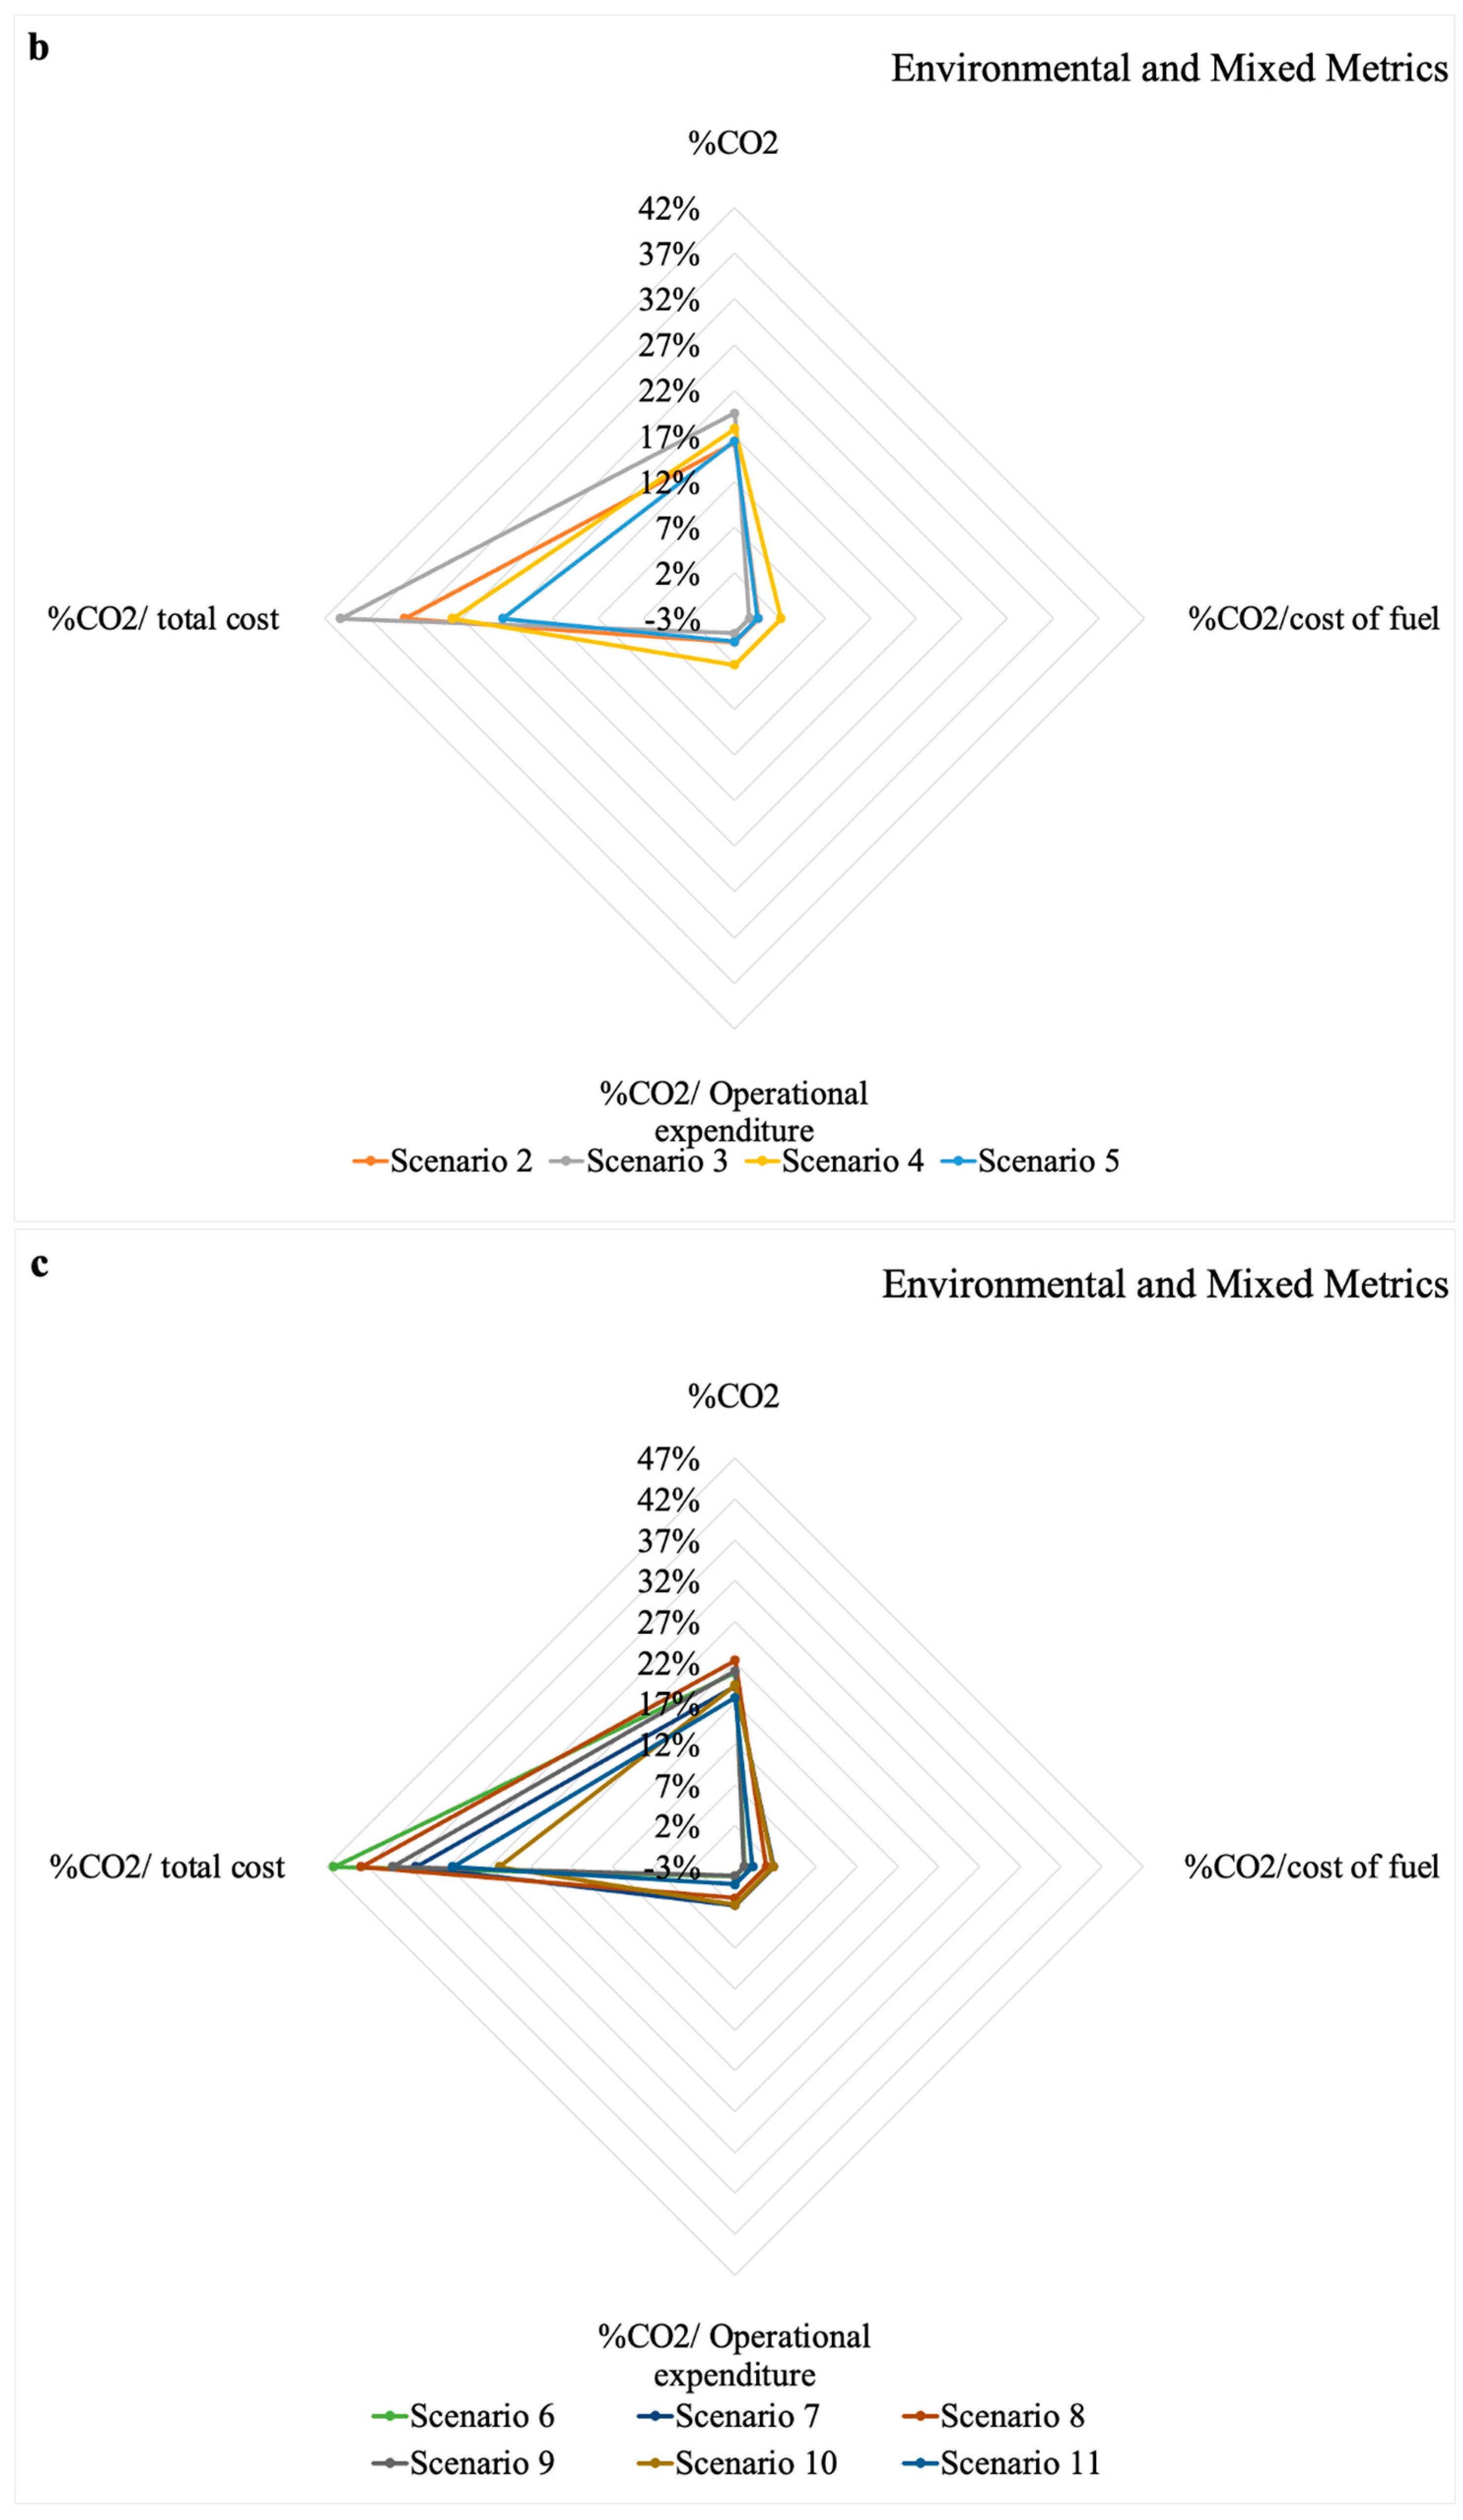
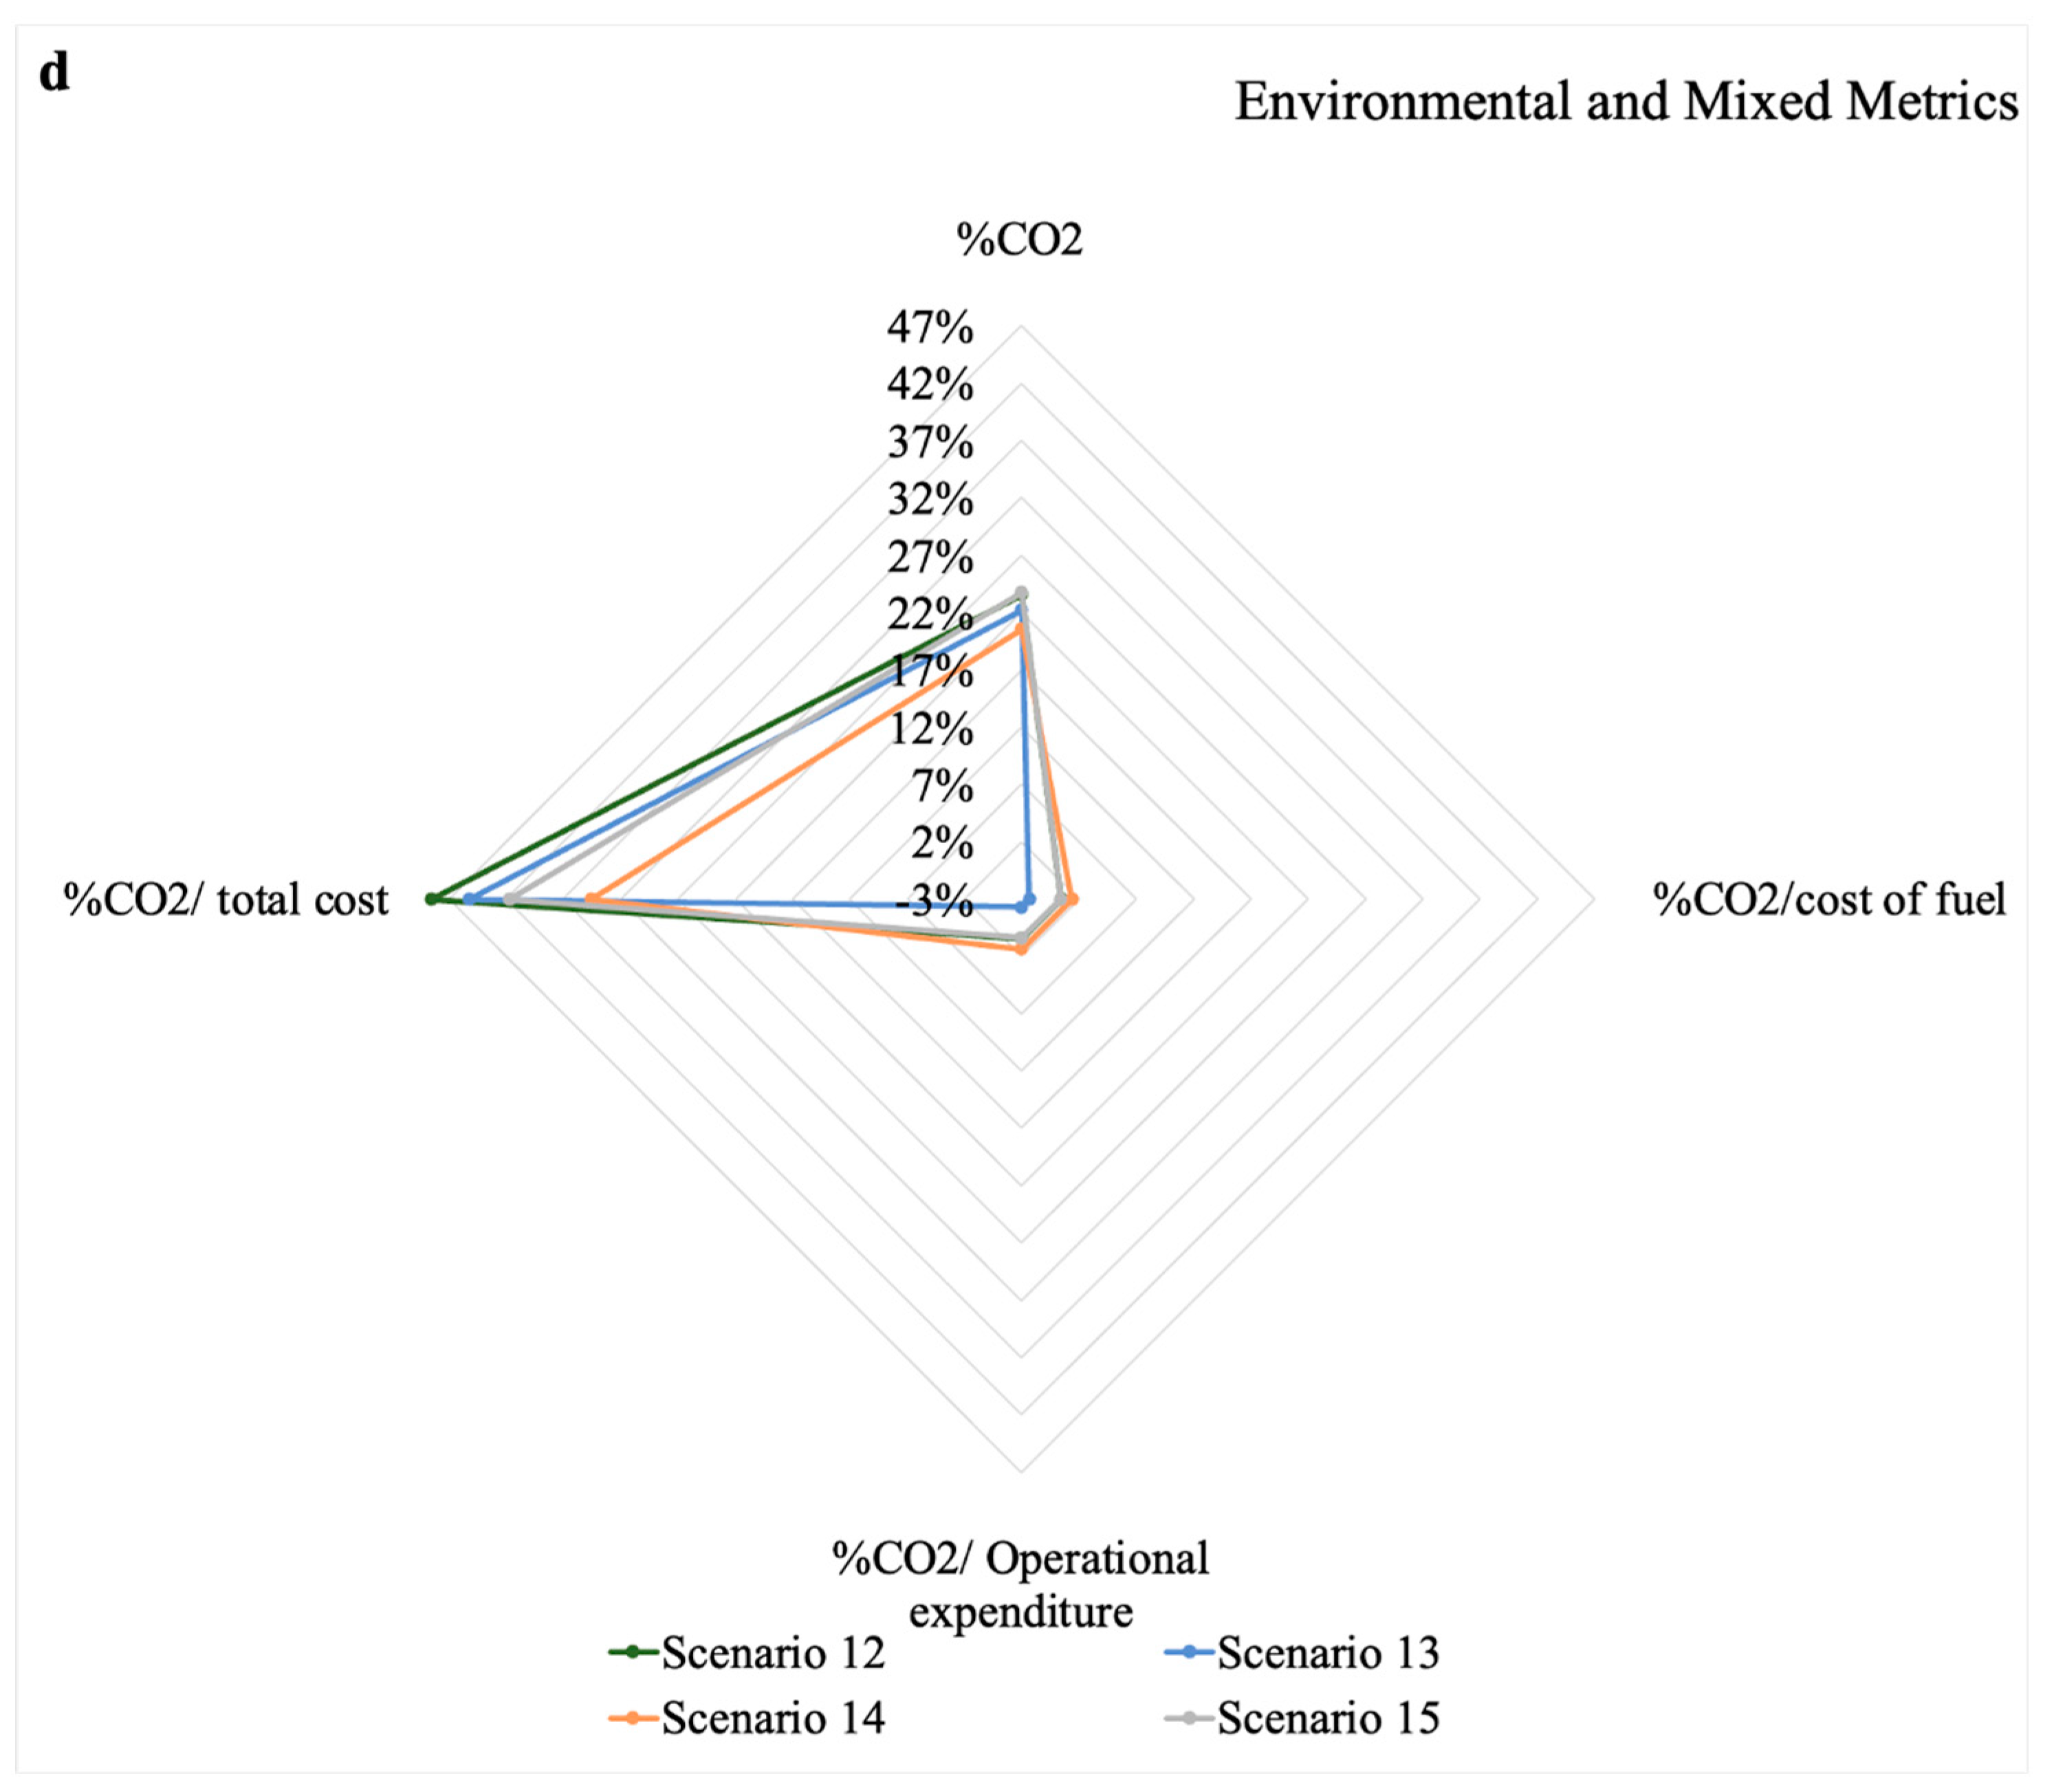
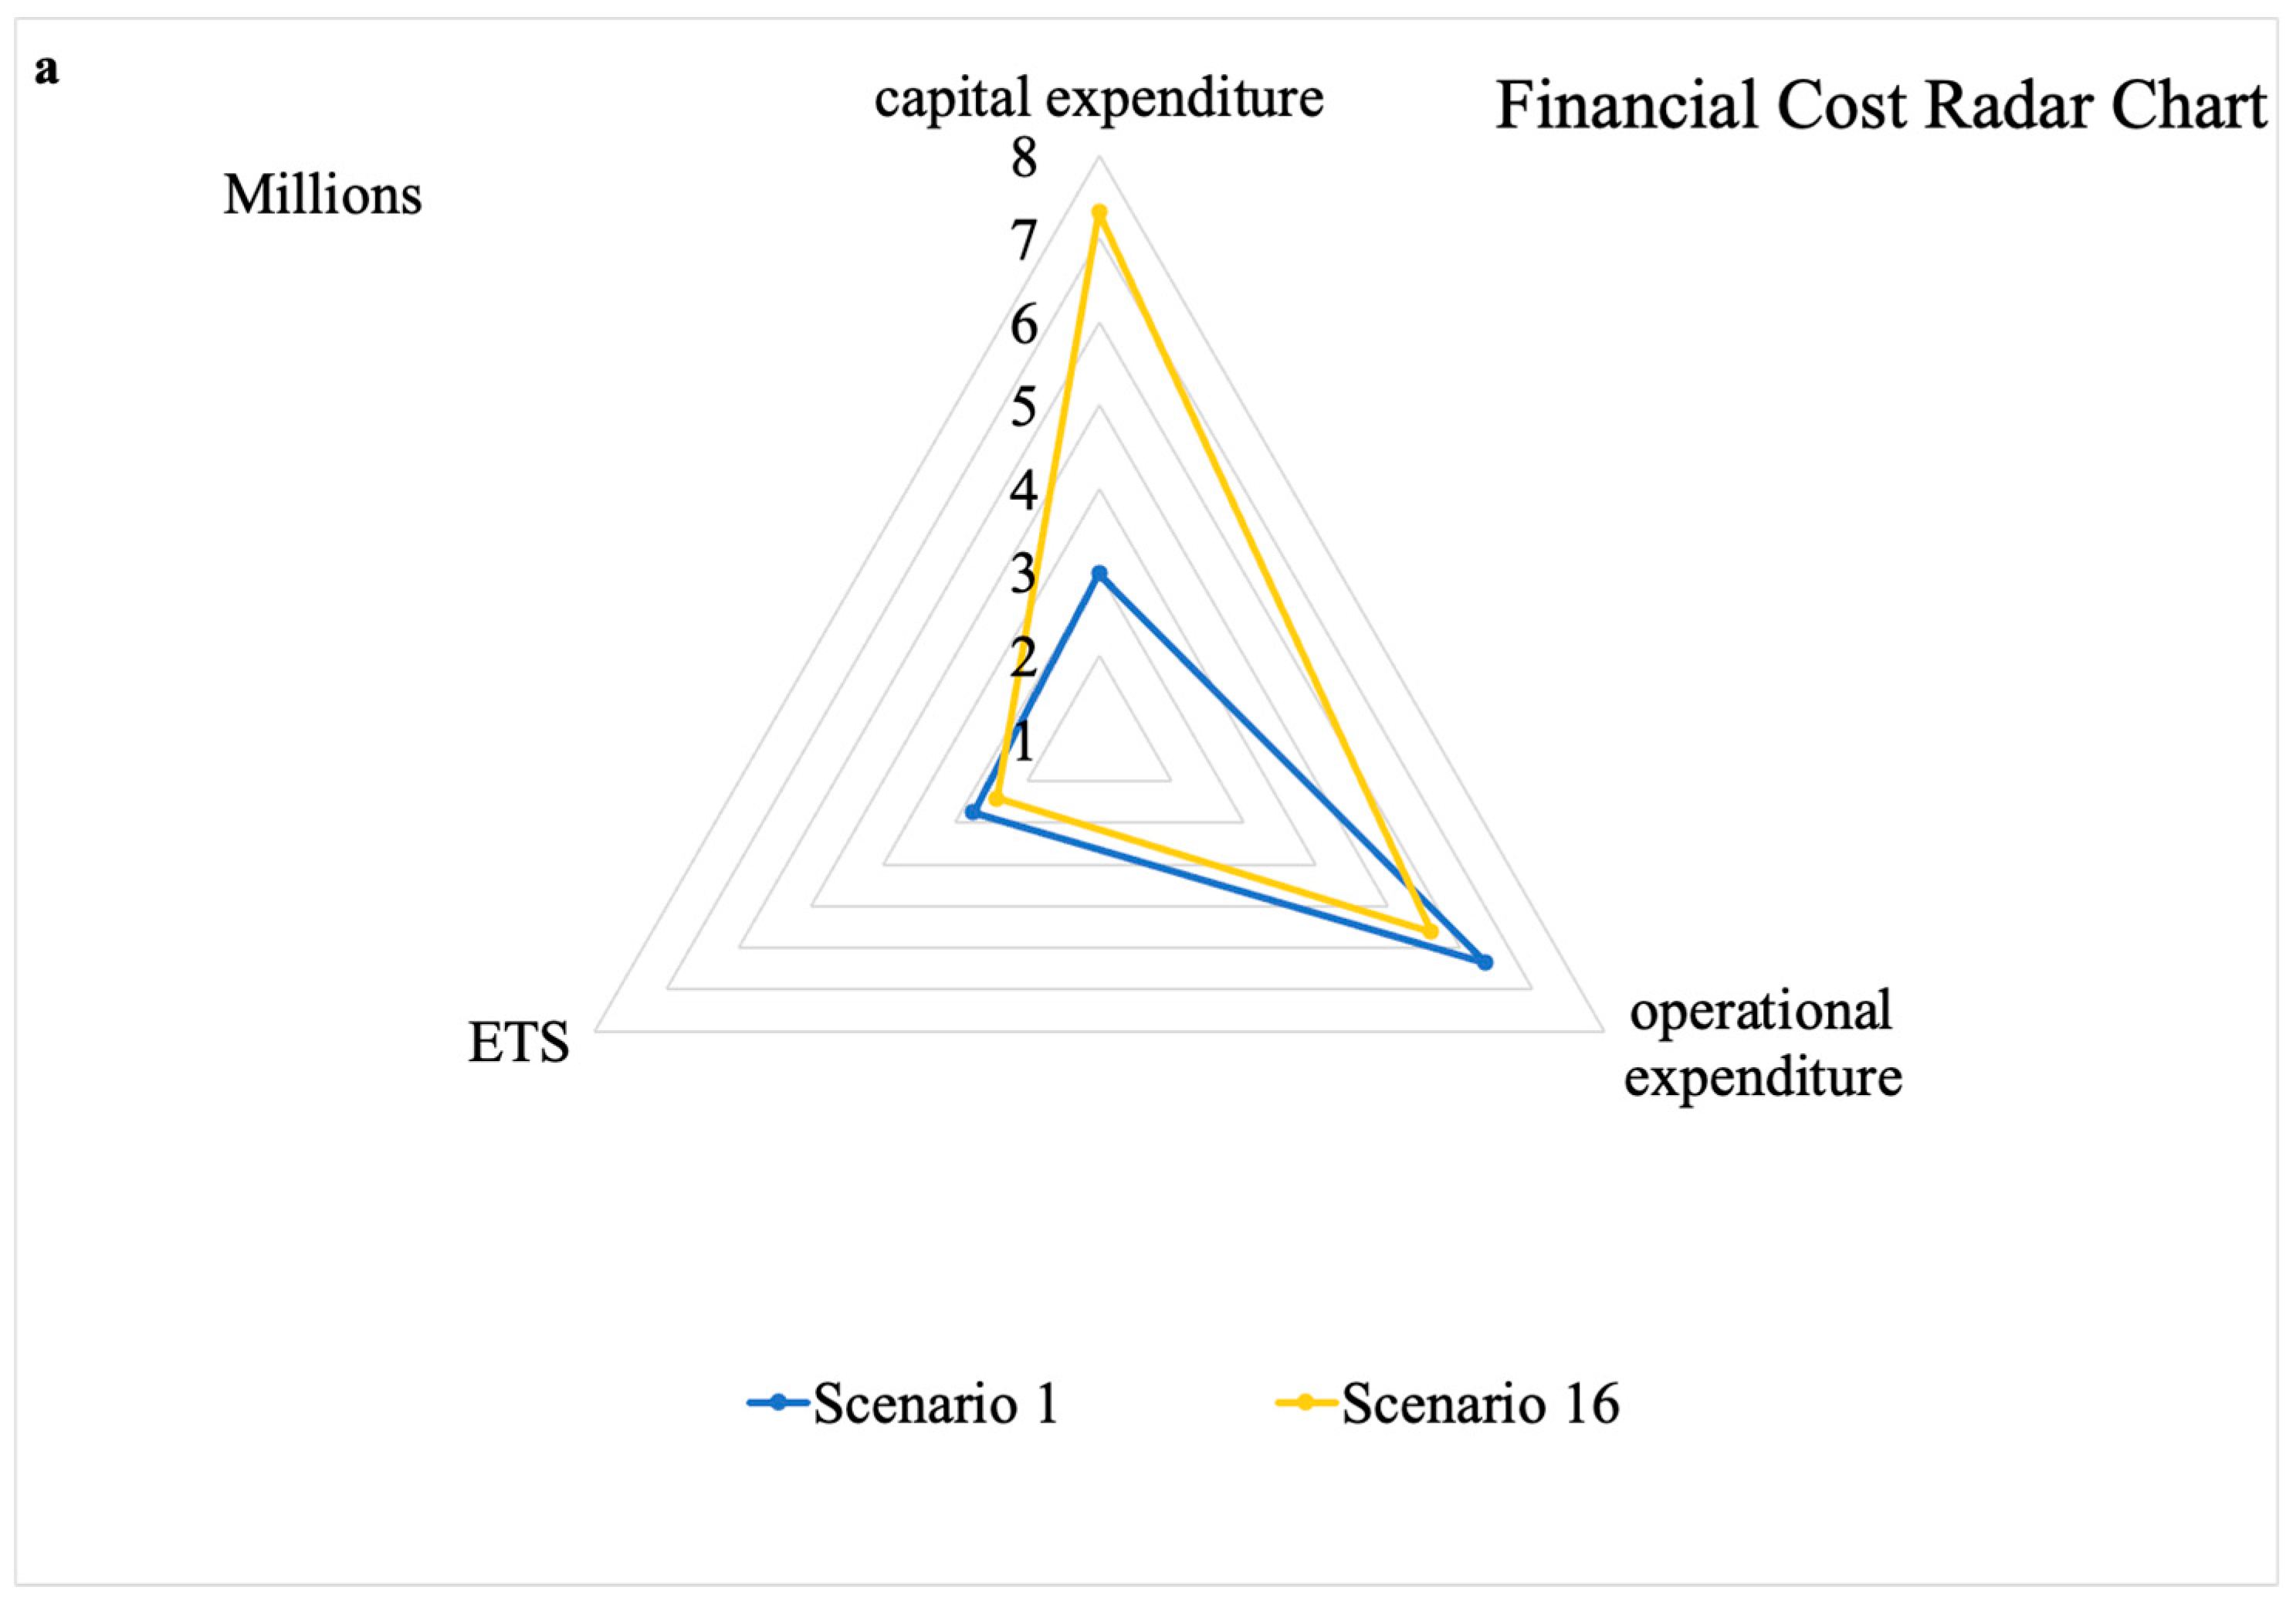
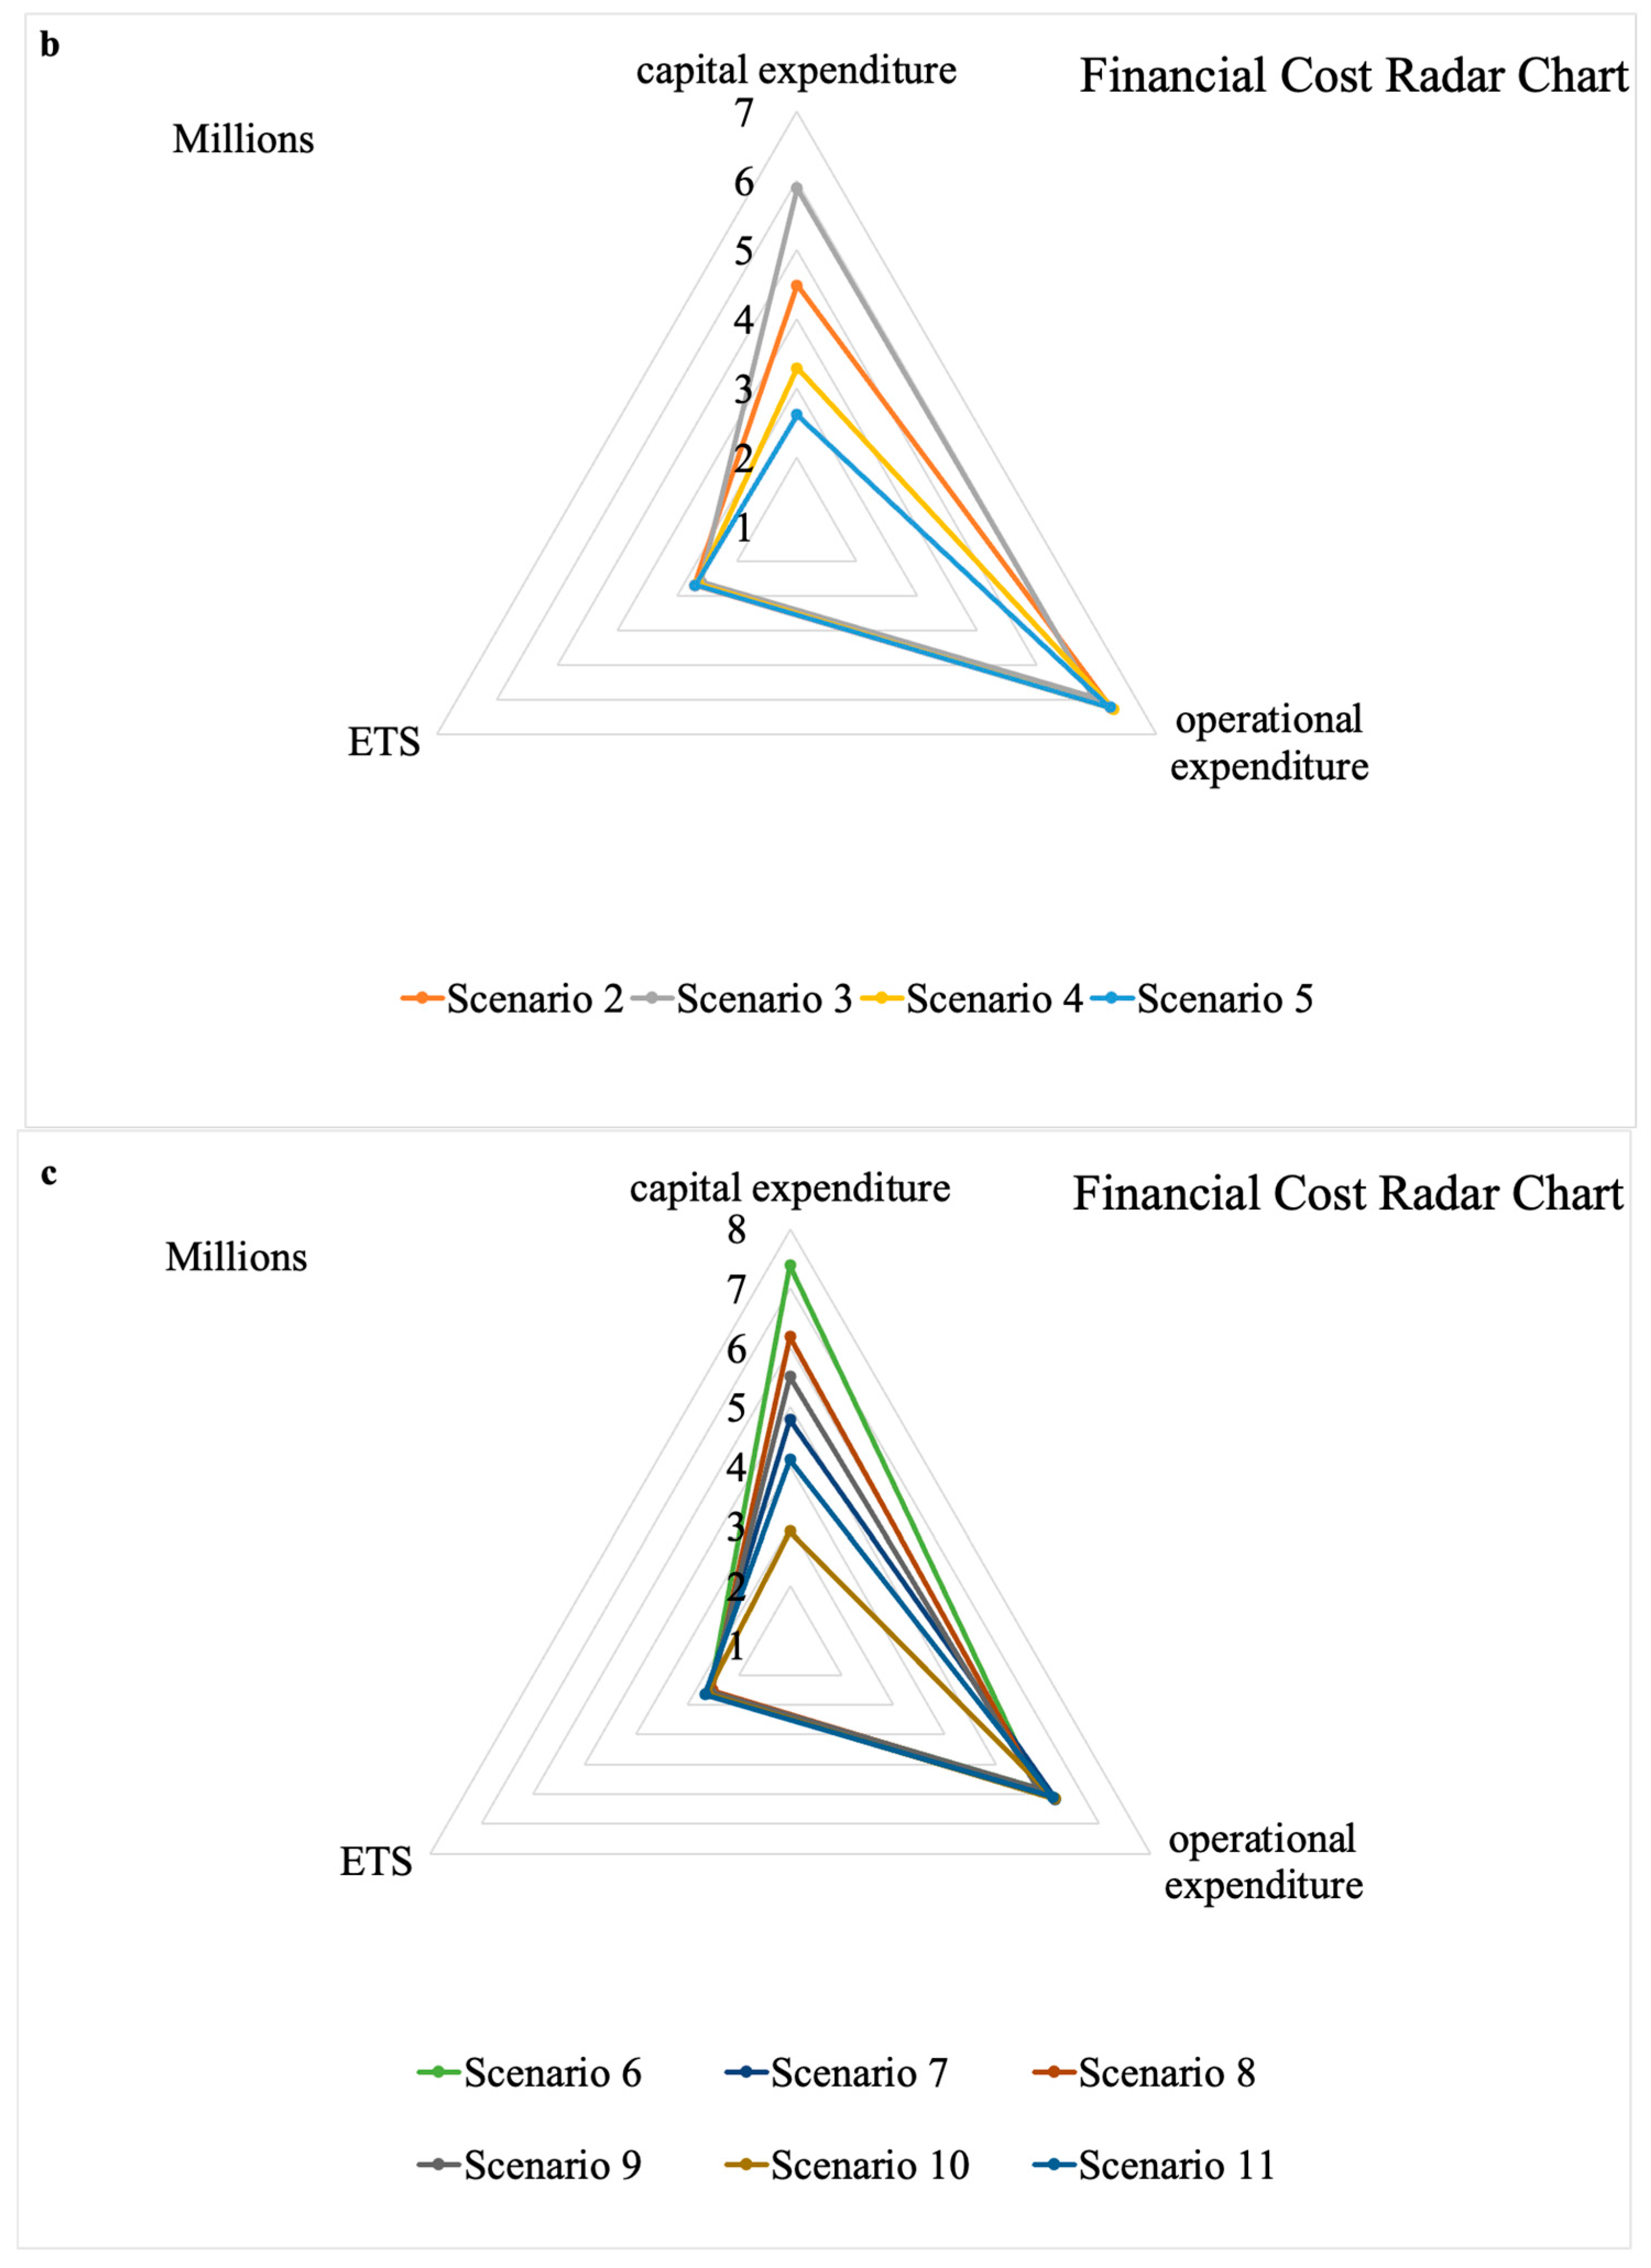
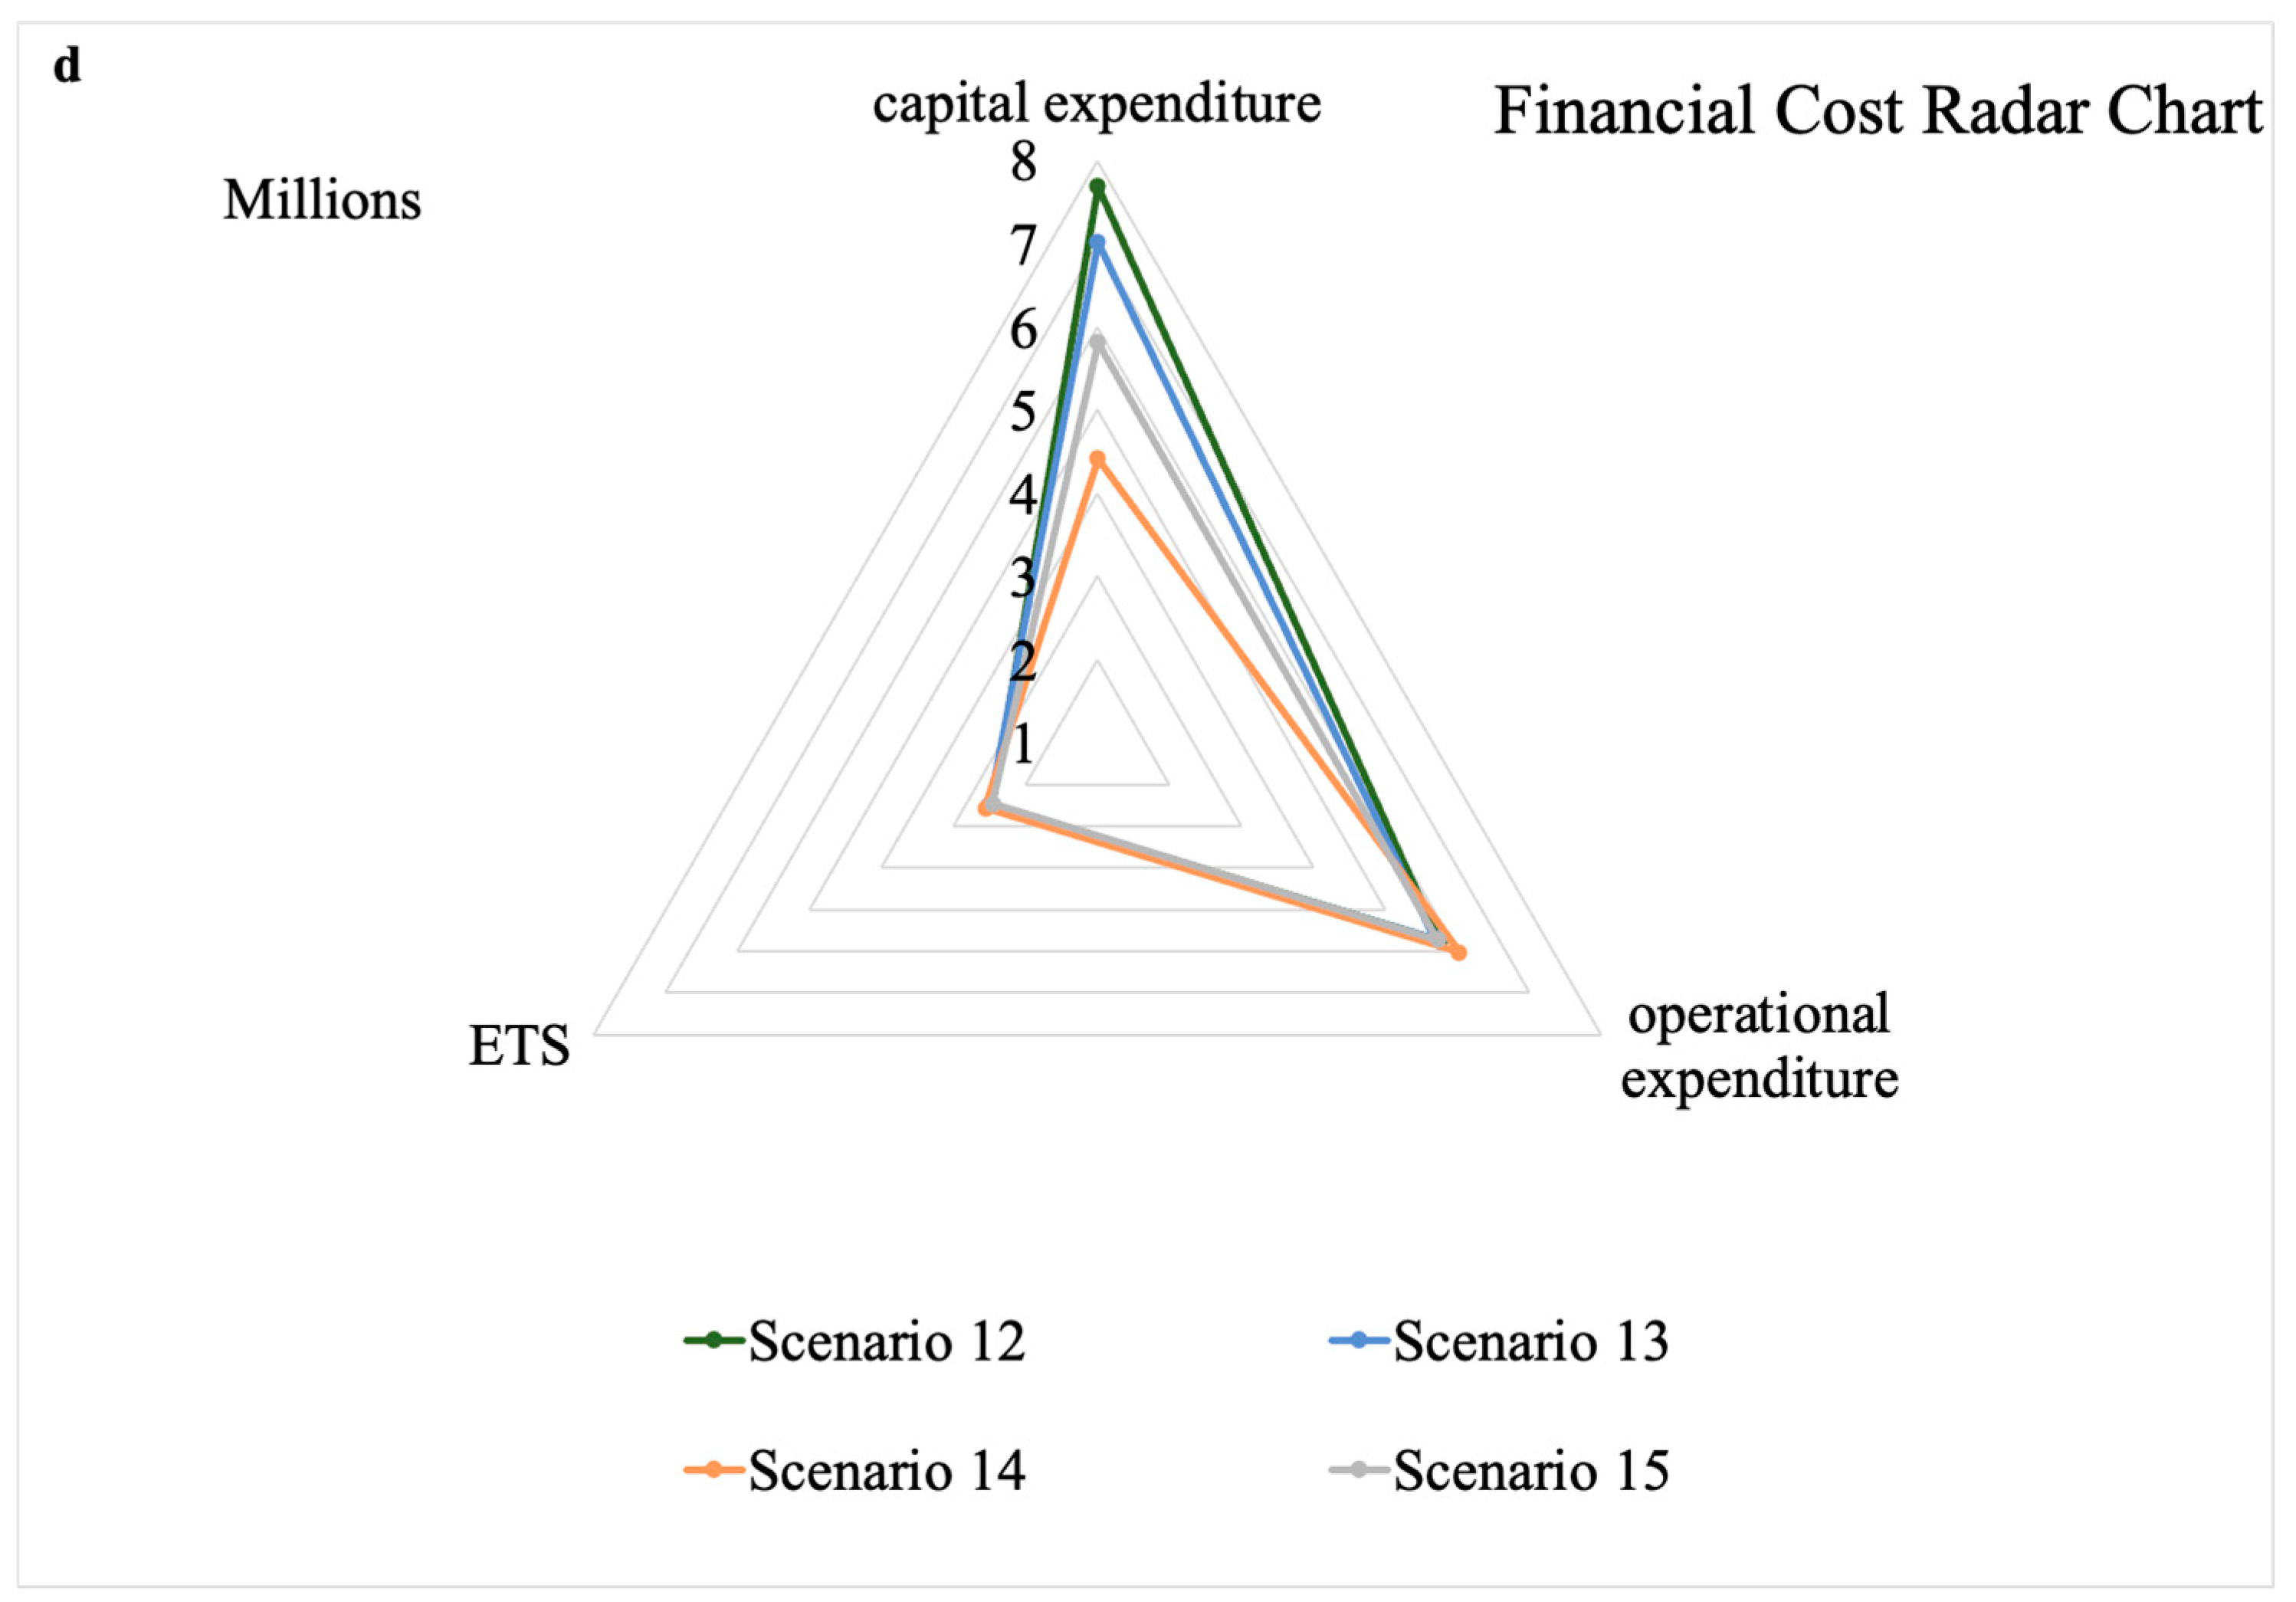
The results can be found in Table 8, with green highlighting the highest reduction and yellow either the lowest reduction or the highest increase (negative values). Regarding carbon emissions, the highest reduction can be found in scenario 16 (25%) where only energy-efficient equipment is used, in contrast to the all-digital-tool scenario 1 where the reduction in carbon emissions is calculated at 15%. Figure 3 and Figure 4 present the relevant radar charts for percentages and absolute values, respectively, divided into four different cases following the values of Table 8; (a) scenarios using only digital tools (Scenario 1) or only energy efficient approaches (Scenario 16); (b) scenarios using digital tools in three out of the four cases and energy efficient equipment in the fourth (Scenarios 2, 3, 4 and 5); (c) scenarios equally implementing digital and energy efficient solutions (Scenarios 6, 7, 8, 9, 10 and 11); (d) scenarios where energy efficient equipment is the dominant approach (Scenarios 12, 13, 14 and 15).
When calculating the ratio between carbon emissions and cost of fuel consumption, some scenarios resulted in increased ratios (negative values for the percentages) and some scenarios in decreased ratios (positive values for the percentages). The highest reduction was found in scenario 4 (2.10%), a mix of digital tools and energy efficient solutions, with digitalization occurring in all steps apart from the meltshop EAF, while the highest increase was found in scenario 13 (−2.32%), another mix of digital tools and energy efficient solution, with digitalization only occurring in meltshop EAF. This is because the meltshop accounts for 3.8% of the carbon emissions, while it consumes both natural gas and anthracite which have different factors for fuel consumption and energy consumption calculation. The same scenarios were present in the ratio of carbon emissions per operational cost, since in the present case study the operational cost only included cost of fuel consumption.
Since the cost of the emission trading system is proportional to the carbon emissions, this metric shows no difference in its percentage representation. On the other hand, when the denominator of the metric is the total cost, this is when the changes are most obvious, ranging from 22.45% (scenario 5) to 48.52% (scenario 12), both of those are mixed scenarios. Scenario 5 includes mostly digital solutions, apart from purchasing energy efficient burners, while scenario 12 includes mostly energy efficient equipment, apart from digitalizing the meltshop burners. The meltshop burners have low carbon emissions, while the total cost for its digitalization is one of the lowest, and the total cost for the energy efficient ladles is the lowest.

4.4. Define Which Scenario Is Most Convenient for the Company’s Objectives and Introduce New Concepts in the Production Line

Once the ideal scenario for the company has been identified, the company moves into identifying the resources required for the purchasing of new equipment or the digitalization of the production steps. The introduction of the new concepts in the production line will take place gradually, followed by a trial period until all new installations are in full production.

4.5. Ensure Sustainability of the New Concepts in Training Workforce and Support Industry

The industrial workers will require training and support to familiarize themselves with the new concepts, but also be able to operate the new equipment and technologies. In addition, the workforce will require support maintaining and addressing any issues arising during usage of the new technologies and equipment. An innovative concept of training is the Teaching Factory, a tailormade educational approach from knowledge providers to industry based on their specific needs. In addition, most companies provide post-sales support for their equipment.

5. Discussion

The framework was applied in the case of a secondary steelmaking industry, where solutions based on digital tools and/or energy efficient equipment were used to calculate carbon emissions reduction. However, the cost of introducing new technologies is significant, therefore, capital expenditure, operational expenditure, cost of end-of-life and cost of carbon emissions penalties were also calculated. This provided the opportunity to develop new metrics that include both carbon emissions and costs, to help the company identify which scenario best suits their goals and needs. This is why a combination of both energy efficient and digital tools was the ideal scenario for almost all objectives, apart from when pure carbon emissions was the goal (energy-efficient equipment only).
The strength of this framework is its applicability regardless of the industrial sector, the type of process (discrete or continuous) and the objectives of the company. The framework is based on identifying the carbon intensive parts of its production line and calculating the related carbon emissions based on the energy consumed for their operation. Then, the concepts from Industry 4.0 and green manufacturing that are applicable to the specific case are identified, and information regarding their energy demands and costs are collected. In the case of multiple steps being carbon intensive, then different scenarios are identified, including the different approaches in all possible combinations. After the costs and carbon emissions of these scenarios are calculated, it is up to the industry to determine the metrics that will allow them to go for the best option to fit their needs. Hence the applicability of the framework is not only on the different industries that can use this approach, but it also applies to the different objectives that the companies have at a given time.
In order for the framework to provide solutions that comply with Industry 4.0, Industry 5.0 and green manufacturing, but also the European Green Deal, the main solutions are either the use of digital tools or the purchasing of energy efficient equipment. Both solutions have been used in previous approaches but the combination of both solutions has never been addressed to determine which one is the best fit for a company to reduce its carbon emissions. The solutions offer different advantages and disadvantages, some of those have not been addressed in the case study, but it is worthwhile mentioning them since it supports their applicability and scalability potential.
Regarding the use of digital tools, namely the development and integration of digital twins in the production line, the solution may not offer significant carbon emission reduction, but it offers several advantages, such as the easy and no-fuss calibration and integration within the production line with only a requirement of the use of sensors that may already exist in the system. It can also run correctly the first time, so minimizing the trial period, but it also provides what-if-scenarios, allowing the operator to readjust input parameters to avoid any bad outcomes or to improve the quality of the final production. In addition, digital twins can provide information about the status of the components of the equipment, alerting the operators for any faulty situations and notifying them in advance when it is time for maintenance or repair. This means that the operators know when it is time to replace components well before a catastrophic event or a complete shutdown of the production. This way, the operators can order the faulty component, plan maintenance time and replace the faulty components in a way that does not cause major delays. Last but not least, the digital tools can be modeled to alarm the operators and workforce for any hazardous event, such as dramatic increase in temperature or emission of substances dangerous for the health of the workforce, allowing the operator to switch off the equipment and the workforce to have enough time to evacuate the premises.
Energy efficient equipment significantly reduces the energy consumption and the carbon emissions by 25%, but it costs significantly more than digital tools. However, the use of electrified energy efficient equipment, such as an induction furnace, could be proven to be more environmentally friendly in the near future, when renewable sources will be used more in industrial settings. In addition, the latest versions of energy efficient equipment are already equipped with sensors measuring important parameters of the processes taking place in the equipment, and they can be easily used in conjunction with digital tools, offering, thus, the best of the two worlds.
The proposed framework extends its contribution to post-integration of the solutions, offering training and education to the workforce, to support them during the early integration time. This is also evident by integrating educational fees and training cost into the calculation of the capital expenditure. The framework is following the concepts of Teaching Factories, where industrial partners are collaborating with institutions to address a specific learning need or an industrial challenge. Other concepts from Education 4.0 can also be integrated, since expanding the skillset of the workforce is one of the aims of Education 4.0. In addition, the development of the digital skills of the industrial workforce will facilitate the integration of Industry 4.0 and Digitalization in the modern era industry.
In order to present an easy to follow case study that would demonstrate the applicability of the framework, several assumptions had to be made, concerning the costs and the steps included in the production line. Regarding the costs, lack of data resulted in elimination of several costs that may have made a difference in the final metrics and may have influenced the decision taken by the company regarding which scenario to follow. This may also be an issue for any application of the framework, since some costs cannot be easily calculated so further assumptions have to be made. Another limitation could be the inability to clearly demonstrate the energy intensive steps of the production line, but also to calculate the energy consumptions of each equipment. However, this is not a frequently occurring case. In addition, the effect of the environmentally friendly approaches or the impact of integrating smart manufacturing techniques on the final product costs has not been considered in this content and will be addressed at a later stage [35,36,37,38,39,40]. Last but not least, the framework has not taken into consideration the effect of carbon storage solutions, use of recycling materials or disposal costs. This can only be done if the industry has data regarding these solutions, in order to include them in the framework. However, the probability of an industry having all these solutions in their production line is negligible since they have not been used in a large scale.
The standard practice in literature has been to apply multi-criteria optimization [41], through considering the utilization of different values for process parameters. However, this had additional impact on the line, in a negative way:
  • The process time has been also affected (and hence the schedule), indicatively up to 100% variation, from the minimum value to the maximum one.
  • Data are not available for quality, so an experimentation period must be taken into consideration, since the defects are not common (in the case of 6 sigma, 3.4 defects per million occur); this greatly affects the productivity temporarily.
In addition, digitalization and innovation absorption were not successful, in contrary to the current methodology, which exploits both concepts. In such a way, there may be collateral advantages, such as cognitive and physical load reduction (socially), increase in readiness for quality monitoring and at the same time being in line with new policies, such as the Green Deal (environmentally and cost-wise). Furthermore, it is expected to be easier to persuade management to proceed with changes, since the proof for the benefits is more evident [42] and the timing, as well as the quality guarantee, are not affected in any case.
Future work should include the latest trends in carbon emission reduction, such as carbon storage solutions, but also include solutions where both digital tools and energy efficiency are used in parallel. The next steps should also include solutions to transfer from natural gas or coal-derived electricity to electricity coming from renewable sources, but also invest in solutions where excessive heat from equipment can be used effectively in other parts of the production line or the factory, thus lowering the overall energy consumptions. However, the latter solution requires readdressing the design of the production line and the factory, therefore, the framework will need to be expanded including the design phase.

6. Conclusions

On one hand, green transition for manufacturing is crucial because of the Green Deal and other initiatives for lowering the environmental impact of the industrial sector. On the other hand, green and digital technologies are a considerably expensive investment, therefore, industries require a methodology to determine which technology will be purchased and why. The proposed framework describes the steps that a company can take in order to identify the carbon intensive parts of its production line, the calculation algorithms for carbon emissions and costs and the definition of metrics that will support the decision of the company in investing in new technologies that will result in carbon emission reduction. The framework can be easily implemented and used to support companies towards carbon reduction and carbon neutrality. It provides an easy guide from identifying the carbon intensive steps to calculating the metrics, but it can also be easily adapted to include other parameters and metrics, such as the impact from disposal costs, from use of recycling material and use of carbon capture and storage units.
One of the strong points of the framework is that it is not limited in calculating the carbon emissions, but it also takes into consideration the competitive and business nature of the industries, where investments are carefully considered because of their high cost. It was demonstrated that a combination of digital tools and energy efficient innovative parts significantly reduce carbon emissions and many of the carbon emission metrics, such as %CO2/cost of fuel, %CO2/total cost and %CO2/operational expenditure.
Novel technologies, such as carbon storage, should be the focus of the future work, to identify their role and impact on the carbon emission reduction framework. In addition, future work should address the impact of use of renewable sources in energy-intensive industries but should also define whether redesign of the production line can be part of this framework approach.

Author Contributions

Conceptualization, P.S. and V.C.P.; methodology, P.S., V.C.P. and A.P.; validation, P.S. and K.S.; formal analysis, V.C.P., A.P. and P.A.; investigation, V.C.P., A.P., P.A., D.G. and K.S.; resources, P.S.; data curation, V.C.P.; writing—original draft preparation, V.C.P., A.P. and P.A.; writing—review and editing, V.C.P., A.P. and P.A.; visualization, V.C.P., A.P., P.A. and D.G.; supervision, P.S. project administration, P.S.; funding acquisition, P.S. All authors have read and agreed to the published version of the manuscript.

Funding

This research received no external funding.

Institutional Review Board Statement

Not applicable.

Informed Consent Statement

Not applicable.

Data Availability Statement

Not applicable.

Acknowledgments

This work is partially under the framework of EU Project AVANGARD. This project has received funding from the European Union’s Horizon 2020 research and innovation program under grant agreement No. 869986. The dissemination of results herein reflects only the authors’ views and the Commission is not responsible for any use that may be made of the information it contains.

Conflicts of Interest

The authors declare no conflict of interest.

Appendix A

Exemplary figures regarding the quantity of fuel consumed annually in the steelmaking industry. From the fuel consumption, the energy consumption was calculated using the following equation:
Energy Consumed = Quantity of Fuel × Coefficient
where the coefficient was 11 kWh/Nm3 for the natural gas case and 9.234 kWh/kg for the anthracite. The carbon emissions were calculated using the following equation:
Carbon Emissions = Energy Consumed × Coefficient
where the coefficient was 0.0019 e-CO2 tons/kWh for both natural gas and anthracite related emissions.

Appendix B

The costs were calculated based on a study by Stavropoulos et al. (2021) [37] with the following assumptions:
(1)
No capital expenditure cost for the reference scenario.
(2)
No labor costs were taken into consideration for all scenarios because of unavailability of data for this cost.
(3)
In all scenarios, the operational costs were only coming from the energy or fuel consumption, because of unavailability of data for these costs.
(4)
This industry had neither resale or scrap costs, so the cost of end of life or disposal costs were set to zero.
(5)
There were no data for the calculation of national penalties, therefore only the EU penalties were considered for the carbon emission related costs.
(6)
Training of personnel for both digital and energy efficient scenarios was set to 20K as a baseline budget for this. The same value was assumed for training for expert agents.
(7)
The budget for development of digital tools was assumed based on previous market search and research budgets to start a digital solution from scratch.
(8)
Payback time was calculated based on experience from previous projects.
(9)
The costs for machine purchase were assumed based on quotations from several companies and market search, and so were the innovated-related equipment.
Table A1. Costs for the reference scenario.
Meltshop LadlesMeltshop EAFRolling MillBall Mill
Purchase of the machine0000
Training of personnel0000
Training for expert agents0000
Innovated-related equipment that leads to extra profit0000
Zero-defect MFG related process and functionalities0000
Development of DT, including sensors, actuator and cost of simulation software0000
Payback time0000
Total Capital Expenditure0000
Labor cost (i.e., operation, inspection, etc.)0000
Energy/Fuel consumption37,613.650818,456.0257116,440.88833,039.8148
Time of usage (idle, machining)0000
Scrap/Part0000
Penalty of change0000
Penalty of change (flexibility due to steel product personalization)0000
Total Operational Expenditure37,613.650818,456.0257116,440.88833,039.8148
Resale0000
Scrap0000
Total End of Life/Disposal Cost0000
National penalties0000
EU penalties467,397.112902,615.1121,446,925.09410,561.424
Total Carbon Emission Related Costs467,397.112902,615.1121,446,925.09410,561.424
Table A2. Costs for digital tool solutions.
Meltshop LadlesMeltshop EAFRolling MillBall Mill
Purchase of the machine0000
Training of personnel20,00020,00020,00020,000
Training for expert agents20,00020,00020,00020,000
Innovated-related equipment that leads to extra profit0000
Zero-defect MFG related process and functionalities0000
Development of DT, including sensors, actuator and cost of simulation software700,000700,000700,000700,000
Payback time6328.329486328.329486328.329486328.32948
Total Capital Expenditure746,328.329746,328.329746,328.329746,328.329
Labor cost (i.e., operation, inspection, etc.)0000
Energy/Fuel consumption1,145,935.6655,136.7913,547,482.271,006,589.34
Time of usage (idle, machining)0000
Scrap/Part0000
Penalty of change0000
Penalty of change (flexibility due to steel product personalization)0000
Total Operational Expenditure1,145,935.6655,136.7913,547,482.271,145,935.6
Resale0000
Scrap0000
Total End of Life/Disposal Cost0000
National penalties0000
EU penalties397,287.545767,222.8451,229,886.32348,977.21
Total Carbon Emission Related Costs397,287.545767,222.8451,229,886.32348,977.21
Table A3. Costs for energy efficient solutions.
Meltshop LadlesMeltshop EAFRolling MillBall Mill
Purchase of the machine300,0001,000,0003,600,0001,500,000
Training of personnel20,00020,00020,00020,000
Training for expert agents20,00020,00020,00020,000
Innovated-related equipment that leads to additional profit30,00000700,000
Zero-defect MFG related process and functionalities0000
Development of DT, including sensors, actuator and cost of simulation software0000
Payback time6328.329486328.329486328.329486328.32948
Total Capital Expenditure376,328.3291,046,328.333,646,328.332,246,328.33
Labor cost (i.e., operation, inspection, etc.)0000
Energy/Fuel consumption1,011,119.65578,061.8743,130,131.41888,167.066
Time of usage (idle, machining)0000
Scrap/Part0000
Penalty of change (due to market share increase)0000
Penalty of change (flexibility due to steel product personalization)0000
Total Operational Expenditure1,011,119.65578,061.8743,130,131.41888,167.066
Resale0000
Scrap0000
Total End of Life/Disposal Cost0000
National penalties0000
EU penalties350,547.834676,961.3341,085,193.82307,921.068
Total Carbon Emission Related Costs350,547.834676,961.3341,085,193.82307,921.068

References

  1. Panagiotopoulou, V.C.; Stavropoulos, P.; Chryssolouris, G. A critical review on the environmental impact of manufacturing: A holistic perspective. Int. J. Adv. Manuf. Technol. 2021, 118, 603–625. [Google Scholar] [CrossRef]
  2. Fysikopoulos, A.; Papacharalampopoulos, A.; Pastras, G.; Stavropoulos, P.; Chryssolouris, G. Energy efficiency of manufacturing processes: A critical review. Procedia CIRP 2013, 7, 628–633. [Google Scholar] [CrossRef] [Green Version]
  3. Union, I. Communication from the Commission to the European Parliament, the Council, the European Economic and Social Committee and the Committee of the Regions. In A New Skills Agenda for Europe Brussels; European Commission: Brussels, Belgium, 2014. [Google Scholar]
  4. de Bruyn, S.; Jongsma, C.; Kampman, B.; Görlach, B.; Thie, J.-E. Energy-Intensive Industries: Challenges and Opportunities in Energy Transition; European Parliament: Strasbourg, France, 2020. [Google Scholar]
  5. Commission, E. In-Depth Analysis in Support of the Commission Communication COM (2018) 773–A Clean Planet for All–A European Long-Term Strategic Vision for a Prosperous, Modern, Competitive and Climate Neutral Economy; European Commission: Brussels, Belgium, 2018. [Google Scholar]
  6. Sipsas, K.; Alexopoulos, K.; Xanthakis, V.; Chryssolouris, G. Collaborative maintenance in flow-line manufacturing environments: An Industry 4.0 approach. Procedia CIRP 2016, 55, 236–241. [Google Scholar] [CrossRef] [Green Version]
  7. Mandic, V. Model-based manufacturing system supported by virtual technologies in an Industry 4.0 context. In Lecture Notes in Mechanical Engineering, Proceedings of the 5th International Conference on the Industry 4.0 Model for Advanced Manufacturing, Belgrade, Serbia, 1–4 June 2020; Springer: Cham, Switzerland, 2020; pp. 215–226. [Google Scholar]
  8. Vaidya, S.; Ambad, P.; Bhosle, S. Industry 4.0—A glimpse. Procedia Manuf. 2018, 20, 233–238. [Google Scholar] [CrossRef]
  9. Jeske, T.; Weber, M.-A.; Würfels, M.; Lennings, F.; Stowasser, S. Opportunities of digitalization for productivity management. In Advances in Intelligent Systems and Computing, Proceedings of the International Conference on Applied Human Factors and Ergonomics, Orlando, FL, USA, 21–25 July 2018; Springer: Cham, Switzerland, 2018; pp. 321–331. [Google Scholar]
  10. Remes, J.; Mischke, J.; Krishnan, M. Solving the productivity puzzle: The role of demand and the promise of digitization. Int. Product. Monit. 2018, 34, 28–51. [Google Scholar]
  11. Horvat, D.; Kroll, H.; Jäger, A. Researching the effects of automation and digitalization on manufacturing companies’ productivity in the early stage of industry 4.0. Procedia Manuf. 2019, 39, 886–893. [Google Scholar] [CrossRef]
  12. Parliament, E.U. Industry 4.0. Digitalisation for Productivity and Growth. European Parliament Think Tank Briefing. 2015. Available online: http://www.europarl.europa.eu/thinktank/en/document.html (accessed on 14 December 2021).
  13. Kroll, H.; Horvat, D.; Jäger, A. Effects of automatisation and digitalisation on manufacturing companies’ production efficiency and innovation performance. In Fraunhofer ISI Discussion Papers-Innovation Systems and Policy Analysis; Fraunhofer ISI: Karlsruhe, Germany, 2018. [Google Scholar]
  14. Skobelev, P.O.; Borovik, S.Y. On the way from Industry 4.0 to Industry 5.0: From digital manufacturing to digital society. Industry 2017, 2, 307–311. [Google Scholar]
  15. Dornfeld, D.A. (Ed.) Green Manufacturing: Fundamentals and Applications; Springer Science & Business Media: Berlin, Germany, 2012. [Google Scholar]
  16. Paul, I.D.; Bhole, G.P.; Chaudhari, J.R. A review on green manufacturing: It’s important, methodology and its application. Procedia Mater. Sci. 2014, 6, 1644–1649. [Google Scholar] [CrossRef] [Green Version]
  17. Herbst, A.; Fleiter, T.; Sensfuß, F.; Pfluger, B.; Maranon-Ledesma, H. Navigating the Roadmap for Clean, Secure and Efficient Energy Innovation; European Commission: Brussels, Belgium, 2018. [Google Scholar]
  18. Ritchie, H.; Roser, M. CO2 and Greenhouse Gas Emissions. Our World in Data: 2017. Available online: https://ourworldindata.org/co2-and-other-greenhouse-gas-emissions (accessed on 14 December 2021).
  19. Statistics, S.P. 2019. Available online: https://ec.europa.eu/eurostat/statistics-explained/index.php/Social_protection_statistics#Social_protection_expenditure_and_GDP_rates_of_change (accessed on 14 December 2021).
  20. Hollanders, H.; Es-Sadki, N.; Merkelbach, I.; Khalilova, A. European Innovation Scoreboard 2020; Publications Office of the European Union: Luxembourg, 2020. [Google Scholar]
  21. World Economic Forum. Mining and Metals; World Economic Forum: Cologny, Switzerland, 2021. [Google Scholar]
  22. Xiong, W.; Huang, H.; Zhu, Q.; Gan, L.; Li, L.; Zhu, L.; Song, S. A framework for energy consumption reduction in sheet metal forming. Procedia CIRP 2020, 90, 534–539. [Google Scholar] [CrossRef]
  23. Fang, K.; Uhan, N.; Zhao, F.; Sutherland, J.W. A new approach to scheduling in manufacturing for power consumption and carbon footprint reduction. J. Manuf. Syst. 2011, 30, 234–240. [Google Scholar] [CrossRef]
  24. Shrouf, F.; Miragliotta, G. Energy management based on Internet of Things: Practices and framework for adoption in production management. J. Clean. Prod. 2015, 100, 235–246. [Google Scholar] [CrossRef]
  25. Liu, N.; Zhang, Y.F.; Lu, W.F. Improving energy efficiency in discrete parts manufacturing system using an ultra-flexible job shop scheduling algorithm. Int. J. Precis. Eng. Manuf.-Green Technol. 2019, 6, 349–365. [Google Scholar] [CrossRef]
  26. Larreina, J.; Gontarz, A.; Giannoulis, C.; Nguyen, V.K.; Stavropoulos, P.; Sinceri, B. Smart manufacturing execution system (SMES): The possibilities of evaluating the sustainability of a production process. In Proceedings of the 11th Global Conference on Sustainable Manufacturing, GCSM 2013, Berlin, Germany, 23–25 September 2013; Innovative Solutions: Zürich, Switzerland, 2013; pp. 517–522. [Google Scholar]
  27. Papacharalampopoulos, A.; Giannoulis, C.; Stavropoulos, P.; Mourtzis, D. A digital twin for automated root-cause search of production alarms based on KPIs aggregated from IoT. Appl. Sci. 2020, 10, 2377. [Google Scholar] [CrossRef] [Green Version]
  28. Sadagopan, N.; Dhanalakshmi, S. Assembly Line Scheduling in Manufacturing Sector; Indian Institute of Information Technology Design and Manufacturing: Chennai, India, 2021. [Google Scholar]
  29. Pang, C.K.; Le, C.V. Optimization of total energy consumption in flexible manufacturing systems using weighted p-timed Petri nets and dynamic programming. IEEE Trans. Autom. Sci. Eng. 2013, 11, 1083–1096. [Google Scholar] [CrossRef]
  30. Rosu, I. The Bellman Principle of Optimality. 2002. Available online: http://faculty.chicagogsb.edu/ioanid.rosu/research/notes/bellman.pdf (accessed on 14 December 2021).
  31. Yang, L.; Zhu, A.; Shao, J.; Chi, T. A knowledge-informed and pareto-based artificial bee colony optimization algorithm for multi-objective land-use allocation. ISPRS Int. J. Geo-Inf. 2018, 7, 63. [Google Scholar] [CrossRef] [Green Version]
  32. Dahmus, J.B.; Gutowski, T.G. An environmental analysis of machining. Am. Soc. Mech. Eng. Manuf. Eng. Div. Med. 2004, 15, 643–652. [Google Scholar] [CrossRef] [Green Version]
  33. Lasi, H.; Fettke, P.; Kemper, H.-G.; Feld, T.; Hoffmann, M. Industrie 4.0. Wirtschaftsinformatik 2014, 56, 261–264. [Google Scholar] [CrossRef]
  34. World Economic Forum. Digital Technology Can Cut Global Emissions by 15%. Here’s How; World Economic Forum: Cologny, Switzerland, 2021. [Google Scholar]
  35. International Energy Agency. How Energy Efficiency Will Power Net-Zero Climate Goals; International Energy Agency: Paris, France, 2021. [Google Scholar]
  36. Stavropoulos, P.; Papacharalampopoulos, A.; Michail, C.; Vassilopoulos, V.; Alexopoulos, K.; Perlo, P. A two-stage decision support system for manufacturing processes integration in microfactories for electric vehicles. Procedia Manuf. 2021, 54, 106–111. [Google Scholar] [CrossRef]
  37. Umakanta, M.; Mashud, A.H.M.; Roy, S.K.; Uddin, M.S. The effect of rebate value and selling price-dependent demand for a four-level production manufacturing system. J. Ind. Manag. Optim. 2022. [Google Scholar] [CrossRef]
  38. Sultana, S.; Mashud, A.H.M.; Daryanto, Y.; Miah, S.; Alrasheedi, A.; Hezam, I.M. The Role of the Discount Policy of Prepayment on Environmentally Friendly Inventory Management. Fractal Fract. 2022, 6, 26. [Google Scholar] [CrossRef]
  39. Rahman, M.M.; Anan, N.; Mashud, A.H.M.; Hasan, M.; Tseng, M.L. Consumption-based CO2 emissions accounting and scenario simulation in Asia and the Pacific region. Environ. Sci. Pollut. Res. 2022, 1–17. [Google Scholar] [CrossRef] [PubMed]
  40. Tseng, M.L.; Bui, T.D.; Lan, S.; Lim, M.K.; Mashud, A.H.M. Smart product service system hierarchical model in banking industry under uncertainties. Int. J. Prod. Econ. 2021, 240, 108244. [Google Scholar] [CrossRef]
  41. Sihag, N.; Sangwan, K.S. Development of a multi-criteria optimization model for minimizing carbon emissions and processing time during machining. Procedia CIRP 2018, 69, 300–305. [Google Scholar] [CrossRef]
  42. Zou, T.; Ertug, G.; George, G. The capacity to innovate: A meta-analysis of absorptive capacity. Innovation 2018, 20, 87–121. [Google Scholar] [CrossRef]
Figure 1. Schematic representation of the steps (blue box) within the production line (grey box) that have been identified, along with list of inputs (orange box) and outputs (yellow box). Outside the production line, the framework identifies which concepts from Industry 4.0 and green manufacturing (left, green box) should be introduced and how they will impact on the carbon footprint (right, green box) once they have been introduced in the production.
Designs 06 00022 g001
Figure 2. Flowchart of the framework.
Designs 06 00022 g002
Figure 3. Radar charts for the percentage differences between the scenarios and the reference case, for carbon emissions, carbon emissions per cost of fuel, carbon emissions per operational expenditure and carbon emissions per total cost, with (a) scenarios using only digital tools (Scenario 1) or only energy efficient approaches (Scenario 16); (b) scenarios using digital tools in three out of the four cases and energy efficient equipment in the fourth (Scenarios 2, 3, 4 and 5); (c) scenarios equally implementing digital and energy efficient solutions (Scenarios 6, 7, 8, 9, 10 and 11); (d) scenarios where energy efficient equipment is the dominant approach (Scenarios 12, 13, 14 and 15).
Designs 06 00022 g003aDesigns 06 00022 g003bDesigns 06 00022 g003c
Figure 4. Radar charts for the absolute value of capital expenditure, operational expenditure, and cost of the emission trade system, with (a) scenarios either using only digital tools (Scenario 1) or only energy efficient approaches (Scenario 16); (b) scenarios using digital tools in three out of the four cases and energy efficient equipment in the fourth (Scenarios 2, 3, 4 and 5); (c) scenarios equally implementing digital and energy efficient solutions (Scenarios 6, 7, 8, 9, 10 and 11); (d) scenarios where energy efficient equipment is the dominant approach (Scenarios 12, 13, 14 and 15).
Designs 06 00022 g004aDesigns 06 00022 g004bDesigns 06 00022 g004c
Table 1. Description of different scenarios, combining digital tools and energy efficient solutions as per different parts of the steelmaking process.
Scenario #Meltshop
Burners
Meltshop EAFRolling MillBall Mill
1DTDTDTDT
2DTDTDTEE
3DTDTEEDT
4DTEEDTDT
5EEDTDTDT
6DTDTEEEE
7DTEEDTEE
8DTEEEEDT
9EEDTEEDT
10EEEEDTDT
11EEDTDTEE
12DTEEEEEE
13EEDTEEEE
14EEEEDTEE
15EEEEEEDT
16EEEEEEEE
Table 2. Reference values.
PartFuelFuel Consumption (Nm3 for Natural Gas, kg for Anthracite)Energy
Consumption (kWh)
CO2 Emissions (ton eCO2)
Meltshop
burners
Natural gas4,392,83048,321,1308346.377
Meltshop EAFNatural gas2,109,33023,202,6304007.727
Anthracite4,176,00038,561,18412,110.4
Rolling millNatural gas13,598,920149,588,12025,837.948
Ball millNatural gas3,858,66042,445,2607331.454
Table 3. Values for the digital tool solution cases.
FuelAmount of Fuel (Nm3 or kg)Energy Consumed (kWh)CO2 Εmissions (ton eCO2)
Meltshop
burners
Natural gas3,733,905.541,072,960.57094.42045
Meltshop EAFNatural gas1,792,930.519,722,235.53406.56795
Meltshop EAFAnthracite3,549,60032,777,006.410,293.84
Rolling millNatural gas11,559,082127,149,90221,962.2558
Ball millNatural gas3,279,86136,078,4716231.7359
Table 4. Values for the energy efficient solution cases.
FuelAmount of Fuel (Nm3 or kg)Energy Consumed (kWh)CO2 Εmissions (ton eCO2)
Meltshop
burners
Natural gas3,294,622.536,240,8486259.7828
Meltshop EAFNatural gas1,581,997.517,401,9733005.7953
Meltshop EAFAnthracite3,132,00028,920,8889082.8
Rolling millNatural gas10,199,190112,191,09019,378.461
Ball millNatural gas2,893,99531,833,9455498.5905
Table 5. Cost for the reference scenario in euros.
Meltshop LadlesMeltshop EAFRolling MillBall Mill
Total Capital Expenditure (EUR)0000
Total Operational Expenditure (EUR)37,613.650818,456.0257116,440.88833,039.8148
Total Carbon Emission Related Costs (EUR)467,397.112902,615.1121,446,925.09410,561.424
Table 6. Costs for digital tool solutions in euros.
Meltshop LadlesMeltshop EAFRolling MillBall Mill
Total Capital Expenditure (EUR)746,328.329746,328.329746,328.329746,328.329
Total Operational Expenditure (EUR)1,145,935.6655,136.7913,547,482.271,145,935.6
Total Carbon Emission Related Costs (EUR)397,287.545767,222.8451,229,886.32348,977.21
Table 7. Costs for energy efficient solutions.
Meltshop LadlesMeltshop EAFRolling MillBall Mill
Total Capital Expenditure (EUR)376,328.3291,046,328.333,646,328.332,246,328.33
Total Operational Expenditure (EUR)1,011,119.65578,061.8743,130,131.41888,167.066
Total Carbon Emission Related Costs (EUR)350,547.834676,961.3341,085,193.82307,921.068
Table 8. Absolute values and percentages when compared to the respective values from the reference scenario for all scenarios, starting from carbon emissions in tons, carbon emissions per cost of fuel consumption, carbon emissions per capital expenditure, carbon emissions per operational expenditure, carbon emissions per cost of the defined emissions trade system and carbon emissions per total cost.
ScenarioCO2 (tons)% CO2CO2/Cost of Fuel% CO2/Cost of FuelCO2/Capital ExpenditureCO2/Operational Expenditure% CO2/Operational ExpenditureCO2/ETS% CO2/ETSCO2/Total Cost% CO2/Total Cost
14898915.000.007710.000.016410.007710.000.017860.000.0040524.71
248255616.270.00774−0.370.010760.00774−0.370.017860.000.0036033.24
34640519.480.00782−1.380.007880.00782−1.380.017860.000.0032240.24
44737717.800.007552.100.014420.007552.100.017860.000.0038827.97
54815416.450.00774−0.430.018410.00774−0.430.017860.000.0041822.45
64567220.760.00785−1.810.006180.00785−1.81%0.017860.000.0028946.19
74664419.070.007571.760.009750.007571.760.017860.000.0034436.10
84479322.280.007640.850.007240.007640.850.017860.000.0030842.84
94557020.930.00785−1.870.008260.00785−1.870.017860.000.0032938.98
104654219.240.007581.720.015970.007581.720.017860.000.0039925.90
114742117.720.00777−0.820.011520.00777−0.820.017860.000.0036831.58
124406023.550.007670.460.005730.007670.460.017860.000.0027748.52
134483722.200.00789−2.320.006390.00789−2.320.017860.000.0029545.25
144580920.520.007601.360.010380.007601.360.017860.000.0035234.58
154395923.730.007680.410.007560.007680.410.017860.000.0031441.70
164322525.000.007710.000.005910.007710.000.017860.000.0028247.68
Publisher’s Note: MDPI stays neutral with regard to jurisdictional claims in published maps and institutional affiliations.