1. Introduction
Businesses, via specific activities, can create value and competitive advantage. Maintenance is a business process capable of attributing profitability, productivity, and security to every business. Every company making use of the previous technologies, collection of stored and processed data and detailed elements is able to predict dysfunctions and to deter failures of equipment used. The use of data from the production and the equipment of the companies can improve the effectiveness of the production and the schedule of the maintenance. The adoption of the extensive data and using machine learning-data mining with decision trees to the maintenance and the function of the equipment can increase productivity and decrease the cost of maintenance [
1].
Machine learning studies and constructs algorithms that can learn from the data and the information that are provided in any case and make predictions based on them [
2]. Data mining focuses on the exploratory analysis of data for the discovery of knowledge. This ranges from huge databases using algorithms of machine learning to every system that supports decisions aiming at the detection analysis and classification of a huge volume of information which will be useful in order to make the right decisions [
3]. In this research, we will use the decision tree algorithm to create data models that will predict class labels or values for the decision-making process. Using a decision tree, we can visualize the decisions that make it easy to understand and thus it is a popular data mining technique [
4].
Condition-based maintenance as predictive maintenance is mainly based on data. The data are used for the evaluation of the condition of the equipment and the timing assessment of the tasks of maintenance. The decisions for the maintenance do not exclusively originate from the data as the person defines the rules of the decisions, leading to, most probably, wrong conclusions frequently and at regular intervals of maintenance. In addition, investment costs are usually high and the installation and use of monitoring equipment are necessary [
5].
Predictive Maintenance is based on advanced methods, such as Machine Learning, and is capable to dynamically define when the equipment must be maintained. Predictive maintenance can find complicated evidence of malfunctions, which is almost impossible for humans. Methods of predictive maintenance are planned for the estimation of the condition of the equipment in order to define when exactly the maintenance must be performed decreasing the cost and increasing the productivity due to the tasks being executed only when demanded [
6].
The combination of prediction with the exploitation of new technologies on data with the extraction of rules from humans based on the conditions of the equipment, urge for making optimum decisions for the strategic planning of maintenance, increasing the effectiveness of the production and the competitiveness of the companies [
7].
The industrial organization of railways is required to be modern and effective in order to combine productivity and profit with services of high quality aiming at optimum passenger service.
A substantive component for the successful function of the railway is its well-maintained system. A railway will not endure for a long time as a sustainable function if it becomes insecure due to lack of maintenance [
8]. The railway rolling stock is the most vulnerable sector in a railway system and requires the general compliance of the maintenance, since an immobilized train will block the whole network resulting in the decrease in the availability of trainsets, the modification of timetables, causing rampant chaos for the rest of the day, capable of casting doubt on the target of the main importance of railways—passenger safety.
Apart from the fact that the Greek railways use obsolete procedures for the functioning control of the train sets and rolling stock maintenance deal with a series of problems like the task delegation at the technical forces by experience, the difficulty in monitoring the maintenance tasks is due to the lack of undivided dealing among the trains, the coding of maintenance tasks and the malfunctions as well as the hand-written up-keeping of a great amount of data.
Using data mining and machine learning information, results are produced that are useful tools which will lead to the upgrading and updating of the underlying procedures with the creation of new innovative techniques decreasing the time of the unavailable train sets as well as the cost of the equipment and the spare parts to be serviced [
9].
In decision analysis, a decision tree can be used to represent decisions and decision making visually and explicitly. It is a widely used tool in data mining to create a strategy and is also widely used in machine learning.
The use of decision tree algorithms is a very popular technique in data mining because of their simplicity and their appearance [
10].
The construction of decision trees creates a predictive model with the structure of a reversed tree and consists of the root (on the top of the tree where the basic characteristic is), the junctions (at the lower levels with the control of data and the corresponding split), the leaves (at the lowest levels with the final decisions, without continuity) and the branches (connections of the root, junctions, leaves with the control results). The method of decision trees demands minimum preparation of data, it handles nominal and numerical input characteristics, the presentation of the knowledge is easily read, and the output of rules is comprehensible. The creation of a tree is not also defined by other complex aspects and it is capable of handling data with incomplete values. It systemizes the data, improving the ability of management for analysis and provides the perspective of making rational decisions. As far as data mining is concerned, a decision tree is a predictive model that can be used for the representation of the classifiers as well as the models of regression. The quick response that they offer and their accessible interpretation even from non-professional users are considered to be ideal for the particular task [
11].
The classification trees are used when the dependent variable—the target is nominal attributing multiple categories and an effort for prediction takes place for every category (output) that matches with the final decisions (leaves) of the tree [
12].
The regression trees are used when the dependent target variable is continuous, and the prediction refers to the arithmetic average to the control of data (junctions) and the final decisions (leaves) of the tree [
13].
The WEKA is Machine Learning open source software (publicly available according to the license terms GNU General Public License). It was developed at the Waikato University of New Zeeland and its evolution is in progress by an international team of programmers. The WEKA offers a great variety of machine learning algorithms for discrimination and sampling and offers the ability for the conversion of datasets. A dataset can preprocess, visualize, feedback to a learning program and be analyzed in order to assess its performance, without writing a program code [
14]. The use of WEKA software is unique to a big number of scientific projects since the set of functions it offers combined with the graphical reproduction of the algorithms contribute to the creation of applications for data analysis, able to be used for predictive maintenance processes [
15].
Weka algorithm J48: The J48 algorithm is the implementation of the WEKA software for the C4.5 algorithm, which is the evolution of the ID3 algorithm. It constitutes an algorithm for making decision trees with the addition of noticeable traits such as pruning and the ability of numeral and nominal values in variables. This algorithm offers the perspective of modification of rules and the discrimination of all the numerical data is not demanded. The use of the J48 algorithm matters as the process of traits and data can be faced with continuous or incomplete prices, the specification of the size of a tree and the choice of an appropriate trait as a selection measure [
16].
Weka algorithm M5P: The M5P algorithm is a modified algorithm of M5 which was implemented in the WEKA toolbox for the creation of regression trees. The M5P algorithm enables a typical decision tree to use the functions of linear regression at the junctions and the leaves of the tree and to use numerical values. The target variable can be predicted at the tree leaves through a linear equation with the dependent input variables and the best leaf is transformed into a rule. The junctions of the tree are chosen above the trait decreasing the value of error as a function of the typical deviation of the output variable. With the application of the M5P algorithm, the description and the analysis of the relations among the data of rules are achieved, predicting a numerical trait of the target variable [
17].
For the creation of a new method of maintenance on Greek railways, the conference paper [
18] was made as a contribution. In the conference paper, two approaches of machine learning are described aiming at the prediction of the need for maintenance and the prediction for the type of maintenance to be held on railway tracks. The data available for the special points and the railway crossings were analyzed, emerging from the known system SAP ERP of a railway organization. The algorithms random forest classifier and decision tree classifier were used which were trained based on the historical data for a period of six years. The suggested method offers 87% accuracy to the prediction for maintenance necessity and 83% accuracy to the prediction for maintenance task that needs to be held on the railway tracks. Additionally, the writer of the paper [
19] suggested a new intelligent and automated method for the inspection of flexible pavements for highways and focused on non-structural pavement condition index (PCI) that is connected with crucial matters of safety, energy, and cost. The research sums up with the conclusion that the method suggested assists the road engineers to use its results for the determination of dysfunctions of the roads and, as a method, is more effective than the visual and manual search of an inspector eliminating the risk as the possible human error achieving cost and time decrease. Additionally, the conference paper [
20] presents architectural predictive maintenance considering all the aspects of predictive maintenance. The suggested system of predictive maintenance includes the use of data from the database and the implementation of algorithms of machine learning in order to develop detailed tools for the analysis and selection of the appropriate work of maintenance.
The selection of machine learning is attributed to the predictive maintenance innovative abilities and creative skills of prediction for the appropriate work of maintenance, evaluation of the dependent functions, precision of the prediction of the necessity of maintenance, decreasing the hazards, the cost and the time, which are basic preconditions for the development of competitiveness and extroversion of the Greek railways.
The creation of immediate solutions for the Greek railway industry can be given by the software program of machine learning WEKA contributing to the development of methods for the analysis of data, able to be used at the procedures of predictive maintenance. Providing classification and regression applications which with a great variety of algorithms of machine learning offers precise and rapid results.
The paper [
21] focuses on the planning of a new model of making decisions type Analytical Hierarchy Process (AHP) with the use of Machine Learning (algorithms Bayesian Networks) combined with Attribute Relevance Analysis (ARA) which evaluation takes place with the software programmer Weka with the algorithms Info Gain Attribute Eval and Ranker. Processing occurs on a set of data that contains damaged recordings of industrial equipment with the aim to attribute bigger reliability to the criteria of the model AHP for more precise decision making. The study suggests the incorporation of different methods for the automation of the industry and provides a new frame of decision making aiming at the improvement of industrial equipment maintenance. The motive of the paper [
22] is to evaluate the applicability of various machine learning-based tools to the subject of slope stability assessment. In this paper, various machine learning-based techniques are used in predicting factors of safety against slope failures. The total amount of data required was gathered for the training of the targeted models to the WEKA software. The paper submits the opinion that WEKA software is a prominent tool for the application of machine learning and classification. The particular business data that are given by the Greek railway company, whilst unstructured, have appropriate processing of classification and regression which can give useful/processable information as in the paper [
23] which sets as a basic assumption that the unstructured data are irregular information with no predefined data model. Additionally, classifying these data is a tedious task as they lack class labels and get accumulated over time.
The data mining approach that takes place in the paper in order to provide predictive maintenance at the Greek railways [
24]. This paper, in particular, is suggested for the data mining approach, accomplishing predictive successive maintenance with information for the required spare parts based on the data history of maintenance. Additionally, the research of the article [
25] suggests the approach of the data of science, the data mining, and the algorithms of machine learning for the prediction of the remaining life of a spare part (ball bearing) at the electric motor.
This paper presents a method to optimize the rolling stock maintenance of the Greek Railway Company STA.SY. S.A Company that uses obsolete procedures in the maintenance of the trains. The purpose of the application is the prediction for the completion of the part maintenance from stored inactive data before the malfunction appears which will put passengers in danger, along with the technical staff, with the equipment getting out of the delimited kilometer space of the preventive maintenance for the control or change of spare parts. Special data process takes place in the basic operating system traction/braking of the train that has a significantly high cost of maintenance and it is of vital importance for keeping the proper circulation of the trains and the passengers’ safety. The innovative approach of the analysis of stored data seeks useful results for management in order to ensure faster and right decisions and decrease the cost of maintenance reinforcing the strategic goal of the company for the transport of citizens with safety, reliability, comfort, and passenger-centered philosophy.
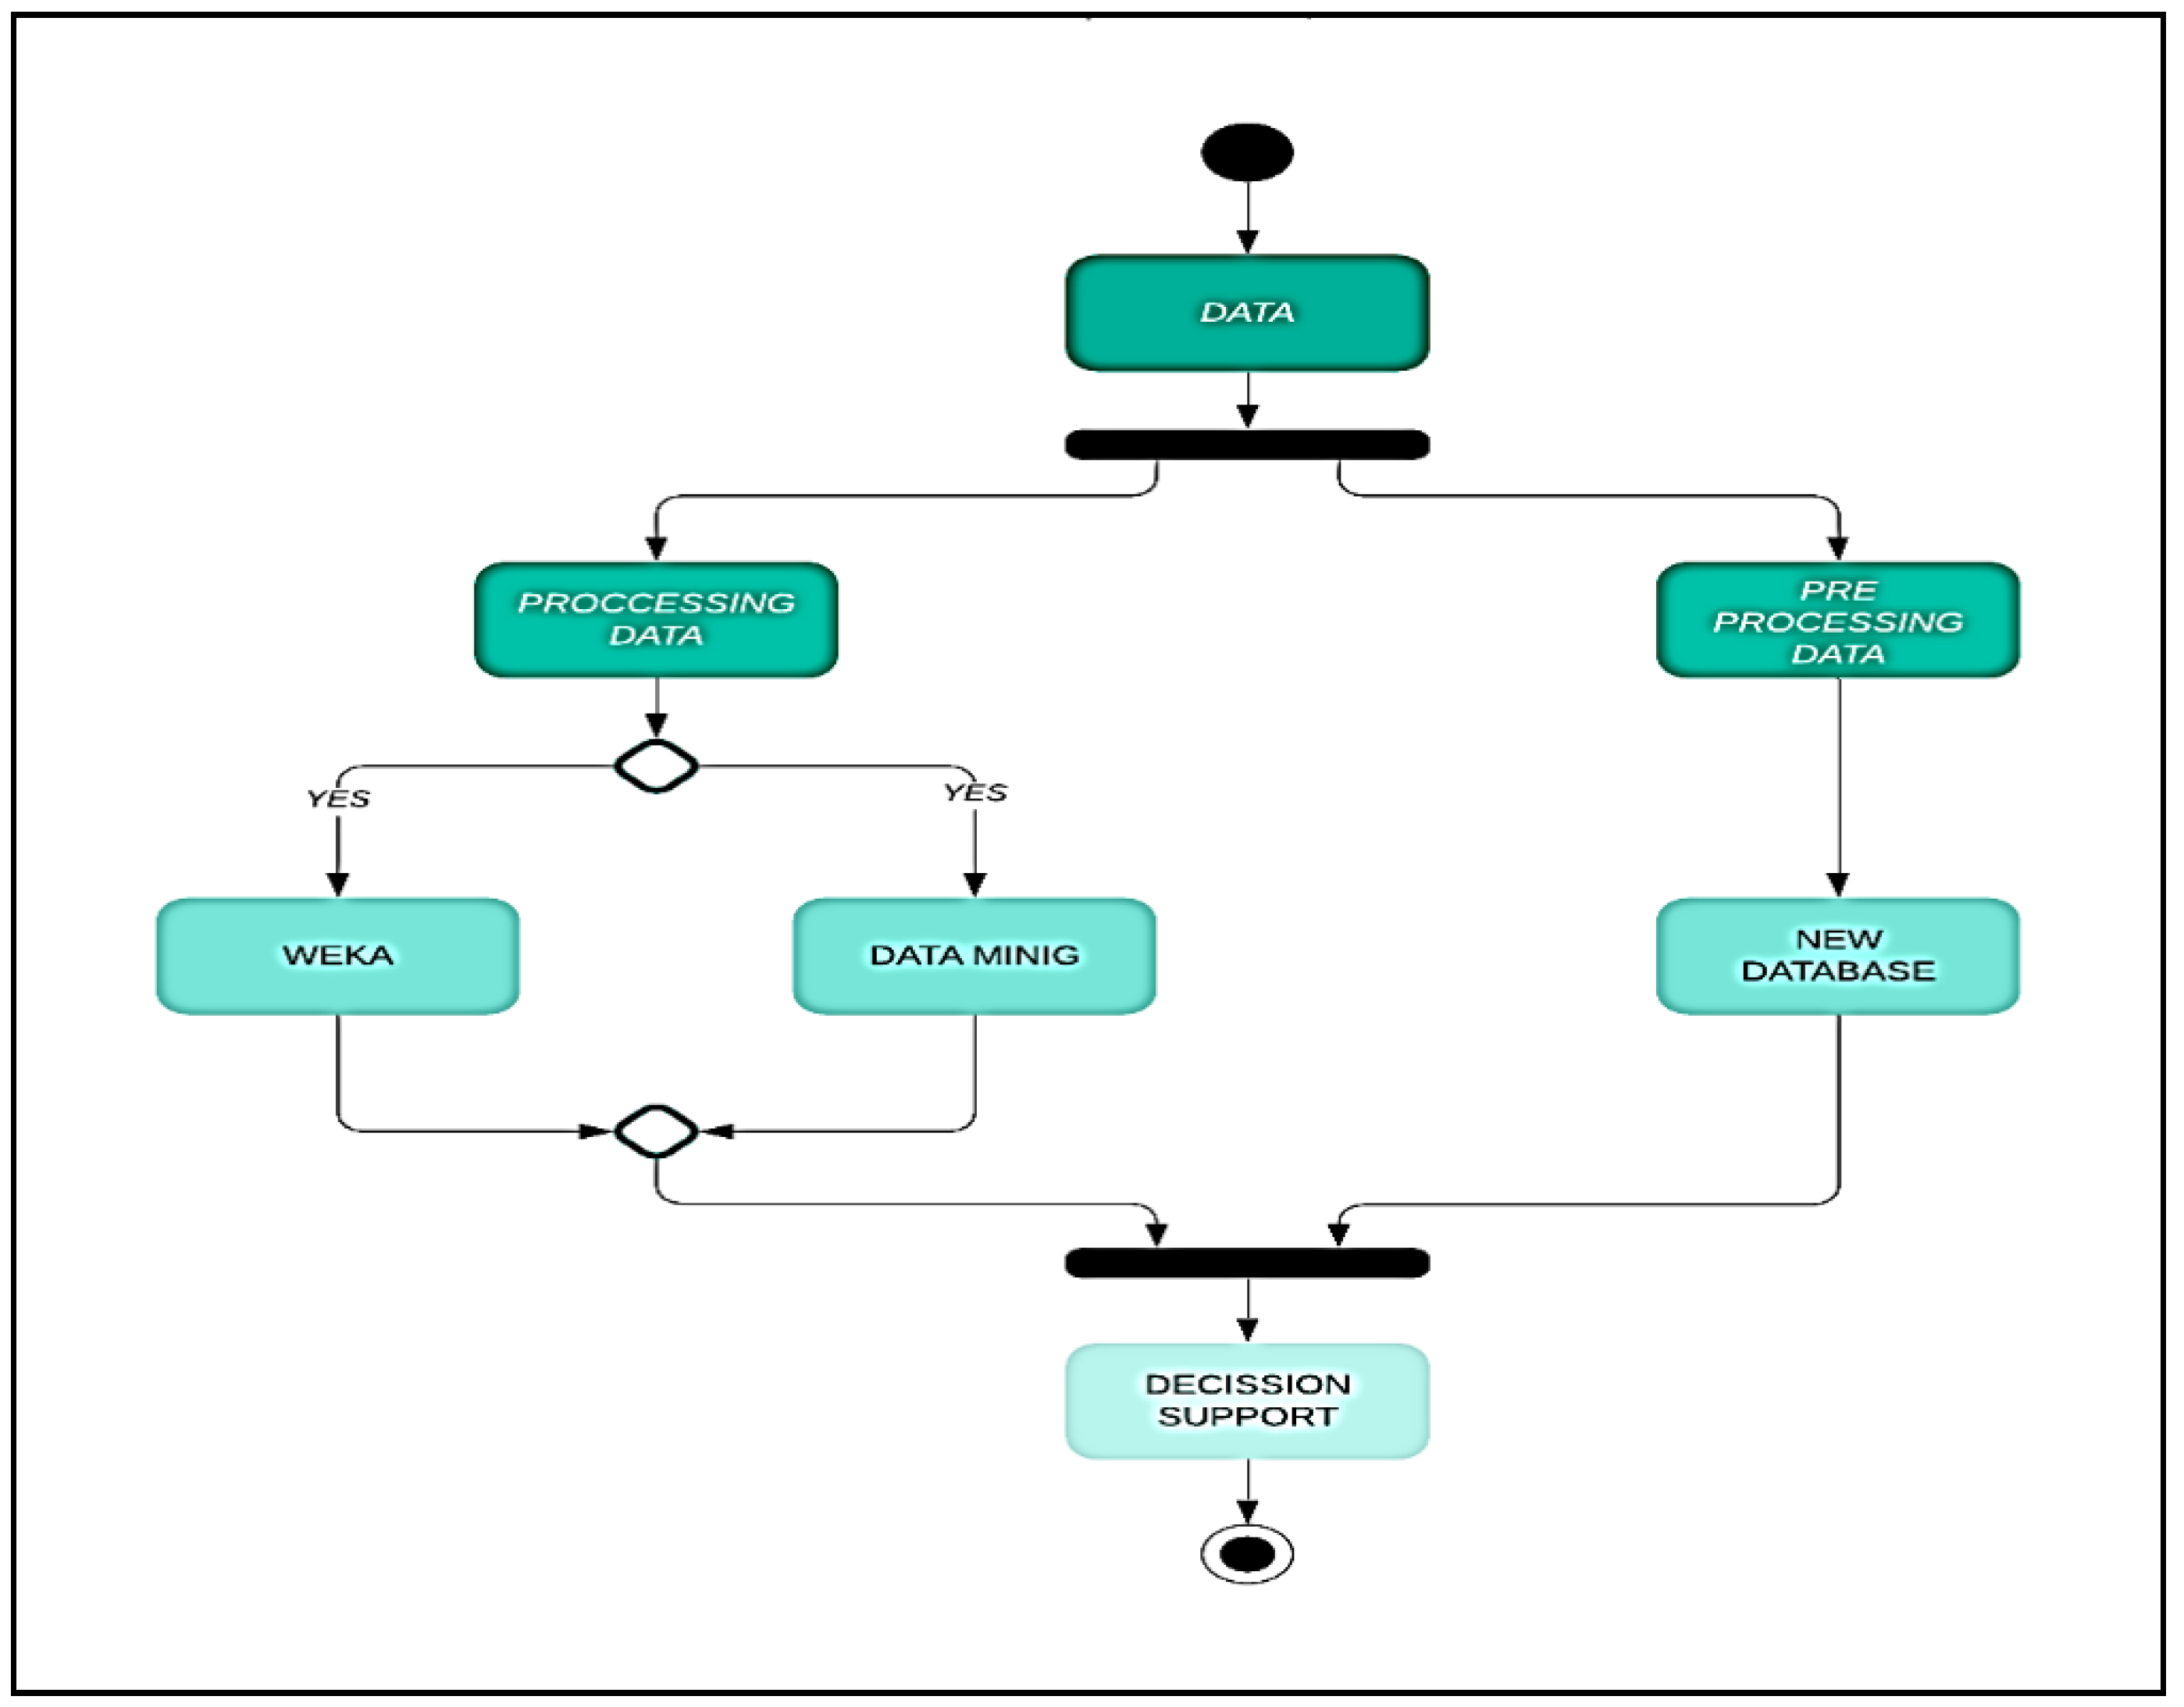
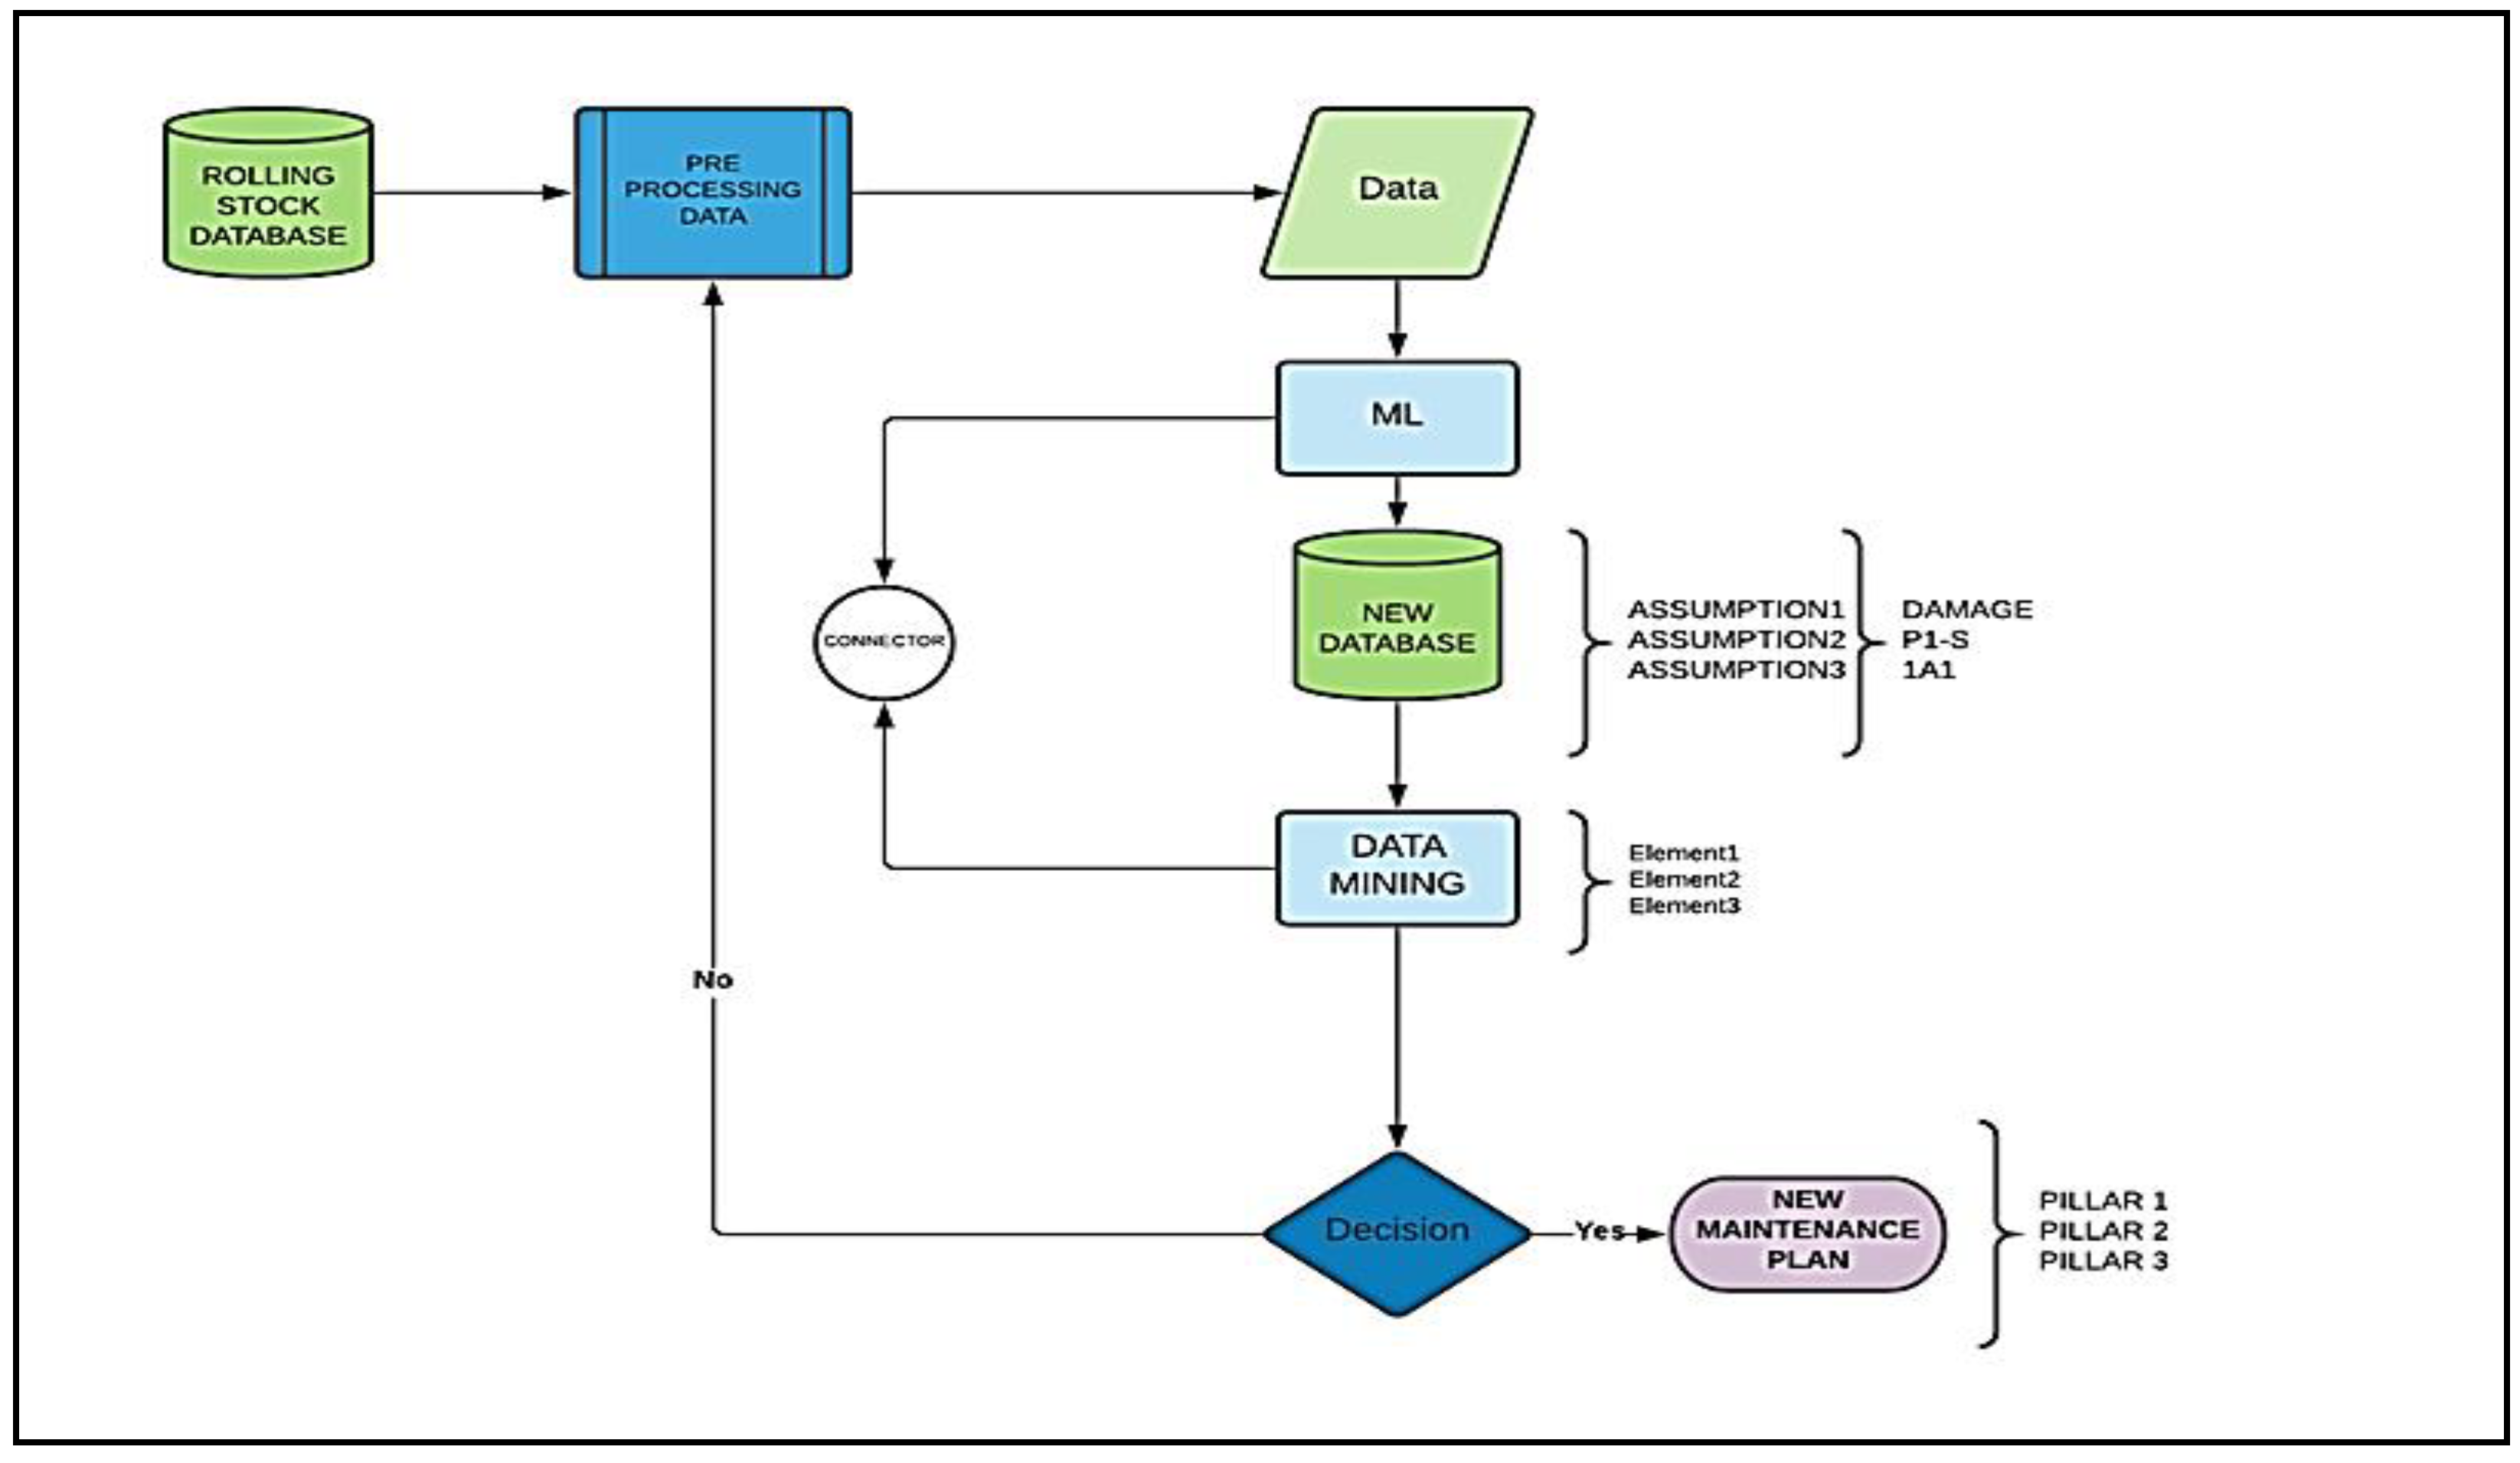
Figure 1 shows the approach to analyzing stored and inactive data where the use of machine learning and data mining leads to decision support for the maintenance solution. The methodology and the results of the research can be used as directions for the development of the procedures of maintenance either from other railway companies or from industrial units dealing with similar problems.
2. Methods
2.1. Dataset and Pre-Processing
The initial dataset provided by STASY provided all the operational–historical data from the rolling stock maintenance management for one year (from 1 January 2019 to 31 December 2019). The database used includes all the data for the traction and braking system, which are very important for proper traffic compliance, passenger safety and the most expensive in terms of maintenance costs for each railway company. The reports shall include all findings observed by the technical staff, such as the file of spare parts used, the duration of maintenance, the causes of worn spare parts, the damage to the equipment during the operation of the train and the miles traveled when the damage occurred.
The equipment of traction and braking consists of the following main patterns:
Automatic switch (code: 1Q1)
Traction engines (code: 1M1)
Capacitor filter of electricity network (code: 1C1)
Ballasts resolution of electricity network (code: IL1)
Ballasts resolution of electricity engines (code: 1L3)
Electronic intensity regulators of engines (code: 1A1)
Main adapters of driving current (code: 1K1)
Resistances of electric brake (code: 1R1)
Springs with electro pneumatic operation (code: 1S1)
The maintenance of the equipment of traction and braking takes place in three stages as it appears in the following
Table 1:
It must be noted that in case of a failure being observed or worn equipment in any stage of maintenance, the replacement of the faulty part takes place.
The management of the rolling stock—Line 1 (ex HSAP) of the STASY transport company, is using an information system, where all the tasks are saved (all three stages of the maintenance of traction and braking) which takes place during the preventive maintenance of the trains. The data are provided in data sequences that can be analyzed for trends and patterns.
The initial records contained 8180 instances and 34 attributes. For the implementation of the process tool questions, SQL is used for the removal of records and characteristics that do not contain any information useful for the research. Subsequently, the statistical analysis of the answers and the results takes place [
26].
The questions used at the initial package of data in order to create a new database in the form of an excel spreadsheet, which is useful for the implementation of the process tool is:
The number coding name of each train is: 1:3210, 2:3211, 3:3212, 4:3213, 5:3214, 6:3215, 7:3216, 8:3217, 9:3218, 10:3219
The number of kilometers travelled of the train in a year.
The number of kilometers travelled of a train until damage occurred in the traction and braking system.
The number of kilometers travelled that each train was withdrawn to the maintenance(S) or the malfunctions department (P1).
Table 2 shows how more kilometers (165,000 km) were travelled by the train units with 3215 and 3218 code, whereas fewer kilometers (148,000 km) by the train unit with 3217 code. The average number of kilometers travelled from all the trains in a year is 156,000 km. Data show the productivity of the train units. They also note that the appearance of any malfunction to the system of track and traction appeared when all the train units had already travelled 60,000 km, which makes up an important factor of the research. In addition, the table shows how every train is maintained in different kilometers travelled and many times is wrongly put at the malfunction’s department. It is considered important if there has been a malfunction in a train taken to the malfunction department, the maintenance takes place in different kilometers travelled than the ones scheduled. An important insight to consider is that the train with 3213 code, although it had travelled a distance of 80,000 to 100,000 and had to be taken earlier to the maintenance department, it was immediately promoted to the malfunction department.
In
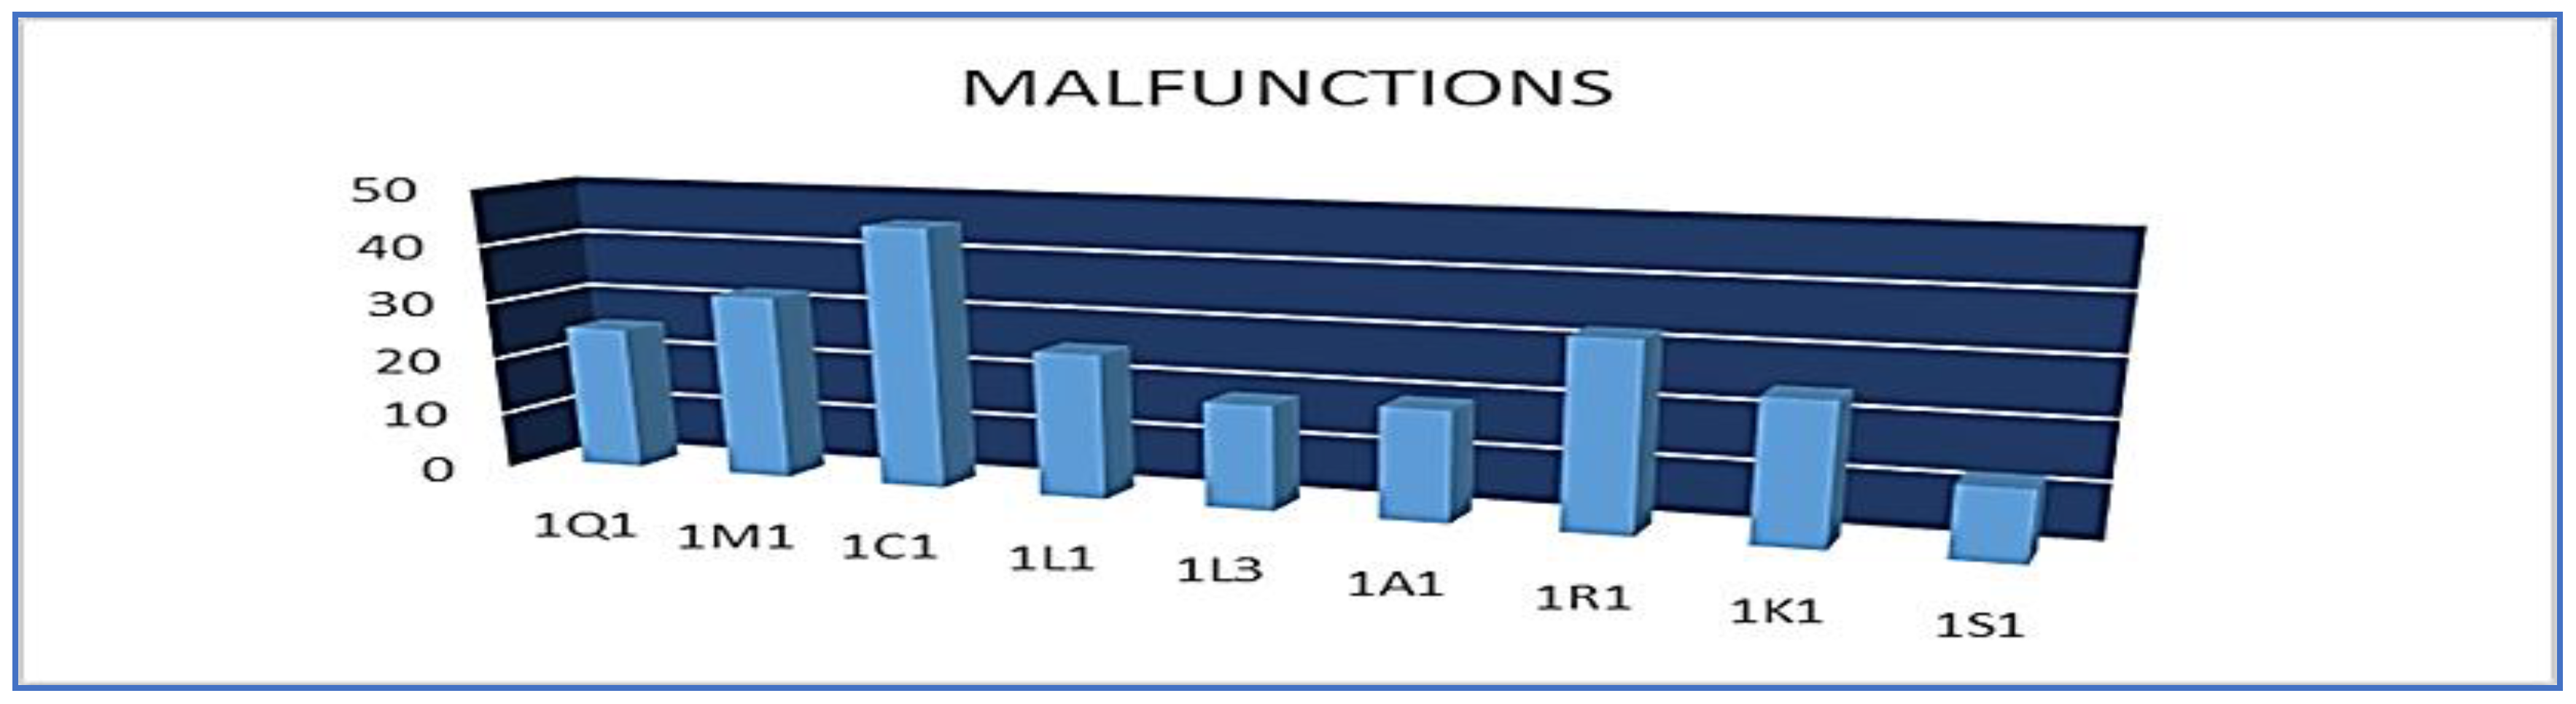
Figure 2, the spare part: Capacitor filter of electricity network (code: IC1) is verified as more vulnerable, recording malfunctions more than 50 times in the total of the train. All the spare parts of the equipment of track and traction appeared more than 10 times, apart from the springs with electro-pneumatic operation (code: IS1) that appeared 10 times.
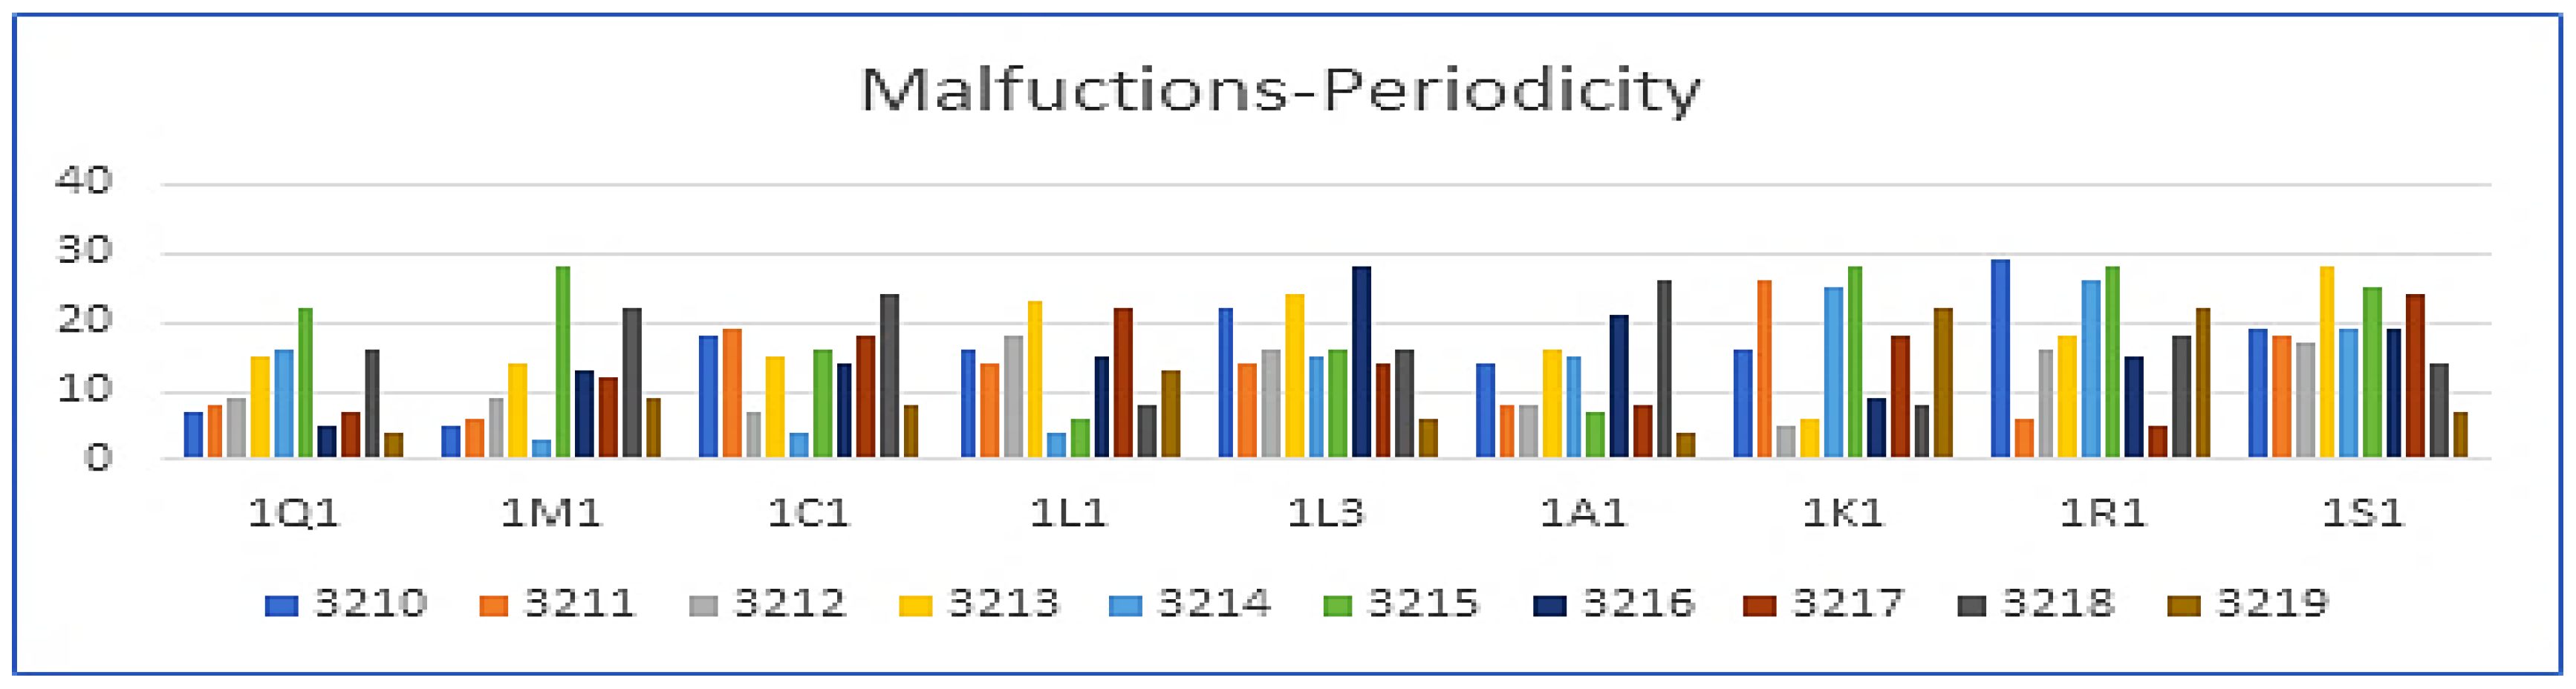
Figure 3 presents the number of recurrences of dysfunctions of each particle of the equipment in every train in a year time. The number of recurrences is defined as the periodicity of the dysfunctions. The periodicity of the malfunctions of each component (
Figure 3) on each train is not the same.
Table 3 illustrates the periodicity of each malfunction on each train, with codes: (code A: repeated from 1 to 9 times) (code B: repeated from 10 to 19 times) (code C: repeated from 20 to 30 times).
The data extracted from according to the questions contain the following 6 traits/characteristics and are capable of the creation of a new base of data valuable for the research are:
Numerical distinction of the trains: code: (train name)
Kilometers of the trains travelled in 12 months of operation (Numeric value)
Kilometers travelled when the malfunction appeared to the system traction-braking in each train separately (Numeric value)
Dysfunctions in total that the equipment presented annually in the circulation of the trains, activating the backup systems for their travelling with safety. (Numeric value)
The periodicity of the malfunctions of all the departments separately, of the equipment of traction and braking.
(code A: repeated from 1 to 9 times)
(code B: repeated from 10 to 19 times)
(code C: repeated from 20 to 30 times)
The distinction of the of each train either for control at the maintenance or the urgent repair at the malfunction department.
After the investigation and analysis of the initial data, important information was extracted and a new database (
Figure 4) was created, highly effective and useful to the research, to be used for the implementation of the target of extracting knowledge and the development of a predictive model and the new rules of the rolling stock maintenance.
The new database is a representative sample of the whole maintenance department; with the selection of the appropriate algorithm and without the correlation of the cause getting in the way, the precise assessment of the data can take place [
27].
2.2. Data Processing
In the scientific–investigative research for the finding of a method to improve the maintenance of the rolling stock of the traction/braking system is met with data mining. With the use of algorithms of machine learning, decision trees of C4.5 categorization (Weka J48) and regression M5 (Weka M5P), takes place the approach of a new suggested method-process for the predictive diagnosis of the technical ability of the trains. The techniques above are provided with the software of machine learning Weka. The function of the Weka software demands specific types of files. The new base of data is transformed and stored as an ARFF file, which provides, as data, the kilometers travelled of the trains in 12 months consecutively, the kilometers travelled when the malfunction appeared in the track and traction system of each train separately, the total malfunctions that the equipment faced in a year, when the backup systems were activated for their safe travelling, the periodicity of the malfunctions of all the items of the equipment of track and traction (code A) (code B) (code C), the distinction of every train unit either for maintenance control or for the urgent repair at the malfunctions sector (code: P1) (code: S) and the numerical distinction of the trains, which will be used in the process of the research.
The J48 algorithm was applied to the Weka software with a variable target to transport the train to the malfunction or maintenance section (
Table 4). The results after the algorithm is completed are as follows:
Table 4 informs that the performance of the J48 algorithm with target variable the transfer of the train to the department of malfunctions or maintenance showed 90% of instances classified correctly and 10% for those classified incorrectly, with a learning capacity of 0.7856 for the Kappa statistic. Additionally,
Table 4 from the confusion matrix informs that the number of true positive: 6, false-positive: 0, false-negative: 1, true-negative: 3. It also classified Classes A and B with high performance, with Precisions of 0.857 and 1.000, respectively. The results of the Matthews Correlation Coefficient (MCC) proved this gain with values of 0.802 for A, 0.802 for B.
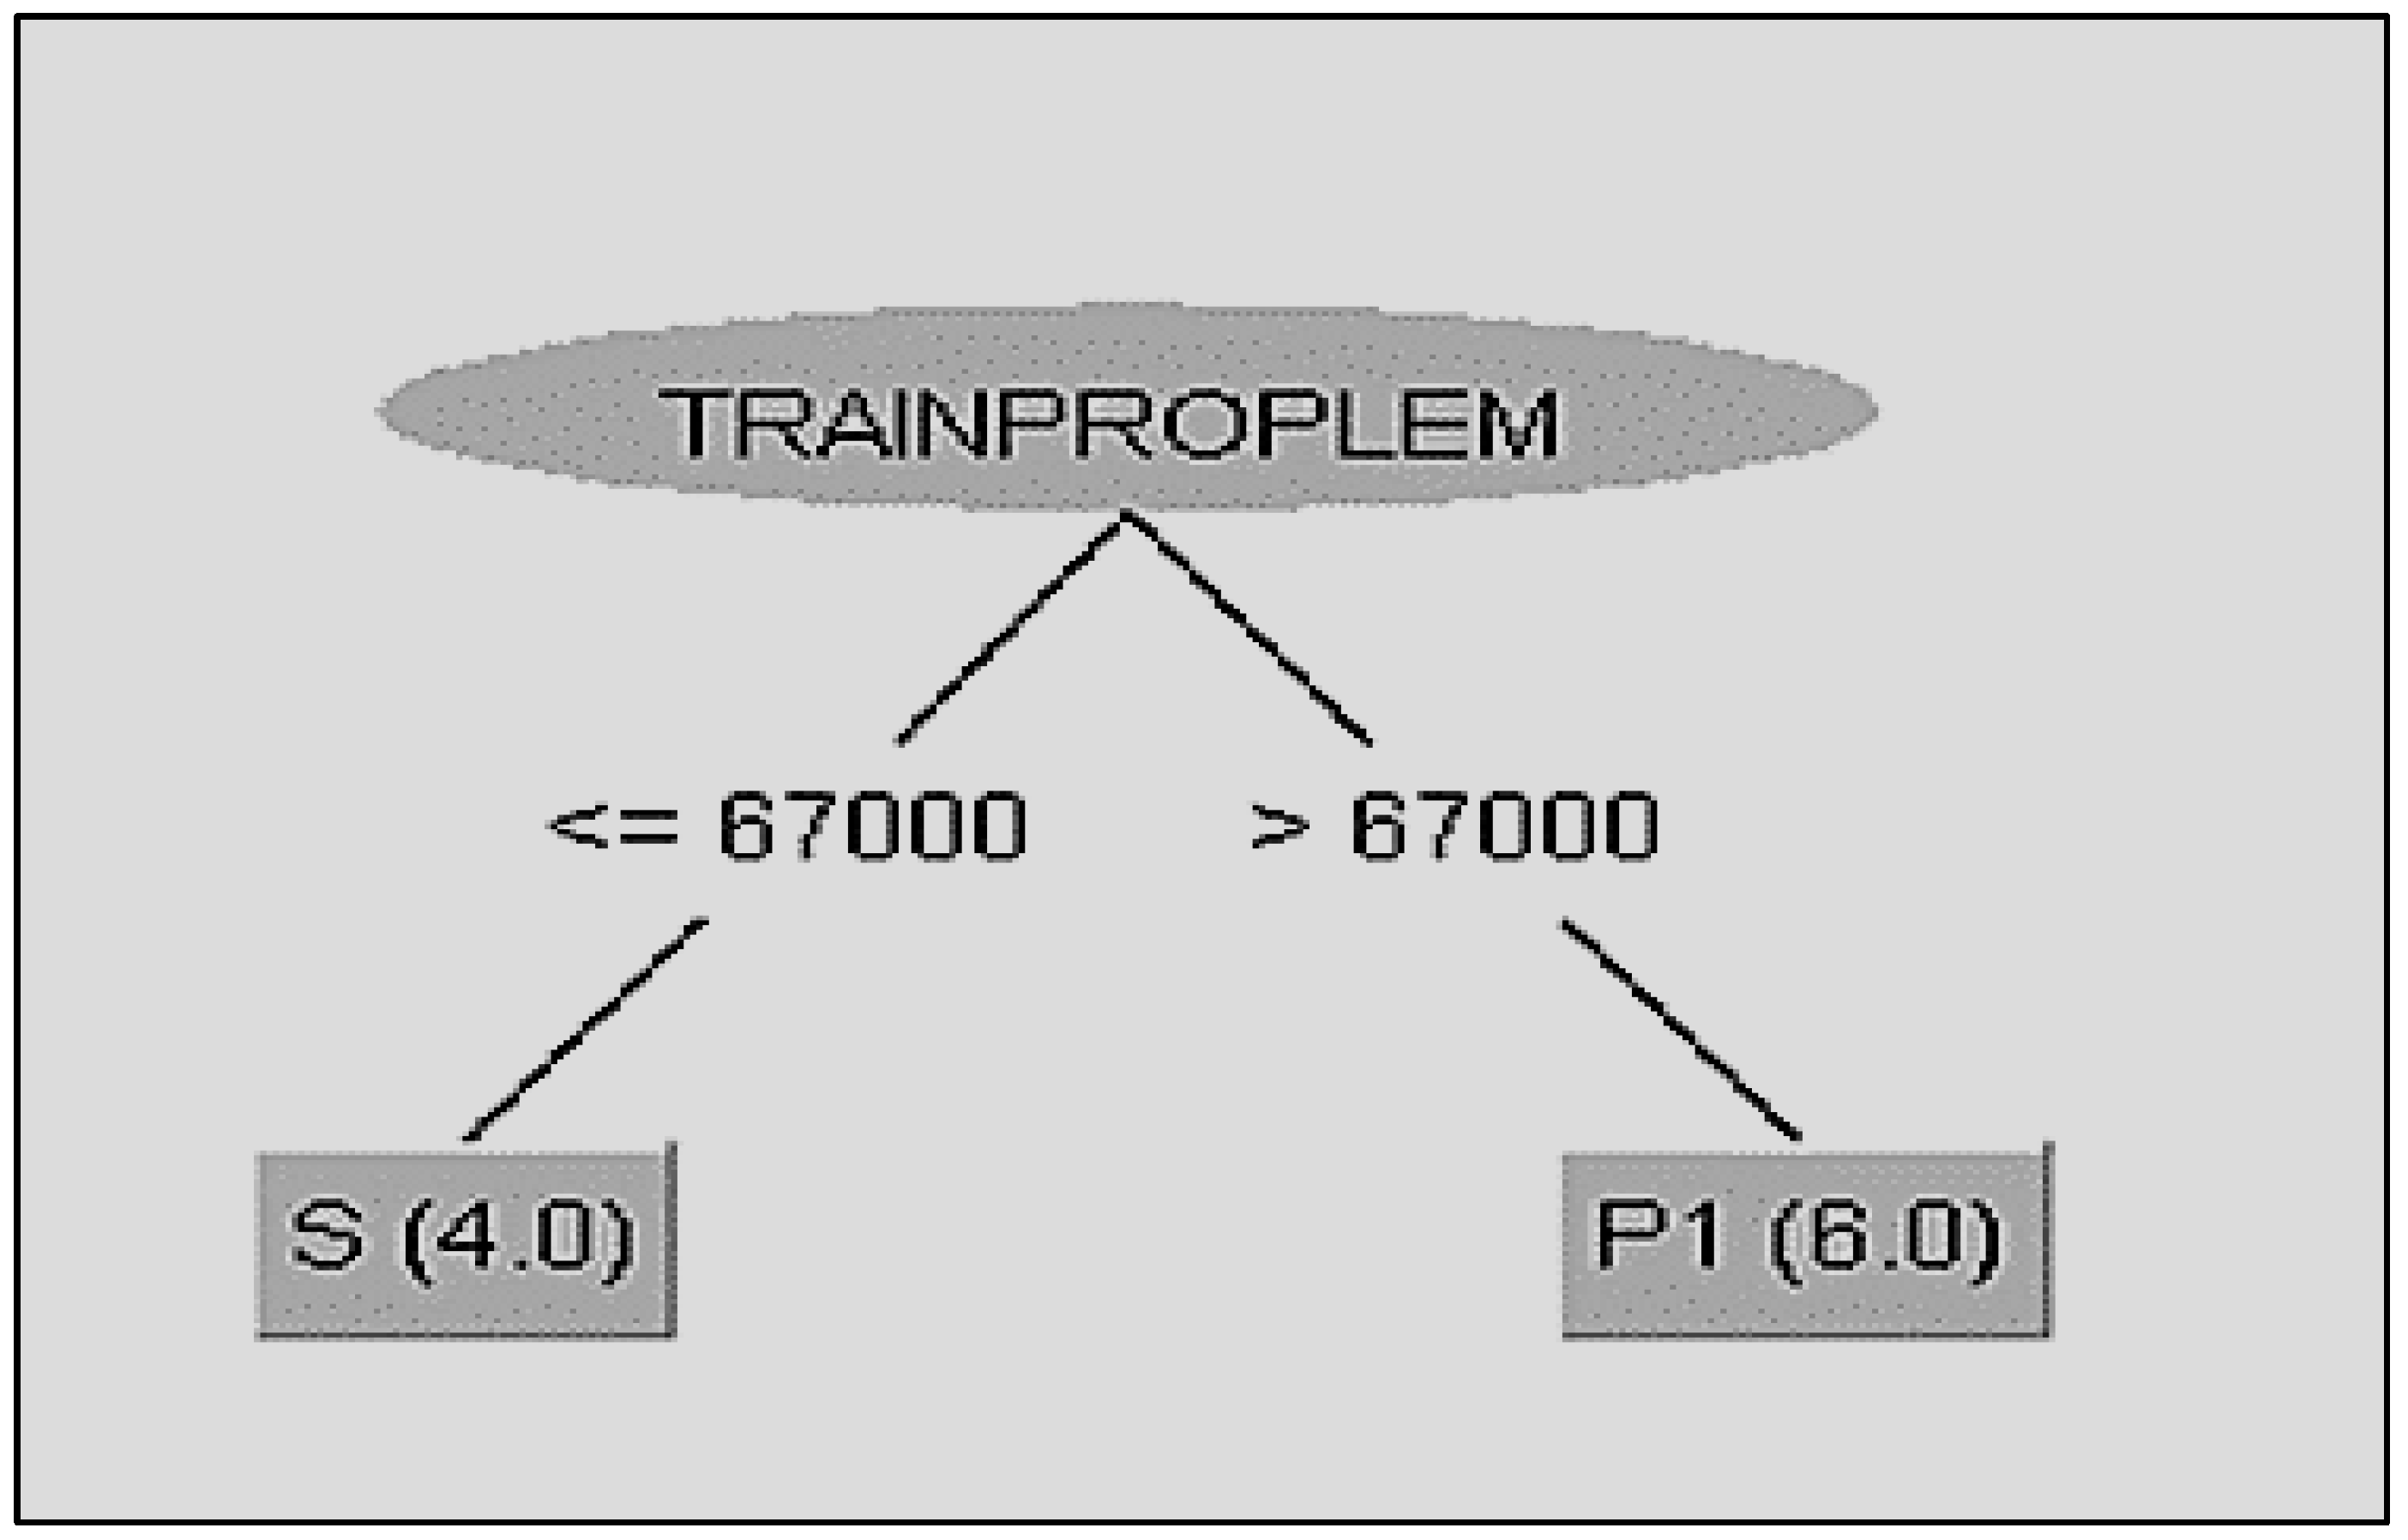
By the end of the algorithm, the result that comes up is that the defining limit for the transition of a train from the maintenance to the sector of malfunctions is 67,000 km (
Figure 5). The WEKA program creates/visualizes the requested decision tree:
The J48 algorithm was applied to the Weka software with a variable target the main malfunction that the equipment the traction/braking has (
Table 5). The results after the completion of the algorithm are the following:
Table 5 informs that the performance of the J48 algorithm with target variable the main malfunction to the equipment traction/braking showed 80% of instances classified correctly and 10% for those classified incorrectly, with a learning capacity of 0.5823 for the Kappa statistic. Additionally,
Table 5 from the confusion matrix informs that the number of true positive: 5, false-positive: 1, false-negative:1, true-negative: 3. It also classified Classes A and B with high performance, with Precisions of 0.833 and 0.750, respectively. The results of the Matthews Correlation Coefficient (MCC) proved this gain with values of 0.583 for A, 0.583 for B.
By the end of the algorithm, the result that comes up is that the most vulnerable element of the traction/braking system is the electronic engine regulator (1A1). When the appearance of the dysfunction surpasses the 10 times, the train has to be transferred to the sector of malfunctions for repair (
Figure 6). WEKA program creates/visualizes the requested decision tree:
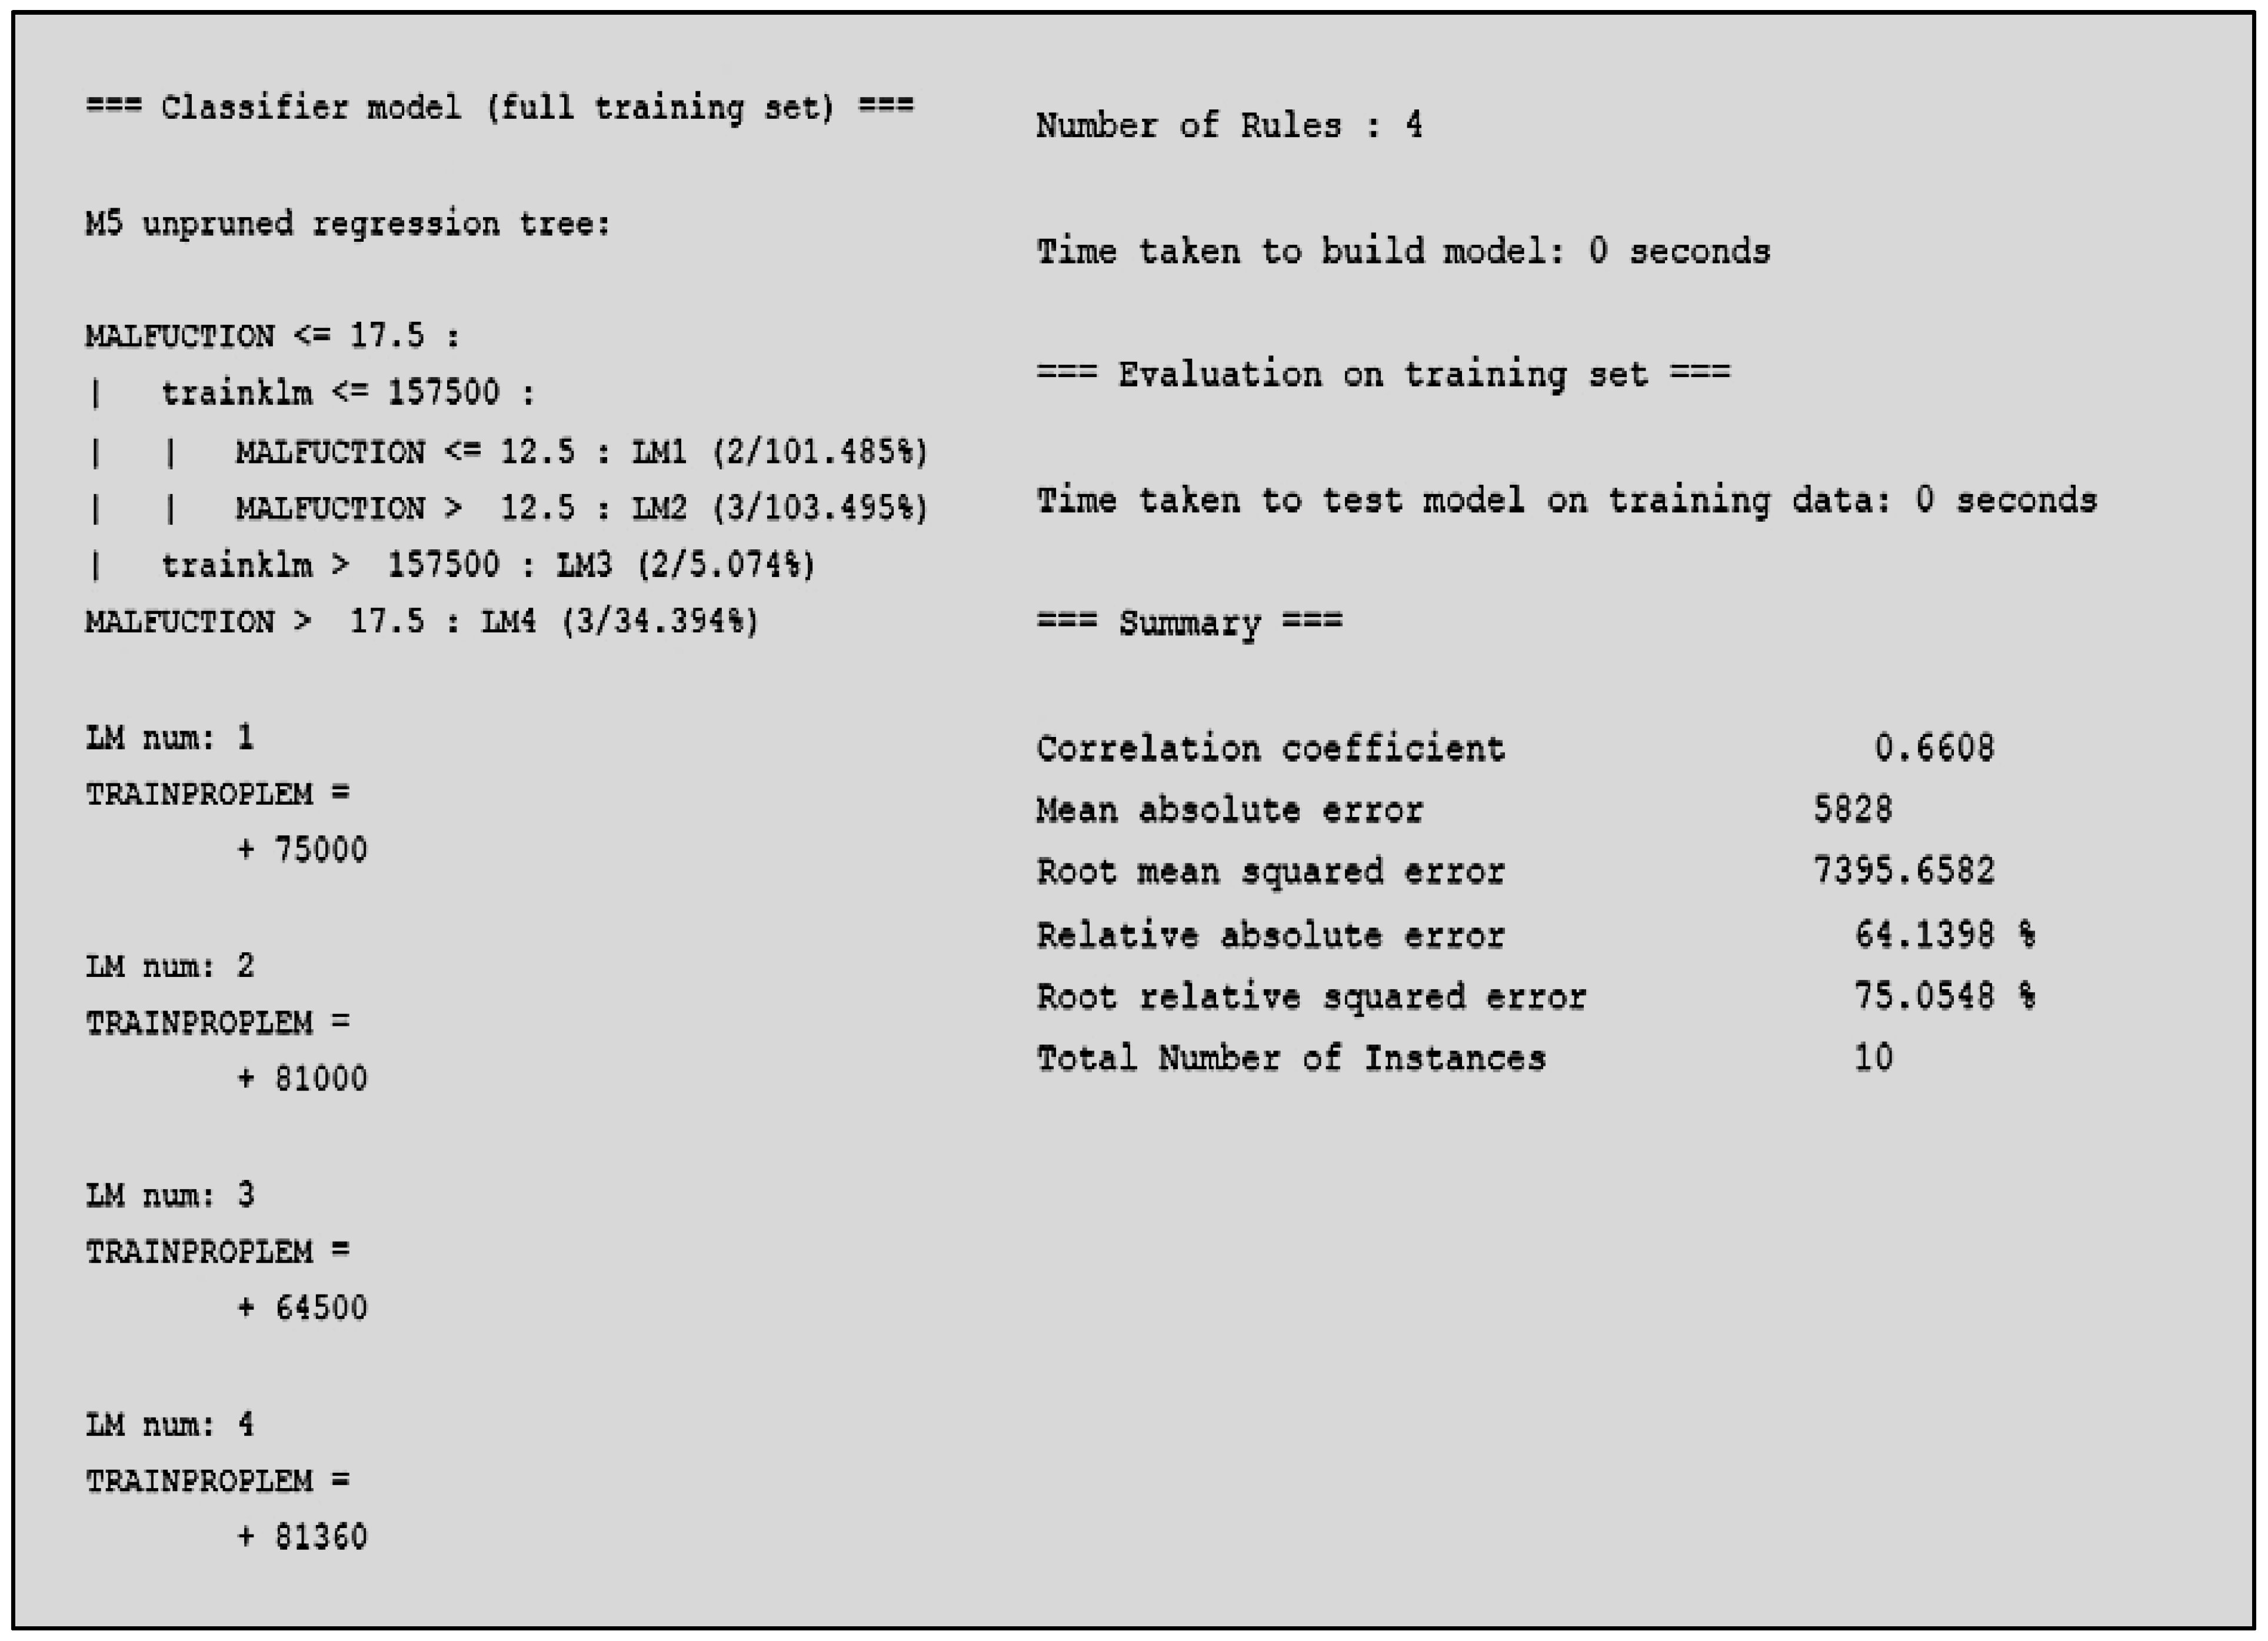
Using the M5P algorithm of the WEKA software (
Figure 7) for the extraction of rules with characteristics the periodicity of the malfunctions of the equipment of traction/braking, the kilometers travelled when the malfunction of the equipment appeared and the total number of kilometers that the trains travelled in a year, offering the following result:
Figure 7 shows that the M5P algorithm creates four rules for the mileage of the train, informs us that it has an accuracy of 66% and that the time of the creation of the model is 0 s.
The WEKA program creates/visualizes the requested regression tree:
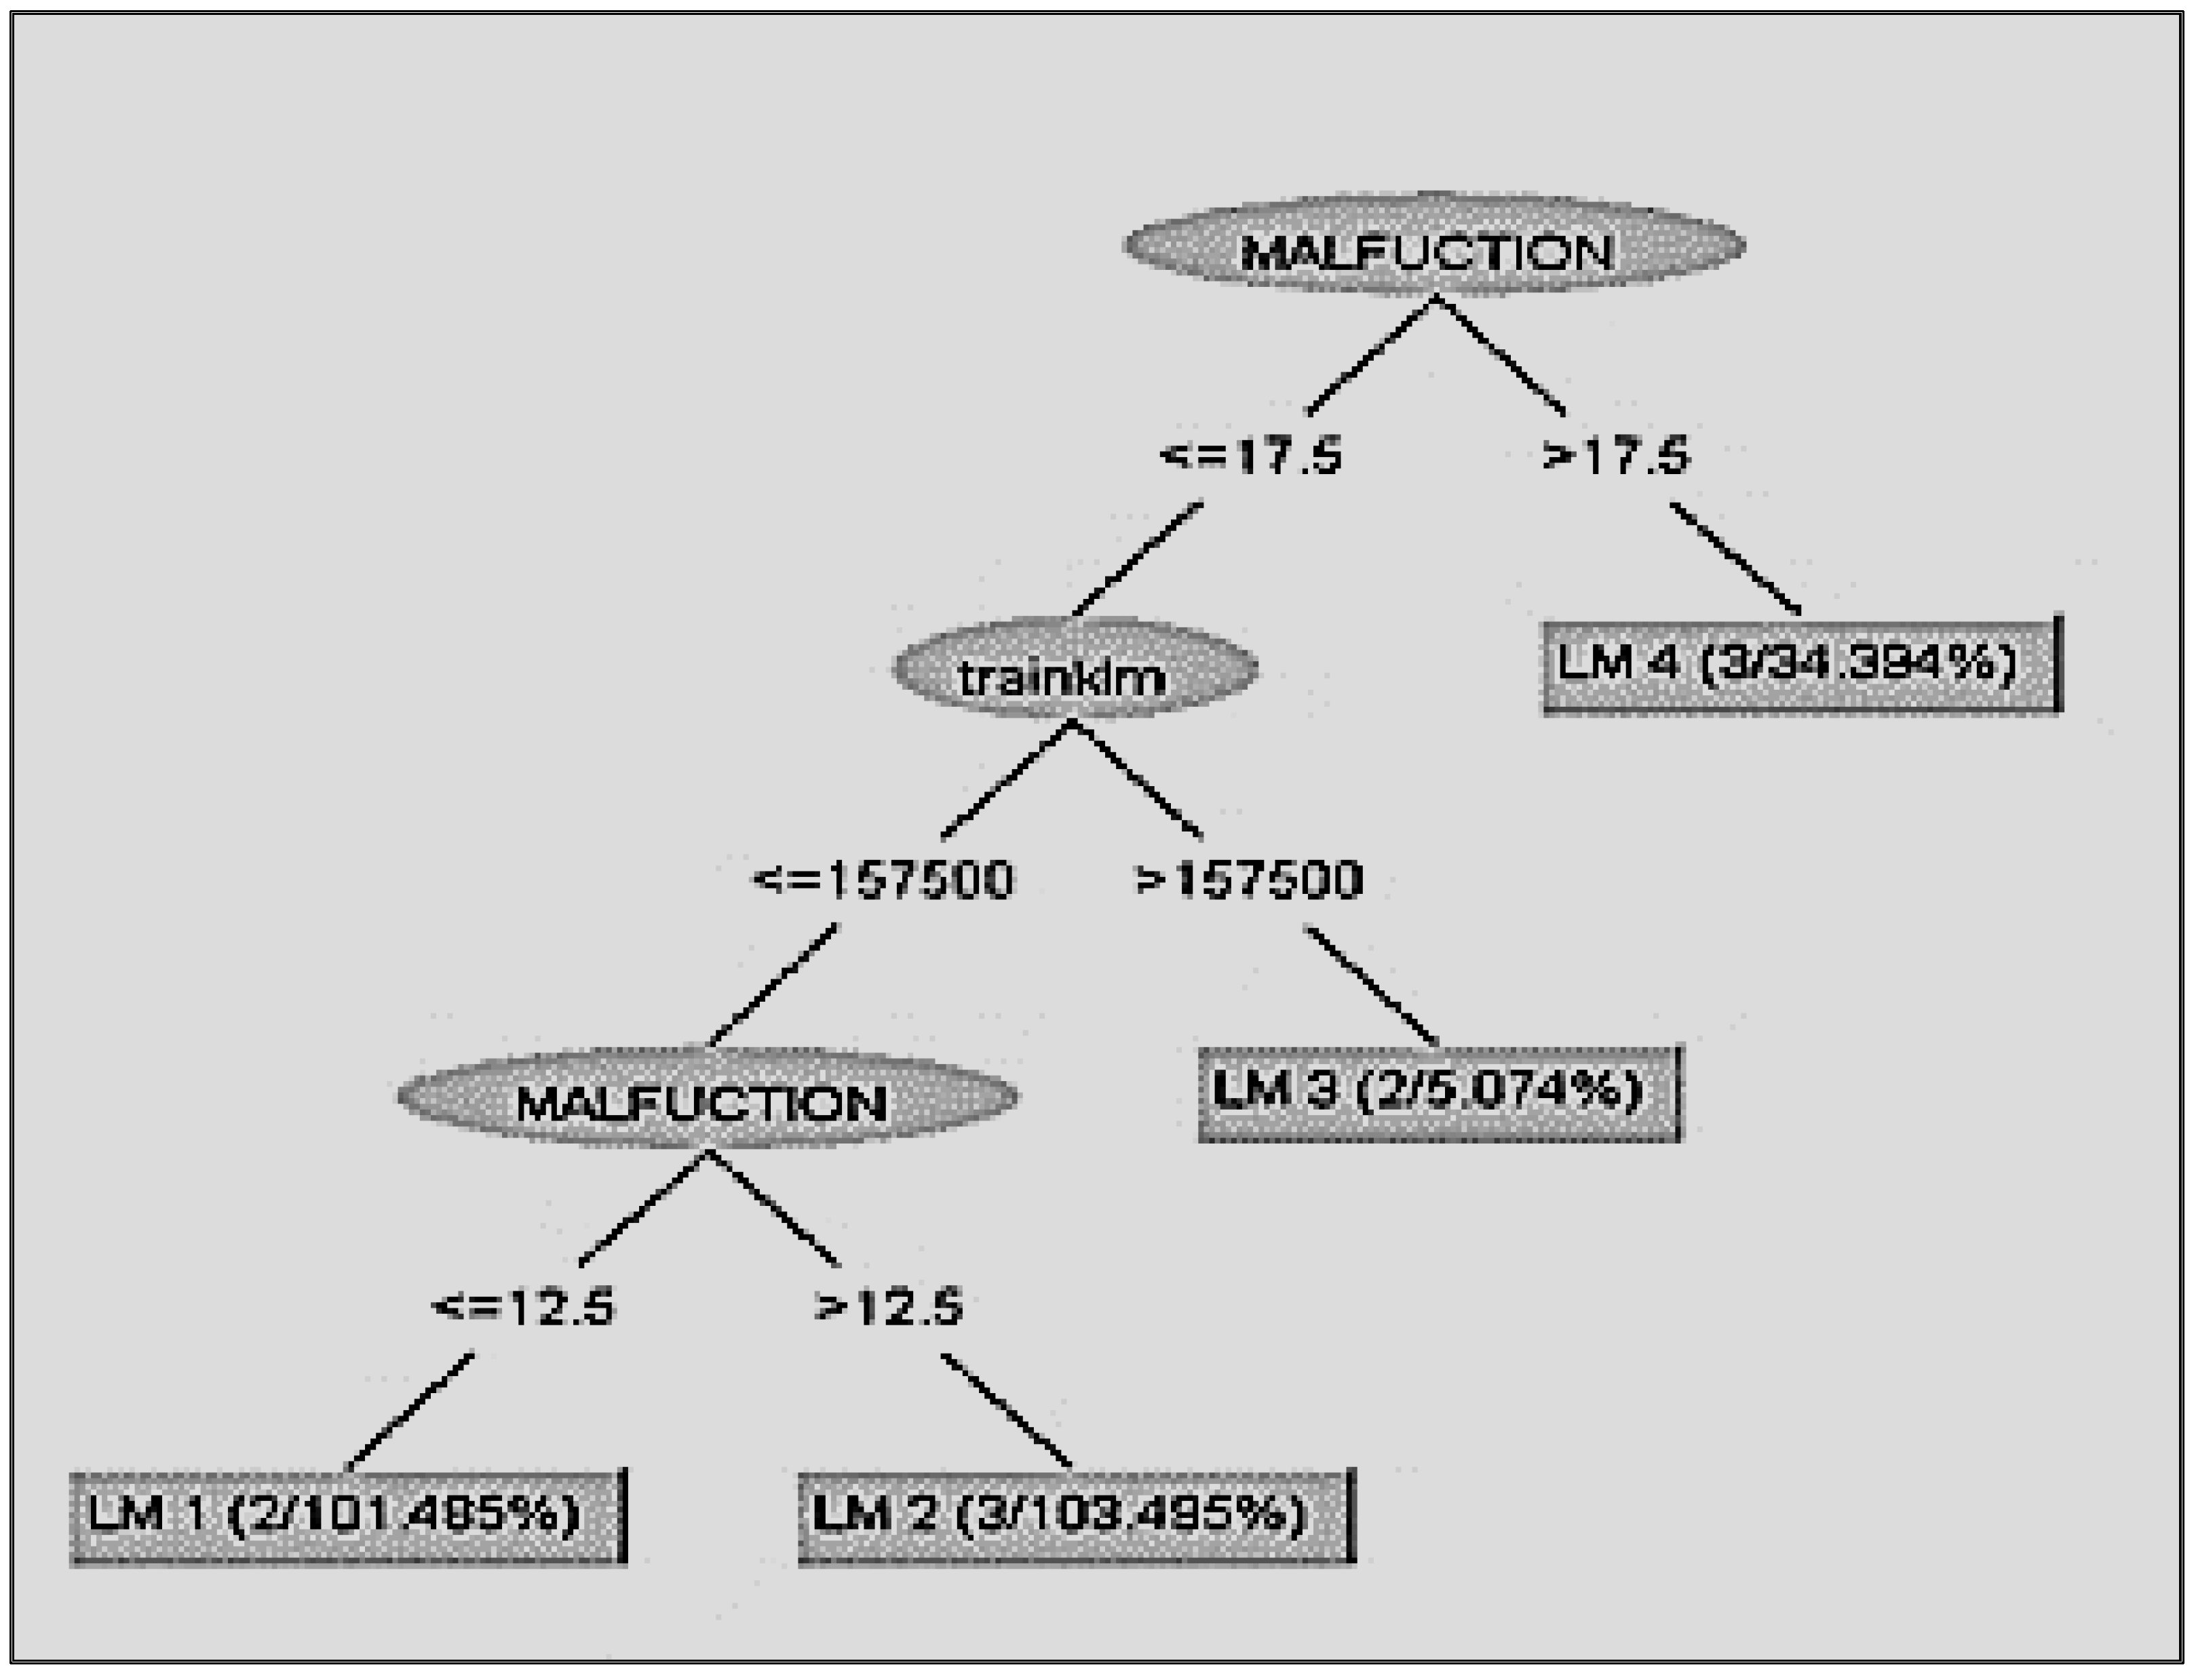
From the final regression tree (
Figure 8) some general useful rules are extracted:
Dysfunction of an item more than 17 times: the train unit will show malfunction to the traction/braking system in the 80,000+ kilometers. (when it has travelled less than 157,000 km)
Dysfunction of an item less than 17 times: the train unit will show malfunction in 64,500 km (when it has already travelled 157,000 km)
Dysfunction of an item more than 12 times: the train unit will show malfunction in the following 75,000 km (when it has travelled less than 157,000 km)
Dysfunction of an item less than 12 times: the train unit will show malfunction in the following 81,000 km (when it has already travelled 157,000 km)
3. Results and Discussion
The pretreatment at the huge and chaotic database of the railway company offered useful and necessary information, with quality characteristics valuable to the research.
During the pretreatment of the data, the distance by kilometer travelled by each train in a year on tracks appeared and it was verified that, on average, they travel 156,000 km (
Table 2). The appearance of a malfunction of the traction and braking system is recorded when the train units had travelled 60,000 km (
Table 2). The spare part of the equipment of the traction and braking that is more frequently appeared as a malfunction, affecting the circulation of the train is the capacitator filter of electricity network code (1C1), (
Figure 2) which is negatively affected by the periodicity of the dysfunction of the other spare parts of the equipment (
Table 3). Finally, it is verified that every train is maintained in various kilometers travelled and, many times, they are wrongly placed in the malfunction sector (
Table 2). The accuracy of the new characteristics and the selection of the appropriate method and the optimum techniques of machine learning/data mining resulted in the assessment of the data with strict criteria as the quantity, the legibility, the clarity, the ability of configuration, in relation with the periodically written reports of the maintenance of technicians.
Table 6 shows the percentage of success of 90% of the results, which decreased the probability of mistake to the least and the process was repeated four times and the result appeared almost the same with an average success rate of 80%.
The three decision trees that were created with the use of WEKA software give the possibility to analyze data and provide useful information (
Table 7), capable of organizing a new plan of maintenance for the railway company.
Table 7 shows the train limits (km) for transport to the malfunction department (P1) or maintenance department (S). It also informs that the most vulnerable element of the traction braking system is the electronic engine regulator (1A1) and depending on the frequency of damage to that component, to which department (P1) or (S1) should receive the transfer. Finally, it shows that the general rules for malfunction appear in relation to the kilometers of the train and the periodicity of the faults.
Assumption 1: the cause of dysfunction of the traction/braking system sets at risk the safety of the passengers and the transportation of the train to the maintenance department is required, before the appearance of any failure.
Assumption 2: The replacement time of a malfunction at the traction/braking system is much more than the time of maintenance that the system needs for its proper functioning.
After the completion of the J48 algorithm, with 90% result precision, and the creation/visualization of the No1 (
Figure 5) decision tree, the conclusion drawn is that the kilometer limits for the transfer of a train to the maintenance department (S) or the malfunction department (P1) is the 67,000 km. If the train travels more than 67,000 km, a malfunction to the traction and braking system will probably be caused and as a result, the train must be transferred to the malfunction department (P1). Consequently, the time of replacement of the failure will exceed the time of maintenance and will increase the possibility of an accident.
From the decision tree No. 2 (
Figure 6), after the implementation of the J 48 algorithm with the same data but a different variable and result of the success rate of 80%, the output result is that the most vulnerable element of the traction/braking system is the electronic engine regulator (1A1) which affects the network overall. When the periodicity of its dysfunction, exceeds the 10 times, malfunction to the traction/braking system appears, and the train must be transferred to the malfunction department to be repaired.
Then, using the M5P algorithm with a success rate of 66%, to the same database, choosing different characteristics to interpret, some useful general rules can be extracted (Regression tree No. 3 (
Figure 8)). The periodicity of dysfunctions of the traction/braking elements of equipment is the most important characteristic for the smooth function of the train and the planning of the most effective schedule of maintenance. When a dysfunction of a spare part appears more than 17 times, the train will probably have a malfunction of the traction/braking system after the 80,000+ kilometers. If the failure frequency is below 17 times but the train has travelled more than 157,000 km, in a year’s time, holding all the necessary controls, a malfunction will arise in the next 64,500 km travelled. When the train has travelled less than 157,000 km and the failure frequency is less than 12 times, the malfunction will appear in the next 81,000 km, if the periodicity is bigger than 12 times, the malfunction will appear after the 75,000 km.
After the data analysis and the interpretation of the results, useful information comes up with quality characteristics. The beneficial elements for knowledge extraction and planning of a new innovative process of maintenance can be summarized as follows:
Element 1: Prediction for the implementation of the rolling stock maintenance before the malfunction appears which will set at risk passengers, technical stuff, and equipment.
Element 2: Prediction for the option of transference of the train to the department of malfunction or the maintenance department from the rolling stock management.
Element 3: Prediction of the most vulnerable spare part, capable of causing dysfunction to the whole traction/braking system.
Element 4: Prediction for the appearance of a malfunction to limited kilometer distance.
The complete development plan of the rolling stock maintenance moves towards the direction of decreasing the operation cost of trains and increasing the international competitiveness based on three pillars, combined with the appropriate reformations which are capable of playing the leading role to the effort of changing the productive model of maintenance of the trains aiming at the guarantee of the passengers’ safety.
Pillar 1: The process of visual control to specific kilometers travelled by the train, can be repealed, without influencing the operation of the traction/braking system.
Pillar 2: The most important element of equipment, which requires special attention is the electronic intensity regulator of engine (1A1), to which importance has to be attached for its maintenance, in order to avoid changing dysfunction to the rest of the network.
Pillar 3: The kilometers travelled of a train and the periodicity of the dysfunctions of the system have to be recorded and observed continuously, offering to the management of the rolling stock the possibility to make decisions on time for the transference of a train to the department of malfunctions or to the maintenance department, aiming at the minimizing of the malfunctions and the maintenance of the proper application of the equipment.
Table 8 shows the positive difference in the maintenance of rolling stock (
Table 1) by removing visual control, increasing (km) maintenance, and reducing the technical staff employed and reducing the days of unavailable equipment.
Figure 9 observes the total process for optimizing maintenance work, by creating specific rules and successful results.
4. Conclusions and Future Work
In this research, technicalities for the prediction of maintenance are suggested for the rolling stock of the Greek Railway Company and especially the traction/braking system of the trains. After the application of strict criteria of precision, algorithms of machine learning were used (classification trees J48 and regression trees M5P) for the development of predictive models and rules. The research featured the importance of the predictive maintenance of the rolling stock, emphasizing the data available from the management processes of the railway companies, which can be used for the creation of predictive models of machine learning without the addition of new recording/supervising devices in the trains. With the method suggested is offered to the management the ability to select for the direct transfer of the train to the malfunctions department or to the maintenance department. The method uses Machine Learning open source software (Weka) which is free of charge and provides appropriate information for the fast, valid, and correct decision from the management in order to avoid dysfunction of the train which will set in danger the safety of the passengers, minimizing the time of the train’s availability as well.
The predictive data analysis took place, where it was investigated and pinpointed as a vulnerable spare part that is capable of becoming the reason of dysfunction of the whole traction/braking system, the electronic intensity regulator of the engine. The creation of new knowledge for the particular element of the equipment of the traction/braking provides the management of Rolling Stock with the ability to set to immediate priority the maintenance of the specific spare part, since its status change, can influence the whole system.
Additionally, from the data processing, rules were created for the limitation of the kilometer distance for the malfunction appearance to the traction/braking system. The new rules provide the executives of the railway company with new knowledge for the implementation of a predictive maintenance plan, aiming at usage for the safe function of the trains.
The estimation of the result was not thoroughly satisfying, although the function of the method is proven, since the kilometer limits presented for the appearance of a malfunction, is sufficient for the creation of a new maintenance plan, aiming at the proper operation of the equipment as well as saving valuable resources. The quality of the prediction can significantly increase with the increase in the new data.
Finally, a new method (using open-source machine learning software Weka) was developed which can classify the dysfunctions of various spare parts successfully, predict the required completion of tasks setting new rules for the maintenance of the trains, preventing it from useless tasks that can charge the cost of maintenance.
The approach of analysis of stored/inactive data that is suggested to the STA.SY company can develop better procedures of maintenance accomplishing a decrease in the total cost of maintenance, with the elimination of overtime and the purchase of non-effective spare parts.
The results of the research satisfy, to a great degree, the demand of the railway companies for the cost decrease in maintenance with the increase in productivity of the human resources and the logistical potential.
Using the Machine Learning software (Weka)—which has zero cost—the new method provides the executives of the company with new knowledge for making quick and valid decisions, implementing a new plan of monitoring for the reliability and availability of the under maintenance equipment aiming at the optimum function of the trains in order to achieve the target of major importance the safety of the passengers and the trains.
In the near future, the new method may be used to analyze, predict faults, and train behavior when the maintenance period cannot be determined on the basis of the mileage of the train.
The evolution of the method can come from the exclusive use of regression algorithms to extract new specific maintenance rules to predict the length of time required to maintain trains.
Business data reproduce over time and have new features. In the future, the new method will have to use new data. That is why recording and properly processing them is an important process.
In future studies, the expansion of this method can take place for any software of the train that is able to offer data. Additionally, in a railway company, the improvement of many procedures that create complex data can take place, such as at the ticket office, at the trains’ schedule, the timetable of the workers’ shifts, at the traffic control, and at the safe maintenance of the passenger’s track.
Companies that use either traditional processes or technologically obsolete processes can analyze their generated data very quickly, reliably and at zero cost, creating new knowledge to make quick and valid decisions, successfully contributing to the achievement of their goals. The discovery of new knowledge can define the future and the success of every company.


