3.2. Narrow Down Processes
The second step was to condense the database by eliminating the inappropriate words that were not directly associated with FI. All words that did not fall into the category of the product feature or attribute were excluded from the database (e.g., charity, health, heart, devotion, energy, etc.). Finally, the elimination of similar words was done. The number of attributes was condensed to more than twenty by neglecting words that appeared improper for expressing frugality. In this process, 30 design experts from academia and industry were involved to identify the relevant attributes by removing similar and inappropriate attributes from the design vocabulary.
The total number of attributes was narrowed down to 11 attributes, as shown in
Table 1, after the focus group session with the design experts in which words are mapped with the definition of frugal design. Cumulative frequency distribution analysis was performed to identify the important attributes that are directly or indirectly related to frugality with the help of 30 design experts (
Table 2). Cumulative frequency is an important tool in statistics, and also in data analytics; it helps to govern the number of observations that lie above (or below) a certain value in our dataset [
26]. It is also used to extract the information from the dataset, i.e., decision making, trend analysis, forecasting, etc. Cumulative frequency distribution was tabulated with the help of distinct attributes and their corresponding occurrences. The analysis table based on cumulative frequencies was presented by the steps stated:
Absolute frequencies for each of the attributes were collected from the design experts.
Frequencies were arranged in descending order.
The cumulative frequency for each corresponding design attribute was further calculated.
Finally, the percentage corresponding to each attribute was calculated using the following formula:
cf = Cumulative frequency
∑ fi = Sum of absolute frequencies
n = Total number of attributes
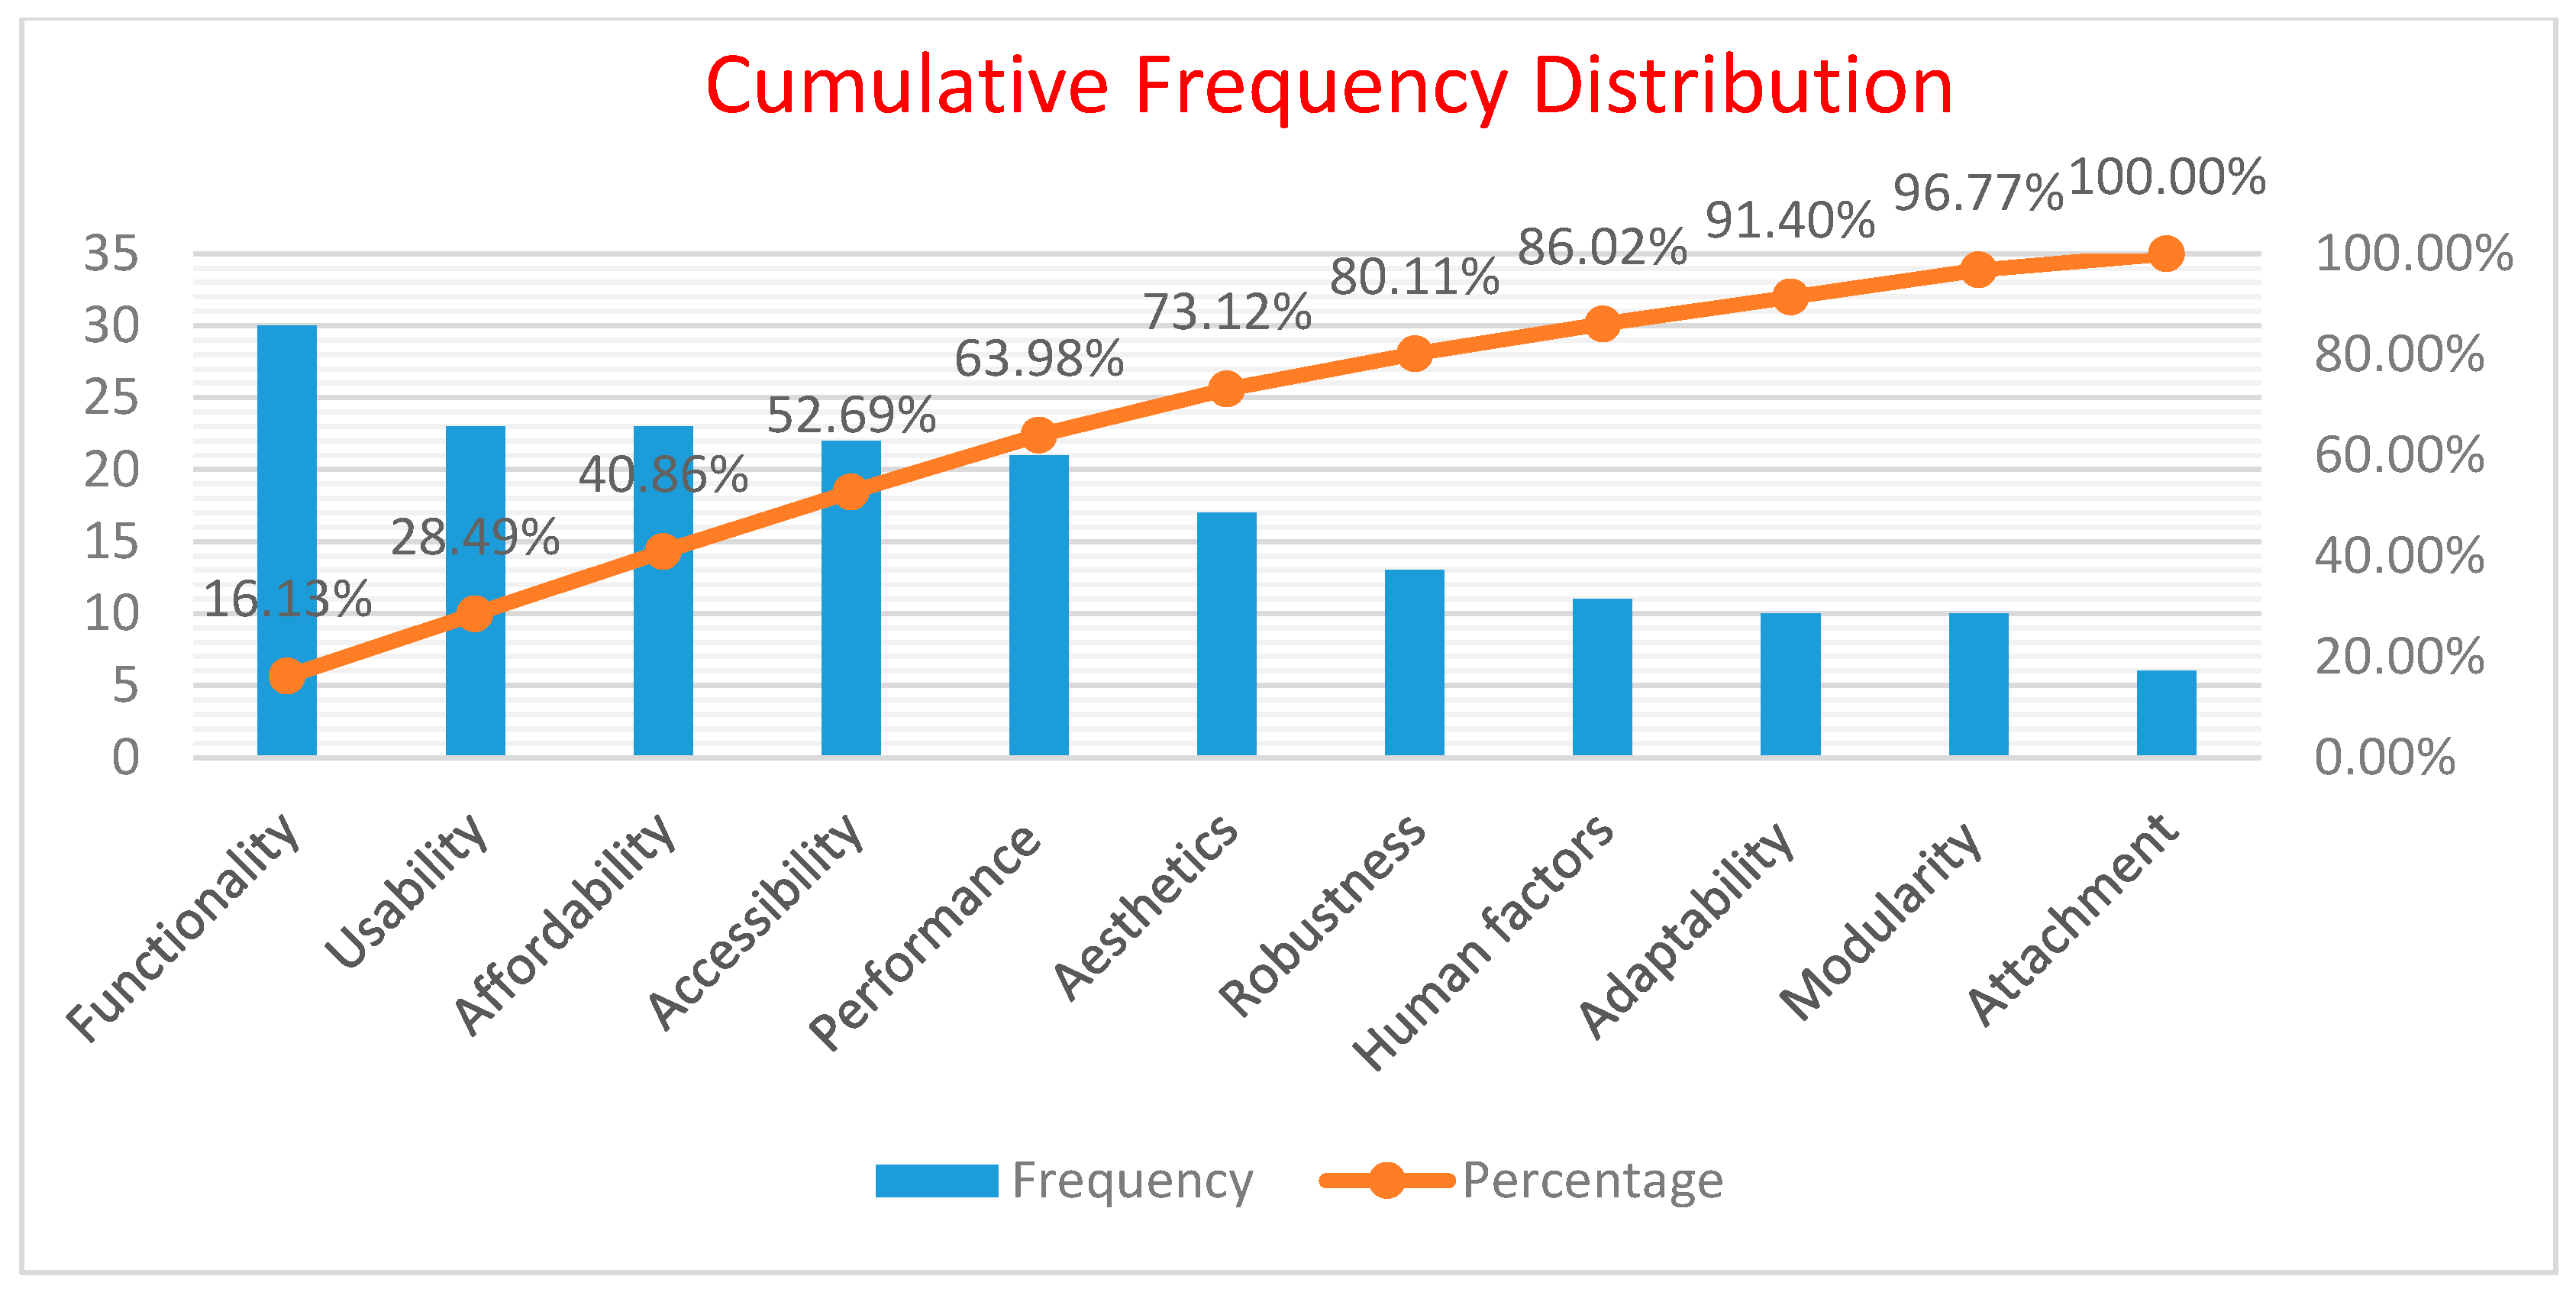
The cumulative frequency distribution analysis was applied to eliminate the uncertainties related to design attributes and to prioritize the root-cause and/or problem-solving. The cumulative frequency distribution chart, therefore, shows the relative frequency design attributes in a rank-order, and thus delivers a prioritization tool so that process improvement activities can be organized to get the most effective attributes towards the frugal innovation from others. The purpose of applying the cumulative frequency distribution analysis was to separate the “vital attributes” from the “trivial many”, which was represented with the help of the cumulative frequency distribution chart.
Figure 3 and
Table 2 shows the absolute frequency and cumulative frequency distribution of the 11 design attributes. After evaluating the cumulative frequencies and their corresponding percentage, we applied an evaluation rule on these attributes, which states that:
“All the attributes lying within 80% are recognized to be the vital attributes contributing towards frugal innovation”.
This evaluation rule acts as a threshold in the cumulative frequency distribution analysis, predicting which among all the attributes lies above the stated threshold value, are recognized as the significant ones. Therefore, based on this evaluation rule, 7 attributes were recognized to significantly contributing towards frugal innovation, namely:
Functionality: The quality of being suited to serve a purpose well [
27].
Affordability: Affordability is related to an economical bond that consumer experiences during the purchase of the product at an efficient price.
Usability: Ease of use and learnability of human made products.
Aesthetics: Concerned with emotions which evoke a sense of beauty and precision in relation to form, color, material and finish.
Robust: Product, service, and environment able to withstand or overcome adverse conditions and perform effectively.
Performance: The action or process of performing a task or function [
27].
Accessibility: Products and environments should be designed to be usable by all sets of users without modifications.
Thus, the seven important attributes were pinned down for the development of frugal designs.
3.3. Essential Attributes
To determine the importance of each of these seven vital attributes towards a frugal innovation, a descriptive-analytical tool called the Relative Importance Index (RII) on the basis of a Likert scale was employed. The Relative Response Index is used for performing regressive analysis on the attributes that have been identified in the previous stage of cumulative frequency distribution. It acts as a predictor, which helps to gain insight to which of the given factors are the most important or are of lesser importance. In addition, with the help of RII, we can compare the responses from each of the group of respondents in order to draw a comparison among the factors, indicating which factor is more important to either of the sets of respondents in an ordered custom. In order to draw this conclusion, we again deployed a panel of design experts and design practitioners who are actively associated with the process of design innovation, that helped us determine the importance of these attributes, which was achieved by collecting individual responses on a 5-point Likert scale. There were three steps in carrying out this analysis, which are discussed in the subsequent sections.
3.3.1. Step I: Data Collection through Survey
In this step, a survey was conducted with 15 design experts and 25 design practitioners where they had to rate the seven attributes on the concept of importance for each of these attributes on a 5-point Likert scale of 1 to 5, 1 being the least important attribute and 5 being the most important attribute.
Table 3 and
Table 4 represents the expert and end-user responses.
3.3.2. Step II: Calculating Relative Importance Index (RII)
The data received by both set of respondents were then analyzed with the help of a descriptive statistical tool RII in order to determine the relative importance of each of these factors or attributes corresponding to a frugal innovation.
Mathematically, the Relative Importance Index is evaluated as follows:
where
RII = Relative Importance Index
Wi = Weights provided by ith respondent to each factor, ranging from i = 1 to 5
ni = Total number of responses in each response category of the Likert scale
A = Highest weight in the Likert scale (i.e., “5”)
N = Total number of respondents
Based on the responses from the design experts and the design practitioners, the RII evaluation for each of the factors from both sets of respondents is represented in
Table 5.
3.3.3. Step III: Calculating Mean RII
To determine the contribution of each of these factors towards frugal innovation based on its importance, mean RII was calculated [
28] from the RII values obtained from
Table 5.
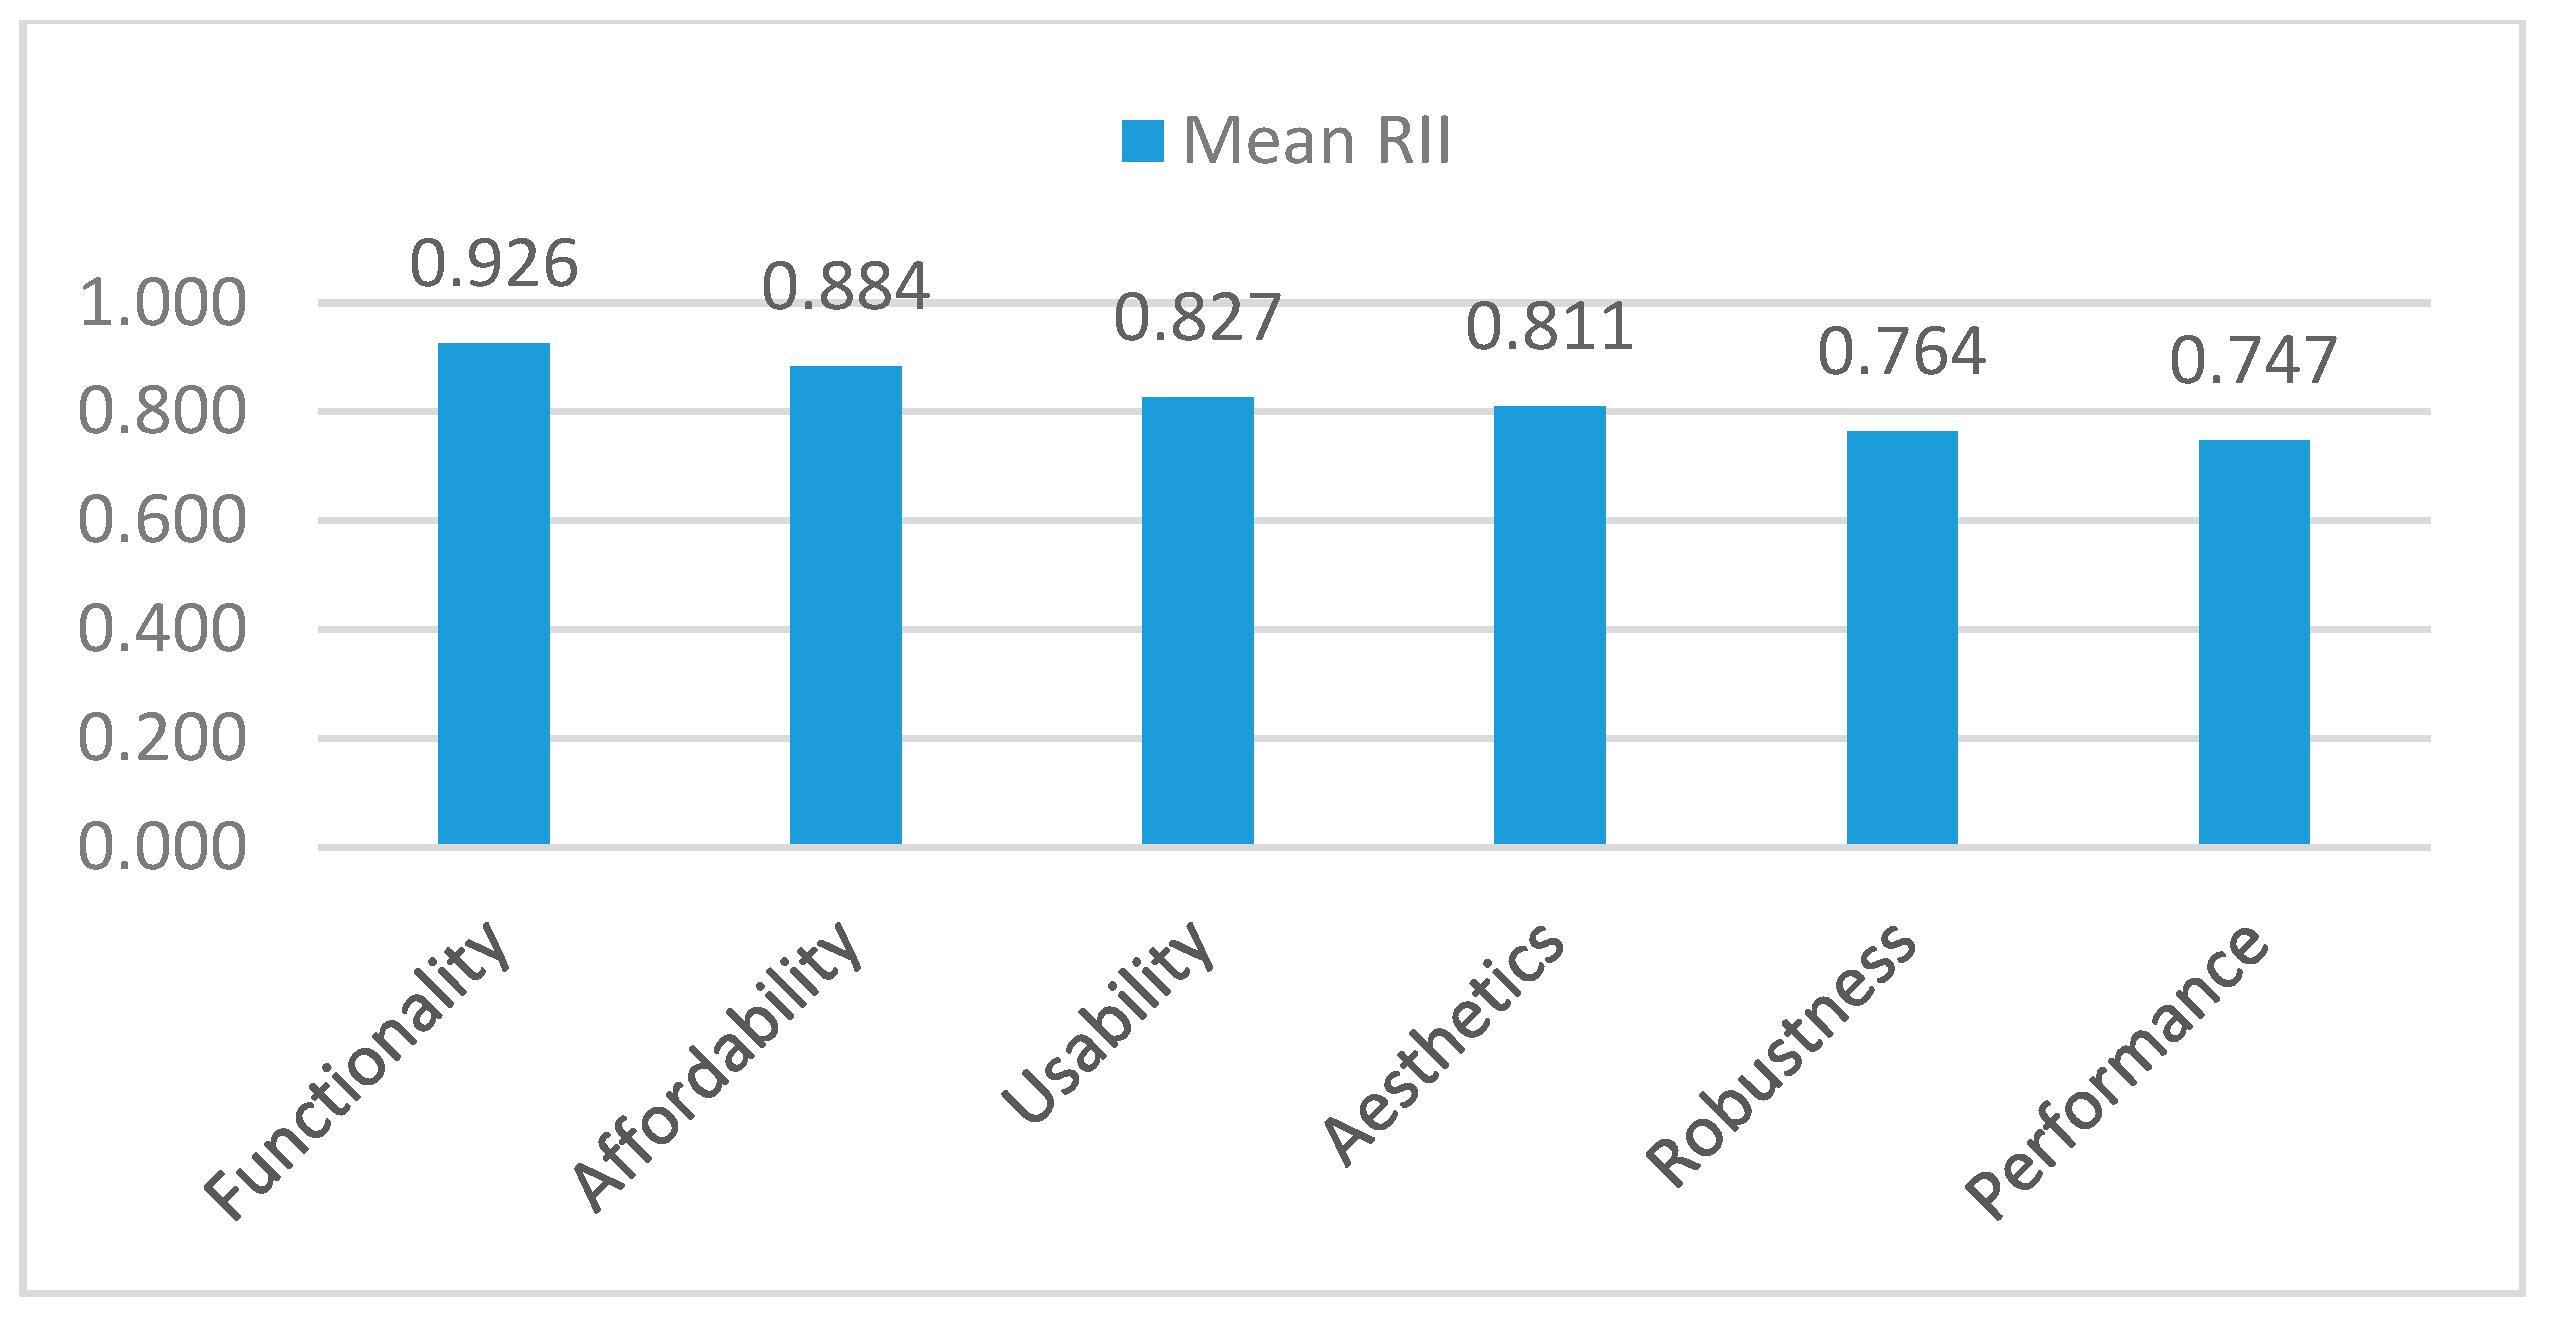
Figure 4 illustrates the mean RII for each of these factors, and they are further categorized as most essential, essential, desirable, and neutral (refer
Table 6 and
Table 7).
The importance of each of these factors was observed and recorded in
Table 7, concluding that functionality, affordability, usability, and aesthetics are the most essential attributes. Robustness and performance represented essential attributes of frugal innovation. Attributes such as accessibility, falling under desirable attributes, will enhance the overall experience within the diverse population.


