Article

A Product Development Approach Advisor for Navigating Common Design Methods, Processes, and Environments

1
School of Systems & Enterprises, Stevens Institute of Technology, Hoboken, NJ 07030, USA
2
Schaefer School of Engineering & Science, Stevens Institute of Technology, Hoboken, NJ 07030, USA
3
Faculty of Industrial Design Engineering, Delft University of Technology (TU Delft), 2628 CE Delft, The Netherlands
*
Author to whom correspondence should be addressed.
Submission received: 6 January 2020 / Revised: 6 February 2020 / Accepted: 6 February 2020 / Published: 14 February 2020

Abstract

:
Many different product development approaches are taught and used in engineering and management disciplines. These formalized design methods, processes, and environments differ in the types of projects for which they are relevant, the project components they include, and the support they provide users. This paper details a review of sixteen well-established product development approaches, the development of a decision support system to help designers and managers navigate these approaches, and the administration of a survey to gather subjective assessments and feedback from design experts. The included approaches—design thinking, systems thinking, total quality management, agile development, waterfall process, engineering design, spiral model, vee model, axiomatic design, value-driven design, decision-based design, lean manufacturing, six sigma, theory of constraints, scrum, and extreme programming—are categorized based on six criteria: complexity, guidance, phase, hardware or software applicability, values, and users. A decision support system referred to as the Product Development Approach Advisor (PD Advisor) is developed to aid designers in navigating these approaches and selecting an appropriate approach based on specific project needs. Next, a survey is conducted with design experts to gather feedback on the support system and the categorization of approaches and criteria. The survey results are compared to the original classification of approaches by the authors to validate and provide feedback on the PD Advisor. The findings highlight the value and limitations of the PD Advisor for product development practice and education, as well as the opportunities for future work.

1. Introduction

1.1. Purpose

This study explores different product development approaches used in engineering disciplines to support current and future designers in navigating the many formalized environments, processes, and methods for design. The paper begins with a review of common design approaches, identifies distinguishing characteristics and categorizes some of the most well-established approaches, and generates and validates a decision support tool to further aid product developers in their work.

1.2. Scope

Previous studies have reviewed different product development approaches, but they typically focus on methodologies tailored to specific disciplines. Some review papers focus on general design or “engineering design” models, including the work of Evbuomwan et al. [1], Gericke and Blessing [2], and Chakrabarti and Blessing [3]. Some more comprehensive reviews of more specific design methods and tools include those of Camburn et al. [4], Foo et al. [5], and the Design Exchange [6], which focus on design approaches across each stage of the design process. More specialized to the software engineering discipline, Munassar and Govardhan [7], Bhuvaneswari and Prabaharan [8], and Arora and Arora [9] conducted reviews that focus on Software Development Life Cycle approaches. Although these reviews each include large numbers of diverse design approaches, the design research community would benefit from a consistent source of information and a clear way to distinguish multi-disciplinary product development approaches to aid novice designers in choosing the most appropriate approaches.
The present study applies the categorization scheme of Estefan [10], who classifies systems engineering methodologies into environments, processes, methods, and tools. Environments are high-level approaches or project management paradigms that seek to create and promote a particular value or culture of design; processes are step-by-step guides that steer designers through the major phases of product development; methods are specific ways to map or analyze the design process across multiple phases; and tools typically focus on providing detailed approaches for achieving specific needs within a single phase of a design process. In contrast to the previous efforts to organize or classify design approaches that have a strong focus on a particular discipline or detailed tools, this paper focuses on the more strategic approaches classified as environments, processes, and methods. The rationale for this decision is that tools are largely interchangeable approaches that apply to individual stages of design, and previous reviews have resulted in excellent resources to guide designers through these specific techniques (e.g., [6,11]). The impact of a product development environment, process, or method on the design outcome is substantial and justifies a preliminary investment in choosing the most appropriate approach.
This study begins with a review of these higher-level product development approaches, identifying their strengths and distinguishing characteristics, and then implements the findings into a decision support tool, the Product Development Approach Advisor (PD Advisor), that can help users select the most appropriate design method for a given design project. This is followed by a survey of design experts to gather their subjective views of the approach classification and the PD Advisor itself. Findings from the survey are used to highlight the value and limitations of the PD Advisor for design practice and education, as well as to identify opportunities for future work.

1.3. Overview

This study consists of three main components, detailed in the following sections: a literature review and synthesis of product development approaches, the development of the PD Advisor, and the development and distribution of a survey to gather feedback on the classification system, interface, and value of the PD Advisor.

2. Background

2.1. Design Approaches

Through a literature review of existing approaches to product development, the research team identified 16 well-established product development environments, processes, and methods that stem from at least four different engineering disciplines. The 16 approaches are listed in Table 1 and described briefly in the following sub-sections, and each has been assigned a 2- to 3-character abbreviation for brevity in later sections.

2.1.1. Environments

Design thinking (DT) is a problem-solving environment that was developed primarily by Stanford University’s d.school and IDEO during the early 1990s in an effort to highlight the human element that is present within design [12]. The general DT approach decomposes the design process into three high-level phases: inspiration, ideation, and implementation. Furthermore, design thinking suggests that the thought process that occurs during a design process is split between “divergent” and “convergent” thinking during concept generation and selection, and “analysis” and “synthesis” during human pattern recognition. This environment adds value by incorporating an emotional element to design, and thus intends to generate products that are more in touch with user needs and less wasteful.
Systems thinking (ST) guides designers and other decision-makers to view elements of a product or component, as well as the environment in which the product functions, as an interrelated set that must work together to achieve a common purpose [13]. According to Aronson, this big picture viewpoint helps “avoid unintended consequences from ineffective coordination among elements” [13]. Unlike processes or methods, ST on its own does not prescribe a specific set of steps, but a suite of applied ST methods have been developed to provide more guidance, including system dynamics [14,15], soft systems methodology [16], and critical systems thinking [17].
Total quality management (TQM) is a management environment, originally developed with the intent of helping the United States to match the high quality of Japanese manufacturing [18]. This approach focuses on constantly improving the ways design processes and manufacturing plans are managed, and it has been expanded into more detailed methods such as six sigma and lean manufacturing.
Agile development (AD) is an environment originally implemented for software development, which focuses on completing tasks in parallel and adapting to changing requirements through iteration [9]. Agile promotes flexibility through integrated testing during development phases. Agile values “individuals and interactions over processes and tools, working software over comprehensive documentation, customer collaboration over contract negotiation, and responding to change over following a plan” [19]. Other approaches, such as scrum and extreme programming (see “Methods”), stem from the agile ideology and specify unique constraints or tasks that should be performed.

2.1.2. Processes

The waterfall process (WP) prescribes a step-by-step approach to product development, beginning with established requirements and continuing to design, testing, and maintenance [8]. Each phase is completed sequentially, and the phases are not explicitly revisited. The waterfall process in its most basic form lacks iteration, which increases simplicity and can decrease project time, but it is not adaptable to changing requirements and can lead to the late identification of risks [7].
The engineering design (ED) process is a commonly taught process that can vary in form and complexity across disciplines [20]. Through its different variations, ED provides an iterative process by which many engineering problems can be solved. Engineering design can vary from three steps (e.g., design, build, and test) to eight or more steps (e.g., identify need, research problem, generate alternatives, select a solution, construct a prototype, test and evaluate, communicate, and redesign) [21]. Engineering design focuses on iteration through all of the different phases [22].
The spiral (Sp) model focuses on iterations with an emphasis on risk management. During design, a project will pass repeatedly through stages of planning, risk analysis, engineering, and evaluation in different spiral loops [8]. This model is most commonly used in the systems and software engineering domains. The spiral model promotes early production of prototypes and is suitable for mission critical projects, but it can be costly and inappropriate for smaller projects [7].
The vee model (VM) from systems engineering depicts two streams: the “decomposition and definition” stream and “integration and verification” stream [23]. The former stream involves the elicitation of stakeholder needs, setting system requirements, and decomposing the system to subsystems and components with their requirements. The latter stream involves building and testing components, subsystems, and the system, and verifying and validating the requirements from the former stream. This referencing process considers the aspect of iterations that many other approaches involve, allowing repetition and revision if requirements are not met.

2.1.3. Methods

Axiomatic (Ax) design is a method that “connects functional requirements with design parameters and user needs” [24]. Its two major axioms are to (1) maintain independence among functional requirements and (2) minimize the information content or risk of a design. Axiomatic design implements these design axioms across four main design domains: customer, functional, physical, and process [25]. Matrix operations are used in axiomatic design to transfer between customer needs and functional requirements, and the calculations can be used to remove unnecessary design considerations in complex problems.
Value-driven design (VDD) is a method created by the American Institute of Aeronautics and Astronautics (AIAA) to focus on optimizing a component or system specifically to achieve value for stakeholders [26]. A single mathematical function representing this value is often used to consider the objectives of a system, and design activities are then undertaken to improve on that objective function. The formalization of VDD focuses entirely on this value function, and it can lead to overlooking certain performance requirements [27].
Decision-based design (DBD) incorporates the human aspect of decision making to the design process. The approach, introduced by Hazelrigg [28], focuses on the importance of corporate values and customer preferences in design decision-making, along with engineering and economic modeling. Profit is generally seen as the driving process of any design project, and thus DBD considers how each design or management decision impacts total profit or other corporate value functions [28].
Lean manufacturing (LM) aims to eliminate waste within each step of the design process, leading to higher overall efficiency [9]. Lean manufacturing encourages designers to evaluate each part of the manufacturing process based on value and subsequently alter their process [29]. Six sigma (6S) is a similar manufacturing design method that aims to optimize quality of the manufacturing process. According to Harry [30], the main emphasis of six sigma is “reducing variability present within a manufacturing process,” and it implements a DMAIC (Define, Measure, Analyze, Improve, Control) problem-solving approach. Six sigma and lean manufacturing are both best used with well-defined processes.
Theory of constraints (ToC) is a TQM-oriented design method that focuses on management and the identification of a single limiting factor in the design process [31]. After the limiting factor is identified, ToC follows a specified process to improve or eliminate the constraint in each step [32]. This iterative approach can be applied as new constraints are revealed throughout a process.
Scrum (Sc) is a software development life cycle method that follows agile principles. Scrum focuses on managing product development through incremental product deliveries [33]. Development is broken down into iterative “sprints” that focus on taking a small group of tasks from definition to potentially deliverable product in a short period of time [8]. Scrum sets managerial practices that enhance efficiency rather than specific technical practices.
Extreme programming (XP) similarly focuses on the delivery of small increments of functionality and follows agile principles [7]. However, XP extends agile principles by prescribing technical practices. Such practices include, but are not limited to: continuous code improvement, user involvement, task prioritization, and test driven development [7]. The implementation of specific practices classifies extreme programming as a design method, since it helps designers determine how they will perform design tasks. XP also allows for flexibility and changing design requirements [34].

2.2. Reviews of Design Approaches

Previous design approach review papers and books have explored engineering-oriented design approaches, with some notable works detailed in Table 2. These resources discuss a wide variety of different approaches, as well as potential schemes for categorization. Many of these reviews include design tools, which generally can be used to provide detailed support within the higher-level approaches discussed in the previous sub-section. The variety presented among the different reviews demonstrates a need for a more consistent way to characterize and select design approaches.
In the software engineering field, existing studies have reviewed different models specifically related to the Software Development Life Cycle (SDLC), with some described in Table 3. Software process models prescribe tasks or activities that are used within different steps during the development of software; however, it should be noted that many, if not all, of these approaches have been adopted by the engineering design community for non-software-specific projects. These reviews compare the different software models and point out the advantages and disadvantages of each. The re-occurrence of certain models among different reviews confirmed their importance in this study.
Surveys have also been conducted to better understand how design is implemented by practitioners, and two such studies are listed in Table 4. These studies and their results helped guide the survey design of the present study. When examining design practice, Yang [37] asked respondents to answer questions with reference to their latest design project. In contrast, the present study seeks a full-range view of the design process, and it also attempts to understand why designers approach things the way they do, including more open-ended questions similar to Vredenburg et al. [38]. In the cases of the reviewed papers and this paper, all results are dependent on self reporting of the respondent.

3. Methods

After reviewing the literature on specific design approaches as well as previous reviews, key criteria were identified and distilled to categorize the 16 selected approaches. Through multiple iterations and discussions among the research team and with outside experts, the list of criteria converged to six factors that differentiate the approaches from one another. These criteria are detailed in Table 5. For each criterion, an appropriate scale was developed so that each approach could be categorized or rated by designers and experts. The authors then categorized each approach, based on the literature as well as their own experiences, to match the approaches of Table 1 with the criteria of Table 5. This classification is provided in Table 6, and it is illustrated graphically in Figure 1.

3.1. Development of Decision Support System

The approaches and criteria were then implemented into a decision support tool, the PD Advisor, to aid designers in selecting an appropriate approach based on their specific product development problem needs. A user interface was developed using the R Shiny platform to query users, perform calculations, and interactively produce an output recommendation based on the user inputs. The PD Advisor is shown in Figure 2 and can be accessed online (see Appendix B).
To begin, each criterion was formulated into a question to the users on the left side of the interface. A final six-part question asks users to rate the relative importance of each criterion, using slider inputs for each criterion. To generate a recommended approach, the tool compares the user input values for each criterion to the approach values in Table 6, and it calculates the nearness for each approach. For each criterion, each approach’s value is subtracted from the user input value, and then the absolute value is normalized based on the number of scale points. This, using the ratings from the 6-part slider question, results in a weighted correlation value, and the approach with the maximum correlation value is presented as the best match on the top-right of the interface.
As the user changes the inputs on the left side of the screen, the graph on the right side plots the characteristics of the user’s project (marked by a yellow star) using the same graphical parameters as the 16 approaches. This allows the user to inspect their recommendation based on individual criteria and compare it across multiple approaches. The user can click on the recommendation and the approach names in the legend for more information and references on the approaches.

3.2. Survey of Design Experts

After developing a prototype of the PD Advisor, a survey was designed and distributed to gather expert input on the PD Advisor as well as the categorization of the approaches. The survey was piloted by two design experts—one practitioner and one academic researcher—and then updated and distributed through email invitations and message boards to approximately 150 design practitioners and academics within the authors’ networks. The survey was approved by the Stevens Institutional Review Board (IRB) under protocol 2019-005(N), and it was administered online through Qualtrics [39].
The survey consisted of four sections to address different aspects of design approaches and the PD Advisor. The first section (detailed in Table A1) examined the respondent’s design experience, with questions regarding the environment (academic vs. industry), number of years, and educational discipline related to their design experience. The second section (Table A2) introduced the PD Advisor with a short video (77 s, see Appendix B) and asked for the respondent’s opinion on the tool and its value. Questions were posed regarding how useful the tool would be in the respondents’ work, if they believed it would be useful to others, and what characteristics would make the tool more useful. The third section (Table A3) examined the 16 selected design approaches and the six identified criteria. Respondents were asked to evaluate the approaches with which they were most familiar for each of the six criteria: complexity, guidance, phases, hard/soft, values, and users. These questions were intended to provide evidence to support or update the authors’ selection and classification of approaches in Table 6.
The final section of the survey (detailed in Table A4) evaluated the way the respondents approach product development problems in their work. Respondents were asked if they use a combination of approaches, and if so, which ones. Respondents were then asked about why they approach design the way they do, and they were presented with a list of options that included following company/industry standards, following recommendations of managers, researching problems uniquely, and approaching design the way that was learned in school. The next questions asked the respondents to rate how pleased they are with the ways that they practice design, and, if they expressed room for improvement, what they would want to change about the ways that they practice design. These questions were intended to correlate satisfaction with existing design approaches and the respondent’s likelihood to value or recommend the PD Advisor. The full compilation of survey questions is provided in the Appendix.

4. Survey Results

Complete responses were received from 15 individuals (10 percent response rate). In addition, 24 more respondents started the survey but did not complete it;however, none of the incomplete respondents answered any questions beyond the design approach familiarity question (first row of Table A3), so they were not considered in the results and discussion. Results corresponding with the four parts of the survey are presented in the following subsections.

4.1. Respondent Experience and Background

Table 7 presents the type of work experience, job role, years of experience, and educational background of the respondents. The respondent pool exhibited a relatively even distribution of academic and industrial experience. Of the 15 respondents, seven selected both academic and industrial experience with design. The most common category of job role is “Professor,” which includes variants such as Assistant and Associate Professors. For confidentiality reasons, the question asking for job role was optional, with ten respondents answering, and one citing multiple jobs. Other job roles include Chief Procurement Officer (CPO), Director of Design Education, and Design Engineer. All but one respondent reported having 5–15 years or 15+ years of experience with design. The level of experience and job roles shows that the survey respondents are generally experienced with design, and they represent a meaningful range of positions and experience for the purposes of this survey. The educational backgrounds of the respondents mainly consist of engineering and design disciplines, with one respondent having a management background. This question allowed for respondents to select multiple options, totaling 26 selections. The most prominent educational background of respondents is mechanical engineering, with 11 selections, followed by design with seven selections. Systems engineering was cited twice, and several other disciplinary options were selected once each.

4.2. Introduction to PD Advisor

After the PD Advisor was introduced through a short video, the respondents provided feedback on the tool. Figure 3 shows how the respondents reported their likelihood of using the tool. The most prominent response is that users “might or might not be willing to use the web tool to guide their design process.” Only one respondent cited they would definitely not be willing to use the tool, while two respondents cited they would definitely be willing. The respondents with purely industrial experience were less willing to use the tool than those with academic experience. To separate personal preference of the respondents from the usefulness of the tool, Figure 4 also shows the responses to the question: “How useful would a design decision support tool be in your work?” Compared with the previous question, this did not provide a middle option representing neutrality on the topic. Just over half of responses expect the tool to be extremely or moderately useful. The three responses that say the tool was “not useful” all responded to the previous question with “probably not” or “definitely not” using the tool. Ideally, the usefulness of the tool would be tracked to the job role or educational background of respondents, but no significant correlation could be found due to the small sample size and uneven distributions of jobs and backgrounds. Among the professors, extreme, moderate, and slight usefulness were all cited. A wide range of responses was found between those with mechanical engineering and design backgrounds, resulting in an inconclusive correlation analysis.
Respondents provided open-ended recommendations regarding who else may find the tool useful. In these responses, project managers were mentioned five times. Junior or new project managers and junior or new design engineers were each mentioned three times. Students were also mentioned three times, startups once, and researchers once. These responses suggest that the tool could be most useful to those who are less familiar with design, or those who need more exposure to other areas of design. Respondents then suggested ways that the tool could be made more useful. Adding explanations of approaches to the tool was the most common response, mentioned four times. Showing data, methods, assumptions and uncertainty was mentioned three times. Including examples of projects and risk management were each mentioned once.

4.3. Approach Categorization

The third section of the survey asked questions related to the categorization of approaches. This section was intended to validate and improve the authors’ classification system in the PD Advisor. The first question asked respondents to select the approaches with which they were familiar, from the list of 16 from Table 1. Respondents were recommended to select no more than six approaches, to maintain a reasonable survey completion time. The questions that followed retained the respondents’ selections, so that they only were asked to classify those familiar approaches. The number of respondents that selected each approach is provided in Table 8. TQM, Ax, and XP were not selected by any respondents, and therefore they are not included in the following results. Comparing the selected approaches to the backgrounds of the respondents, all 11 respondents trained in mechanical engineering were familiar with engineering design and design thinking. All six respondents with backgrounds in design were familiar with design thinking, and five of them were familiar with engineering design.
Figure 5 presents the perceived complexity of the problems each approach is designed to accommodate. It is important to consider that each approach was selected by a different number of respondents, impacting the statistical significance of the results. ST has the largest average problem complexity, with a value of 9.4 out of 10. DT and DBD show a large range of responses, with a minimum value of 2 and maximum of 10, and a standard deviation greater than 2. Most respondents did not rate any approaches lower than 4, indicating that the scale or examples should perhaps be shifted toward higher complexity.
Figure 6 depicts the level of guidance that each approach provides. All of the approaches shown have a perceived level of average guidance of four of greater, which represents a medium level of structure to highly structured. The respondent averages show that the highest guidance is offered by DBD, ToC, VM, and 6S, most of which are classified as methods, whereas minimally structured guidance is offered by DT, Sp, VDD, and ST, most of which are classified as environments and processes. This raises a valuable question about the authors’ initial classification of VDD as a method, as it could reasonably be classified as a framework and environment.
The design phases covered by each approach according to the respondents are shown in Figure 7. This figure shows the design phases numerically, which correspond to the levels presented in Table 5. Most approaches have responses that span the full range from problem identification to supply chain and logistics. The responses indicate that 6S and Sc tend toward the later design phases while Sp and DT tend toward beginning phases. In stark contrast to the authors’ initial ratings, LM and ToC are perceived by many of the survey respondents to offer support in earlier design phases.
The values associated with each approach are shown in Figure 8. These numeric values depict the total number of selections associated with each value, where multiple values could be selected for each approach. ED had the highest number of selections due to the highest number of respondents reporting familiarity. Risk management is an important value to many approaches including ED, ST, VM, WP, SP, and ToC, and was selected for all approaches. AD, DT, Sc, and WP were most associated with deployment time. Cost reduction was the most common value selected for LM, 6S, VDD, and a close second for ED. Finally, DBD and close second for DT had the highest associations with market viability. These results showed that nearly every approach is associated with some combination of these values.
Figure 9 shows the distribution of responses categorizing approaches as appropriate to hardware or software projects and components. While originally ranked on a five-point scale in the PD Advisor logic, the classification is normalized to match the survey results on a ten point scale, allowing for greater differentiation in values. DBD, LM, 6s, and ToC are the most consistently rated on the hardware end of the spectrum. AD, Sc, and Sp are higher on the software end of the spectrum and have the highest average values. Most other approaches fall in between hardware and software, with averages between four and six. WP spans the largest range, with a minimum value of two designating it is better suited to hardware projects, and a maximum value of ten representing it is better suited to software projects; this may be due to its origins in software engineering but its common practice and teaching in hardware-related fields.
Figure 10 similarly depicts the classification of whether each approach is geared more toward managers or designers. The approaches in the PD Advisor logic were categorized by the authors using a rank ordering with values from 1 to 16. However, the survey used different rating options that matched the 1 to 9 scale that users would be able to select in the PD Advisor tool. For the comparison of results, the authors’ ranking of approaches was normalized to the 1–9 scale. The survey results showed a substantial disagreement with the authors’ classification, where the survey respondents rated DBD, ToC, AD, and Sc much higher on the designer side than the authors ranked them. The survey respondents also ranked WP and VDD much closer to the manager side than the authors. However, many of these results showed a high level of variation in survey respondent ratings. This shows a lack of consensus among experts regarding whether these approaches are geared toward managers or designers, indicating that most of these approaches are quite versatile and open to use by either role.
Lastly, respondents were asked to rate the relative importance of the criteria when selecting an appropriate approach to use. Figure 11 shows the range of responses to this question. Relevant problem complexity has the highest average importance, with a value of 7.4, while hardware vs. software has the lowest average with a value of 4.8. Most of the approaches spanned a large range of values across responses, represented by the error bar, with some spanning the complete possible range of one through ten. This demonstrates that the relative importance of criteria is different to each user employing a design approach, and is potentially dependent on personal preference and project needs.

4.4. Respondent Approaches to Design

The next set of survey questions were open ended, asking if any of the criteria are overlapping or redundant, any criteria are missing, and any approaches are missing from the included lists. Project values were listed once as not useful and guidance was listed once as nebulous. One respondent said users and values are intertwined while another said project complexity and phase are intertwined. Sustainability, resources for management, and user objectives were listed by different respondents as missing criteria. Various tools and sustainability approaches such as life cycle analysis were mentioned as missing approaches.
When asked whether they combined multiple approaches in their design practice, eleven respondents said that they used multiple approaches in the same project. Table 9 presents the combinations of approaches that respondents cited. LM and DT were the most frequently mentioned in combination with other approaches, while multiple respondents cited using “all” approaches in combination with each other. The responses confirm that combining approaches appears to be a common practice in design.
Table 10 depicts the reasons why respondents approach design the way they do, from a multiple-choice question. Nearly half of the respondents answered that they perform research specific to the given problem to approach it uniquely. Three respondents cited approaching design in the ways that they learned in school, and while not provided as a multiple choice option, two respondents mentioned that they use their own experiences to approach design.
Figure 12 depicts that no respondents reported that they are displeased with the ways that they approach design, and many of them are very pleased. This suggests that existing design approaches generally meet the needs of users, or that some designers are comfortable defining their own design approaches. The respondents who answered this question with a five or lower were asked what they would like to change about the way they approach design. Responses included: handling uncertainty better, handling projects with both hardware and software components, more rigor, more awareness of processes, and better teaching methods. Each of these responses was mentioned only once.
Figure 12 also correlates the level of satisfaction of the respondent with why they approach design the way they do. Based on the data, those who do research specific to the given problem appear to be slightly less satisfied with the design process. This low average value may be due to the larger number of responses in this category, but it also has the lowest minimum value within the reasons that received responses. It may also be that some designers choose methods specific to given problems because they are dissatisfied with any particular approach as a general way to do design.
Figure 13 and Figure 14 show these same levels of satisfaction broken down by experience in academia and industry, as well as the different educational backgrounds presented. No distinct correlations were found between any background and level of satisfaction or the number of familiar design approaches with level of satisfaction.
The last question of the survey left an area for feedback on the survey or tool. One respondent suggested more rigid classifications of project types. Another respondent mentioned that companies use processes for scheduling, rather than design, and methods are a means, not an end, to design.

5. Discussion

The results from the survey provided valuable feedback and input to support the classification scheme, the PD Advisor, and their further development. First, the findings on how to classify each approach within the six criteria presented can be used to reconsider the original classification in Table 6. Second, the respondents’ reactions to the PD Advisor and their open-ended responses on design practices can support a robust plan for further development of the PD Advisor as well as a dissemination plan for how to introduce it with high impact. This section concludes with a discussion of limitations and future work opportunities.

5.1. Approach Classification

This subsection describes the commonalities and discrepancies between the authors’ initial classifications of the design approaches and those provided by the survey respondents. Many of the discrepancies may be attributable to differences between the origins of the approaches and why they were developed (more closely aligned with the authors’ literature review-based classifications) and the evolution and current practice of these approaches (elicited in the survey responses). This further supports the idea that many of these approaches are cross-compatible and adaptable across disciplines, project types, and user needs.
The authors’ classifications of how approaches fit different levels of project complexity are compared against the survey respondents’ ratings in Figure 5. Both the authors and survey respondents, on average, associate VM with the most complex problems. The authors had classified 6S to be suitable for more complex problems, where it was rated 8 on the scale, than the survey respondents, who rated it among the lowest with a 5.5 average. On the opposite end of the spectrum, the authors rated ED lower, with a 4, than the survey respondents, who rated it among the highest with a 7.4 average.
Figure 6 provides a similar comparison for the level of guidance or structure offered by each approach. DBD is classified as providing more structured guidance in the survey results, which gave it the highest average rating at 8.4, than by the authors, who rated it the second lowest with a value of 3 points on the scale. ToC followed a similar trend and had the second-highest average (8) in the survey, compared to 3 points by the authors. The survey results support the classification of DBD and ToC as design processes, which typically provide a high level of structured guidance to users.
The design phases that each approach addresses are shown in Figure 7, with the plotted points comparing the survey results to the PD Advisor classification. VDD and 6S best match the phases across classification schemes, since both PD Advisor points fall near or within the upper and lower quartile of survey response values. However, VDD and 6S also presented the smallest range of design phases to cover in the PD Advisor. ToC presents unique results, as the first and second quartile fall at a value of two. The maximum value of 11 appears to be an outlier in the survey response data set, but it is more comparable to the late design phase as suggested in the PD Advisor.
The values that each approach represents (time, cost, risk, marketability), correlate well between the PD Advisor and the survey (most commonly mentioned value) for AD, WP, Sp, VM, DBD, LM, 6S and Sc. These matches confirm that the original classification is appropriate. ED, DT, and ST do not match the classification scheme, but each has more than seven responses. This relatively large number of responses may have affected the data by distributing responses across values, rather than reflecting one consistent value. The classification scheme of approaches with their values should be revisited and may include matching a single approach with multiple values.
The focus of each approach on hardware or software development is shown in Figure 9. Sp does not show any quartile boxes or error bars since it was selected by one respondent, and the survey value of five matched the PD Advisor classification value of five. Sc and VDD present the largest range of values with a difference of seven scale points between the minimum and maximum values of one and eight, and two and nine, respectively. This difference shows that these approaches may be able to address both hardware and software related projects and may be better represented by a more moderate value. This observation contrasts the PD Advisor classification of Sc as being purely focused on software. The large differences in responses of hardware and software focus call for a reclassification of approaches in the PD Advisor and present concerns as to whether suitability to hardware and software projects is an appropriate criterion for categorizing design approaches.
The level that each approach is focused on managers or designers is shown in Figure 10 as a clustered bar chart comparing the survey results and PD Advisor. The survey results best match the classification of the PD Advisor for point values of five through nine, representing greater focus on designers. All approaches classified by the authors as less than five were outranked with values greater than five in the survey results. DBD was rated at a point value 4.5 by the authors, and just over 7 points in the survey results. It is possible that this question was ambiguous to the survey respondents, as most of the results fell between managers and designers, showing no clear distinction. The authors also may have been biased in their initial classifications of agile and other methods, as many of these methods originated as software development tools and have only recently been expanding to hardware applications.
The perceived relative importance of the different criteria used to categorize design approaches is shown in Figure 11. The attributes are presented in decreasing order of mean survey results. This information is intended to determine default weightings for the different criteria in the PD Advisor. Respondents ranked all criteria as relatively important, showing that specific distinctions may be based on personal preference. Hardware vs. software presents the largest range of response values, which supports the idea presented earlier that it may not be the most appropriate criterion to use to classify design approaches. However, one respondent mentioned previously in the survey that they wish design approaches were able to cover the different hardware and software components of a single design project. This demonstrates how hardware and software components pose challenges in the design process, so the criteria should be reworked with care.

5.2. Design in Practice

Much of the existing literature reviewing product development approaches, such as those described in Table 2 and Table 3, has sought to categorize methods and tools and help readers distinguish the strengths, weaknesses, and applicability of each. While differentiating the characteristics of methods and tools is valuable and important for designers to understand, the wide breadth and diversity of design-related approaches has made it challenging to do this in a comprehensive and navigable manner. The Design Exchange [6], however, has assembled an impressively comprehensive open-source database of design methods and tools, using filter and search criteria that are well-suited to these more detailed-level approaches. To complement and build on this previous work from a more strategic design perspective, the present study focused on the higher-level product development approaches classified as environments, processes, and general methods. In doing so, this work has resulted in a concise set of distinguishing criteria and a usable decision support system to guide users in selecting these higher-level approaches. Furthermore, the surveyed design experts provided feedback and future directions regarding this new approach to product development approach advising and selection.
Based on respondent feedback from the open-ended survey, the classification scheme and PD Advisor presented in this paper have the potential to add value for designers. While nine of the respondents mentioned they might or might not be willing to use the PD Advisor, four said they definitely would, and 13 said they would find a design decision support tool moderately or extremely useful in their work. Respondents also provided recommendations of who else would find the tool useful; the responses to this question show that the PD Advisor could be a beneficial tool for both academics and practitioners. Based on the recommendations of respondents, the PD Advisor may better benefit students or those new to a profession, with multiple respondents recommending the tool to beginners in a profession. These results indicate potential for the PD Advisor to support higher education, for example through cornerstone or capstone design courses. This would serve to both improve the breadth of design approaches with which students become familiar, and also as they enter the workforce and become early-career professionals, equip them with this knowledge and tool. As 14 of the 15 respondents have at least five years of experience, the responses showing that not all of the respondents would be willing to use, or find the PD Advisor useful themselves, is acceptable, as the demographics of the survey respondents do not best represent the demographics of early career designers and students.
The open-ended survey questions also confirm that the classification system and PD Advisor have included the most significant criteria and approaches. No criteria or approaches that were listed as redundant or missing were mentioned more than once. The lack of common feedback demonstrates that the suggestions may be impacted by respondents’ specific backgrounds and experiences with design, and they are not necessary felt by the general population of designers. On the contrary, the lack of familiarity with certain approaches, such as XP and Ax, suggest that either some of the included design approaches may not fit the scope of the PD Advisor, or that more diverse expert survey respondents are needed in follow-up studies.
Table 9 depicts approaches that were cited by respondents as being used together. No direct pairs were mentioned more than once. However, ST was mentioned twice, once in combination with ToC and once with all approaches. DT was mentioned a total of three times, working with AD, LM, and TQM. Along with DT, LM was mentioned to be used in combination with ED. ST and LM are categorized as design environments, so it is expected that they would be used with other approaches. While LM is categorized as a design process, this can be explained as this study finds it to be more applicable late in the design process, so it may be easily combined with other approaches that focus on earlier design stages. AD and TQM, the other two approaches categorized as environments were also cited in this question. This pattern confirms that environments provide the most generalized approaches that are frequently combined with other approaches.
The results of the survey similarly demonstrate that there are not widely agreed-upon needs in the design community, as most people are satisfied to some extent with the ways that they approach design, but there are areas of improvement people hope to see in design approaches, some of which are addressed by the work of this study.

5.3. Limitations and Future Work

The survey resulted in a relatively small response rate with selections that were more inconsistent than expected. This may be due to the uneven distribution of respondent background and familiarity with different approaches. Eleven out of the 15 respondents have backgrounds in mechanical engineering, with seven in design, compared to only one with a business/management background. Ideally, the distribution of respondent backgrounds would be more uniform to gain a better understanding of design across disciplines. However, due to this overrepresentation of engineering designers, the results are meaningful for understanding the engineering design expert perspective on applying these design approaches.
Within the survey, some approaches were not selected as familiar design practices by any of the 15 respondents. This brings into question the importance or commonality of these approaches, and how they should be included in the classification system. Given the small total number of respondents, TQM, Ax, and XP were not among the most familiar design approaches to any respondents. During the original classification process, XP was considered to follow agile principles, and it therefore may be reclassified as a subset of AD.
It is the intent of the PD Advisor to better address these newly recognized needs and approach classifications by providing a flexible and practical tool to support designers and design project managers. While the findings of this study point out that the design community appears to be generally satisfied, future work is needed to determine whether the current ways of approaching design are effective, aside from being satisfying. One opportunity for future work is to field a larger scale survey with a more diverse group of respondents. This would include academics and practitioners with a wider range of backgrounds, and ideally those who are more familiar with a variety of approaches. Additional work is to update and disseminate the PD Advisor based on feedback and reclassification of approaches. An updated PD Advisor will be aimed towards students and beginning project managers or design engineers. The next iteration of the PD Advisor should also include examples and more detailed explanations of methods and uncertainty in the provided recommendations.

6. Conclusions

This study explores different design approaches used in engineering disciplines and develops and validates a decision support tool to aid designers. Building on previous literature reviews and classification efforts, the authors identified 16 well-established product development approaches and a novel six-criteria classification system to evaluate and categorize these approaches. This classification system was developed into a user-friendly tool, the Product Development Approach Advisor (PD Advisor), and a survey was then conducted to gain feedback on the PD Advisor and the categorization of approaches. The survey reflected that, while there may be some updates needed in the product development approach classifications, the PD Advisor is generally expected to add value to the work of students and novice designers. By focusing on higher-level product development approaches, the resulting classification scheme and PD Advisor contribute to early career designers’ abilities to efficiently navigate and select from a diverse set of design environments, processes, and tools. This study lays the groundwork for future research on design approaches and the development of a meaningful tool to support designers and design education.

Author Contributions

Conceptualization, S.H.; methodology, S.H., S.S., and J.F.; software, J.G., J.V., and S.S.; validation, S.S., S.H., and J.F.; formal analysis, S.S.; investigation, S.S.; resources, J.G, J.V., and S.S.; data curation, S.S.; writing—original draft preparation, S.S. and S.H.; writing—review and editing, J.F.; visualization, S.S.; supervision, S.H.; project administration, S.S., J.G., and J.V. All authors have read and agreed to the published version of the manuscript.
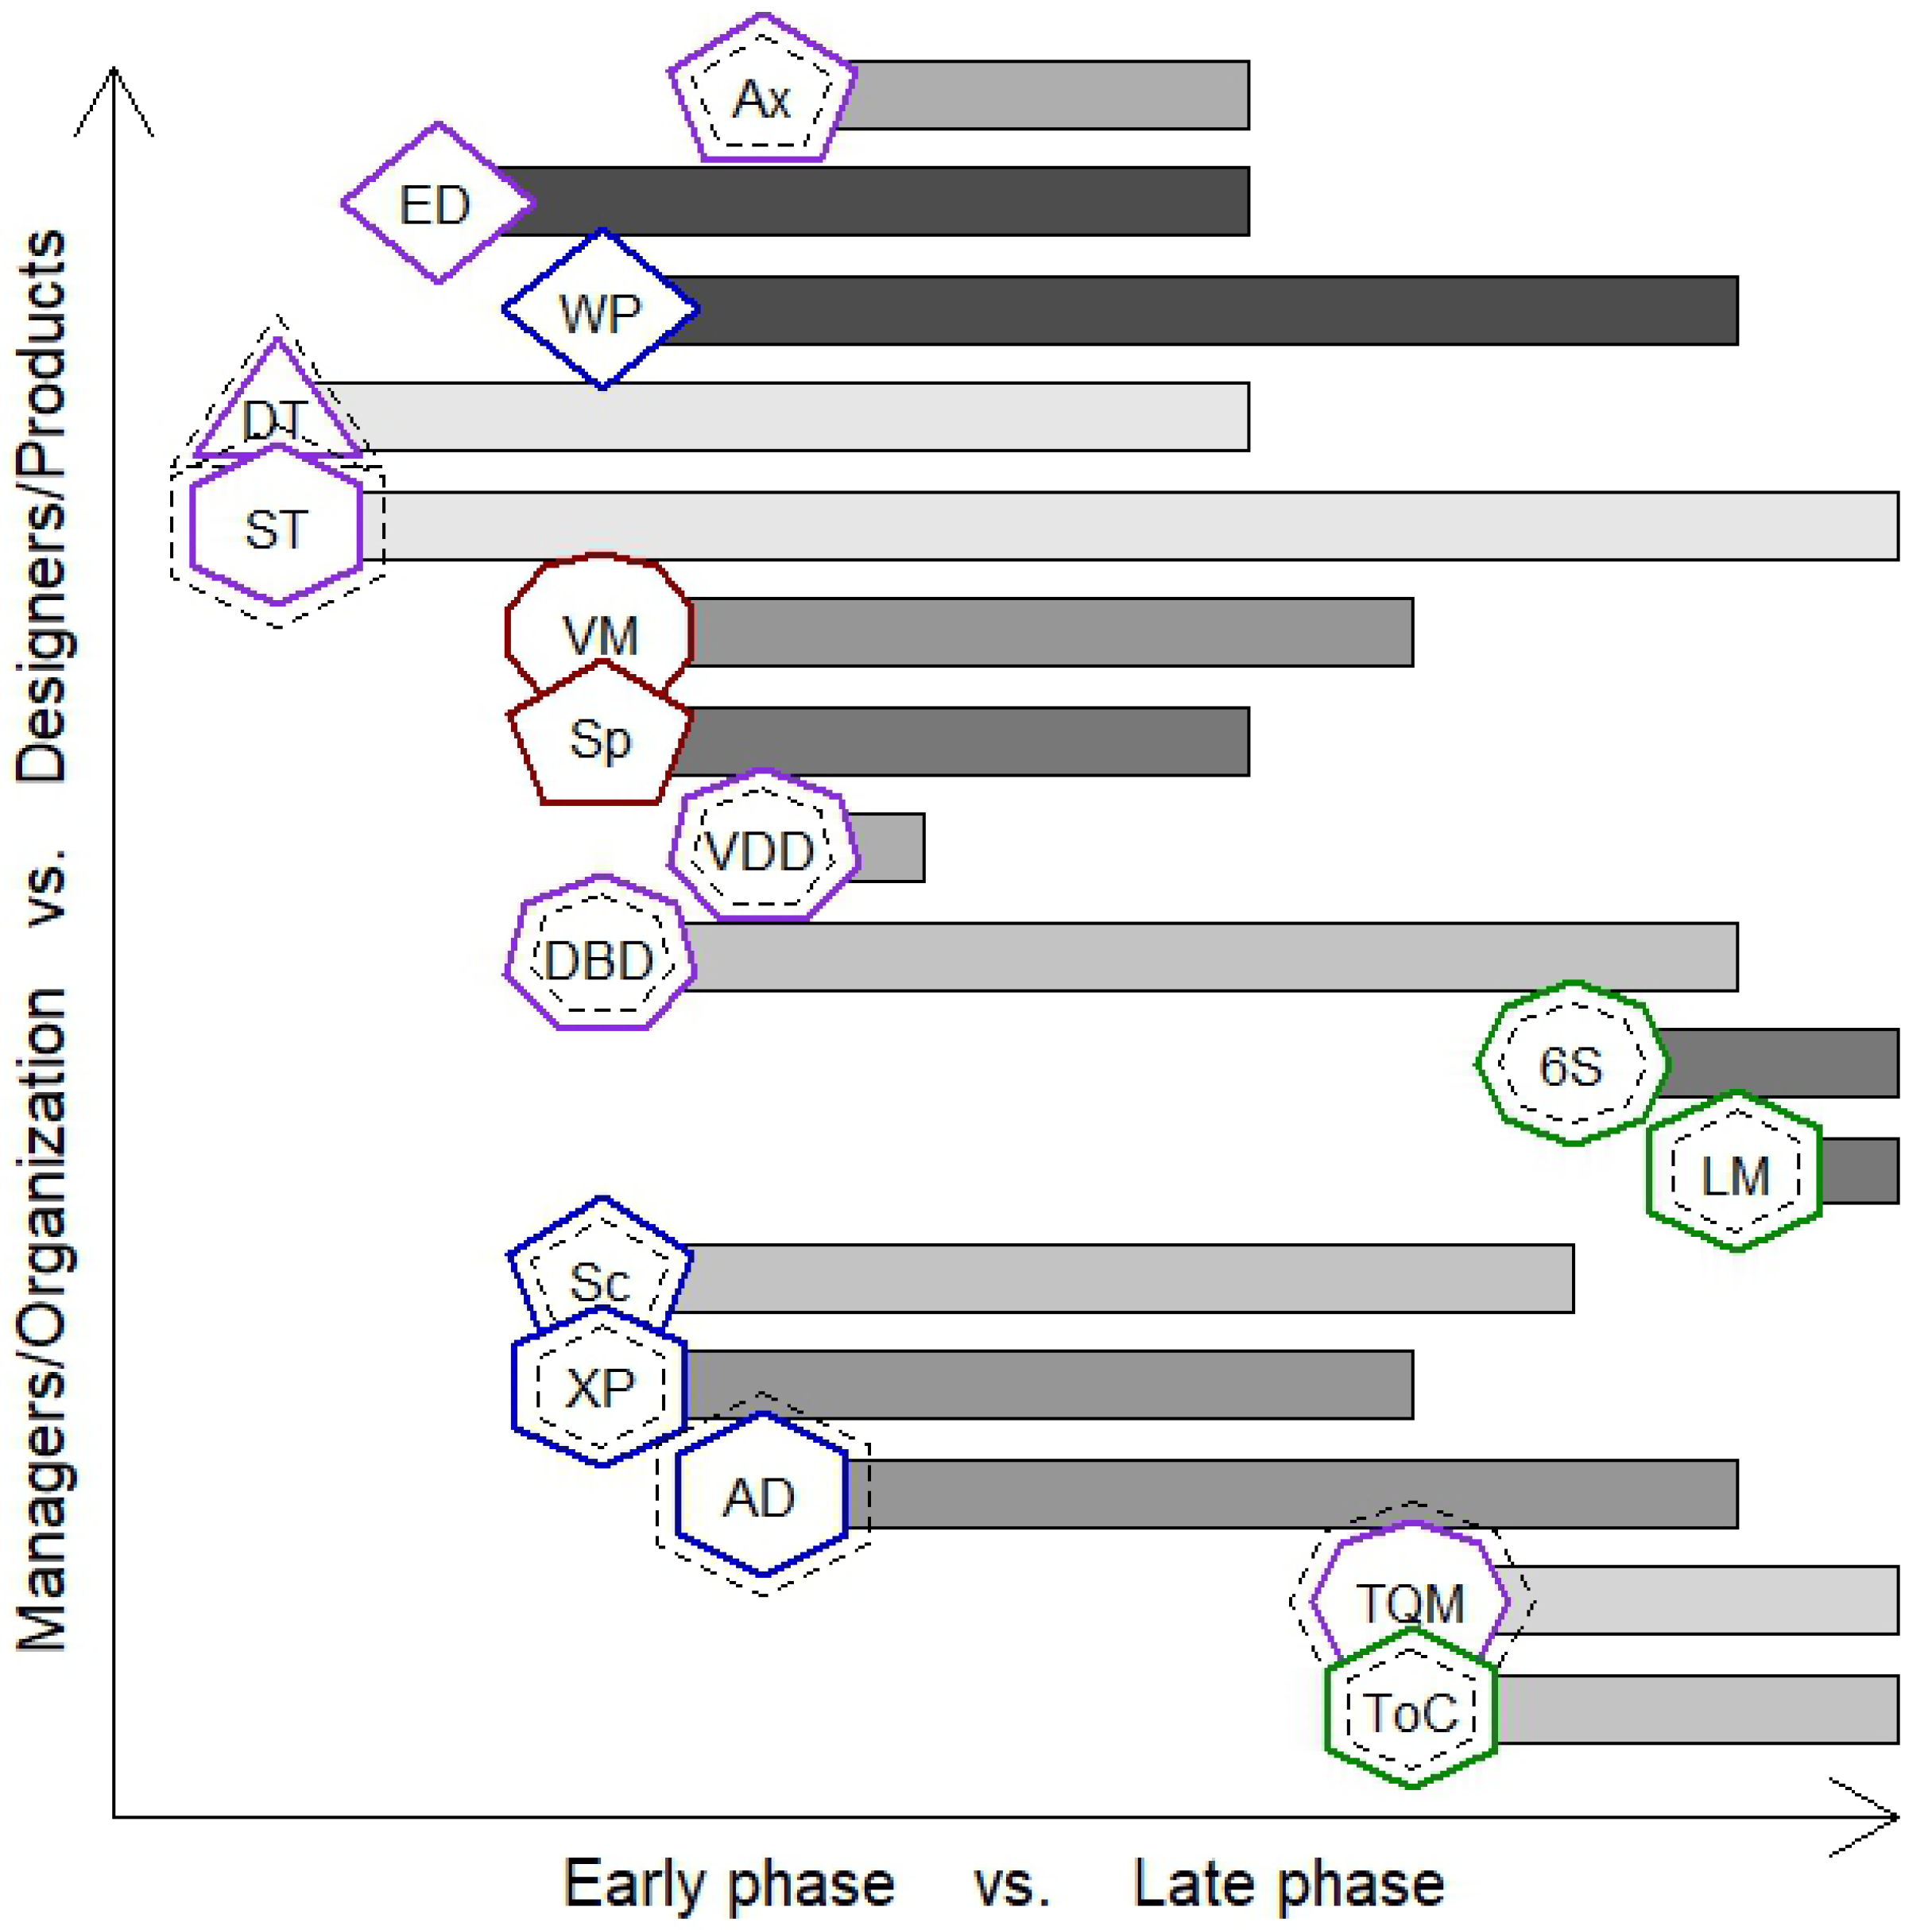
Funding

This research received no external funding.

Conflicts of Interest

The authors declare no conflict of interest.

Abbreviations

The following abbreviations are used in this manuscript:
6SSix Sigma
ADAgile development
AxAxiomatic design
DBDDecision-based design
DTDesign thinking
EDEngineering design
LMLean manufacturing
PD AdvisorProduct Development Approach Advisor
ScScrum
SpSpiral
STSystems thinking
ToCTheory of Constraints
TQMTotal Quality Management
VDDValue-driven design
VMVee model
WPWaterfall process
XPExtreme programming

Appendix A. Survey Questions for Design Experts

Table A1. Questions about design experience.
QuestionResponse
Is your experience with design in an academic environment, an industrial setting, or both?Select multiple:  
  • Academic/education
  • Industrial/practice
  • Other:        
What is your job role? *optional*Open ended
How much post-collegiate experience do you have with design in engineering related disciplines?Multiple choice: 
  • Less than 1 year
  • 1–5 years
  • 5–15 years
  • 15 + years
What disciplines, if any, do you have an educational background (degree, minor) in?Select Multiple:
  • Aerospace engineering
  • Business/management
  • Computer science
  • Software engineering
  • Electrical engineering
  • Design science/interdisciplinary design
  • Engineering management
  • Industrial engineering
  • Mechanical engineering
  • Systems engineering
  • Other, please specify:         
Table A2. Questions about decision support tool.
QuestionResponse
Please watch this video of the Design Methodology Exploration and Selection System: youtu.be/SZV4ixSHdM8. It is intended to help novice designers pick the most suitable design approach to their particular design problem.
Would you be willing to use this web tool to guide your design process?
Multiple choice: 
  • Definitely yes
  • Probably yes
  • Might or might not
  • Probably not
  • Definitely not
How useful would a design decision support tool be in your work?Multiple choice: 
  • Extremely useful
  • Moderately useful
  • Slightly useful
  • Not useful
Who else might find this tool useful? (Please list job roles or design scenarios rather than names)Open ended
What would make this tool more useful?Open ended
Table A3. Questions about design approaches.
QuestionResponseLogic
Which of the following approaches to design are you familiar with? (The questions that follow this one will relate to your selection(s); we recommend selecting no more than 6, unless you feel very confident in your familiarity with more)Select multiple:
  • Engineering design
  • Systems thinking
  • Design thinking
  • Vee model
  • Spiral model
  • Waterfall process
  • Agile development
  • Axiomatic design
  • Value-driven design
  • Decision-based design
  • Total Quality Management
  • Six Sigma
  • Lean manufacturing
  • Theory of Constraints
  • Scrum
  • Extreme Programming
Passes forward list of familiar approaches
Please identify what level of design problem complexity you think the below approaches are best suited toward, where 1 is the simplest (e.g., designing a cup to hold water) and 10 is the most complex (e.g., designing a national transportation system). If you believe the approach is suitable for many different levels of project complexity, please select the middle of those options.Slider (values 1–10):
  • 1: Simple
  • 10: Complex
Only presents familiar approaches
Which design phases are specifically addressed or included by each of the below approaches? (select all that apply)Select multiple:
  • Identify problem
  • Define problem
  • Market research
  • Generate concepts
  • Evaluate alternatives
  • Detailed design
  • Prototyping
  • Verification and validation
  • Manufacturing specification
  • Business planning
  • Supply chain and logistics
Only presents familiar approaches
Please identify how much guidance each approach provides, on a relative scale where 1 is the most loosely structured and 10 is the most structured.Slider (values 1–10):
  • 1: Loosely structured
  • 10: Highly structured
Only presents familiar approaches
Which types of projects do you think each approach is best-suited to?Slider (values 1–10):
  • 1: Hardware only
  • 5–6: Systems with both hardware & software
  • 10: Software only
Only presents familiar approaches
Which project value(s) does each approach focus on?Select multiple:
  • Fast time to deploy
  • Minimizing cost
  • Minimizing risk
  • Marketability and profits
Only presents familiar approaches
Some design approaches focus on supporting team management and organization processes, while others focus more on supporting designers. Please identify where you believe each of the below approaches fits best on a relative scale, where 1 is mainly management focused and 9 is mainly designer focused:Slider (values 1–9):
  • 1: Management
  • 9: Engineering
Only presents familiar approaches
Given the following attributes of a design project, please evaluate the relative importance of each attribute for selecting a suitable design approach, with a higher value indicating higher importance.Slider (values 0–10):
  • 0: Not at all important
  • 10: Most important
Presents 6 sliders, one for each criterion
From the above list, are any of these criteria redundant or overlapping? If so, please explain.Open ended
Are there any key criteria missing from the above list? If so, please explain.Open ended
Are there any approaches missing from the above list? If so, please explain.Open ended
Table A4. Questions about how respondents approach design problems.
QuestionResponseLogic
Do you use any of these approaches in combination with each other?Yes or no
Which approaches do you use in combination with each other? Please explain.Open endedIf yes to previous question
Which of the following most closely reflects why you approach design the way you do?Multiple Choice:
  • I follow company/industry standards for design
  • I follow the recommendations of my managers
  • I do research specific to the given problem to approach it uniquely
  • I approach design the way I learned in school
  • Other:         
Are you pleased with the way you currently approach design?Slider (values 0-6):
  • 0: Very displeased
  • 1: Mostly displeased
  • 2: Somewhat displeased
  • 3: Neither pleased nor displeased
  • 4: Somewhat pleased
  • 5: Mostly pleased
  • 6: Very pleased
What would you like to change about the way you approach design?Open endedIf satisfaction ≤ 5
Do you have any other comments or thoughts on the survey or the tool?Open ended

Appendix B

Website S1: Interactive PD Advisor tool. https://designspacelab.shinyapps.io/designapproaches Video S2: Video tutorial introducing the PD Advisor. youtu.be/SZV4ixSHdM8.

References

  1. Evbuomwan, N.; Sivaloganathan, S.; Jebb, A. A survey of design philosophies, models, methods and systems. Proc. Inst. Mech. Eng. Part B J. Eng. Manuf. 1996, 210, 301–320. [Google Scholar] [CrossRef]
  2. Gericke, K.; Blessing, L. Comparisons of design methodologies and process models across domains: A literature review. In Proceedings of the 18th International Conference on Engineering Design (ICED 11), Copenhagen, Denmark, 15–18 August 2011. [Google Scholar]
  3. Chakrabarti, A.; Blessing, L. A review of theories and models of design. J. Indian Inst. Sci. 2016, 95, 325–340. [Google Scholar]
  4. Camburn, B.A.; Auernhammer, J.M.; Sng, K.H.E.; Mignone, P.J.; Arlitt, R.M.; Perez, K.B.; Huang, Z.; Basnet, S.; Blessing, L.T.; Wood, K.L. Design Innovation: A Study of Integrated Practice. In Proceedings of the ASME 2017 International Design Engineering Technical Conferences and Computers and Information in Engineering Conference, Cleveland, OH, USA, 6–9 August 2017. [Google Scholar]
  5. Foo, D.; Choo, P.K.; Camburn, B.; Wood, K.L. Design Innovation (DI): Design Method Cards. SUTD-MIT IDC 2018. [Google Scholar] [CrossRef]
  6. Agogino, A.; Beckman, S.; Poreh, D.; Yang, M.; Kim, E.; Kramer, J.; Roschuni, C.; Vasudevan, V. Design Methods. Available online: https://www.thedesignexchange.org/design_methods (accessed on 13 May 2019).
  7. Munassar, N.M.A.; Govardhan, A. A comparison between five models of software engineering. Int. J. Comput. Sci. Issues (IJCSI) 2010, 7, 94. [Google Scholar]
  8. Bhuvaneswari, T.; Prabaharan, S. A survey on software development life cycle models. J. Comput. Sci. Inf. Technol. 2013, 2, 263–265. [Google Scholar]
  9. Arora, R.; Arora, N. Analysis of SDLC Models. Int. J. Current Eng. Technol. 2016, 6, 268–272. [Google Scholar]
  10. Estefan, J.A. Survey of model-based systems engineering (MBSE) methodologies. Incose MBSE Focus Group 2007, 25, 1–12. [Google Scholar]
  11. Otto, K.N.; Wood, K.L. Product Design: Techniques in Reverse Engineering and New Product Development; Prentice Hall: Upper Saddle River, NJ, USA, 2001. [Google Scholar]
  12. Brown, T. Change by Design; HarperCollins: New York, NY, USA, 2009. [Google Scholar]
  13. Aronson, D. Overview of Systems Thinking. 1996. Available online: http://www.thinking.net/Systems_Thinking/OverviewSTarticle.pdf (accessed on 13 May 2019).
  14. Forrester, J.W. Industrial dynamics. J. Op. Res. Soc. 1997, 48, 1037–1041. [Google Scholar] [CrossRef]
  15. Meadows, D.H. Thinking in Systems: A Primer; Chelsea Green Publishing Company: White River Junction, VT, USA, 2008. [Google Scholar]
  16. Checkland, P.B. Systems Thinking, Systems Practice; Wiley: Chichester, UK, 1981. [Google Scholar]
  17. Flood, R.L.; Jackson, M.C. Critical systems thinking: Directed readings; Wiley: Chichester, UK, 1991. [Google Scholar]
  18. Porter, L.J.; Parker, A.J. Total quality management—The critical success factors. Total Qual. Manag. 1993, 4, 13–22. [Google Scholar] [CrossRef]
  19. Fowler, M.; Highsmith, J. The agile manifesto. Softw. Dev. 2001, 9, 28–35. [Google Scholar]
  20. Dominick, P.G.; Demel, J.T.; Lawbaugh, W.M.; Freuler, R.J.; Kinzel, G.L.; Fromm, E. Tools and Tactics of Design; John Wiley and Sons: New York, NY, USA, 2001. [Google Scholar]
  21. Massachusetts Department of Education. Massachusetts Science and Technology/Engineering Curriculum Framework; Massachusetts Department of Education: Malden, MA, USA, 2006. [Google Scholar]
  22. Wheelwright, S.C.; Clark, K.B. Accelerating the design-build-test cycle for effective product development. Int. Mark. Rev. 1994, 11, 32–46. [Google Scholar] [CrossRef]
  23. Forsberg, K.; Mooz, H. The relationship of system engineering to the project cycle. In Proceedings of the INCOSE International Symposium, Chattanooga, TN, USA, 20–23 October 1991; Wiley Online Library: Chattanooga, TN, USA, 1991; Volume 1, pp. 57–65. [Google Scholar]
  24. Wynn, D.C.; Clarkson, P.J. Process models in design and development. Res. Eng. Des. 2018, 29, 161–202. [Google Scholar] [CrossRef] [Green Version]
  25. Martin, S.B.; Kar, A.K. Axiomatic Design for the development of enterprise level e-commerce strategies. In Proceedings of the ICAD 2002, Second International Conference on Axiomatic Design, Cambridge, MA, USA, 10–11 June 2002. [Google Scholar]
  26. Collopy, P. Economic-based distributed optimal design. In Proceedings of the AIAA Space 2001 Conference and Exposition, Albuquerque, NM, USA, 28–30 August 2001; p. 4675. [Google Scholar]
  27. Curran, R. Value-Driven Design and Operational Value. In Encyclopedia of Aerospace Engineering; Blockley, R., Wei, S., Eds.; John Wiley & Sons: Hoboken, NJ, USA, 2010. [Google Scholar]
  28. Hazelrigg, G.A. A framework for decision-based engineering design. J. Mech. Des. 1998, 120, 653–658. [Google Scholar] [CrossRef]
  29. Shah, R.; Ward, P.T. Lean manufacturing: Context, practice bundles, and performance. J. Opt. Manag. 2003, 21, 129–149. [Google Scholar] [CrossRef]
  30. Harry, M.J. Six Sigma: A breakthrough strategy for profitability. Qual. Prog. 1998, 31, 60. [Google Scholar]
  31. Pérez, J.L. TOC for world class global supply chain management. Comput. Ind. Eng. 1997, 33, 289–293. [Google Scholar] [CrossRef]
  32. Goldratt, E.M. Theory of Constraints; North River Press: Great Barrington, MA, USA, 1990. [Google Scholar]
  33. Pham, A.; Pham, P.V. Scrum in Action: Agile Software Project Management and Development; Cengage Learning: Boston, MA, USA, 2012. [Google Scholar]
  34. Beck, K. Extreme Programming Explained: Embrace Change; Addison-Wesley Professional: Boston, MA, USA, 2000. [Google Scholar]
  35. Van Boeijen, A.; Daalhuizen, J.; van der Schoor, R.; Zijlstra, J. Delft Design Guide: Design Strategies and Methods; BIS Publishers: Amsterdam, The Netherlands, 2014. [Google Scholar]
  36. Howard, T.J.; Culley, S.J.; Dekoninck, E. Describing the creative design process by the integration of engineering design and cognitive psychology literature. Des. Stud. 2008, 29, 160–180. [Google Scholar] [CrossRef]
  37. Yang, M.C. Design methods, tools, and outcome measures: a survey of practitioners. In Proceedings of the ASME 2007 International Design Engineering Technical Conferences and Computers and Information in Engineering Conference, Las Vegas, NV, USA, 4–7 September 2007; pp. 217–225. [Google Scholar]
  38. Vredenburg, K.; Mao, J.Y.; Smith, P.W.; Carey, T. A survey of user-centered design practice. In Proceedings of the SIGCHI Conference on Human Factors in Computing Systems, Minneapolis, MN, USA, 20–25 April 2002; pp. 471–478. [Google Scholar]
  39. Qualtrics. Qualtrics Online Survey Software. Available online: https://www.qualtrics.com/research-core/survey-software (accessed on 12 May 2018).
Figure 1. Graphical representation of approaches and criteria; phase represented by horizontal position, users by vertical position, complexity by number of polygon sides, guidance by darkness of bar shading, values by color of polygon outline (blue = time, green = cost, red = risk, purple = marketability), category by dashed outline (inner = method, none = process, outer = environment); hard/soft is not depicted.
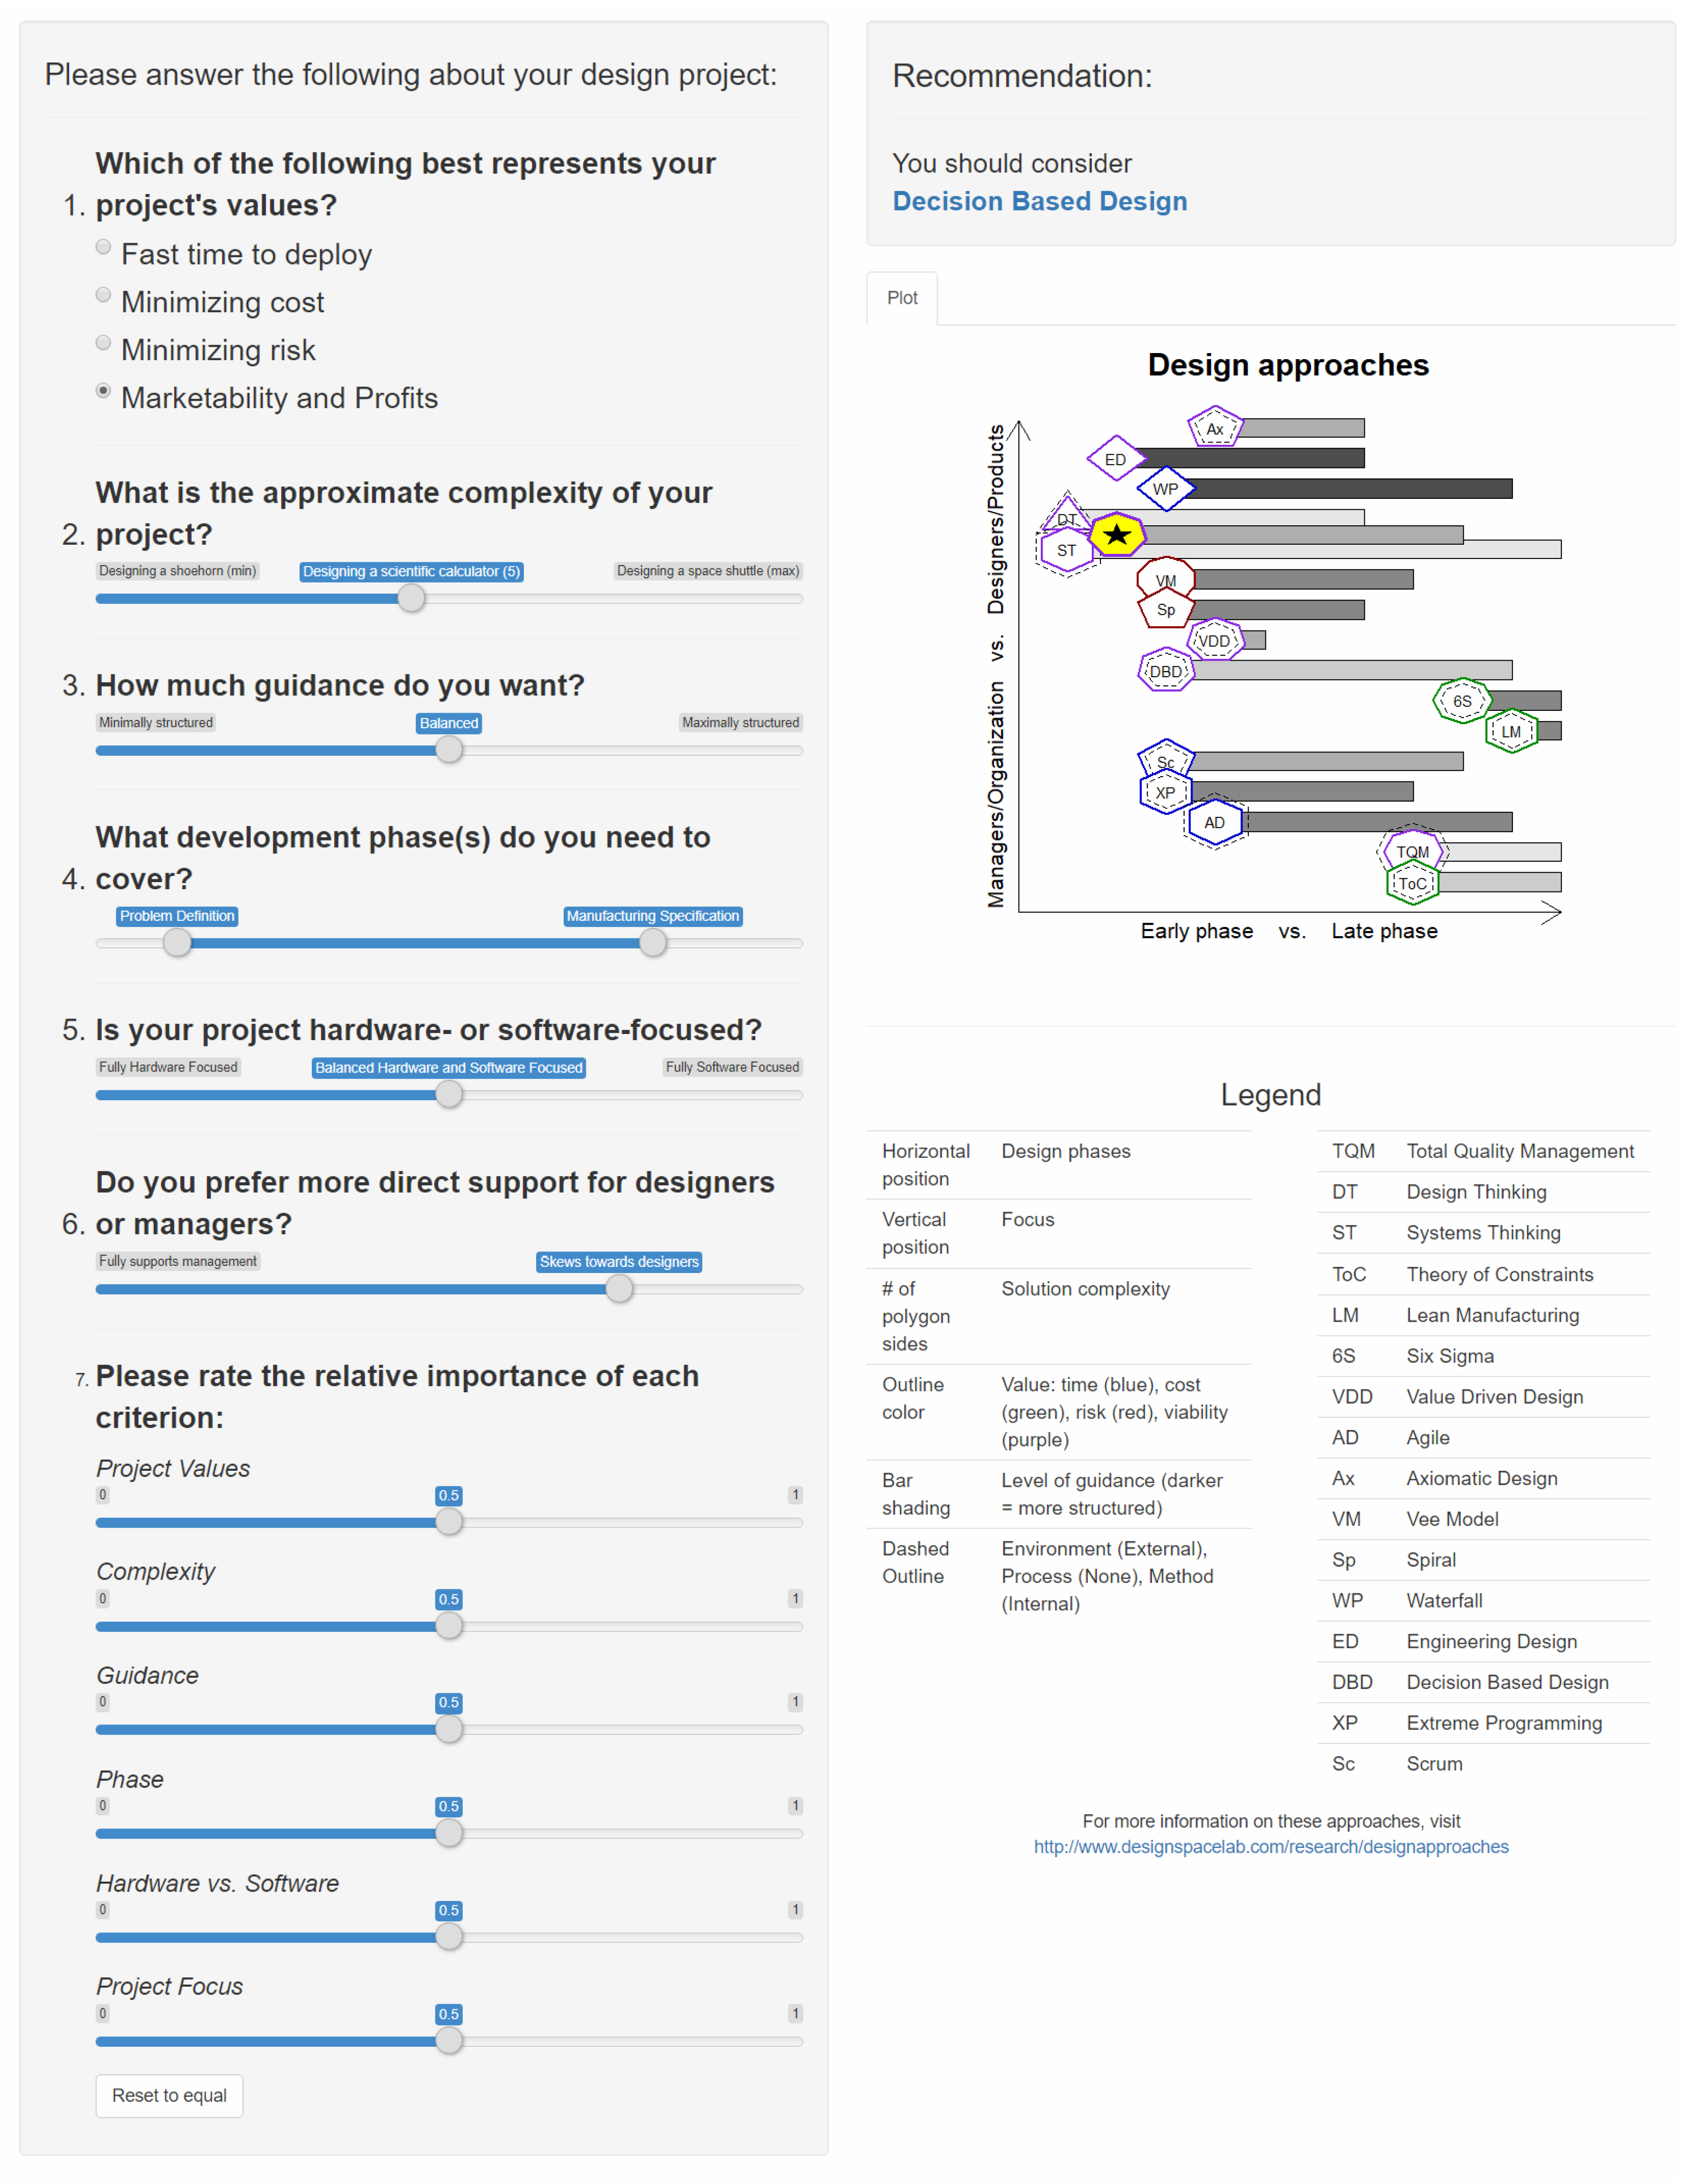
Designs 04 00004 g001
Figure 2. User interface for prototype PD Advisor.
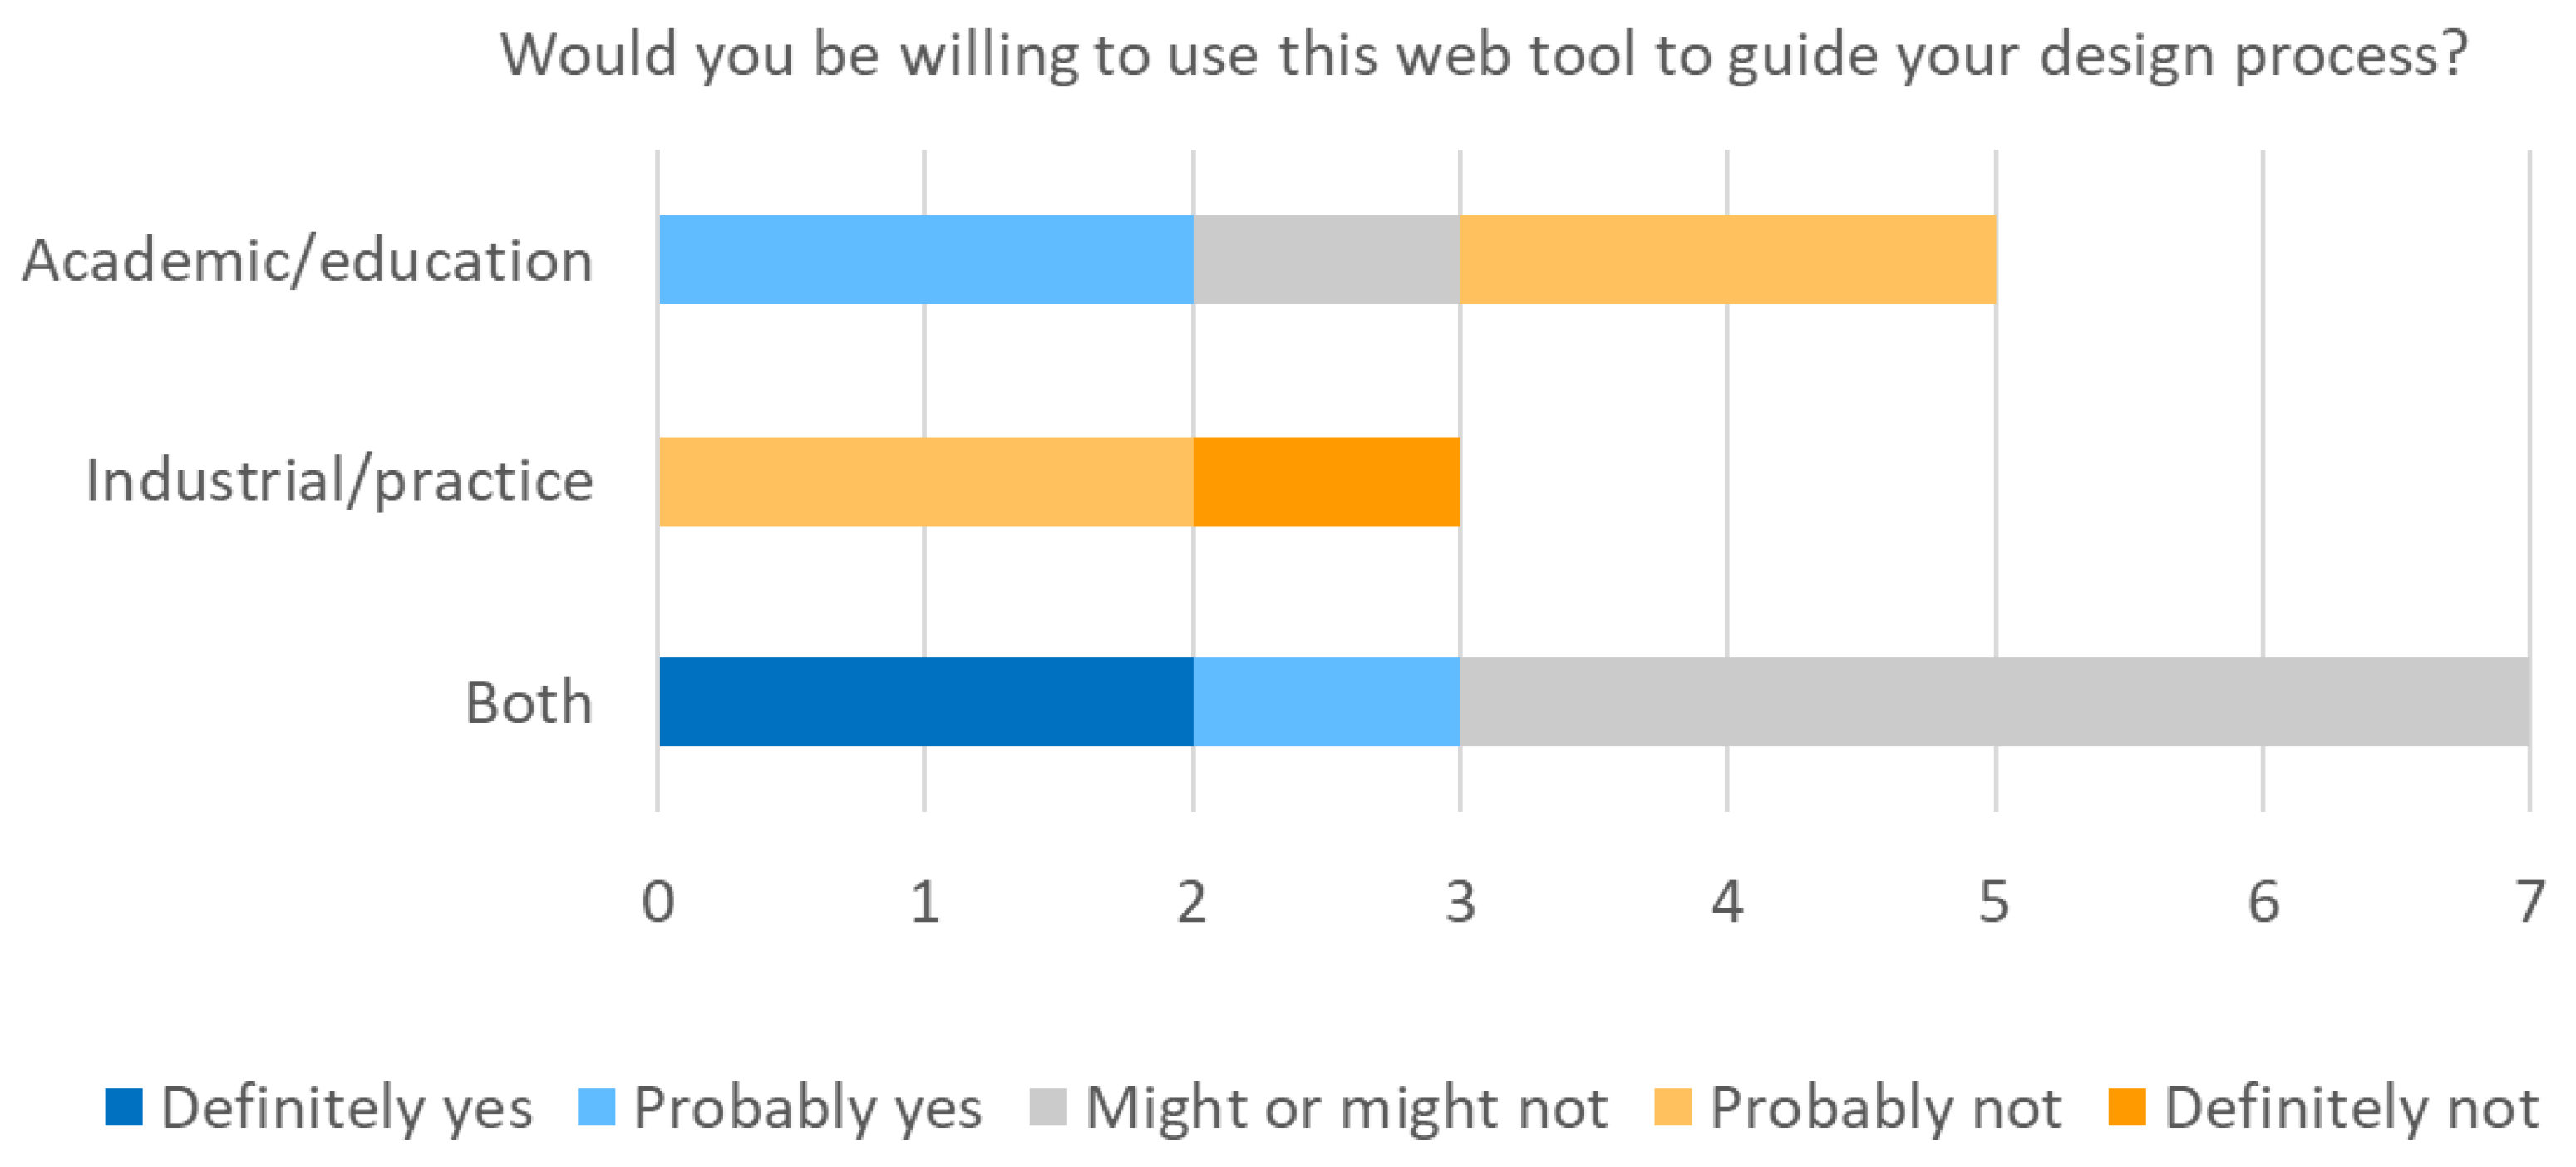
Designs 04 00004 g002
Figure 3. Perceived willingness to use PD Advisor.
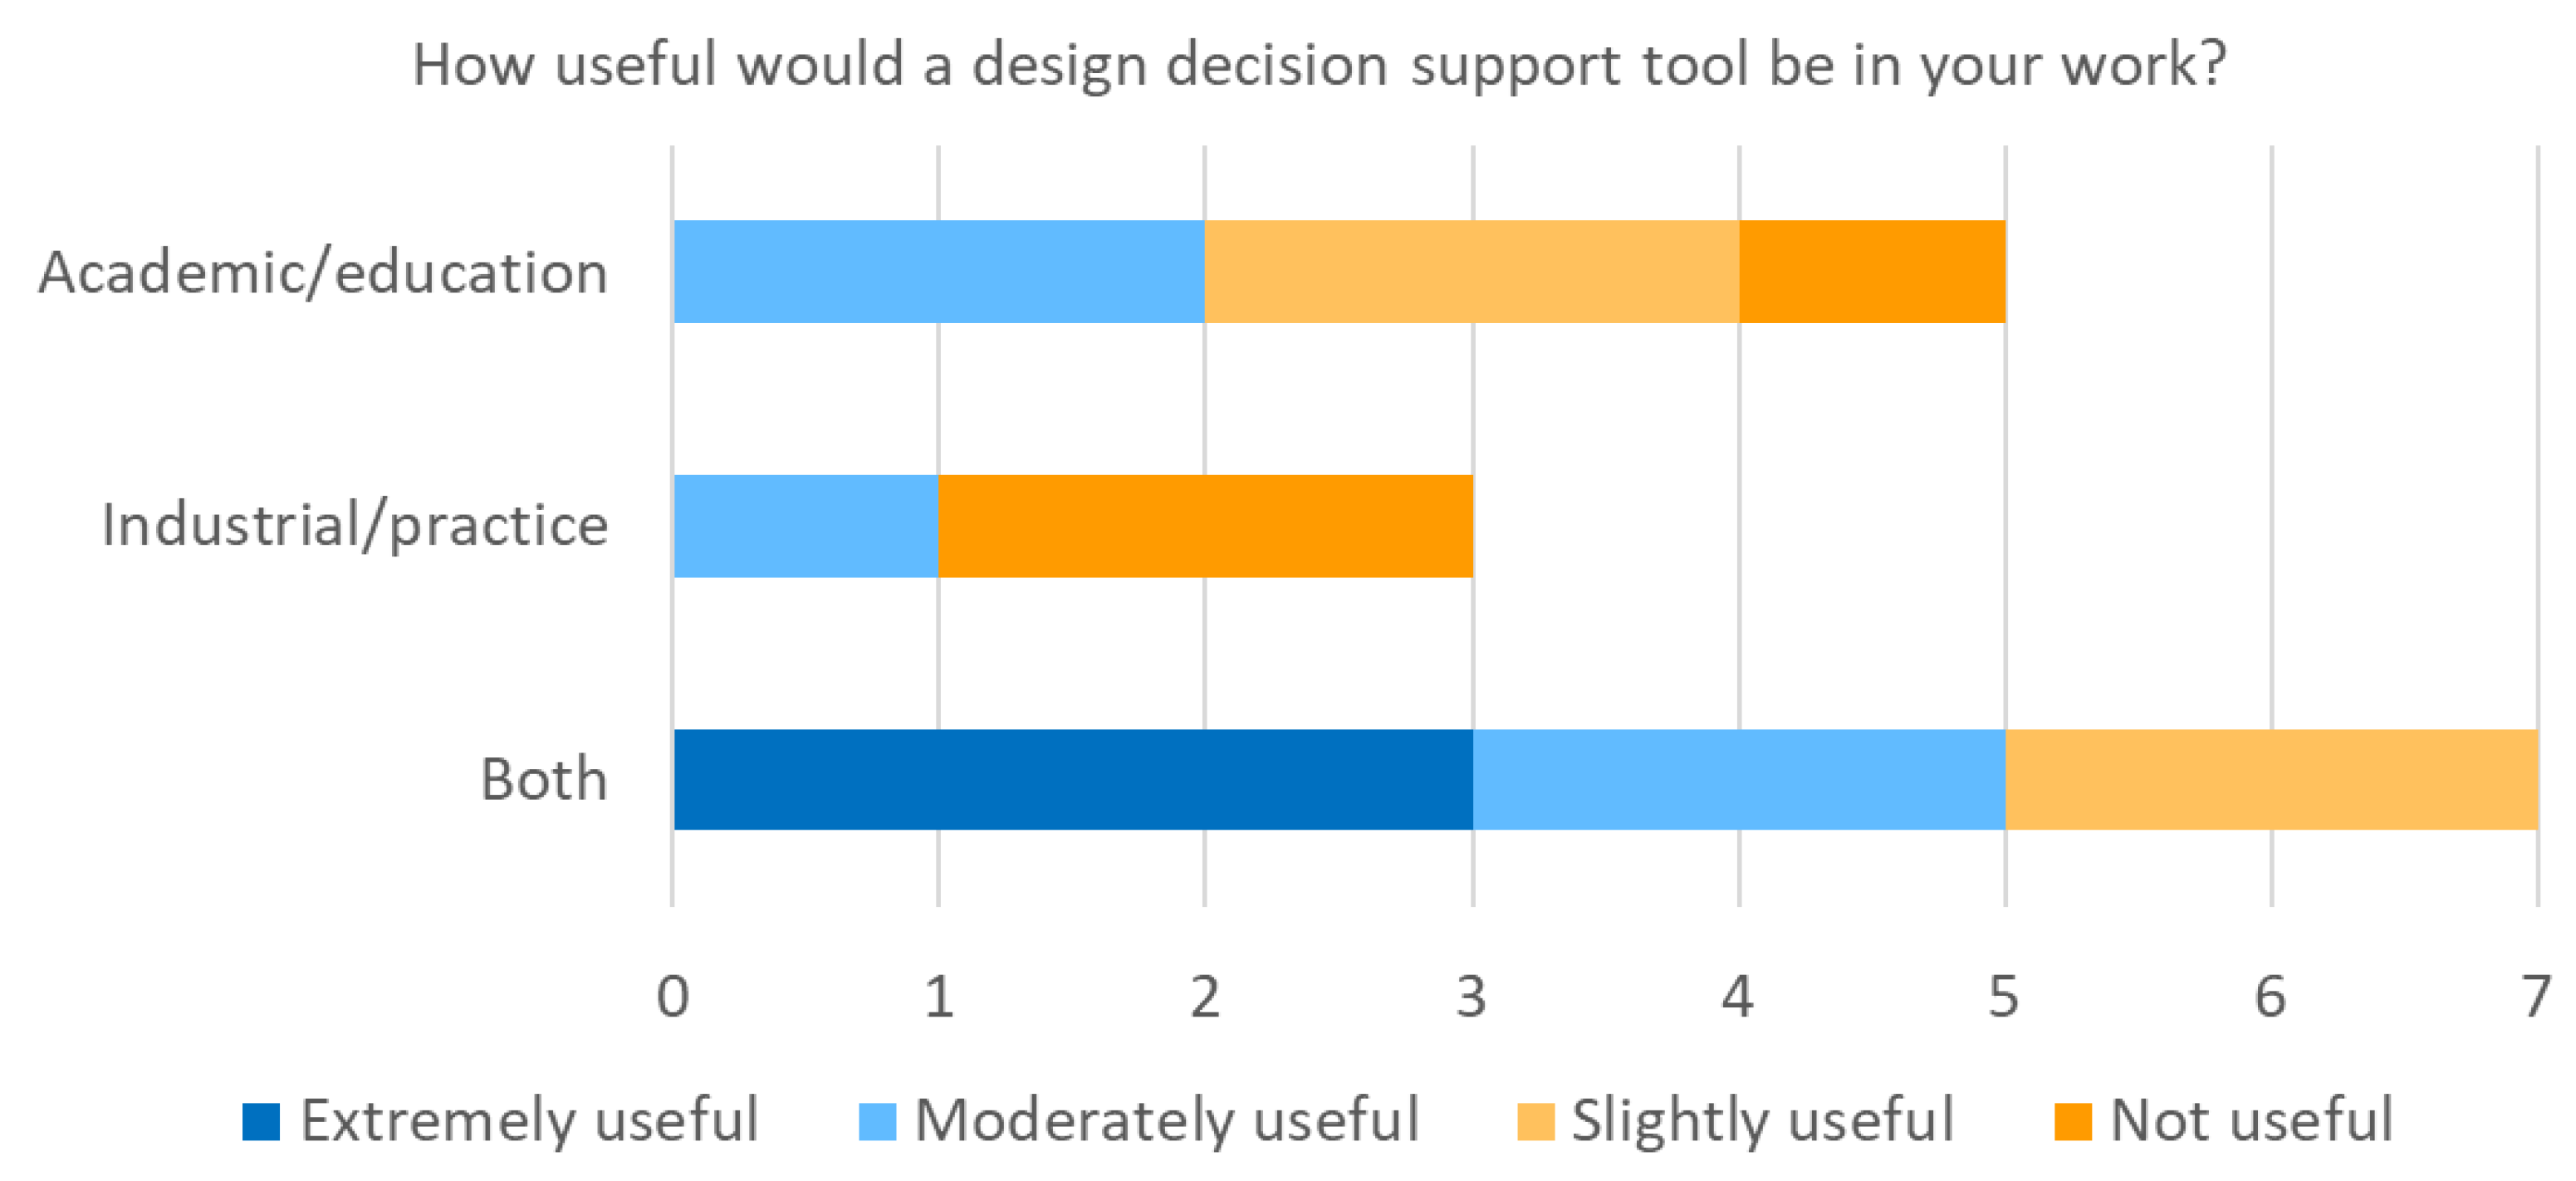
Designs 04 00004 g003
Figure 4. Perceived usefulness of PD Advisor.
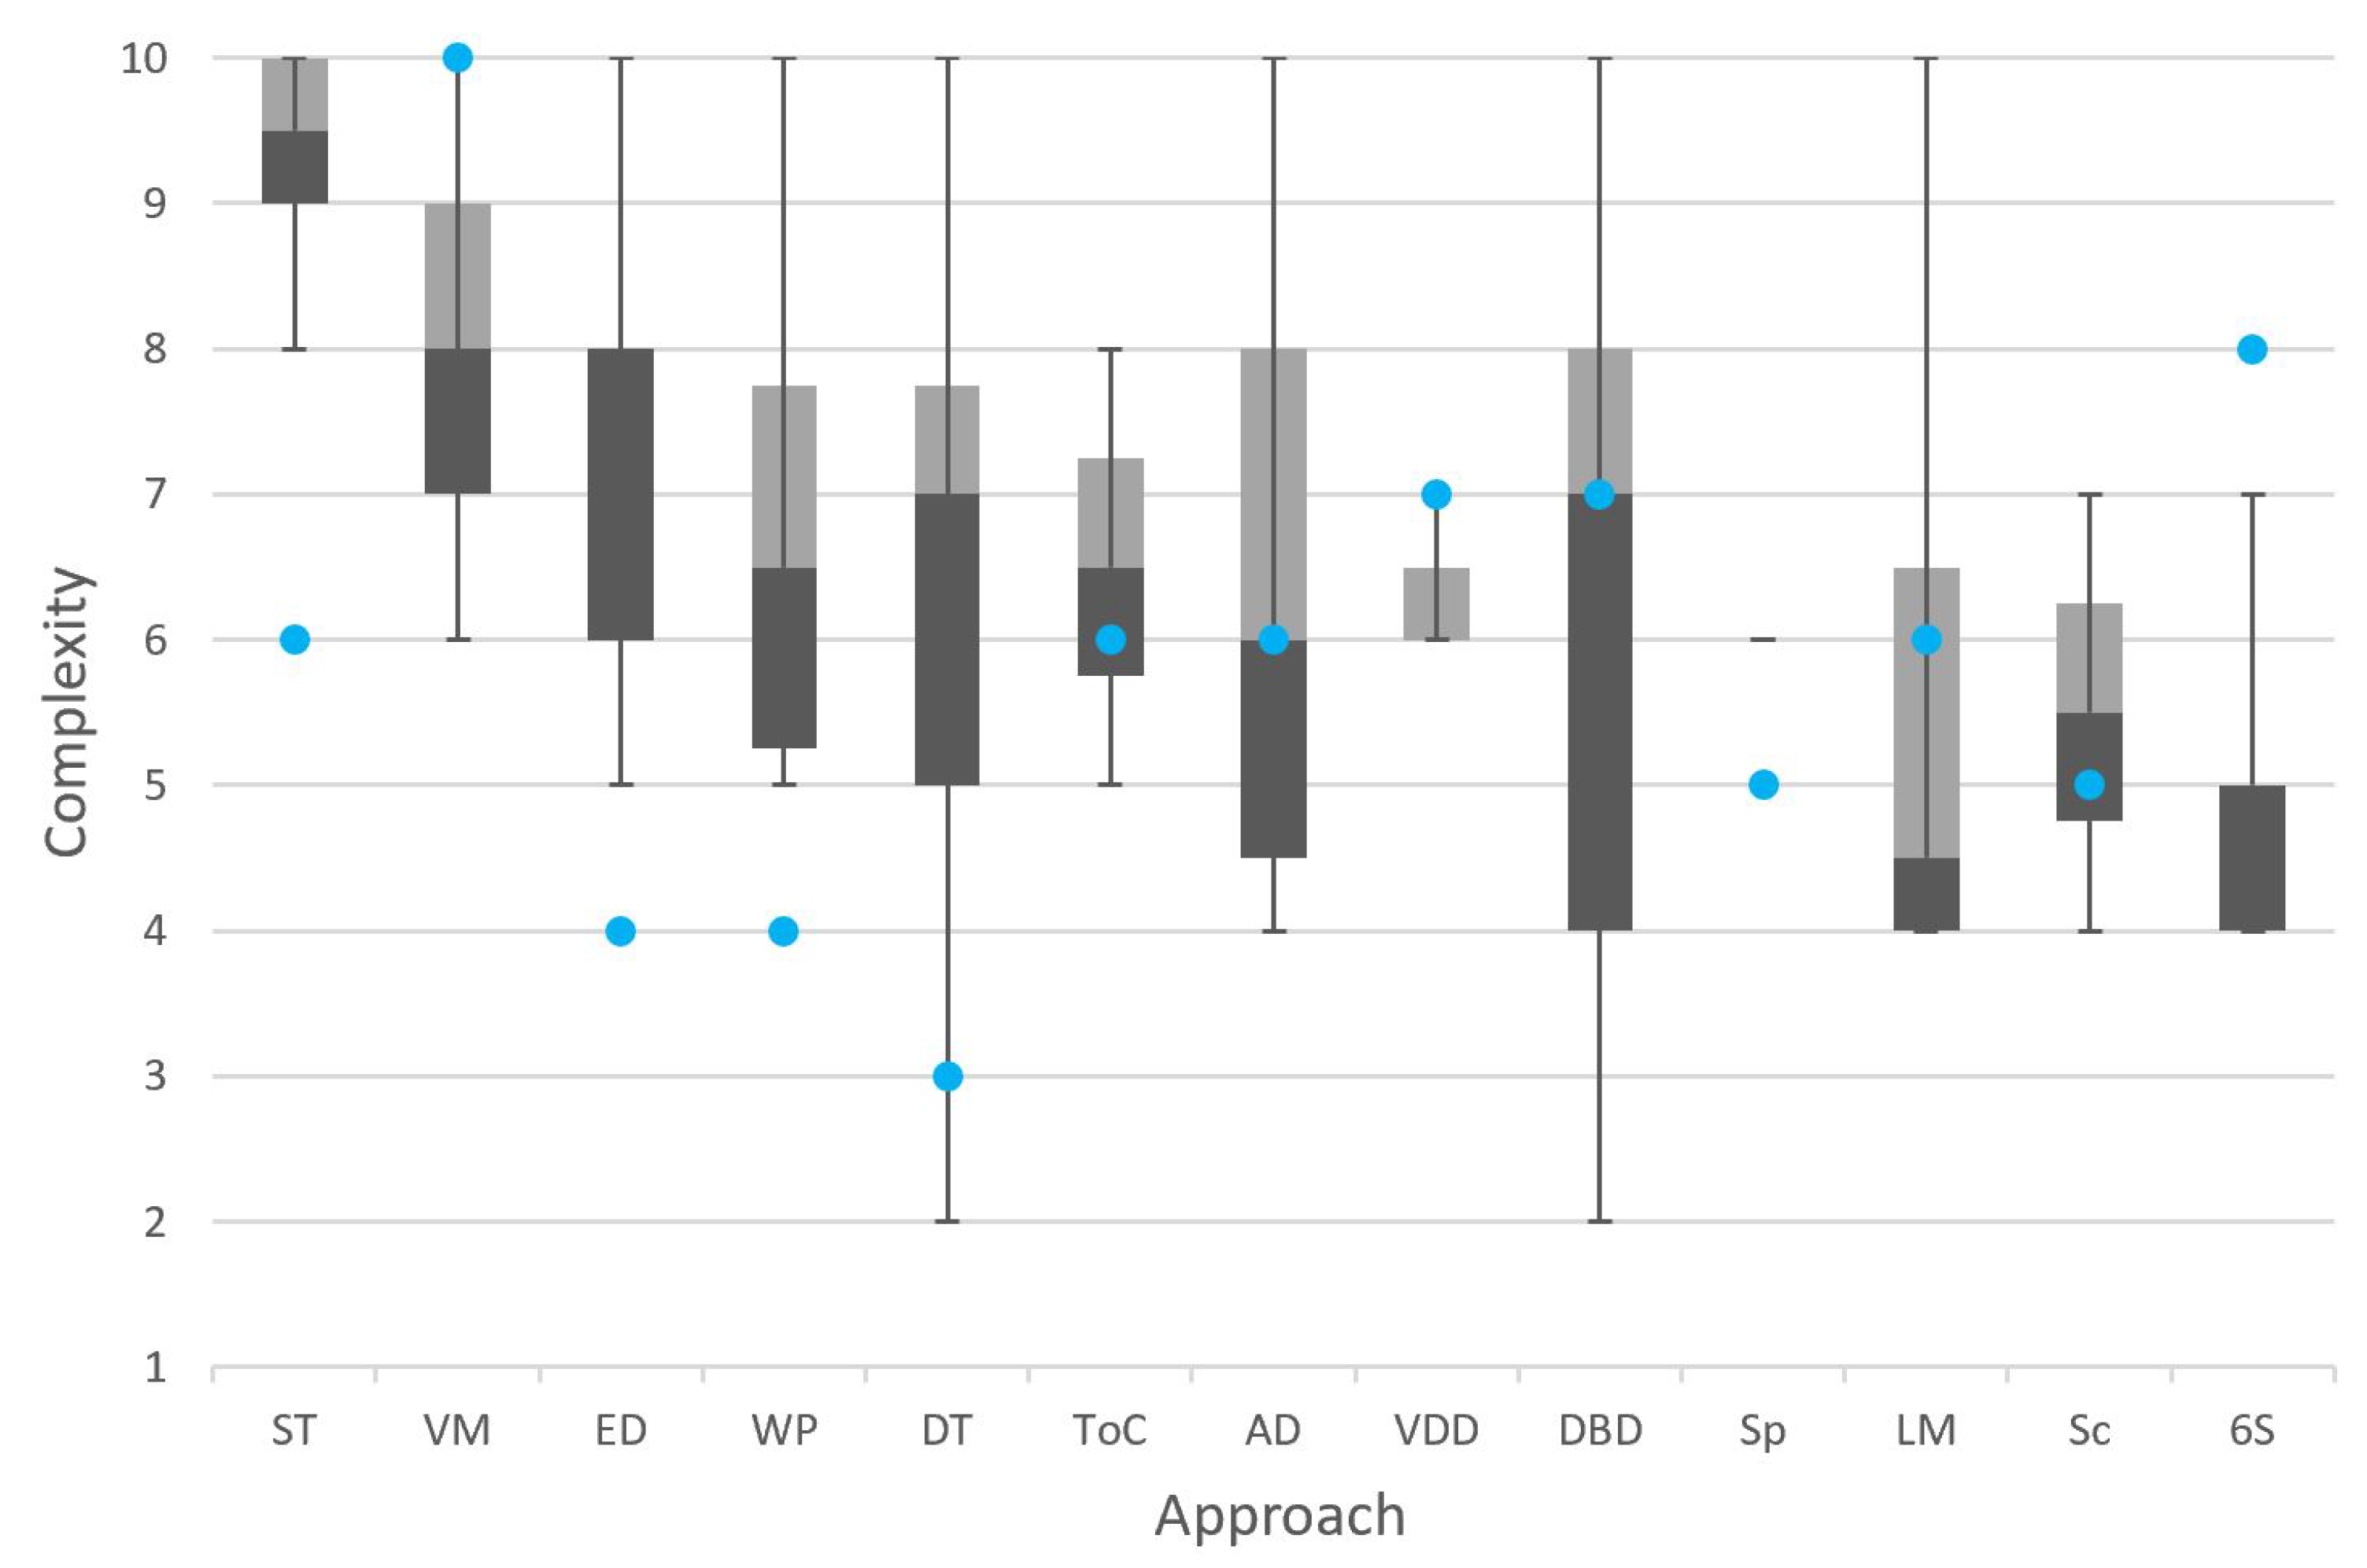
Designs 04 00004 g004
Figure 5. Complexity level of problem that each approach is relevant to. Shaded boxes span the interquartile range, separated by the median. Error bars represent upper and lower extremes. Blue dots represent the authors’ initial classification. Approaches are ordered by decreasing mean.
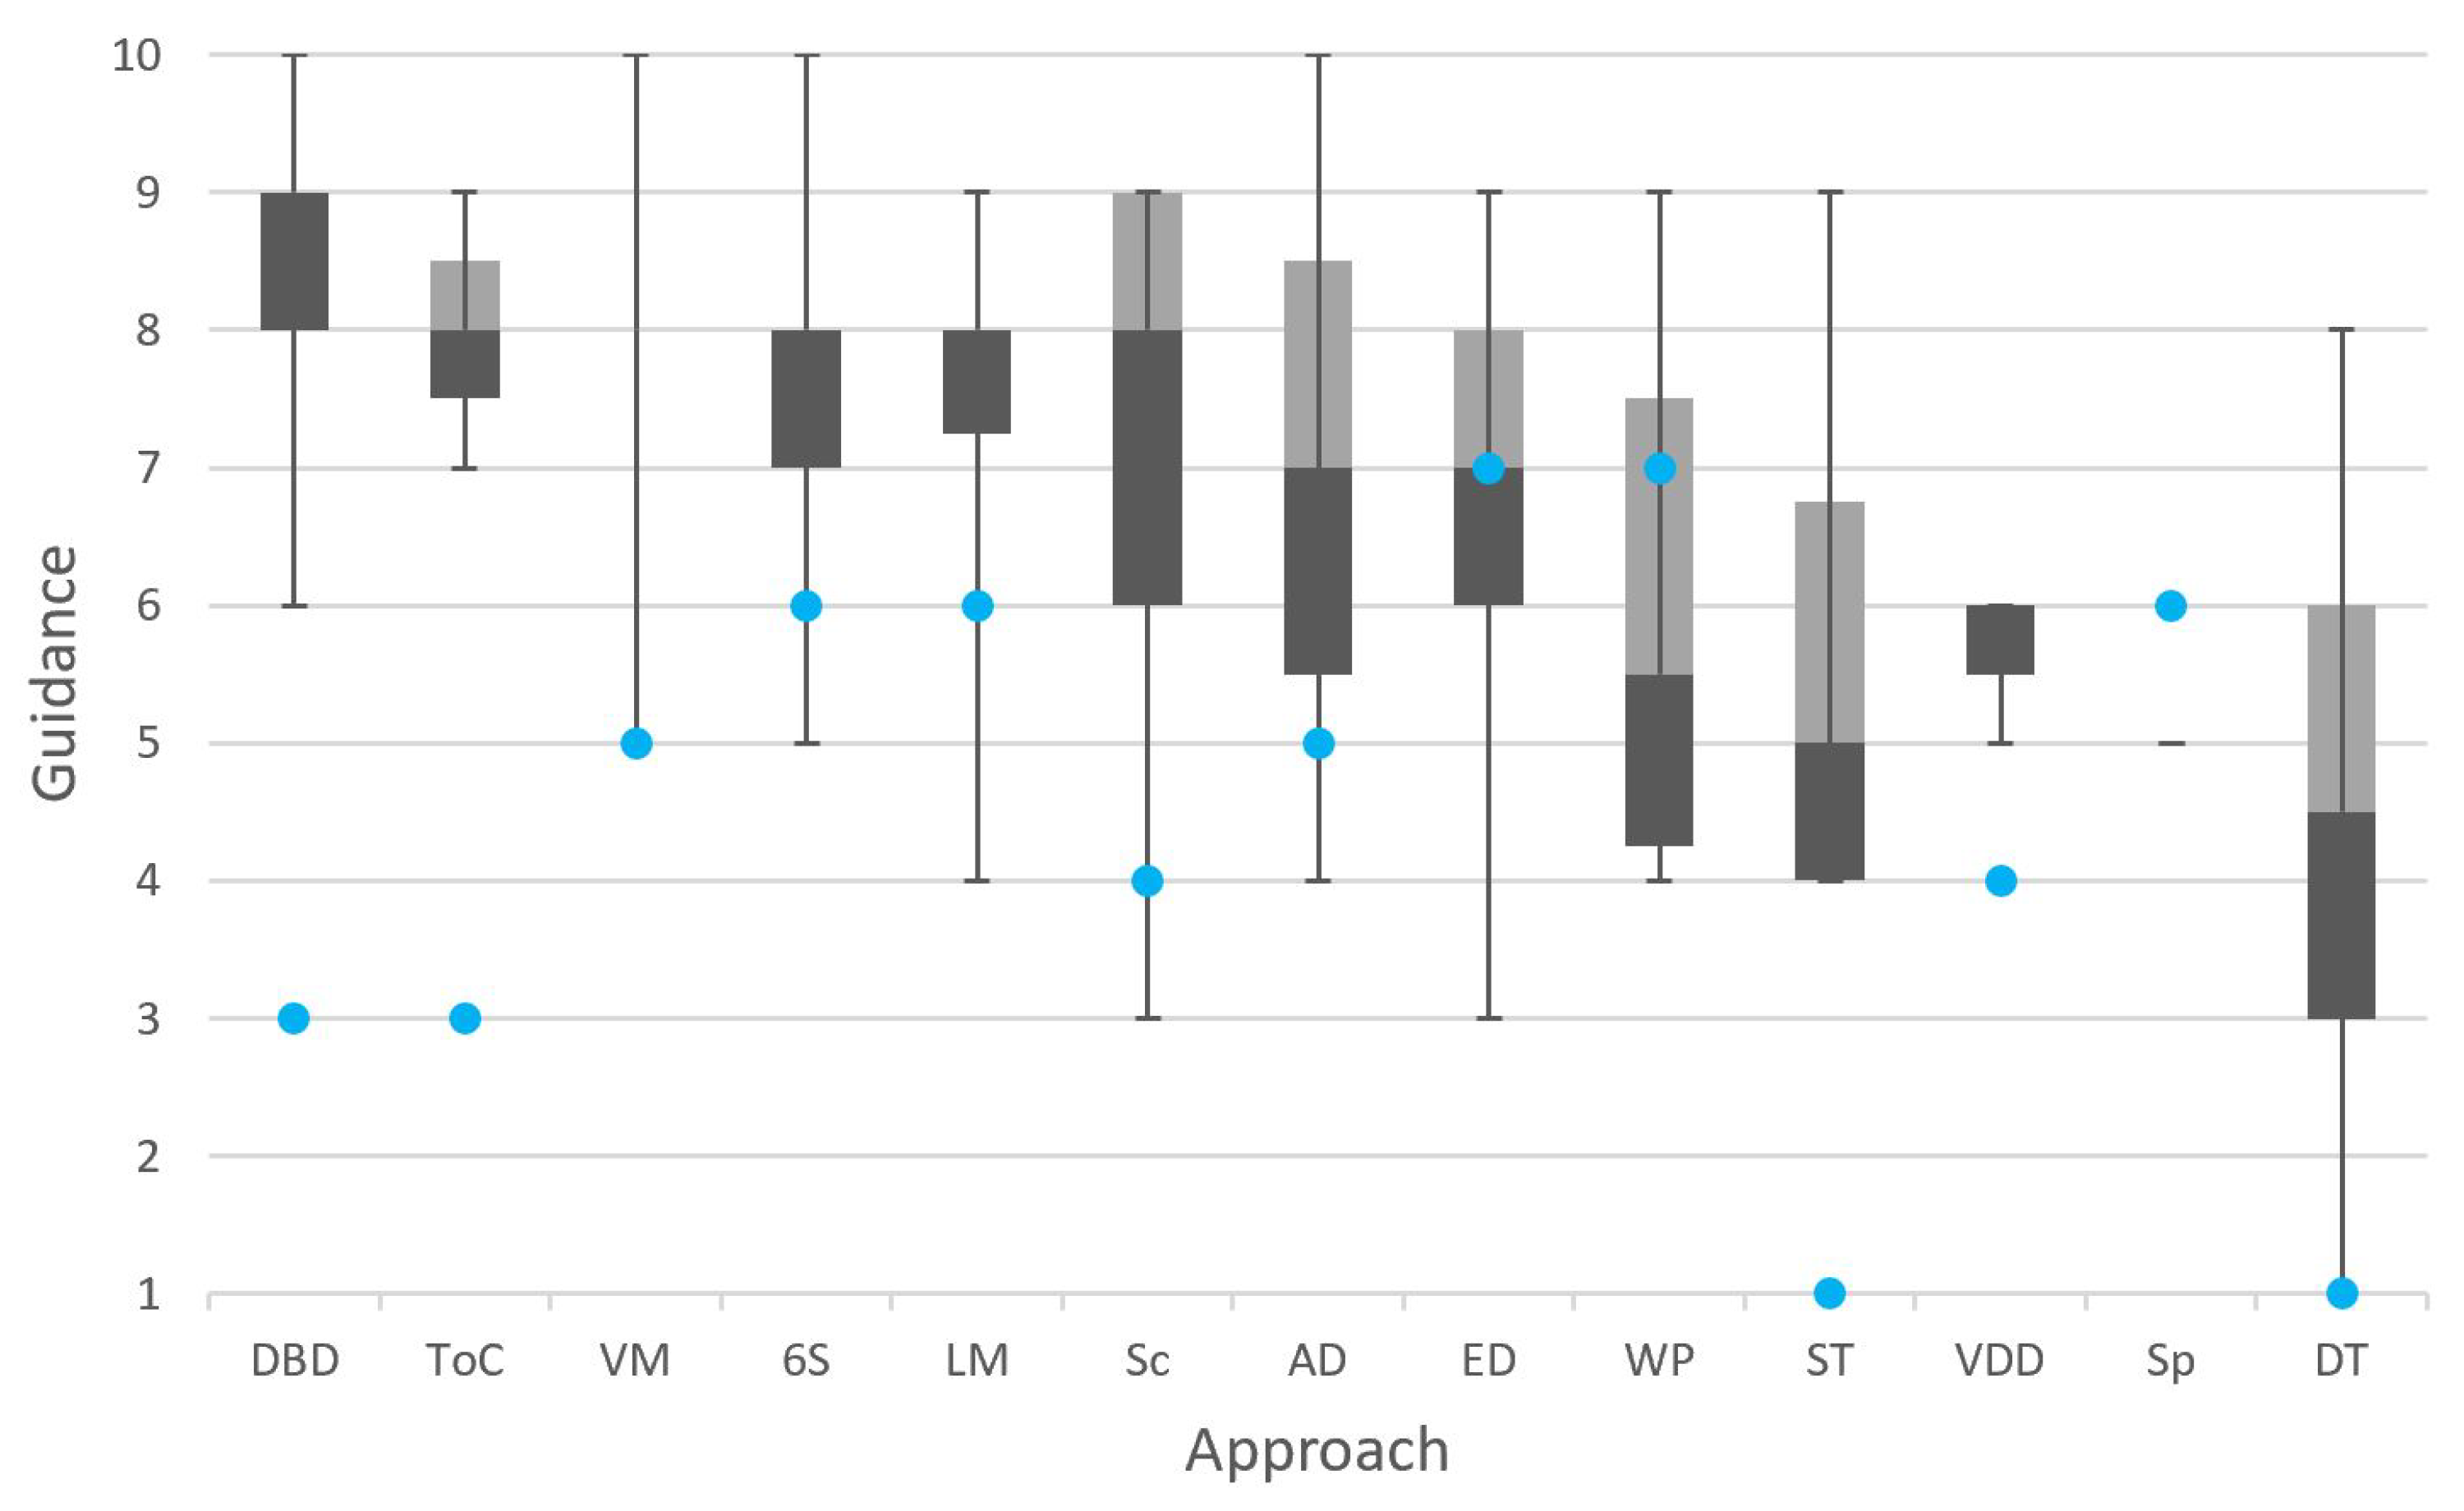
Designs 04 00004 g005
Figure 6. Level of guidance each approach provides. Shaded boxes span the interquartile range, separated by the median. Error bars represent upper and lower extremes. Blue dots represent the authors’ initial classification. Approaches ordered by decreasing mean, with ties broken by increasing standard deviation.
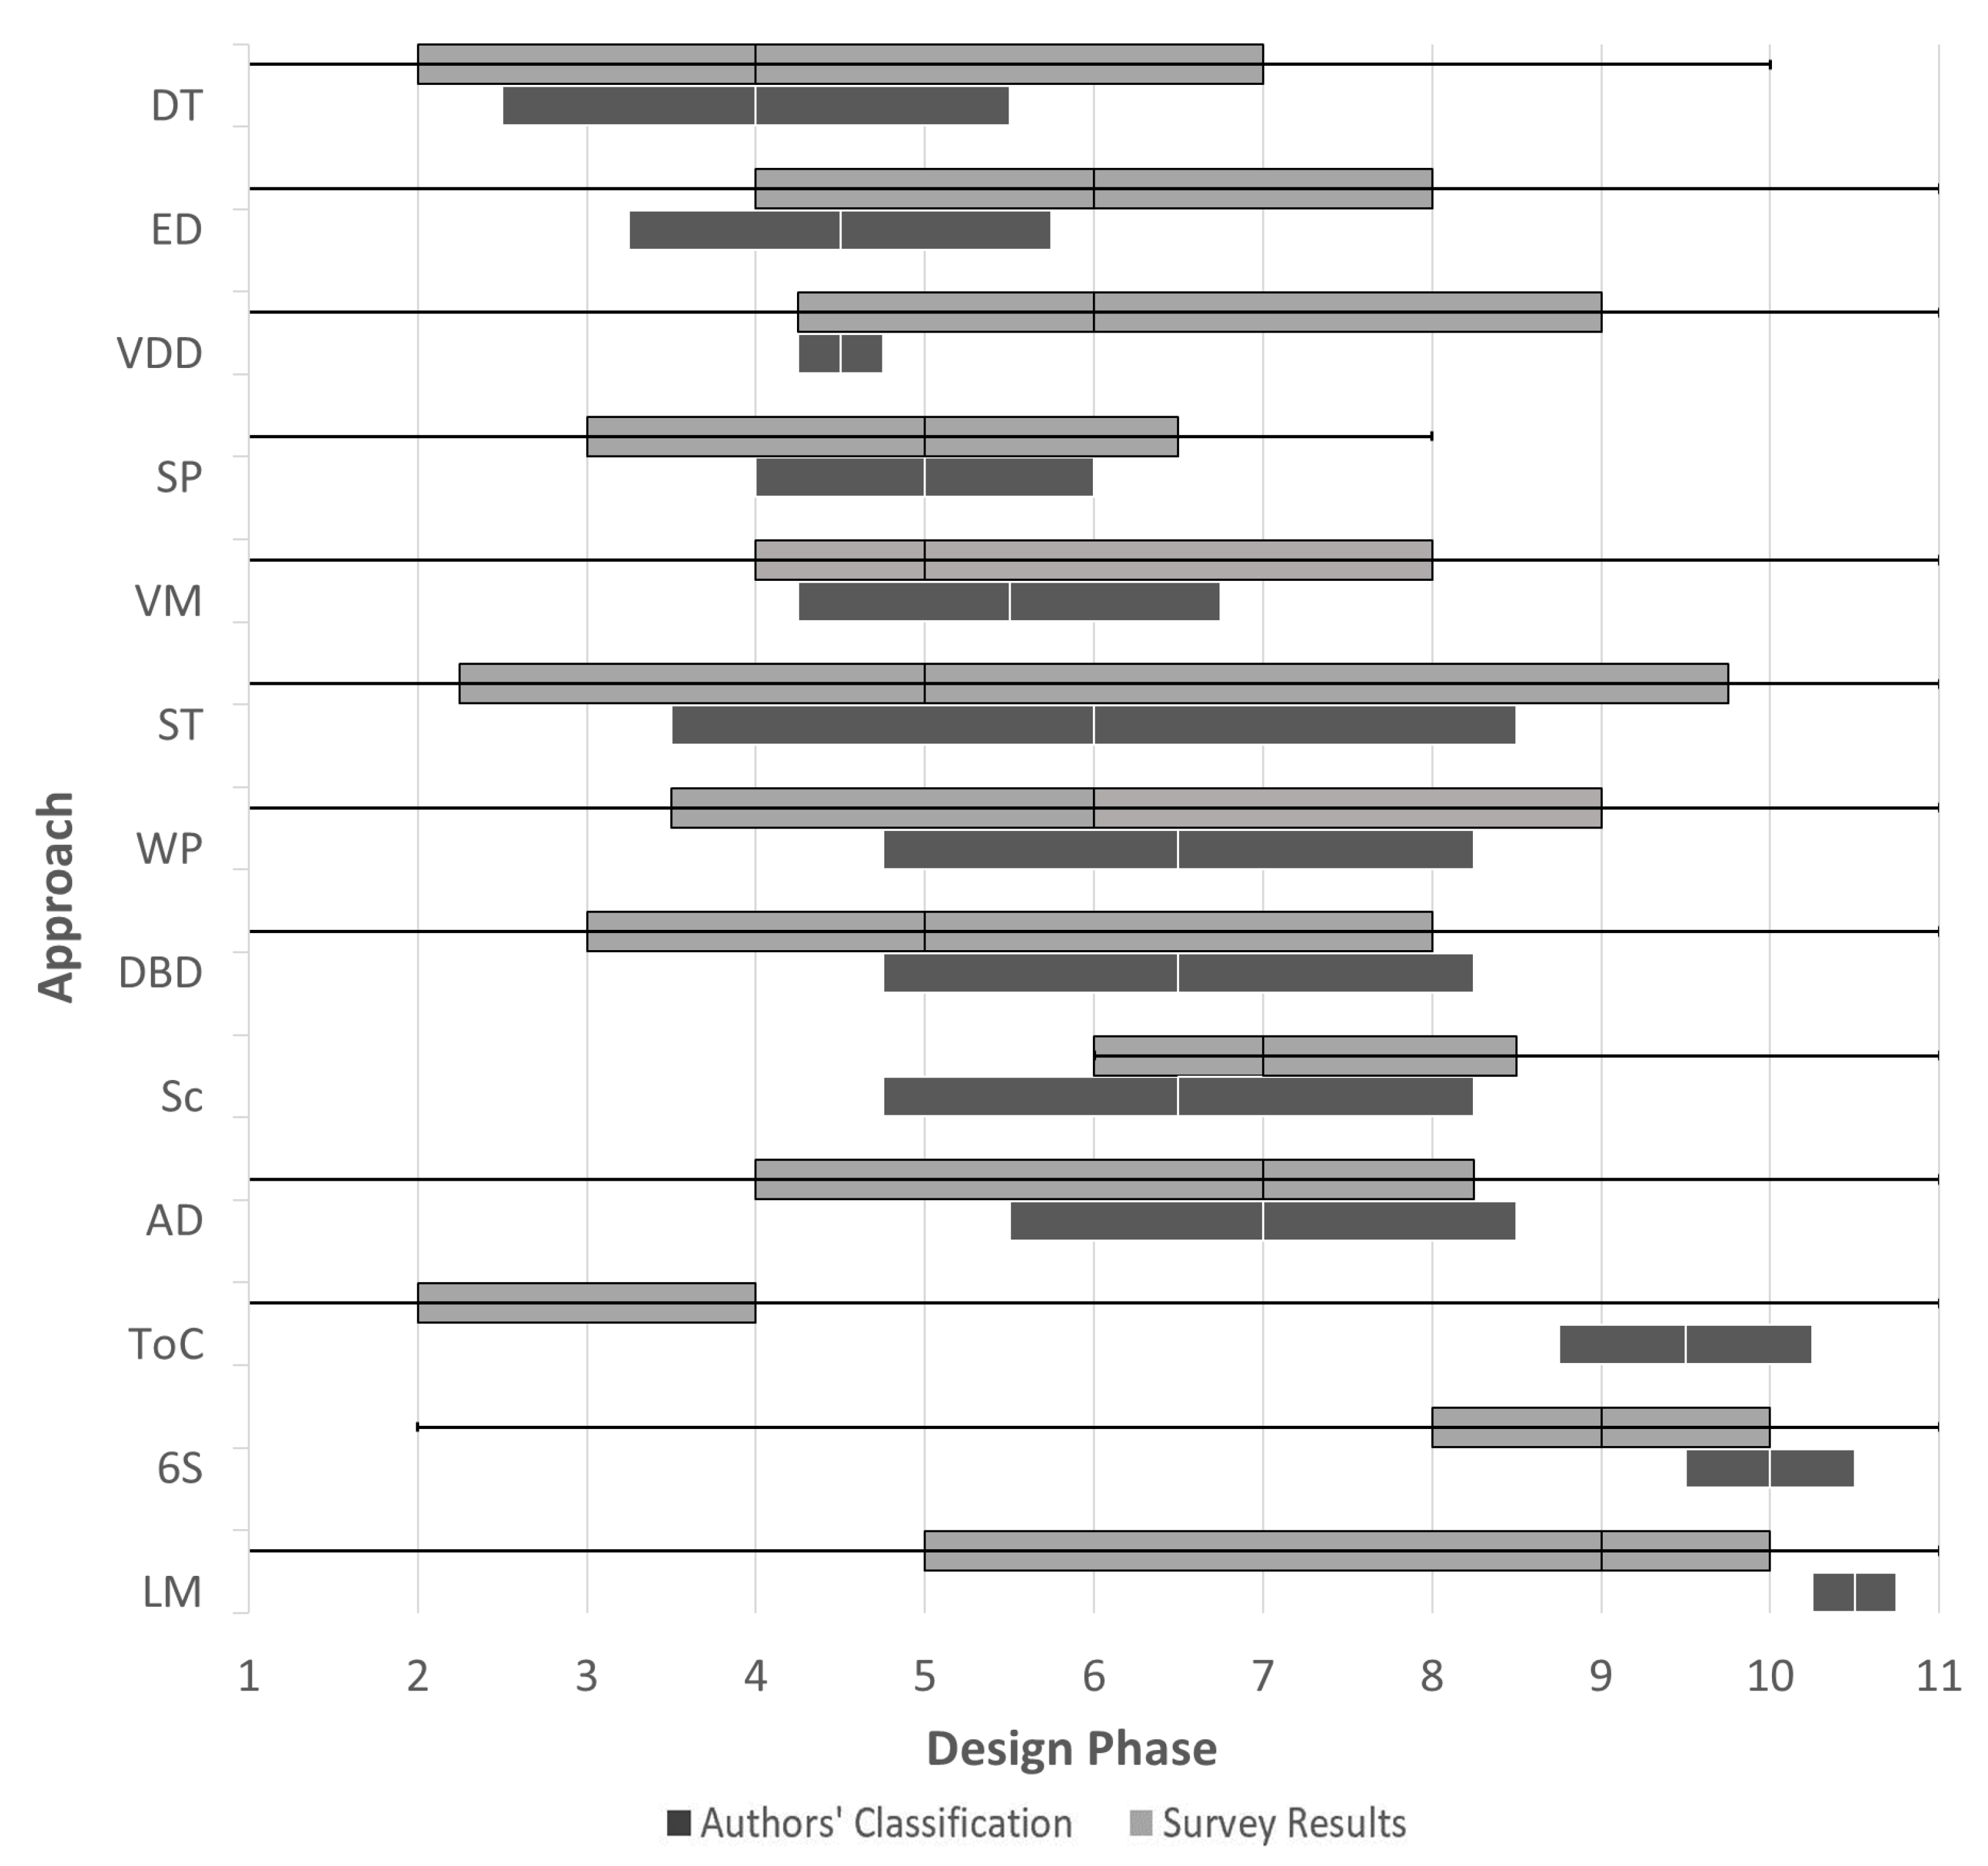
Designs 04 00004 g006
Figure 7. Design phases covered by each approach, based on survey responses and authors’ original classifications. Shaded boxes span the interquartile range, separated by the median. Error bars represent upper and lower extremes. Approaches are ordered by increasing mean of the midpoint of the authors’ initial classification.
Designs 04 00004 g007
Figure 8. Values associated with each approach, according to respondents. Approaches ordered by decreasing total selections. “A” signifies authors’ original classification.
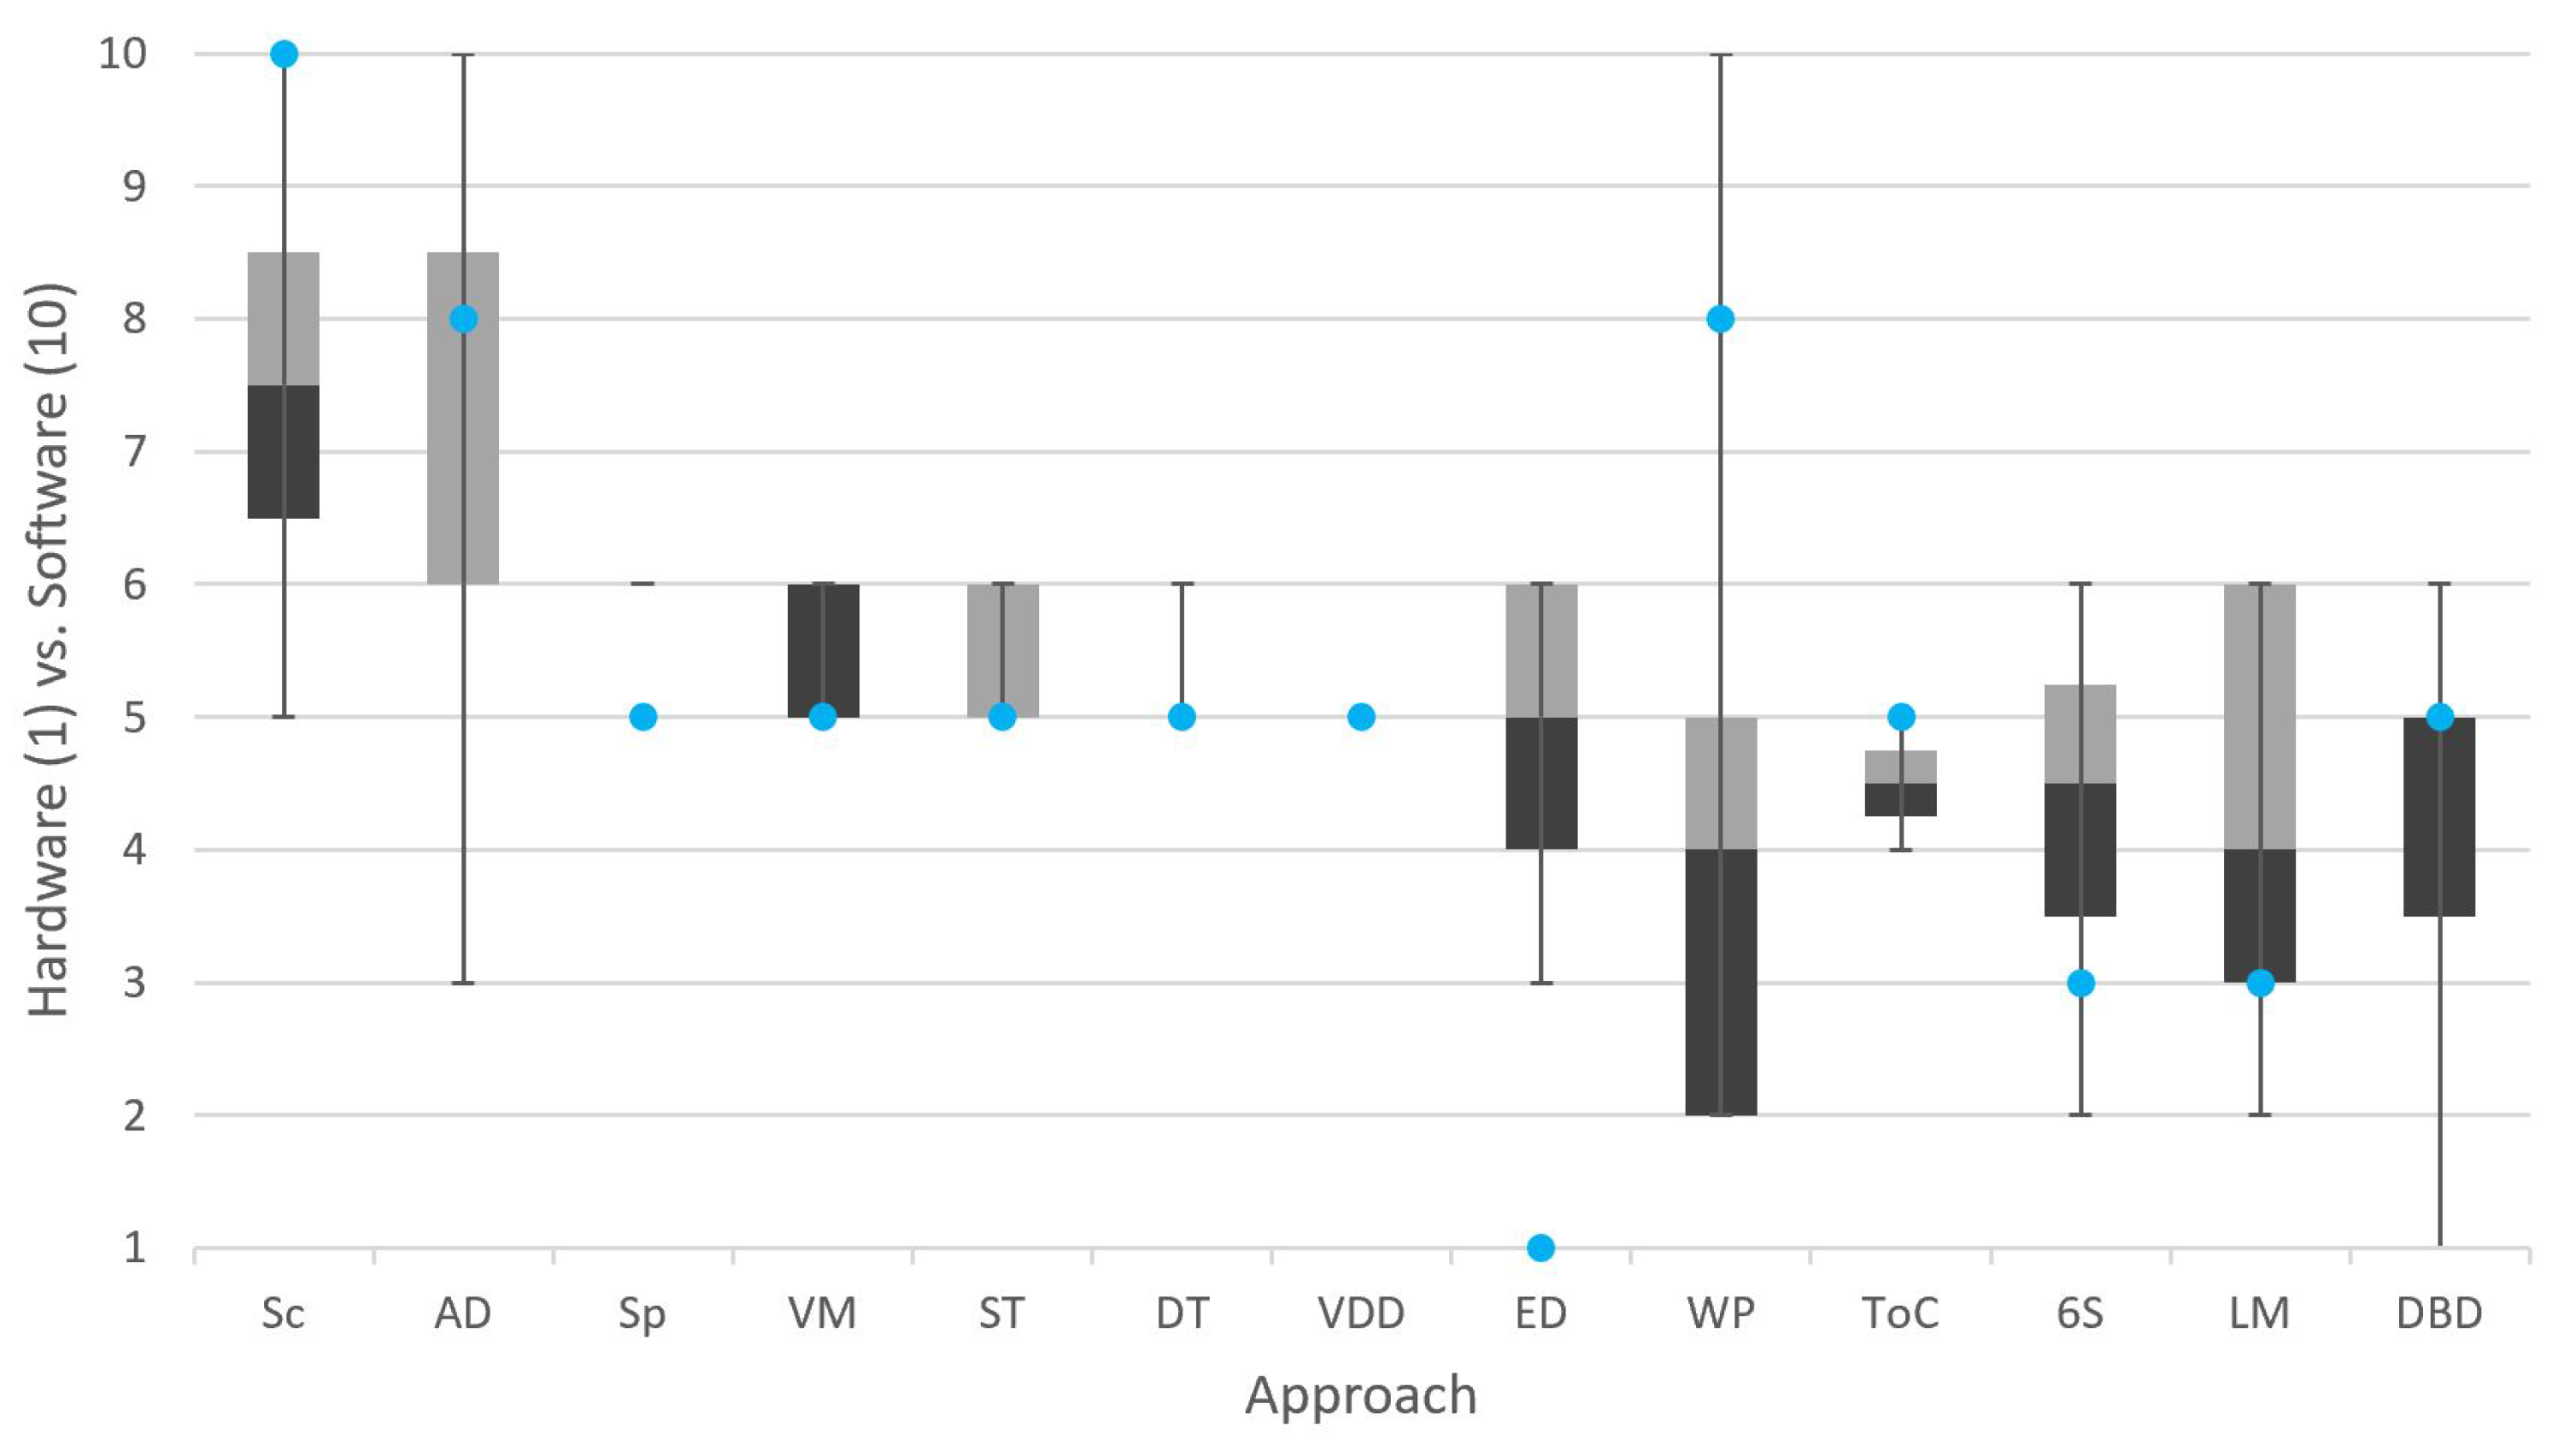
Designs 04 00004 g008
Figure 9. Perceived approach suitability to hardware vs. software. Shaded boxes span the interquartile range, separated by the median. Error bars represent upper and lower extremes. Blue dots represent the authors’ initial classification. Approaches ordered by decreasing mean.
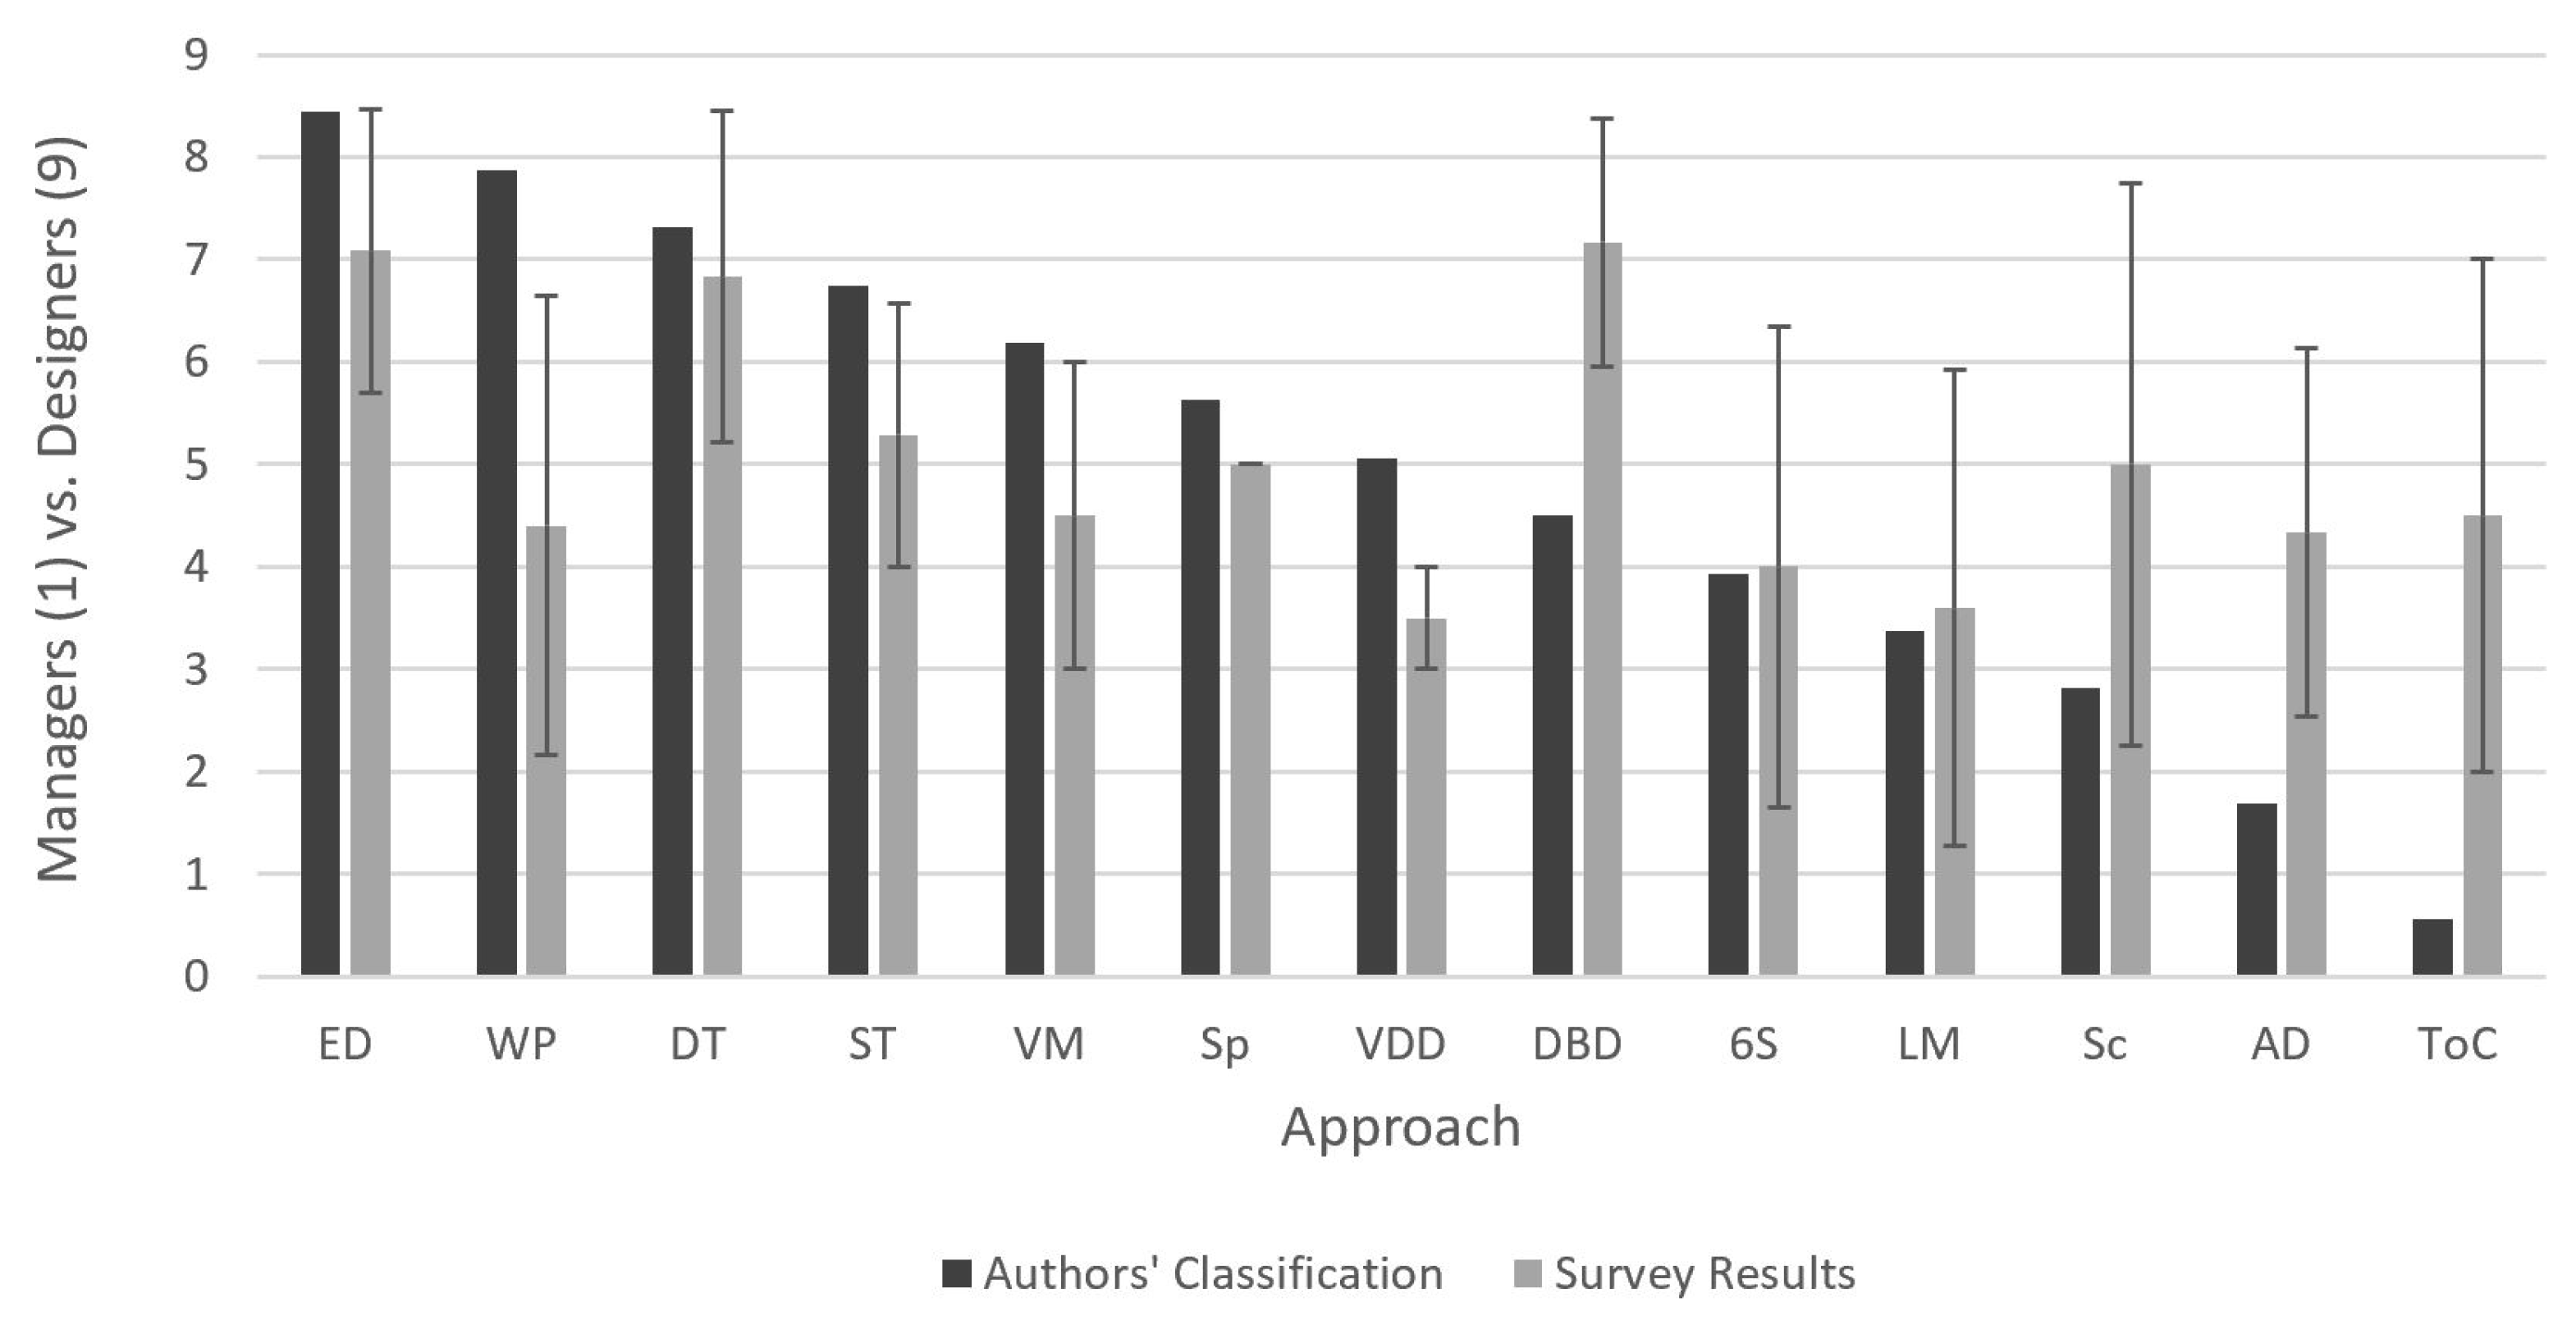
Designs 04 00004 g009
Figure 10. Focus of approach on managers vs. designers, based on survey responses and authors’ classifications. Error bars on survey results represent standard deviations above and below the average response value. Approaches are ordered by decreasing authors’ initial ranks.
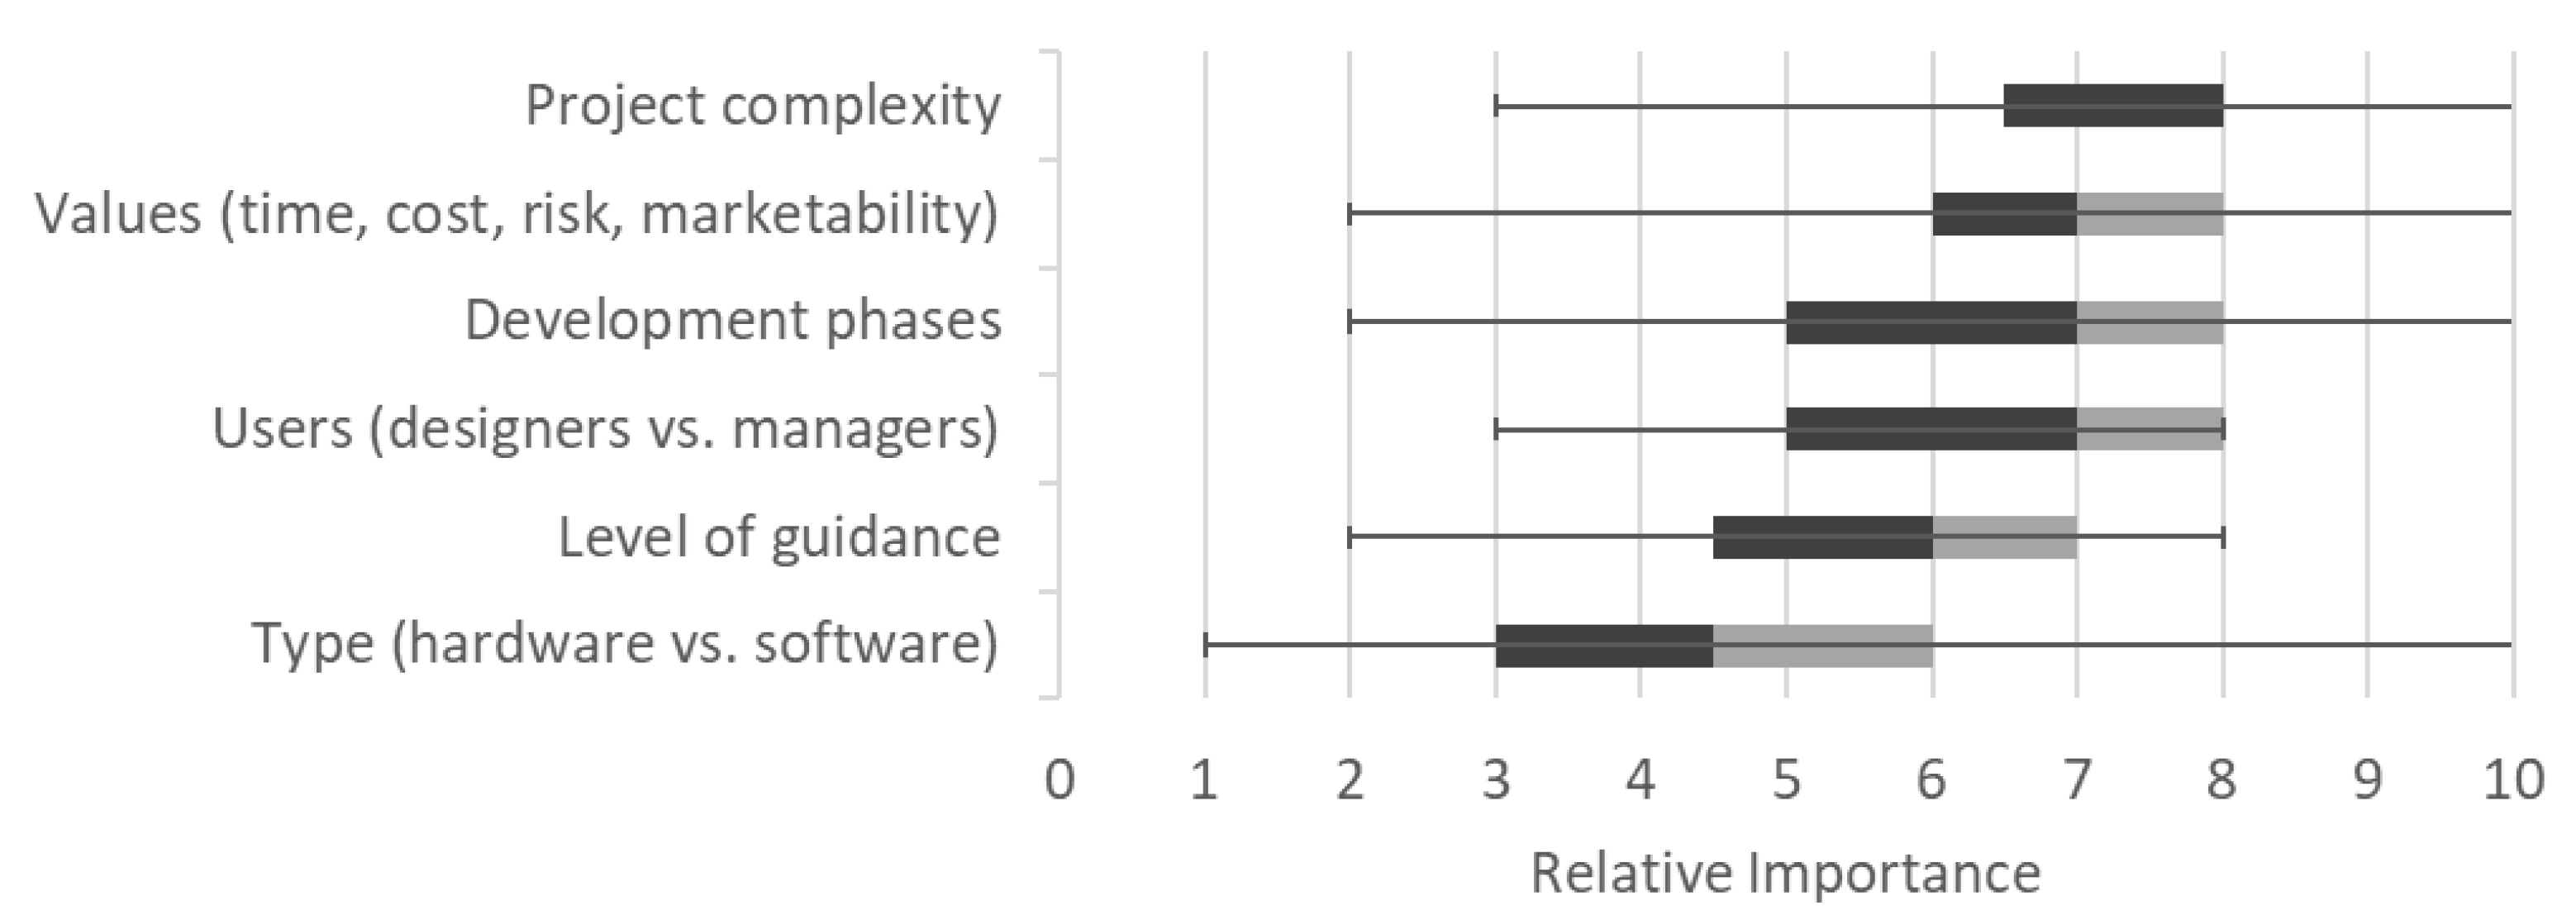
Designs 04 00004 g010
Figure 11. Perceived relative importance of criteria based on survey responses. Shaded boxes span the interquartile range, separated by the median. Error bars represent upper and lower extremes. Approaches are ordered by decreasing mean.
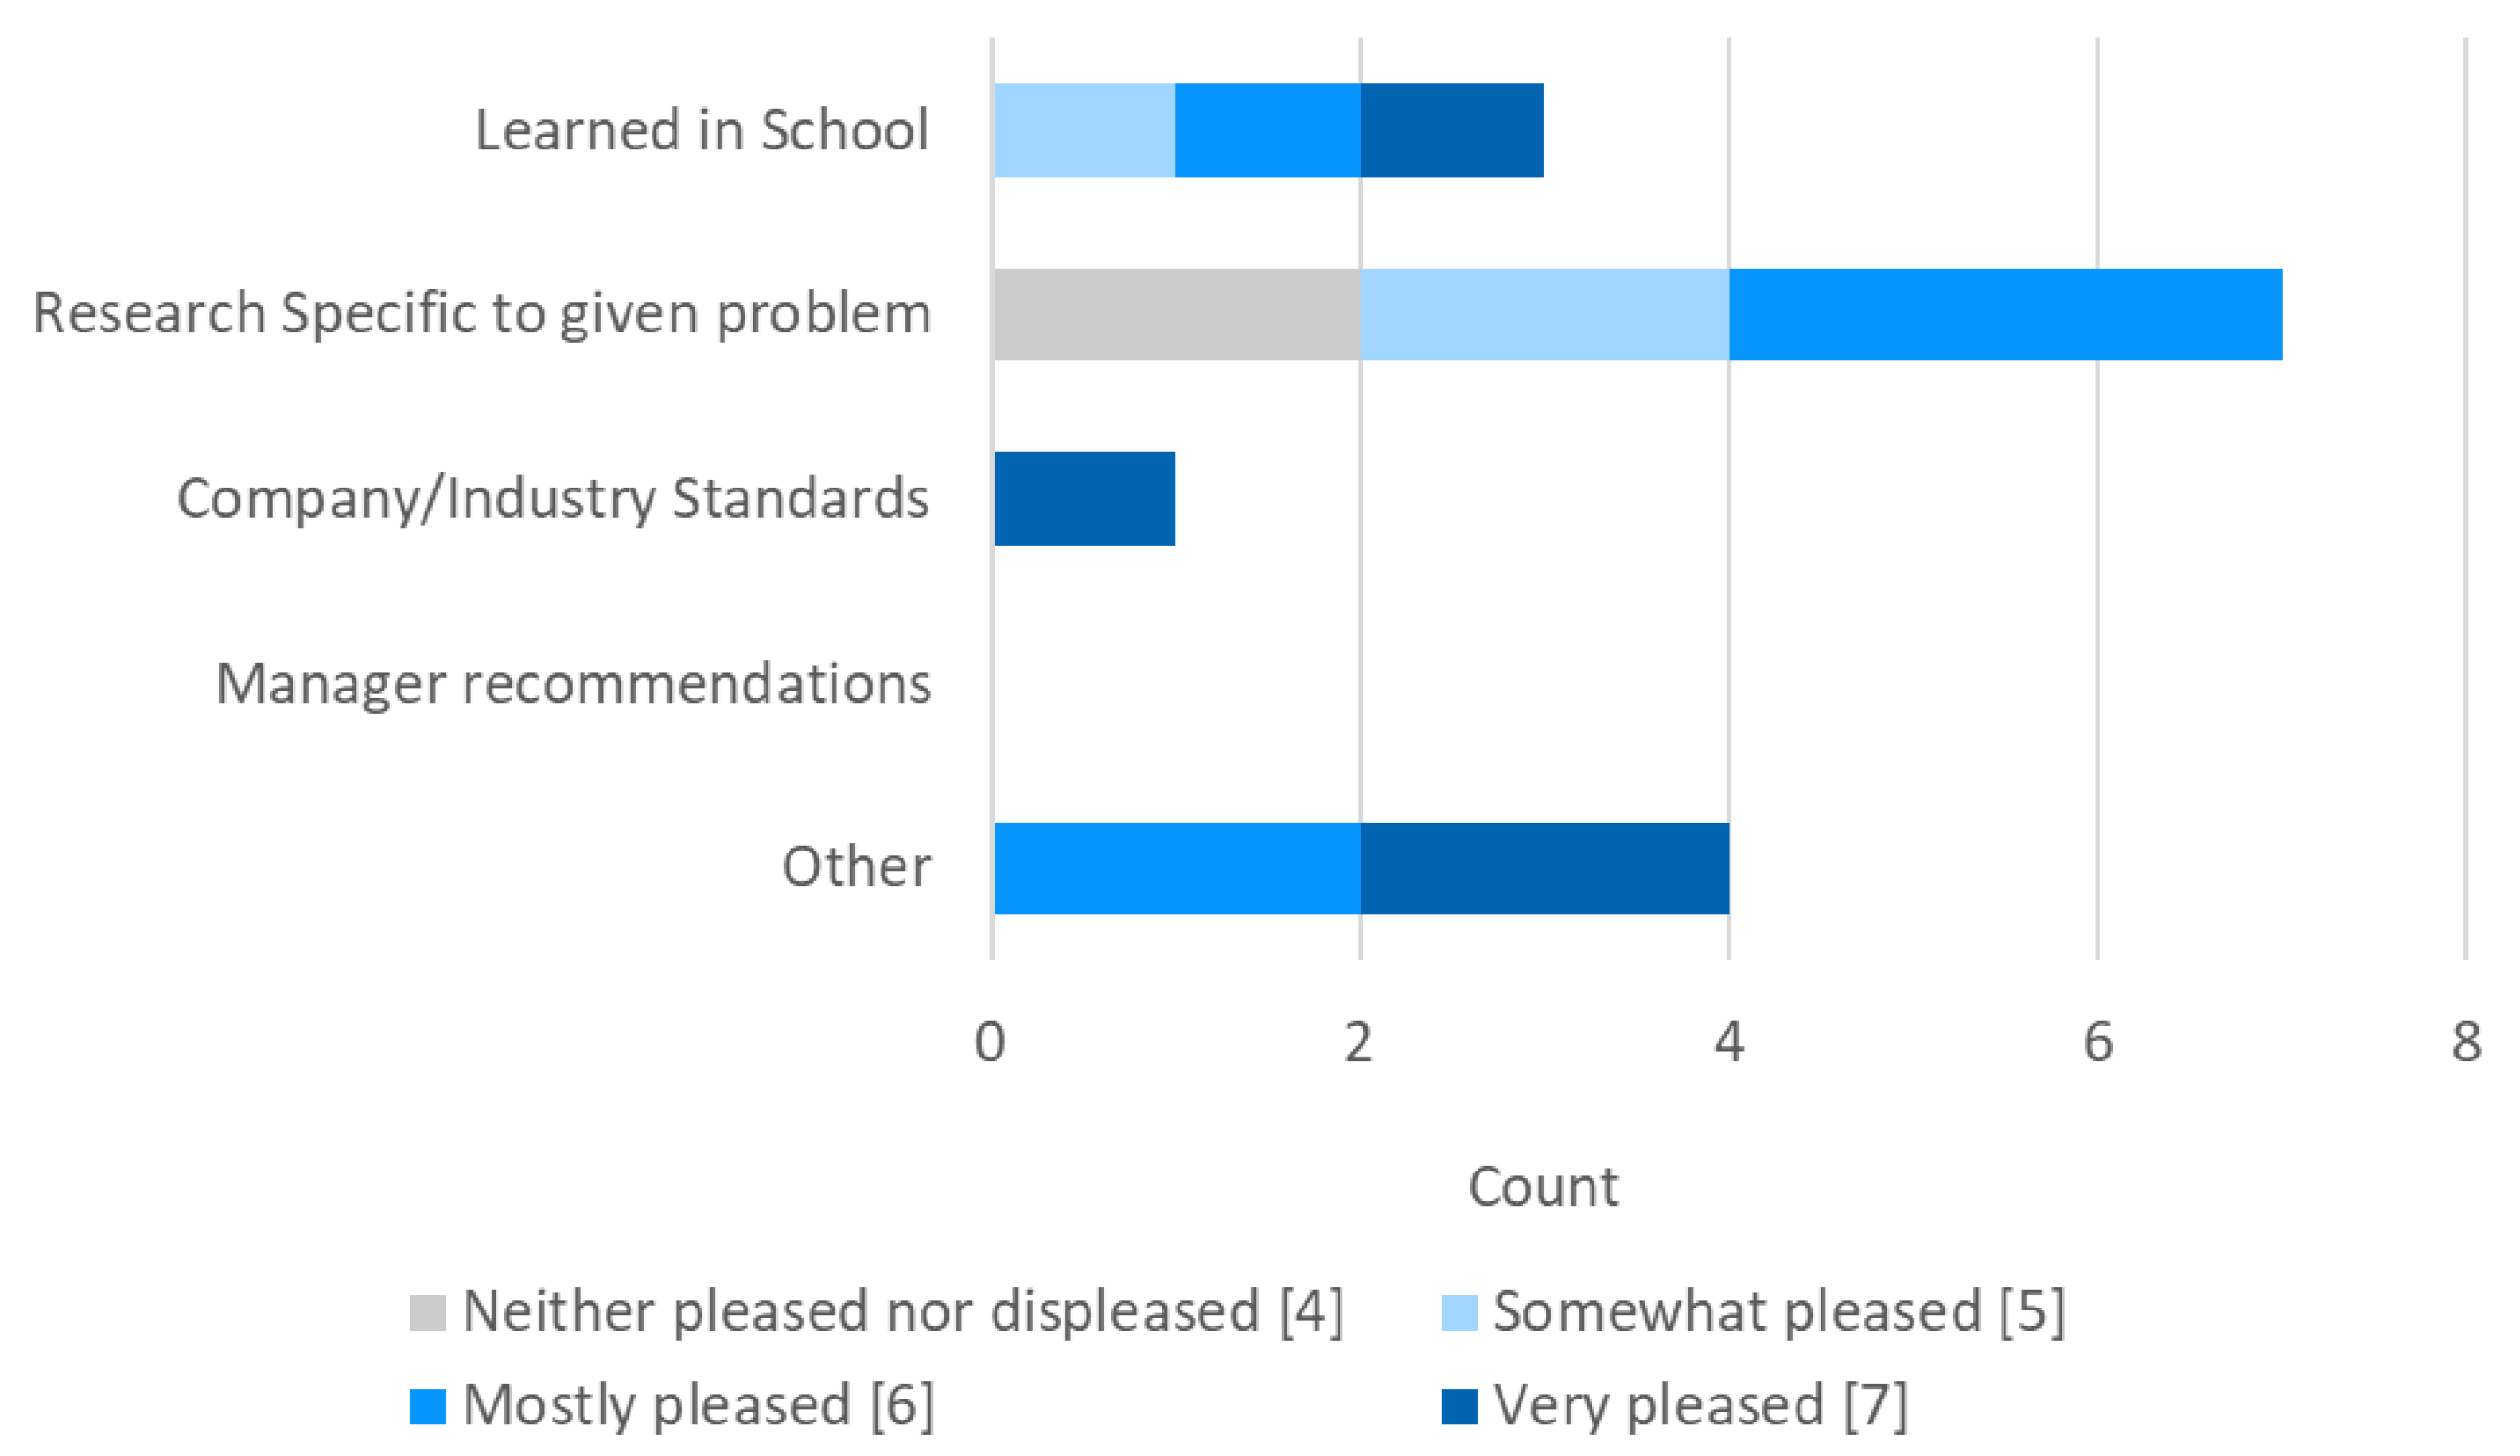
Designs 04 00004 g011
Figure 12. Respondent satisfaction with the way they approach design on 7-point scale, broken down by responses to why they approach design the way they do.
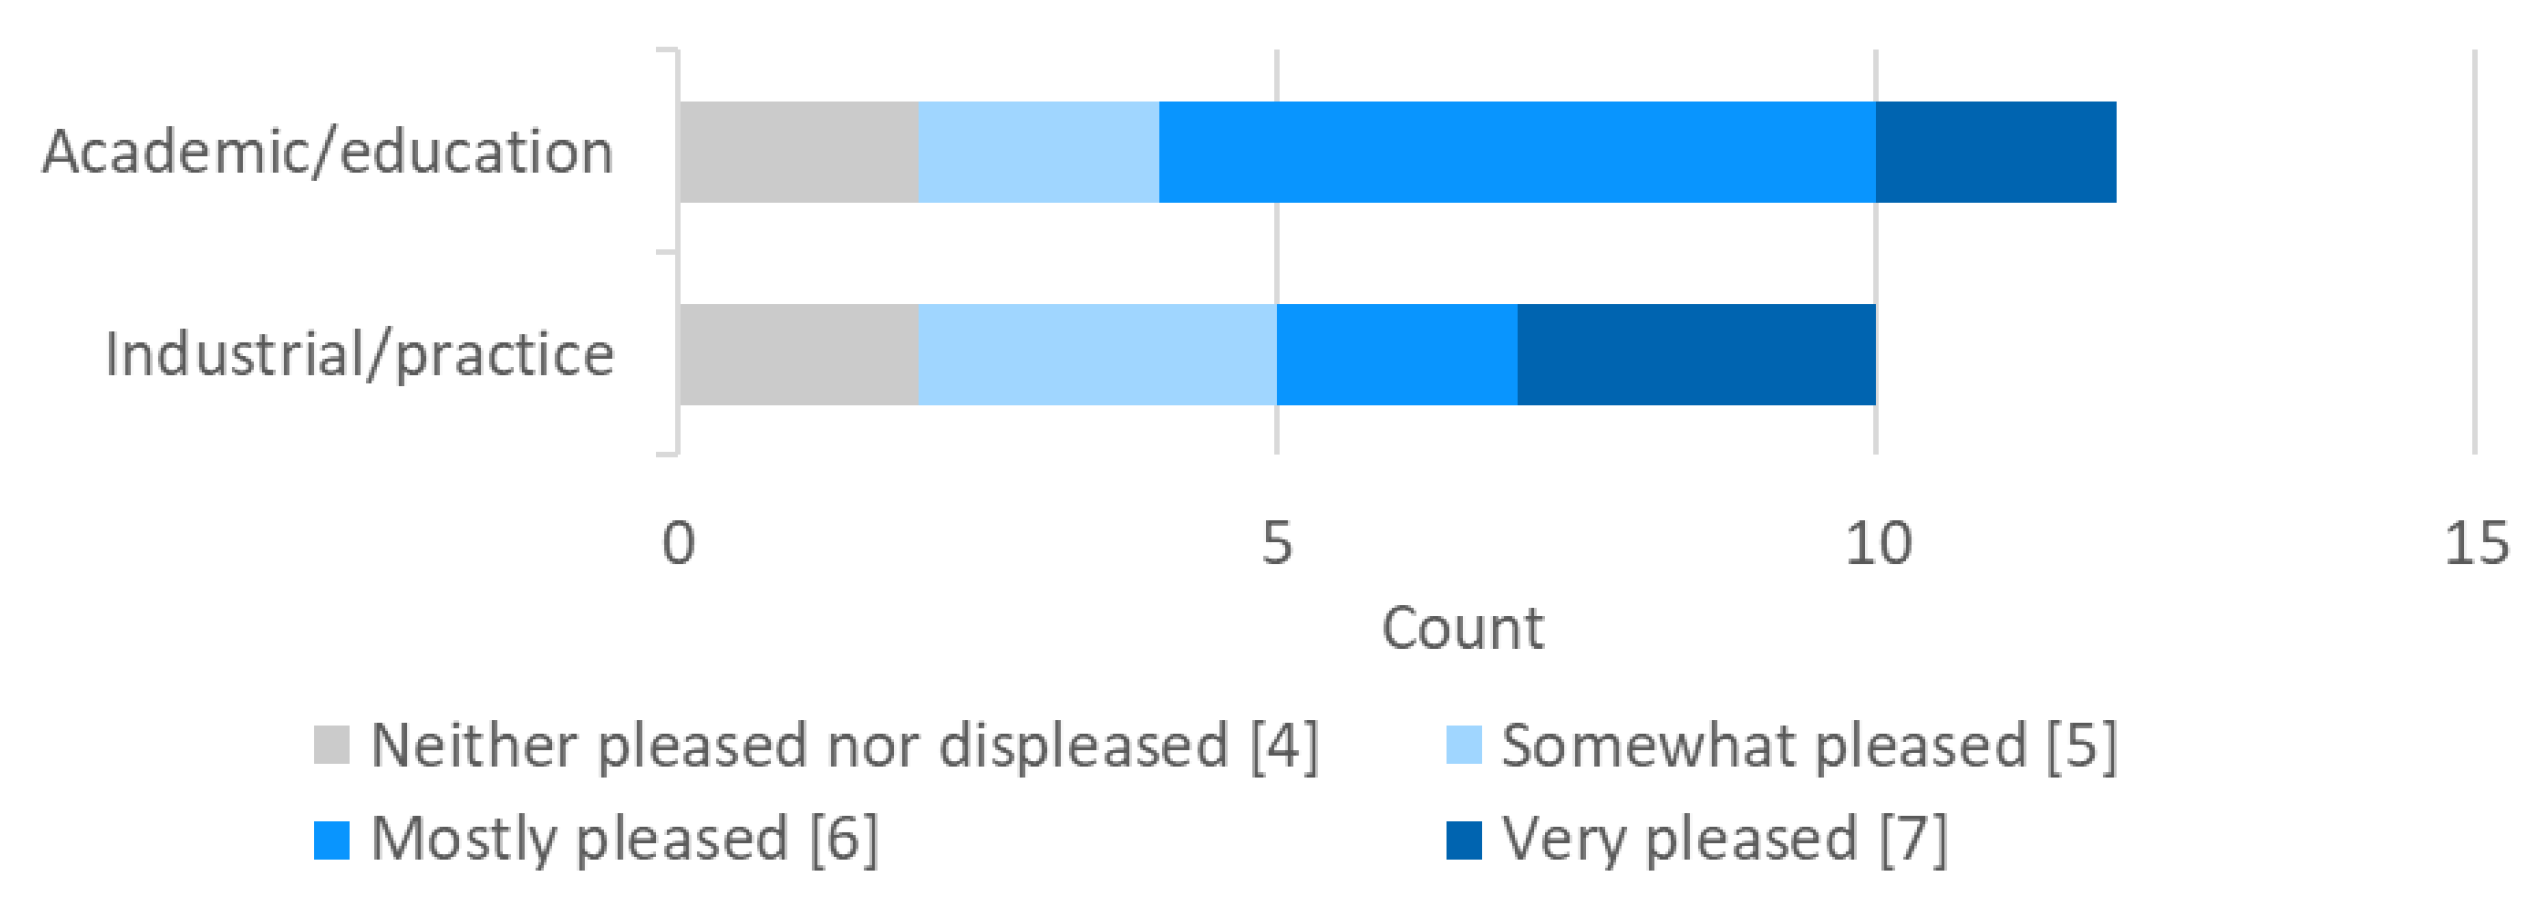
Designs 04 00004 g012
Figure 13. Respondent satisfaction with the way they approach design on 7-point scale, broken down by industry.
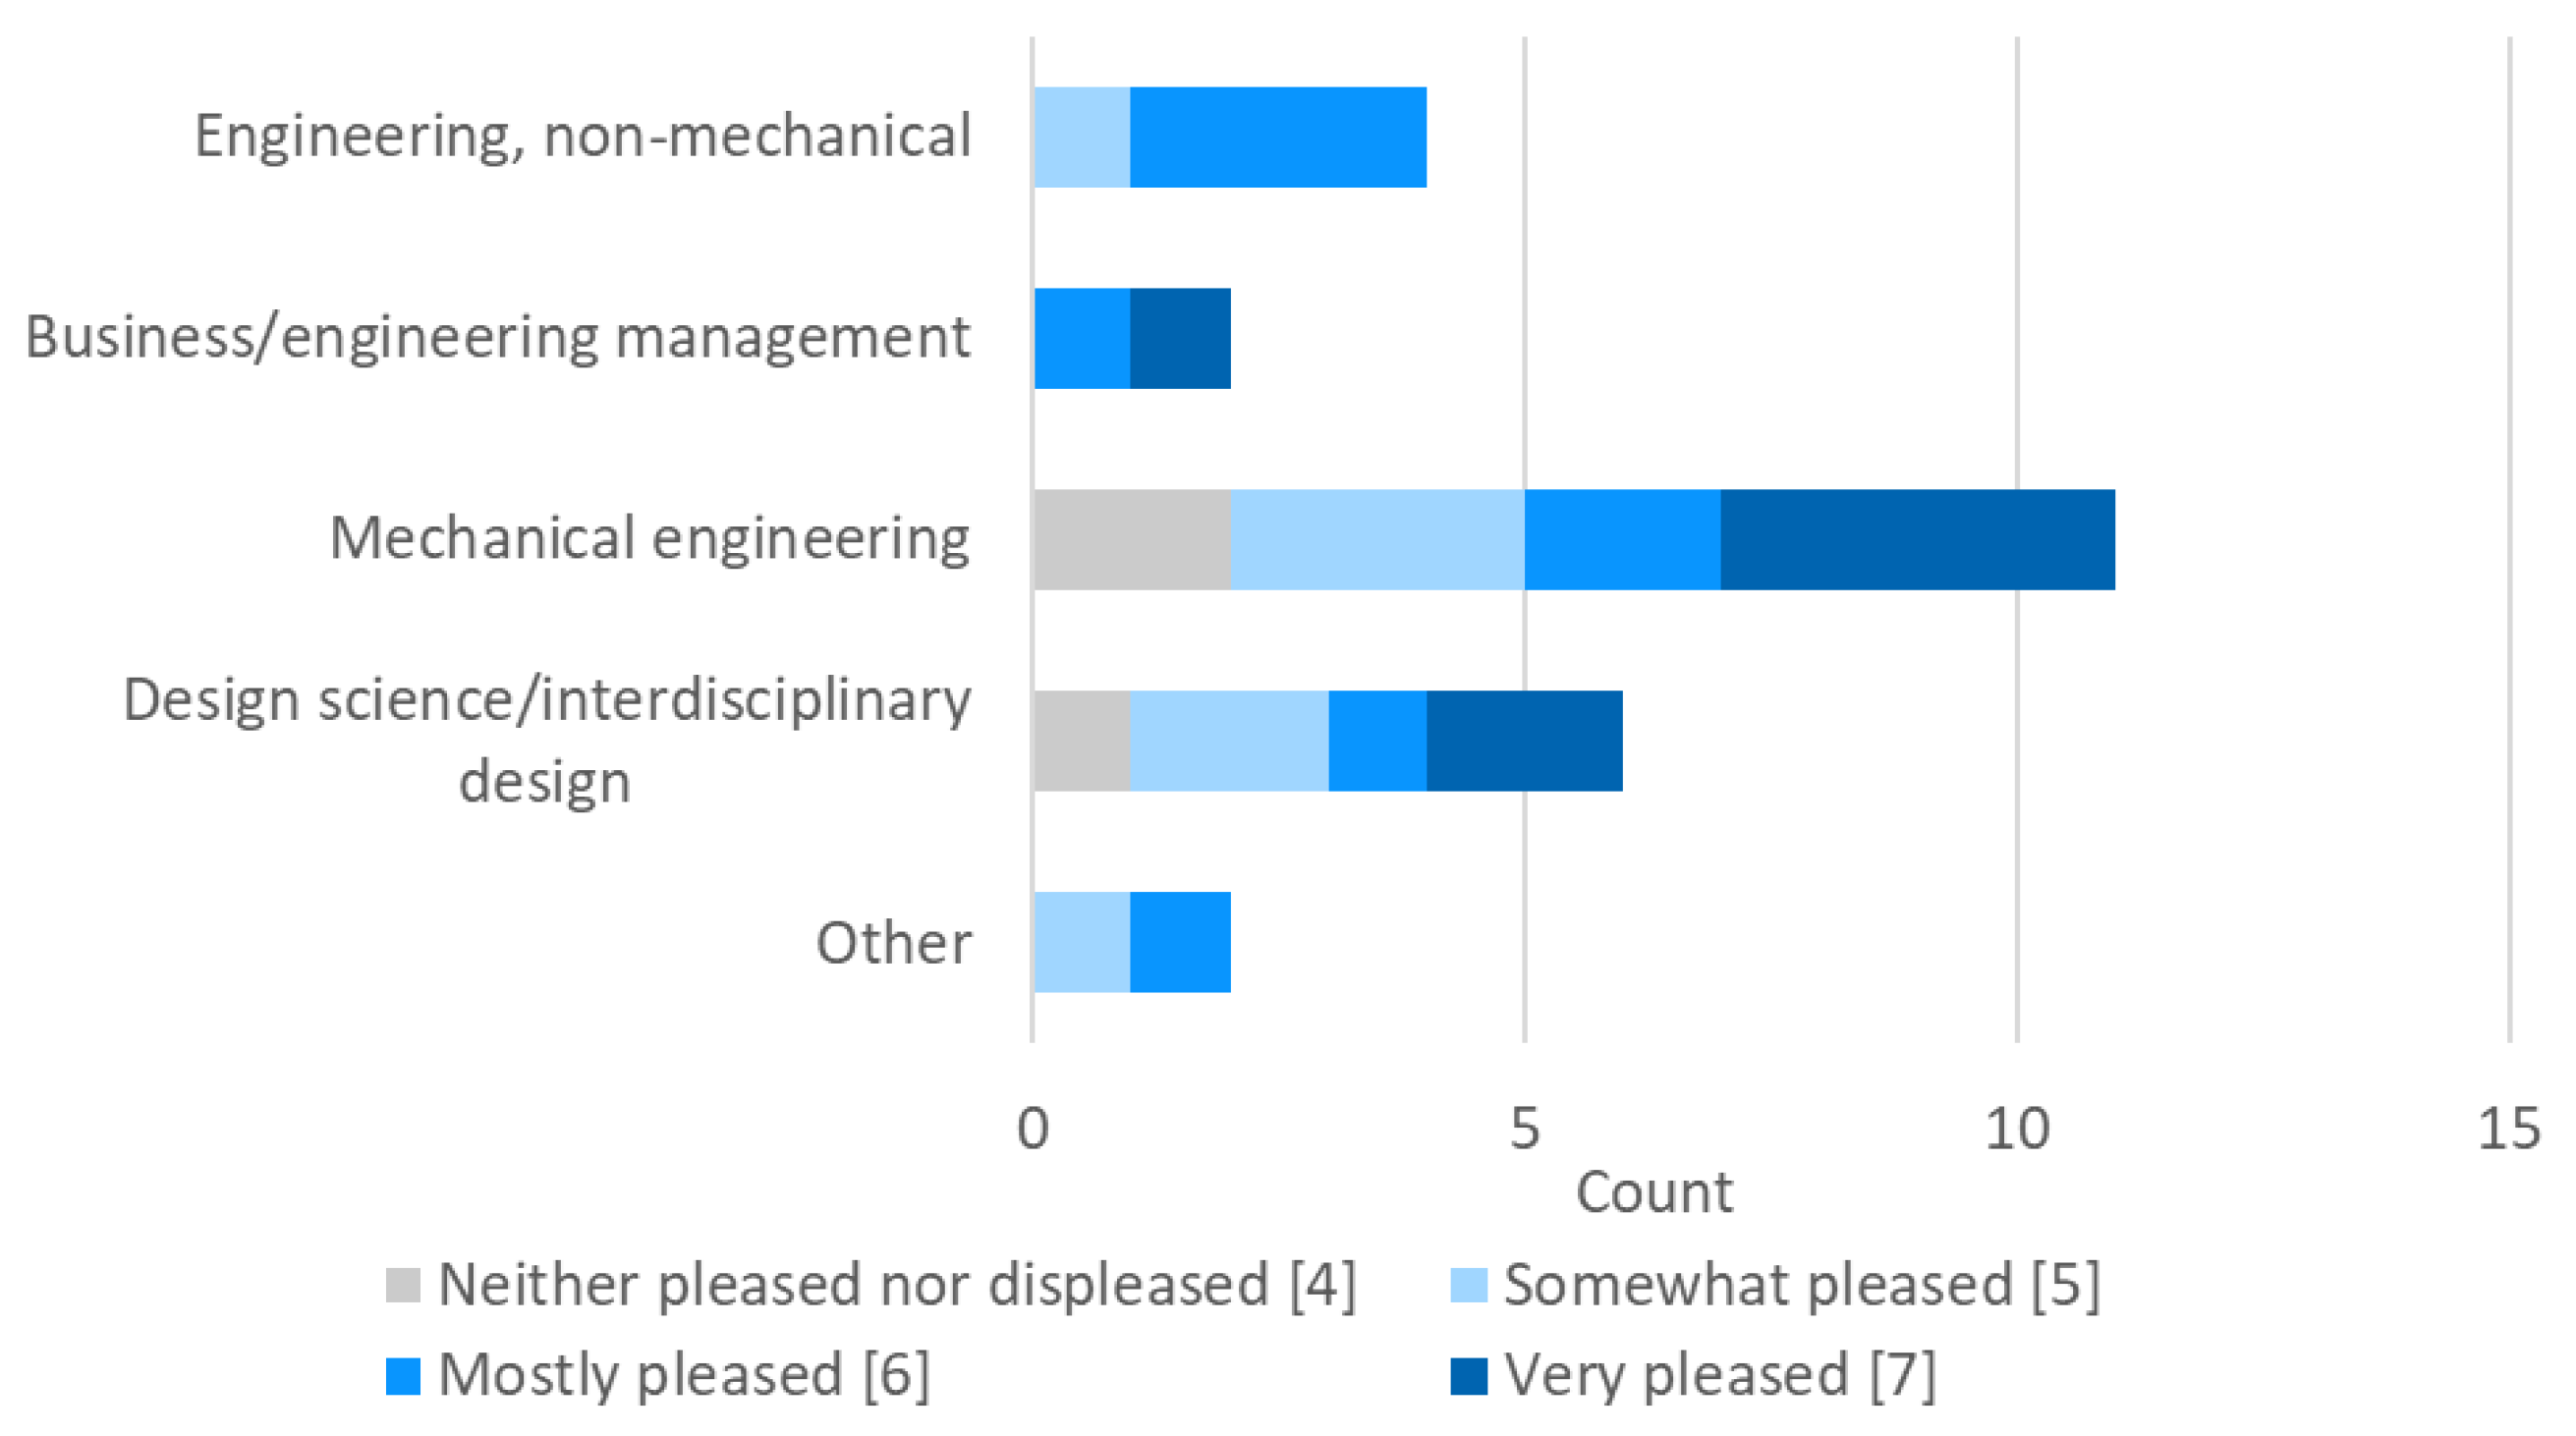
Designs 04 00004 g013
Figure 14. Respondent satisfaction with the way they approach design on 7-point scale, broken down by background; electrical, industrial, systems, and aerospace engineering categorized as engineering, non-mechanical; Business/management and engineering management grouped together.
Designs 04 00004 g014
Table 1. Well-established design approaches included in the review and PD Advisor.
ApproachAbbreviationTypeDisciplinary Origin
Design thinkingDTEnvironmentMechanical Engineering
Systems thinkingSTEnvironmentSystems Engineering
Total Quality ManagementTQMEnvironmentIndustrial Engineering
Agile developmentADEnvironmentSoftware Engineering
Waterfall processWPProcessSoftware Engineering
Engineering designEDProcessSoftware Engineering
SpiralSpProcessSoftware Engineering
Vee modelVMProcessSystems Engineering
Axiomatic designAxMethodSystems Engineering
Value-driven designVDDMethodSystems Engineering
Decision-based designDBDMethodMechanical Engineering
Lean manufacturingLMMethodIndustrial Engineering
Six Sigma6SMethodIndustrial Engineering
Theory of ConstraintsToCMethodIndustrial Engineering
ScrumScMethodSoftware Engineering
Extreme programmingXPMethodSoftware Engineering
Table 2. Engineering design approach reviews.
ReferenceScopeKey Takeaways
Otto and Wood (2003) [11]Describes design tools categorized into 4 design phasesDesign tools support other environments, processes, and methods; user journey maps can support DT, House of Quality can support ED
ine Van Boeijen et al.(2014) [35]Classifies design tools by phases of the design processDesign tools directly support specific design phases, while processes and approaches, including scrum, can be applied to many phases
ine Design Exchange [6]Lists tools with instructions for implementation and examples for eachA large number of design tools have been developed, and each has a specific place and value in its implementation
ine Camburn et al. (2017) [4], Foo et al. (2018) [5]Reviews methods and tools common to design thinking methodologies categorized by stages of discover, define, develop, and deliverDesign tools are specifically applied at different points in the design process and provide valuable information to users
ine Howard (2008) [36]Proposes a new model blending engineering design and creative thinkingCreativity is often overlooked in ED, though it presents a different problem-solving lens; integrating DT and DBD can better incorporate creativity and human factors through design
Chakrabarti and Blessing (2016) [3]Reviews models and theory of design researchMany descriptive and prescriptive design models have been proposed, which vary substantially in definition and implementation
ine Evbuomwan et al.(1996) [1]Reviews common definitions of design and the nature of the design process, connecting to specific design modelsProvides a basis for how to review and categorize design approaches
ine Gericke and Blessing (2011) [2]Compares specific aspects of design processes (e.g., stages, characteristics between disciplines, and criticisms)The comparative categories provide a reference for common characteristics to aid in a new categorization process
Table 3. Software development reviews.
ReferenceScopeKey Takeaways
Munassar and Govardhan (2010) [7]Compares 5 models of software engineering in detail, discussing advantages, disadvantages, and alterations of each modelThe different models in software engineering introduce specific aspects that can apply to projects differently based on their needs
ine Bhuvaneswari and Prabaharan (2013) [8]Introduces 17 common SDLC models, and provides a description, advantages, and disadvantages of eachEach model has unique characteristics that are important to consider; many newer models attempt to address the disadvantages of previous models
ine Arora and Arora (2016) [9]Introduces 9 common SDLC models, and provides a description, advantages, disadvantages, and when to use eachEach model is best used in certain scenarios, which relate to, but are separate from its advantages and disadvantages
Table 4. Design practitioner surveys.
ReferenceScopeKey Takeaways
Vredenburg et al. (2002) [38]Surveys design practitioners on user-centered design, identifying common approaches, success factors, and trade-offsCommonly cited measures and design processes differ from those that are applied in practice
ine Yang (2007) [37]Surveys design practitioners and engineering students to understand the approaches they employWhen designers are familiar with a model, they typically find it useful; provides a basis for creating a survey on design methods, and areas for improvement
Table 5. Criteria for differentiating design approaches.
CriterionDescriptionQuestion TypeLevels
ComplexityComplexity of intended problems or solutionsSlider1: Designing a shoehorn
2: Designing a water cup
3: Designing a ballpoint pen
4: Designing a toy car
5: Designing a scientific calculator
6: Designing a cell phone
7: Designing a small robot
8: Designing a laptop computer
9: Designing a new car
10: Designing a space shuttle
GuidanceLevel of guidance provided by approachSlider1: Minimally Structured
5: Maximally Structured
PhaseDevelopment phases covered by approachDouble ended slider1: Problem identification
2: Problem definition
3: Market research
4: Concept generation
5: Alternative evaluation
6: Detailed design
7: Prototyping
8: Verification and validation
9: Manufacturing specification
10: Business planning
11: Supply chain and logistics
Hard/SoftSuitability for hardware or software projectsSlider1: Fully hardware
5/6: Mixed
10: Fully software
ValuesValues the approach seeks to improveMultiple choice1: Deployment time
2: Cost reduction
3: Risk management
4: Market viability
UsersWhether the approach supports designers or managersSlider1: Managers/Organization
9: Designers/Product
Table 6. Authors’ classifications of approaches from Table 1 within criteria from Table 5.
ApproachComplexityGuidancePhasesHard/SoftValuesUsers
DT310-6547.3
ST610-10546.8
TQM827-10541.1
AD653-9811.7
WP472-9817.9
ED471-6148.4
Sp562-6535.6
VM1052-7536.2
AX543-6549
VDD743-4545.1
DBD732-9544.5
LM669-10323.4
6S868-10323.9
ToC637-10520.6
Sc542-91012.8
XP552-91012.3
Table 7. Respondents’ experience and backgrounds ( n = 15 ).
QuestionResponse# of Responses
Setting of experienceAcademic12
Industrial10
Job roleProfessor (any level)6
Consultant2
Other3
Years of experience1–51
5–159
15+5
Educational backgroundMechanical engineering11
Design7
Systems engineering2
Aerospace engineering1
Business/management1
Electrical engineering1
Engineering management1
Industrial engineering1
Chemical engineering1
Table 8. Number of respondents selecting and rating each approach, ordered by decreasing count.
ApproachCount
DT14
ED13
ST8
AD7
DBD7
WP6
LM6
VM5
6S5
Sc4
ToC2
VDD3
Sp1
Table 9. Combinations of approaches cited by respondents.
Combinations of ApproachesMentions
ST & ToC1
DT & TQM1
ST & All1
DT & AD1
VM & All1
DT & LM1
ED & LM1
All3
Table 10. Why respondents approach design the way they do.
Category# of Responses
I do research specific to the given problem to approach it uniquely7
I approach design the way I learned in school3
Other: I approach design based on my own experiences2
I follow company/industry standards for design1
Other: I approach design based on research and the way I learned in school1
Other: I approach design based on the customers needs1
I follow the recommendations of my managers0

