Abstract
The resilient modulus represents the subgrade soil stiffness, and it is considered one of the key material inputs in the Mechanistic Empirical Pavement Design Guide (MEPDG). The resilient modulus is typically estimated in the laboratory using a repeated load cyclic triaxial test, which is complex and time consuming to perform. Technical ability is also required to prepare the test specimens, particularly for coarse-grained soils. Therefore, there is a need to estimate the resilient modulus of coarse-grained soils from other simpler tests. In this study, correlations of resilient modulus with soil index properties and quick shear (QS) test results (quick shear strength, stress at 1% strain and tangent modulus) were developed for remolded coarse-grained soils, collected from different geographic regions in South Carolina. The developed models showed good correlations of resilient modulus to tangent modulus and soil index properties. The average tangent, modulus obtained from 30% and 50% of maximum stress of the QS tests, moisture content, optimum moisture content, dry unit weight, and maximum dry unit weight showed a statistically significant effect on estimating the resilient modulus for coarse-grained subgrade soils. The validation study confirms that the developed models can be used for predicting the resilient modulus for South Carolina coarse-grained soils.
1. Introduction
The characterization of subgrade soils is important for designing flexible pavements. The resilient modulus (Mr) represents subgrade soil stiffness, and is used to characterize subgrade soils in the Mechanistic Empirical Pavement Design Guide (MEPDG) [1]. The resilient modulus represent the elastic behavior, and the load carrying capacity of subgrade soils, under dynamic traffic loading. An accurate quantification of is required for designing an optimum pavement thickness and predicting flexible pavement performance [2,3]. The resilient modulus can be obtained using a repeated load cyclic triaxial test in the laboratory. However, the test necessitates special equipment and extensive and careful efforts to perform. The complexity, cost, time and sample preparation required for meaningful resilient modulus tests are often inconvenient for less critical projects. Therefore, the correlations of resilient modulus with soil index properties and other simpler tests have been developed by different studies. For instance, Yau and Quintus, and Titi et al. developed resilient modulus prediction models for fine-grained soils using index properties [4,5]. Louay et al. estimated the resilient modulus from soil index properties, California Bearing Ratio (CBR), and unconfined compressive strength (qu) [6]. The resilient modulus was correlated with conventional Unconfined Compression (UC) test results by Lee et al., where the UC test is the static triaxial compression test without confinement [7]. The resilient modulus test standard (AASHTO T307) includes a methodology for performing a UC test directly following a resilient modulus test, and is also known as the quick shear (QS) test [8]. Hossain and Kim developed resilient modulus prediction models for fine-grained soils from QS test [9]. Unlike the resilient modulus test, the QS test uses a static loading system, rather than a more complex cyclic loading system, and is quick, simple, less expensive, and easier to perform.
To date, most of the correlation studies have been focused on fine grained soils and there is limited data available for coarse grained soils. Hence, there is a need to develop models that relate the resilient modulus for coarse-grained soils with other simple test results. Rahman and Gassman developed statistical correlations between resilient modulus and soil index properties for undisturbed coarse-grained subgrade soils, but a validation study was not performed [10]. In this study, the correlation of resilient modulus for coarse-grained subgrade soils, with the results obtained from QS tests and soil index properties, was developed for remolded soils, collected from different geographic regions of South Carolina. The developed models were then validated with test results obtained using undisturbed subgrade soil samples collected from different locations.
2. Background
The QS test is a simple and relatively inexpensive test compared to the laboratory resilient modulus test. Therefore, some correlations have been made between QS test results and the resilient modulus. For fine grained soils, Lee et al. developed the following simple relationship between the resilient modulus () and the stress at 1 percent strain () (in psi) from a conventional UC test [7]. The equation is independent of moisture content or compaction unit weight:
Thomson and Robnett found correlations between resilient modulus and soil properties, qu and initial tangent modulus () from a UC test for fine-grained soils from Illinois [11]. The correlation between and (in psi) is as follows:
Hossain and Kim conducted a study to investigate a correlation between resilient modulus and the compression strength (qu) from a QS test for Virginia fine-grained soils [9]. The following model between qu (in psi) and was reported for coarse-grained soils in that study:
They found a good correlation ( = 0.73) between qu and resilient modulus.
The QS test is included in the AASHTO T307 standard and can be conducted at the end of a resilient modulus test, irrespective of the soil type. Whereas, UC is not recommended for coarse-grained soils. Unlike the UC test, the QS test allows the use of a rubber membrane to hold and run the test for any type of soil sample. No previous studies have shown any correlations of resilient modulus with UC tests or QS tests for coarse-grained soils, mainly because of the difficulties in performing these tests for cohesionless soils. Therefore, the purpose of this study is to investigate the feasibility of using QS test results to estimate the resilient modulus of coarse-grained soils.
3. Objectives of the Study
The objectives of this study are to:
- Perform index property tests, resilient modulus tests, and QS tests on reconstituted samples of coarse-grained soils collected from different regions of South Carolina.
- Develop correlation models for estimating the resilient modulus of coarse-grained soils from results obtained from QS tests and soil index properties.
- Perform resilient modulus and QS tests on Shelby tube samples obtained from different regions of South Carolina to validate the developed models.
4. Methodology
4.1. Soil Collection and Laboratory Index Tests
Subgrade soils were collected from three different Asphalt Concrete (AC) pavement sections that were located in three different counties and represent different geographic regions in South Carolina (Figure 1). South Carolina subgrade soils can be divided into two regions, separated by the geological fall line: The Blue Ridge/Piedmont Region and the Coastal Plain/Sediment Region. The soils in each region have different characteristics: Piedmont region soils are described as micaceous clayey silts and micaceous sandy silts, clays, and silty soils in partially drained condition; Coastal Plain soils, include fine sand that is difficult to compact [12]. The three selected pavement sections are from Orangeburg County (US-321, Coastal Plain near fall line), Georgetown County (US-521, Coastal Plain), and Pickens County (SC-93, Piedmont region). Figure 2 shows photographs of the soil collection and laboratory testing for this study. For each pavement section, the cores of asphalt, that were 15.24 cm in diameter, were collected from the center of the right lane at multiple locations along each section (Figure 2a). Around 23 kgs of bulk subgrade soil was collected at each core location for laboratory testing (Figure 2b). Shelby tube samples were also collected from the same boreholes prior to collecting the bulk soils. Shelby tube samples (7.62 cm diameter) were collected from the center of the borehole. Whereas, the bulk soil samples were collected from the side of the borehole at the same depth with the 15.24 cm diameter auger.
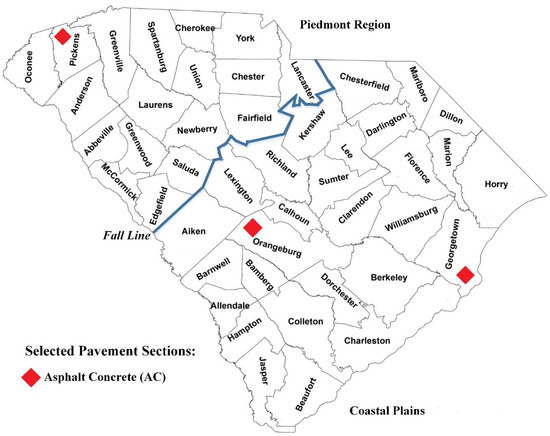
Figure 1.
Locations of Selected Pavement Sections.
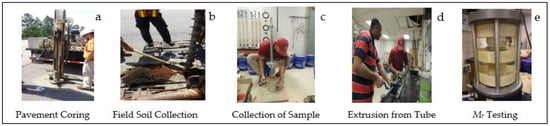
Figure 2.
Soil collection and laboratory testing.
The soil samples were transported to the laboratory for testing. Laboratory index tests included: grain size analysis (ASTM D6913/AASHTO T311), Atterberg Limits (ASTM D4318/AASHTO T90), specific gravity (ASTM D854/AASHTO T100), moisture content tests (ASTM D2216/AASHTO T265), maximum dry unit weight and optimum moisture content tests (ASTM D698/AASHTO T99), and soil classification per the Unified Soil Classification System (USCS) (ASTM D2488).
4.2. Sample Preparation for Resilient Modulus Tests
Specimens for Mr testing were prepared by compacting the soil in a 15.24 cm diameter and 17.78 cm high steel mold (i.e., the mold used for the California Bearing Ratio test). The soils were compacted in 4 layers, 65 blows per layer (a procedure developed for the work herein to achieve a unit weight similar to the in situ unit weight), and at three different moisture contents (optimum moisture content (OMC), +2% of OMC, and −2% of OMC). After the soil was compacted, a 7.62 cm diameter Shelby tube was pushed into the soil to collect a 7.62 cm × 15.24 cm cylindrical specimen (Figure 2c). The soil sample was extruded, as shown in Figure 2d. The extrusion process was done carefully to minimize disturbance to the coarse-grained soil. During the extrusion process, a rubber membrane was placed inside a 7.62 cm diameter mold and was kept air-tight using a continuous vacuum pressure. The mold was placed in the open end of the Shelby tube and the soil sample was extruded very slowly. A 7.62 cm diameter cylindrical metal rod was placed in the open end and moved backward at the same rate of extrusion to minimize disturbance. For the non-plastic poorly graded sands (SP), the effective cohesion, developed by preparing the specimens at OMC and +/−2% of OMC, helped minimize deformation. Following extrusion, volumetric strain was calculated to range from −1.38% to +0.23 for the SP soil samples (%fines < 1.5%). The other types of coarse-grained soils with a greater amount of fines (see Table 1) showed less disturbance. According to USCS, all soils tested herein are coarse-grained soils (50% fines). The soils with fines more than 40% have significant cohesion. Whereas, the soils with less than 1.5% fines have little cohesion.

Table 1.
Soil index properties.
High quality samples of the in-situ soil were collected and used for validation purposes. The samples were collected in 91 cm long and 7.62 cm diameter Shelby tubes at the same time, and from the same holes as the bulk soils were collected. The auguring method was performed by a dry auger method; no drilling fluid was used. The Shelby tubes were tightly sealed and stored in a 100% humidity room before being brought to the laboratory for testing. Each Shelby tube was cut into 5 samples that were 15.24 cm long, and extruded and inserted into a rubber membrane. The Shelby tube soil samples were extruded using the same methodology used for the laboratory prepared soil samples.
4.3. Resilient Modulus Tests
In this study, resilient modulus tests (AASHTO T307) were conducted in the laboratory directly following sample preparation (Figure 2e). Resilient modulus is determined by performing a repeated load triaxial compression test, where a repeated axial cyclic stress of fixed magnitude, load duration, and cycle duration is applied to a cylindrical test specimen. During testing in a triaxial pressure chamber, the specimen is subjected to a dynamic cyclic stress and a static stress. The total recoverable axial deformation response of the specimen is measured and used to estimate the resilient modulus. A photograph, showing a soil specimen in a triaxial chamber, is shown in Figure 2e. The general constitutive equation for resilient modulus, that was selected for implementation in the MEPDG, was developed through the National Cooperative Highway Research Program (NCHRP) project 1-28A as follows [13],
where is atmospheric pressure (101.325 kPa), is bulk stress = , is the major principal stress, is the intermediate principal stress and is equal to for axisymmetric condition (triaxial test), is the minor principal stress (or confining pressure in the repeated load triaxial test), is the octahedral shear stress, and , and are model parameters or material constants. This model can be used for any type of soil.
4.4. Quick Shear Test
A QS test is a type of static compression test. In this study, the QS test was performed with the same sample after finishing the laboratory resilient modulus test without removing the sample from the testing platen. This procedure is in accordance with AASHTO T307. The rate of axial deviator loading was 1 percent strain per minute and stress and strain values were recorded until 10% strain. No confining pressure was applied during the QS test similar to the stress conditions in a UC test (ASTM D2166). However, the rubber membrane was still present around each sample, thus keeping the moisture in the specimen and preventing collapse prior to loading. From the QS test, the compressive strength of the soil (qu), stress at 1% strain (S1%), and the average tangent modulus (Eavg), which is the average of the elastic tangent modulus obtained at 30% and 50% of the maximum stress, were determined as shown in Figure 3.
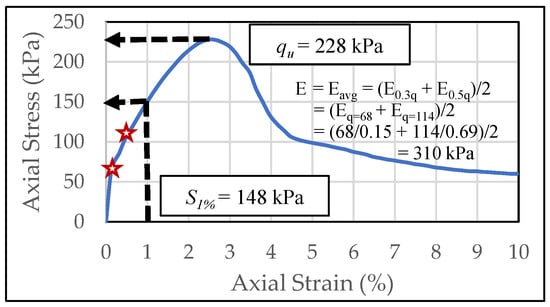
Figure 3.
Quick shear (QS) Test Results.
4.5. Multiple Linear Regression
The multiple linear regression model technique was used to develop the resilient modulus models. The multiple linear regression model contains more than one predictor/independent variable and the effect of all specified predictor/independent variables are considered at the same time. If the response variable is quantitative and at least one predictor variable is quantitative, then the multiple linear regression models have the following form,
where = response variable (e.g., resilient modulus); = intercept; = coefficients; and = predictor variables (e.g., moisture content, dry unit weight, compressive strength, tangent modulus, etc.). The intercept indicates the value of when all s are 0. The regression coefficient indicates the change in the mean response corresponding to a unit change in when all other s are held constant, .
5. Results and Discussions
5.1. Index Test Results
Table 1 shows the index test results for samples collected from 7 different boreholes at three different sites. According to USCS, Orangeburg soils were classified as SC (clayey sand), SM (silty sand) and SC-SM (sandy silty clay), Georgetown soils were classified as SP (poorly grades sand), and Pickens soils were classified as SM (silty sand) and SC (clayey sand). All soils are coarse-grained per USCS with fines contents ranging from 1% to 44%. Therefore, coarse-grained soils, which have a wide range of fines and cohesion, have been studied herein.
5.2. Resilient Modulus Test Results
Resilient modulus tests were performed for soils from each borehole and samples were prepared at OMC, −2%OMC, and +2%OMC to study the effect of moisture content. Table 2 presents the calculated resilient modulus at the bulk stress of 154.64 kPa and the octahedral stress of 13 kPa, along with the moisture content, dry unit weight, and QS test results. It was observed that, with increasing moisture content, the resilient modulus decreases. This observation agrees with previous literature [5,14,15,16,17,18,19].
Table 2.
Summary of resilient modulus and quick shear (QS) test results for remolded specimens.
5.3. Quick Shear Test Results
Table 2 shows compressive strength (qu), stress at 1% strain (S1%), and average tangent modulus (Eavg) of 30% and 50% of compressive strength, that were obtained from the QS tests, performed on each sample at the end of each resilient modulus test. No distinct relation between qu or S1% was observed with moisture content for the different coarse-grained soils. However, Eavg increased with decreasing moisture content for most samples. Figure 4 shows the stress-strain diagrams for different samples at different moisture contents. It was observed that for SC soils (O-1 and P-2), the compressive strength decreases with increasing moisture content, and the highest qu was observed for the dry of optimum sample. A similar pattern was observed for Pickens SM soils (P-1). However, the reverse pattern was observed for the Orangeburg SM soils (O-2) where compressive strength increased for deceasing moisture content, and the highest qu was observed for the sample wet of optimum. For the mixed soils (i.e., SC-SM (O-2)), a higher compressive strength was found at optimum moisture content. For the SP soils (G-1, G-2), the sample dry of optimum showed a lower qu than the samples that were at optimum or wet of optimum. The samples that were at optimum and wet side of optimum showed a similar trend to the SP soils. A previous study showed qu always increases with decreasing moisture content for SC, SM, and SC-SM soil types [9]. QS test results for SP were not reported in any previous literature.
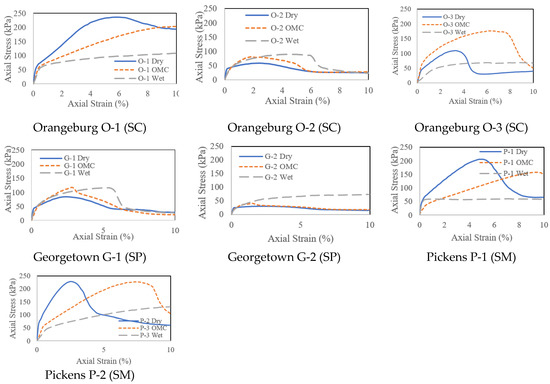
Figure 4.
QS Test Results.
6. Development of Resilient Modulus Model
Using multiple linear regression, the resilient modulus (at the reference bulk stress of 154.64 kPa and the reference octahedral shear stress of 13 kPa (according to the layer elastic analysis for South Carolina pavements using Weslea [20]) was correlated with soil index properties: Soil moisture content (MC), dry unit weight (DUW), optimum moisture content (OMC), maximum dry unit weight-unit weight (MDUW), percent passing No. 4 (P4), No. 40 (P40), No. 200 sieve (P200), D60, D50, D30, D10, uniformity coefficient (Cu), coefficient of curvature (Cc), liquid limit (LL), plastic limit (PL), plasticity index (PI), liquidity index (LI), specific gravity (Gs), percent sand, silt, and clay, and QS test results: Compressive strength (qu), stress at 1% strain (S1%), and average modulus value (Eavg). The developed resilient modulus models are shown in Table 3. A coefficient of determination (R2) of 0.76 was found for the first developed model of resilient modulus with average tangent modulus and index properties, which can be considered a good correlation (Table 3a). A fair coefficient of determination was observed for the second and third developed models (Table 3b,c). The second model correlates with the resilient modulus of the QS test results (qu, S1%, Eavg). Whereas, the third model correlates resilient modulus with only the average tangent modulus (Eavg).
Table 3.
Developed resilient modulus models.
Table 3 shows the significance of the different index properties and QS test parameters on resilient modulus values and the overall model significance using p-value, where p < 0.001 indicates a statistically highly significant effect, and p < 0.01, and p < 0.05 indicate statistically moderate and low significant effects, respectively. A p-value of overall model significance (F) indicates that these models have statistically highly significance. Among all of the different variables, only 5 variables showed a statistically significant effect on resilient modulus prediction, used in Model 1. Four soil index properties: MC, OMC, DUW, MDUW, and one variable from the QS tests: Eavg have a statistically significant effect on the first resilient modulus prediction model. Eavg from the QS tests had statistically highly significant effect on that model. DUW and MDUW have statistically moderate significant effect, and the MC and OMC content has a statistically low significant effect on the resilient modulus. Compressive strength (qu) showed a statistically low significant effect on resilient modulus and the stress at 1% strain S1% did not show a statistically significant effect on resilient modulus models for coarse-grained soils in Model 2. However, some previous studies on fine-grained soils showed that stress at 1% strain (S1%) and compressive strength (qu) have a statistically significant effect on resilient modulus models [5,7]. A negative value of the regression coefficient (β) for the MC and OMC indicate that, if other parameters are kept constant, an increase in moisture content or optimum moisture content will result in a decrease in the resilient modulus. DUW and Eavg showed positive β values, hence resilient modulus will increase if either the dry unit weight or tangent modulus increase. However, the MDUW has negative β values; that means if the maximum dry unit weight increases, the resilient modulus will decrease.
The estimated resilient modulus from the developed models, and the measured resilient modulus values were compared and shown in Figure 5. Most of the data points were found close to the line of equity with good coefficient of determination values for all three models. Note that the correlations developed in this study need to be used with an understanding of the limitations in using the QS test to predict Mr. The QS test is a static compression test and qu represents the strength of the soil in an unconfined state (with a rubber membrane to hold the sample). Whereas, the resilient modulus test is a cyclic test and Mr represents the stiffness of the soil. In a QS test, a constant strain (usually 1%/min.) is applied with no confining pressure until the specimen fails. In the Mr test, different cyclic loading is applied to the specimen at different confining pressures. In total, 1500 cycles of different deviatoric loads (ranging from 24.8 kPa to 62 kPa) are applied in a Mr test with a small load duration (0.1 s). Therefore, the samples do not reach a state of failure.
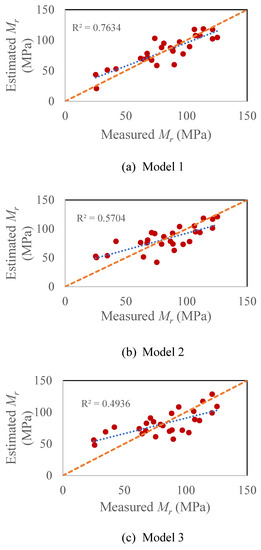
Figure 5.
Estimated and Measured Resilient Modulus: (a) Model 1 is a correlation between Mr and Eavg, MC, OMC, DUW, MDUW (b) Model 2 is a correlation between Mr and qu, S1%, (c) Model 3 is a correlation between Mr and Eavg.
7. Validation of the Developed Model
In this study, the remolded (i.e., laboratory prepared) soils samples were used to develop resilient modulus models for coarse-grained soils. To validate the developed models for field conditions, tests were performed on Shelby tube soil samples, that were collected from the exact same boreholes where the bulk soils were collected, as discussed in Section 4.1. At least one undisturbed sample was tested for each of the seven borehole locations. Table 4 shows a summary of the results for the undisturbed soil samples. There was a total of 19 tests. Resilient modulus at the same reference stresses as the remolded soils, QS model parameters, field moisture content, and field dry unit weight are shown. The results did not show any distinct pattern of resilient modulus with field moisture content, maximum dry unit weight, or depth of the samples collected (Sample No. 1, and Sample No. 5 represent samples collected from the topmost and bottommost part of the Shelby tube, respectively). Figure 6 shows the validation of the developed model for the undisturbed soil samples tested. Most of the data points are close to the line of equity and a fair coefficient of determination was observed (R2 = 0.49) for Model 1 (Figure 6a). Therefore, the validation study confirms that this developed model (as a function of average tangent modulus, moisture content, optimum moisture content, dry unit weight, and maximum dry unit weight) can be used for predicting the resilient modulus for South Carolina coarse-grained soils. However, the other two models underpredict the field resilient modulus.
Table 4.
Summary of results for tests performed on Shelby tube samples.
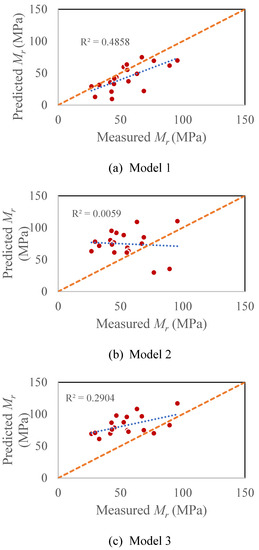
Figure 6.
Validation of Developed Model for Undisturbed Soil Samples: (a) Model 1 is a correlation between Mr and Eavg, MC, OMC, DUW, MDUW (b) Model 2 is a correlation between Mr and qu, S1%, (c) Model 3 is a correlation between Mr and Eavg.
8. Limitations of Models and Future Recommendations
The predicted and measured resilient modulus showed the applicability of the developed models for Model 1. There were some limitations to the sample size, which might cause inaccurate estimates, especially in the case of Model 2, and Model 3. To overcome this limitation, it is recommended to obtain more resilient modulus test results and update the models. A few newer variables (i.e., soil suction) could be incorporated to help reduce potential bias. Finally, it is also recommended that the non-linear regression models are developed to more accurately capture the in-situ behavior of subgrade soils resilient modulus.
9. Conclusions
The following conclusions were made based on the current study:
- The resilient modulus value for coarse-grained subgrade soil can be estimated from Eavg and the index test results, with an R2 value of 0.76. Among 24 different variables only 5 variables showed a statistically significant effect on resilient modulus prediction model: Moisture content, optimum moisture content, dry unit weight, maximum dry unit weight, and average tangent modulus from a QS test.
- No distinct relation between moisture content and qu or S1% from the QS tests was observed for different coarse-grained soils. However, Eavg increased with decreasing moisture content, with few exceptions.
- The validation study, performed using field samples collected from Shelby tubes, showed that most of the data points, of measured and predicted resilient modulus, are close to the line of equity. A fair coefficient of determination was observed (R2 = 0.49) for the model developed from average tangent modulus and index properties (moisture content, optimum moisture content, dry unit weight, and maximum dry unit weight). Therefore, this model can be used for predicting resilient modulus for South Carolina coarse-grained soils.
Author Contributions
Conceptualization, M.M.R. and S.G.; methodology, M.M.R.; validation, K.M.I.; formal analysis, M.M.R. and K.M.I.; investigation, M.M.R.; resources, M.M.R.; data curation, M.M.R. and K.M.I.; writing—original draft preparation, M.M.R.; writing—review and editing, K.M.I. and S.G.; visualization, M.M.R.; supervision, S.G.; project administration, S.G.; funding acquisition, S.G.
Funding
This research is funded by the South Carolina Department of Transportation (SCDOT), Grant No. SPR 732. Calibration of the AASHTO Pavement Design Guide to South Carolina Condition—Phase II.
Acknowledgments
This paper was based on research supported by the South Carolina Department of Transportation (SCDOT) and the Federal Highway Administration (FHWA) under contract SPR 732: Calibration of the AASHTO Pavement Design Guide to SC Conditions—Phase II. The opinions, findings, and conclusions expressed herein are those of the authors and not necessarily those of the SCDOT or FHWA.
Conflicts of Interest
The authors declare no conflict of interest.
References
- Gassman, S.L.; Rahman, M.M. Calibration of the AASHTO Pavement Design Guide to South Carolina Conditions-Phase I; Report FHWA-SC-16-02; Federal Highway Administration: Washington, DC, USA, 2016.
- Rahman, M.T.; Tarefder, R. Assessment of Molding Moisture and Suction on Resilient Modulus of Lime Stabilized Clayey Subgrade Soils. Geotech. Test. J. 2015, 38, 840–850. [Google Scholar] [CrossRef]
- Ng, K.; Henrichs, Z.R.; Ksaibati, K.; Wulff, S.S. Measurement and Estimation of the Resilient Modulus of Subgrade Materials for Mechanistic-Empirical Pavement Design Guide in Wyoming. In Proceedings of the Transportation Research Board Annual Meeting, Washington, DC, USA, 10 January 2016; pp. 1–17. [Google Scholar]
- Yau, Q.; Von Quintus, H.L. Predicting Elastic Response Characteristics of Unbound Materials and Soils. Transp. Res. Rec. J. Transp. Res. Board 2004, 1874, 47–56. [Google Scholar] [CrossRef]
- Titi, H.H.; Elias, M.B.; Helwany, S. Determination of Typical Resilient Modulus Values for Selected Soils in Wisconsin; Mitchell Hall, Office of Research Services and Administration, University of Wisconsin-Milwaukee: Milwaukee, WI, USA, 2006. [Google Scholar]
- Louay, M.N.; Huang, B.; Puppala, A.J. Regression Model for Resilient Modulus of Subgrade Soils. Transp. Res. Rec. J. Transp. Res. Board 1999, 1687, 47–54. [Google Scholar]
- Lee, W.; Bohra, N.C.; Altschaeffl, A.G.; White, T.D. Resilient Modulus of Cohesive Soils. J. Geotech. Geoenviron. Eng. 1997, 105, 131–135. [Google Scholar] [CrossRef]
- AASHTO T 307. Determining the Resilient Modulus of Soils and Aggregate Materials. In Standard Specifications for Transportation Materials and Methods of Sampling and Testing; American Association of State Highway and Transportation Officials (AASHTO): Washington, DC, USA, 2003. [Google Scholar]
- Hossain, M.S.; Kim, W.S. Estimation of Subgrade Resilient Modulus for Fine-Grained Soil from Unconfined Compression Test. Transp. Res. Rec. J. Transp. Res. Board 2015, 2473, 126–135. [Google Scholar] [CrossRef]
- Rahman, M.M.; Gassman, S.L. Effect of Resilient Modulus of Undisturbed Subgrade Soils on Pavement Rutting. Int. J. Geotech. Eng. 2017, 13, 152–161. [Google Scholar] [CrossRef]
- Thompson, M.R.; Robnett, Q.L. Resilient Properties of Subgrade Soils. J. Transp. Eng. 1979, 105, 71–89. [Google Scholar]
- Rahman, M.M.; Gassman, S.L. Data Collection Experience for Preliminary Calibration of the AASHTO Pavement Design Guide for Flexible Pavements in South Carolina. Int. J. Pavement Res. Technol. 2018, 11, 445–457. [Google Scholar] [CrossRef]
- NCHRP 1-28A. Laboratory Determination of Resilient Modulus for Flexible Pavement Design. In Research Results Digest; Transportation Research Board: Washington, DC, USA, 2004; pp. 1–52. [Google Scholar]
- Butalia, T.S.; Huang, J.; Kim, D.G.; Croft, F. Effect of Moisture Content and Pore Water Pressure Build on Resilient Modulus of Cohesive Soils. In Resilient Modulus Testing for Pavement Components; ASTM STP 1437; ASTM International: West Conshohocken, PA, USA, 2003. [Google Scholar]
- Drumm, E.C.; Reeves, J.S.; Madgett, M.R.; Trolinger, W.D. Subgrade Resilient Modulus Correction for Saturation Effects. J. Geotech. Geoenviron. Eng. 1997, 123, 663–670. [Google Scholar] [CrossRef]
- Fredlund, D.G.; Bergan, A.T.; Wong, P.K. Relation between Resilient Modulus and Stress Conditions for Cohesive Subgrade Soils. Transp. Res. Rec. J. Transp. Res. Board 1977, 642, 73–81. [Google Scholar]
- Heydinger, A.G. Evaluation of Seasonal Effects on Subgrade Soils. Transp. Res. Rec. J. Transp. Res. Board 2003, 1619, 94–101. [Google Scholar] [CrossRef]
- Huang, J. Degradation of Resilient Modulus of Saturated Clay Due to Pore Water Pressure Buildup under Cyclic Loading. Master’s Thesis, Ohio State University, Columbus, OH, USA, 2001. [Google Scholar]
- Mohammad, L.N.; Puppala, A.J.; Alavilli, P. Influence of Testing Procedure and LVDT Location on Resilient Modulus of Soils. Transp. Res. Rec. J. Transp. Res. Board 1994, 1462, 91–101. [Google Scholar]
- Chou, Y.T. A Computer Program for Evaluation and Overlay Design of Roads, Streets and Open Storage Areas Using Nondestructive Testing and Elastic Layered Method-WESROAD (No. WES/MP/GL-94-2); Army Engineer Waterways Experiment Station Vicksburg Ms Geotechnical Lab: Vicksburg, MS, USA, 1994. [Google Scholar]
© 2019 by the authors. Licensee MDPI, Basel, Switzerland. This article is an open access article distributed under the terms and conditions of the Creative Commons Attribution (CC BY) license (http://creativecommons.org/licenses/by/4.0/).