Article

Effects of Mix Factors on the Mechanistic-Empirical Flexible Pavement Design

by
Md Rashadul Islam
*,
Sylvester A. Kalevela
and
Shelby K. Nesselhauf
Department of Engineering Technology, Colorado State University, Pueblo, CO 81001, USA
*
Author to whom correspondence should be addressed.
Designs 2019, 3(3), 36; https://doi.org/10.3390/designs3030036
Submission received: 8 June 2019 / Revised: 4 July 2019 / Accepted: 6 July 2019 / Published: 10 July 2019

Abstract

:
This study investigates the sensitivity of the mechanistic-empirical flexible pavement design performance parameters such as cracking, rutting, and smoothness to mix factors for 11 categories of hot-mix asphalt (HMA) mixtures. For each category of HMA mixture, the variations in the pavement performances for different effective binder content (Vbe), air void (Va), voids-in-mineral aggregates (VMA), voids-filled-with asphalt (VFA), and asphalt content (AC) are examined by the AASHTOWare Pavement Mechanistic-Empirical Design, simply the AASHTOWare software analysis. Five types of distresses: international roughness index (IRI), total rutting, rutting in the HMA layer, bottom-up fatigue cracking, and top-down longitudinal fatigue cracking are considered in the analysis. Results show that the prediction of distresses values after 20-year of service life using the AASHTOWare software may differ by up to 170% for different specimens of a certain mix design. All distresses, except rutting, increase in Va, VMA, and VFA. Rutting in HMA increases with an increase in VMA and VFA, and is insensitive to Vbe, Va, and AC in the study range of these parameters.

1. Introduction

In the AASHTOWare Pavement Mechanistic-Empirical (ME) design, simply the AASHTOWare design, the flexible pavement performances such as the fatigue cracking, rutting (permanent deformation) along the wheelpath, longitudinal cracking, etc., are predicted based on the stress–strains developed in different layers especially at the asphalt layer. There can also be subgrade rutting; however, this study includes the total rutting (sum of rutting of all layers) and the rutting in asphalt layer only. Note that flexible pavement means the pavement that has predominantly asphalt materials in the surface layer. Hot-mix asphalt (HMA) is mostly used in asphalt layer, although cold or warm asphalts are also available now-a-days. The stress–strain to be developed in asphalt layer is dependent on the mechanical properties such as modulus of asphalt layer. The more accurate the material properties the better the pavement design. Dynamic modulus, |E*| of asphalt material is the most important input parameter for asphalt layer. It is defined as the ratio of the amplitude of the sinusoidal stress at any given time and the amplitude of the sinusoidal strain at the same time and frequency. Note that modulus of elasticity or the Young’s modulus is not used for asphalt materials and it cannot represent the viscoelastic behavior of asphalt materials. |E*| helps to define the viscoelastic nature of asphalt by quantifying the effects of temperature and frequency on stiffness under dynamic loading. This is necessary to accurately predict the in situ pavement responses to different traffic speeds, and temperatures throughout the pavement’s cross-section.
The |E*| of HMA depends on many mix factors: aggregate, binder, air voids, etc. Many empirical based |E*| models are available in the literature addressing these factors on the dynamic modulus of HMA, such as the viscosity-based (η) Witczak model, the shear modulus-based Witczak model, and the Hirsch model. Clyne et al. [1] evaluated the Witczak model and proposed a revised model for the mixtures used in the state of Minnesota, USA. Rahmand et al. [2] revised the Witczak model for the mixtures used in the state of New Mexico, USA. Birgisson et al. [3] revised the Witczak model for the mixtures used in the state of Florida, USA. There are many other studies that studied the predictive models in the different regions such as Louisiana, Washington, Arkansas, etc. [4,5,6,7,8,9,10]. However, the effects of different mix factors on the performance of asphalt pavement are not explored in the literature. Thus, this study focuses on the effect different mix factors have on the performance of asphalt pavement using the AASHTOWare software (Version 2.3.1, American Association of State Highway and Transportation Officials, Washington, DC, USA). Different mix factors included in this study are asphalt content (AC), air void (Va), voids in mineral aggregates (VMA), void-filled with asphalt (VFA), effective binder content (Vbe), etc. Asphalt content (AC) is the total amount of asphalt binder used in the mix and expressed as the percentage of the total mix by weight. Air void (Va) is the total volume of the small pockets of air between the coated aggregate particles expressed as a percent of the bulk volume of the compacted mixture. The volume void space among aggregate particles of a mixture that includes the air voids and the effective asphalt content is known as VMA. The portion of the voids in the mineral aggregate that contain asphalt binder is known as VFA. The total asphalt binder content of the mix less the portion of asphalt binder that is lost by absorption into the aggregate is called the effective asphalt content (Vbe). This portion of binder is coated on the aggregate surface and takes part in binding aggregates. In summary, the main objective of the research is to analyze the effects of AC, Va, VMA, VFA, Vbe, etc., on the pavement performances using the AASHTOWare software.

2. Materials

The dynamic moduli data is grouped into 11 types based on aggregate gradations, number of gyrations used while mix design, and binder types. The average or representative dynamic modulus data for use in the AASHTOWare software has also been developed for each group. The development procedure of the average or representative dynamic modulus data is discussed later in this section. The 11 types of mixtures being studied are listed in Table 1 along with their basic information such as nominal maximum aggregate size (NMAS), performance grade (PG) binder type, number of gyrations used while designing the mixes. Superpave performance grading is reported using two numbers: The first being the average seven-day maximum pavement temperature (°C); and the second being the minimum pavement design temperature likely to be experienced (°C). Thus, a PG 70-28 is intended for use where the average seven-day maximum pavement temperature is 70 °C and the expected minimum pavement temperature is −28 °C. The letter, ‘S’ means the NMAS of 0.75 in. (19 mm). The letter, ‘SX’ means the NMAS of 0.5 in. (12.5 mm). The number in the parenthesis is the number of gyrations used in the mix design.

3. Dynamic Modulus (E*) Testing

The |E*| testing on collected field cores is conducted using the AASHTO TP 62 [11] test protocol and the asphalt mixture performance tester (AMPT) testing device. The AASHTO TP 62 procedure is described below:
(a)
Samples of 4-in. (100-mm) diameter and 6-in. (150-mm) height are prepared in the laboratory or field cores are collected.
(b)
The gauge points for the AMPT instrumentation are attached.
(c)
The full E* test is run on each specimen at three different temperatures of 4 °C, 20 °C, and 40 °C. The testing frequencies are 0.1 Hz, 1 Hz, and 10 Hz at each temperature with the exception that another (4th) frequency of 0.01 Hz is adopted for 40 °C.
(d)
N-value tests are run on two of the samples from each set of five at 50 °C.

4. Developing Dynamic Modulus Mastercurves for AASHTOWare

MasterSolver is used to determine the master curve of a dynamic modulus used in the AASHTOWare software. The dynamic modulus is determined using the following equation [5]:
log | E * | = log ( M i n ) + ( log ( M a x ) log ( M i n ) ) 1 + e β + γ log ω r
where:
  • | E * | = dynamic modulus
  • ωr = reduced frequency, Hz
  • Max = limiting maximum modulus, ksi
  • Min = limiting minimum modulus, ksi
  • β and γ = fitting parameters
The reduced frequency is computed using the Arrhenius equation given below:
log ( ω r ) = log ω + Δ E a 19.14714 ( 1 T 1 T r )
where:
  • ωr = reduced frequency at the reference temperature
  • ω = loading frequency at the test temperature
  • Tr = reference temperature, °K
  • T = test temperature, °K
  • Ea = activation energy (treated as a fitting parameter)
The combination of the above two equations gives the following:
log | E * | = log ( M i n ) + ( log ( M a x ) log ( M i n ) ) 1 + e β + γ { log ω + Δ E a 19.14714 ( 1 T 1 T r ) }
The shift factors for each temperature are given by the following equation:
log [ a ( T ) ] = Δ E a 19.14714 ( 1 T 1 T r )
where:
  • a(T) = shift factor at temperature T
The maximum limiting modulus is estimated from mixture volumetric properties using the Hrisch model shown below, and a limiting binder modulus of 1 GPa [5]:
| E * | max = P c [ 4 , 200 , 000 ( 1 V M A 100 ) + 435 , 000 ( V M A x V F A 10 , 000 ) ] + 1 P c [ ( 1 V M A 100 ) 4 , 200 , 000 + V F A 435 , 000 V F A ]
where:
P c = ( 20 + 435 , 000 V F A V M A ) 0.58 650 + ( 435 , 000 V F A V M A ) 0.58
  • | E * | max limiting maximum dynamic modulus, psi
  • VMA = voids in mineral aggregates, %
  • VFA = voids filled with asphalt, %
To determine a recommended dynamic modulus from the AMPT (master curve) data, the average raw dynamic moduli, VMA, and VFA of all 11 groups are combined, and the average value are calculated and fitted using the MasterSolver for each type of mixture listed at the beginning of this section. As an example, the average raw dynamic modulus data for S (100) PG 64-22 are presented in Table 2:
The average VMA and VFA are 16.3% and 61.7%, respectively. After the execution of the MasterSolver program, the final fitting parameters are shown below. The AASHTOWare input moduli are listed in Table 3.
  • Max. |E*| (ksi): 3237.2 (22,304 MPa)
  • Min. |E*| (ksi): 9.2 (63.39 MPa)
  • Beta, β: −0.91764
  • Gamma, γ: −0.54361
  • Ea: 239,361
  • Coefficient of determination (R2) = 0.993
  • Se/Sy = 0.06

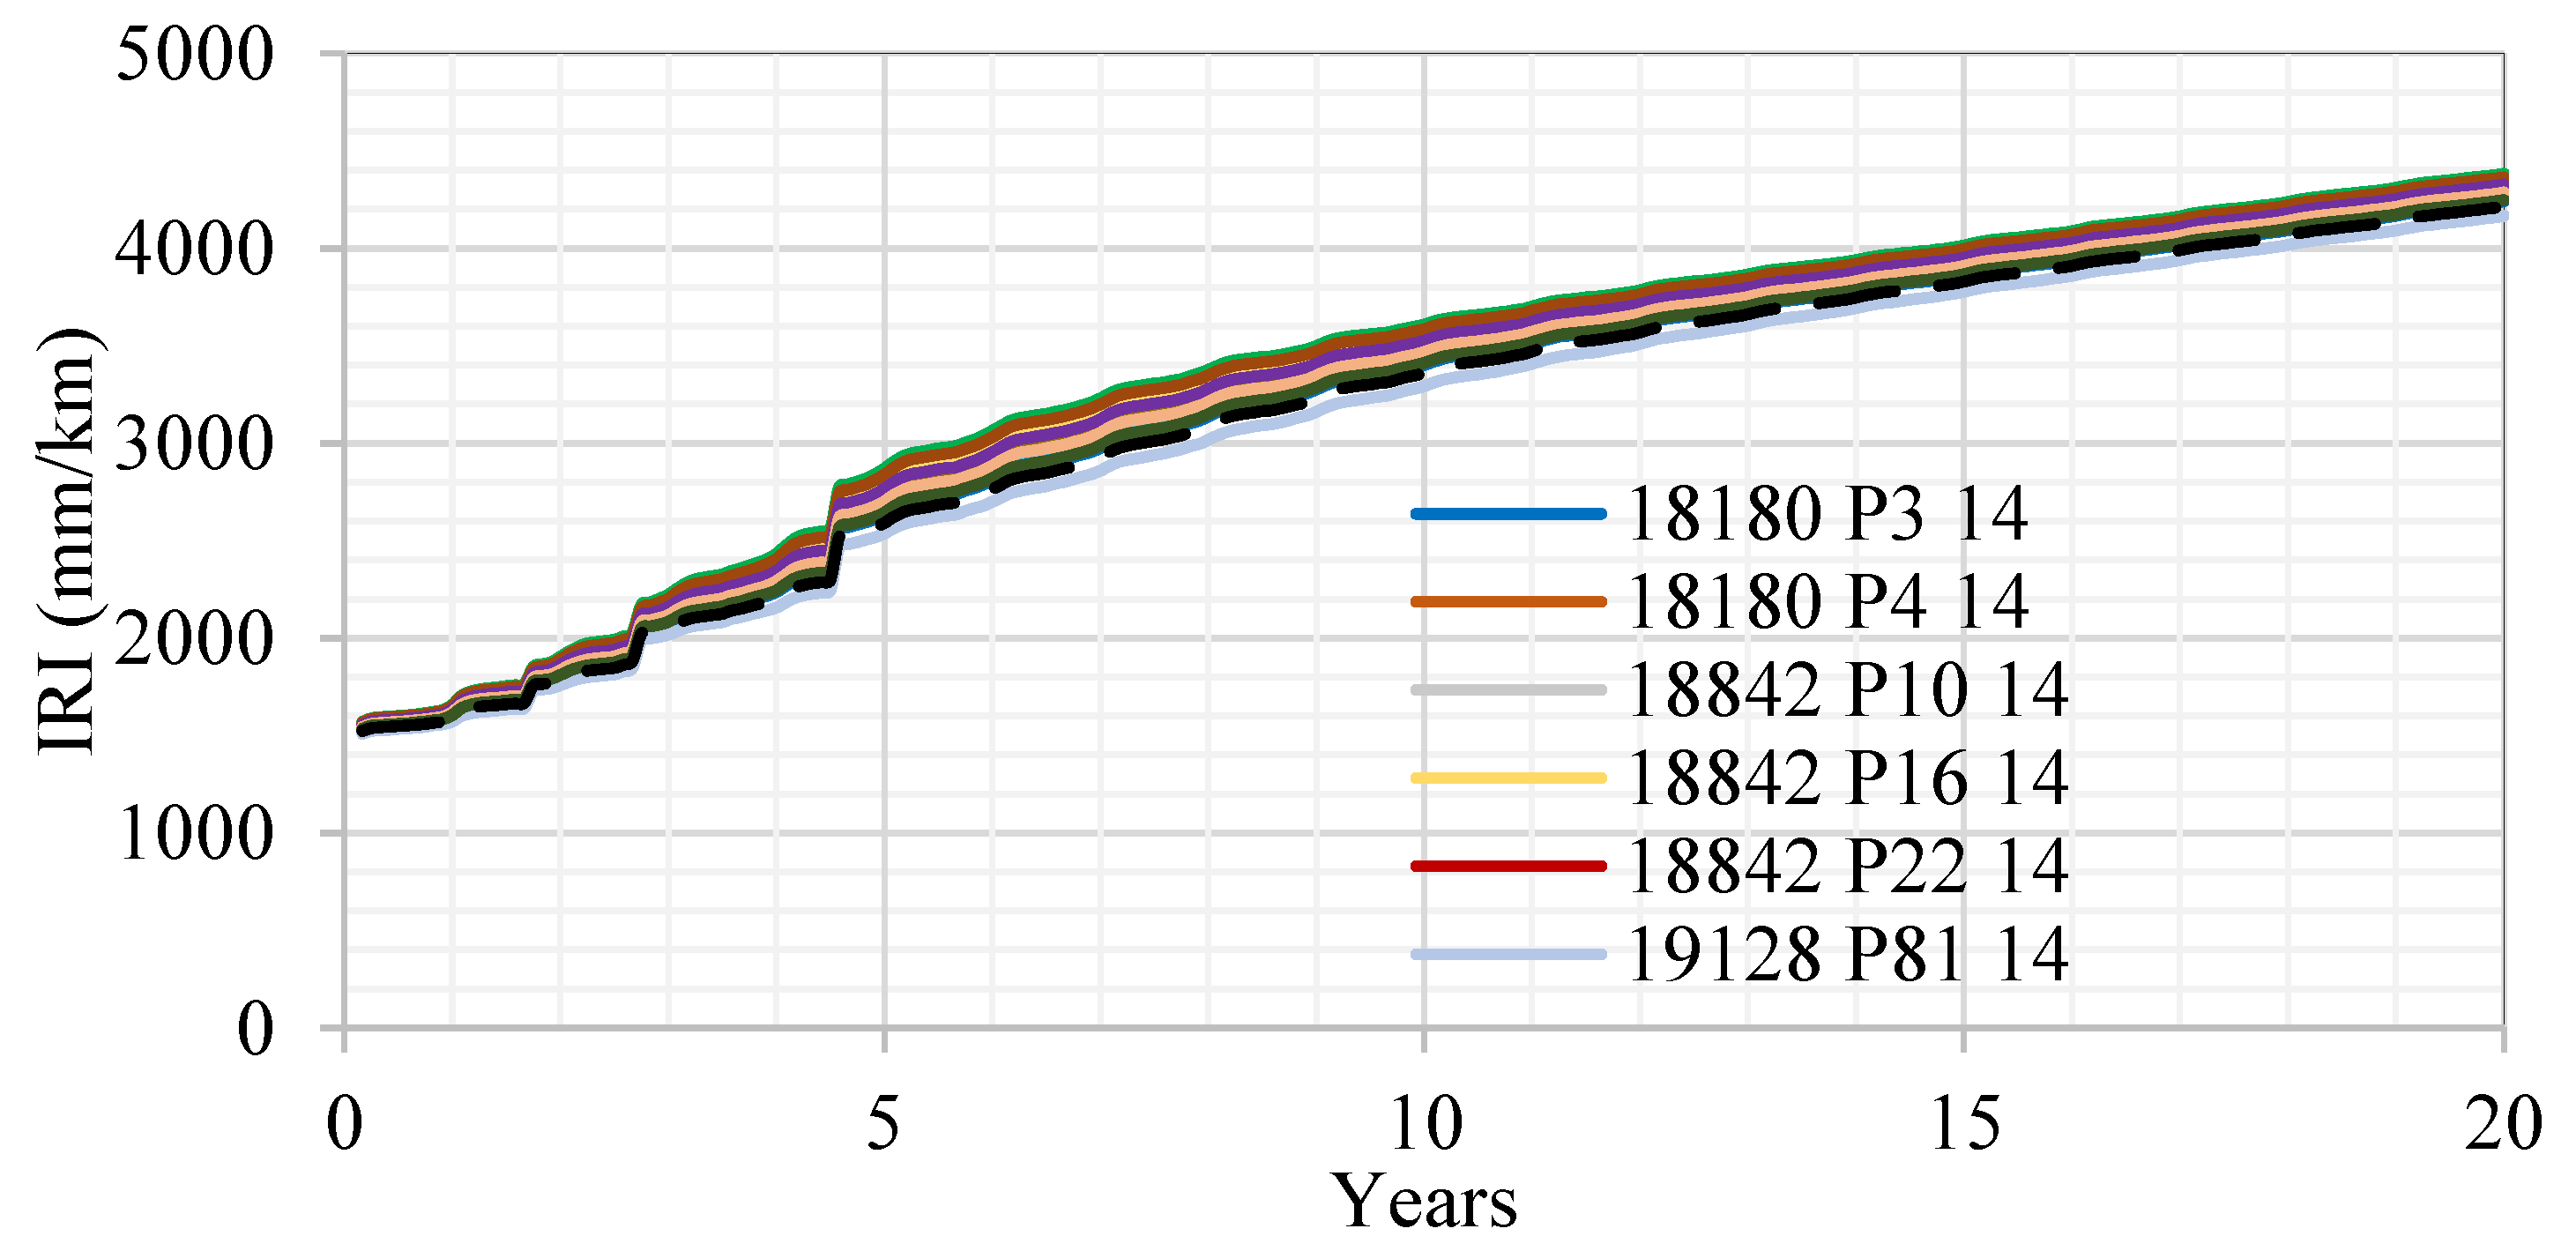
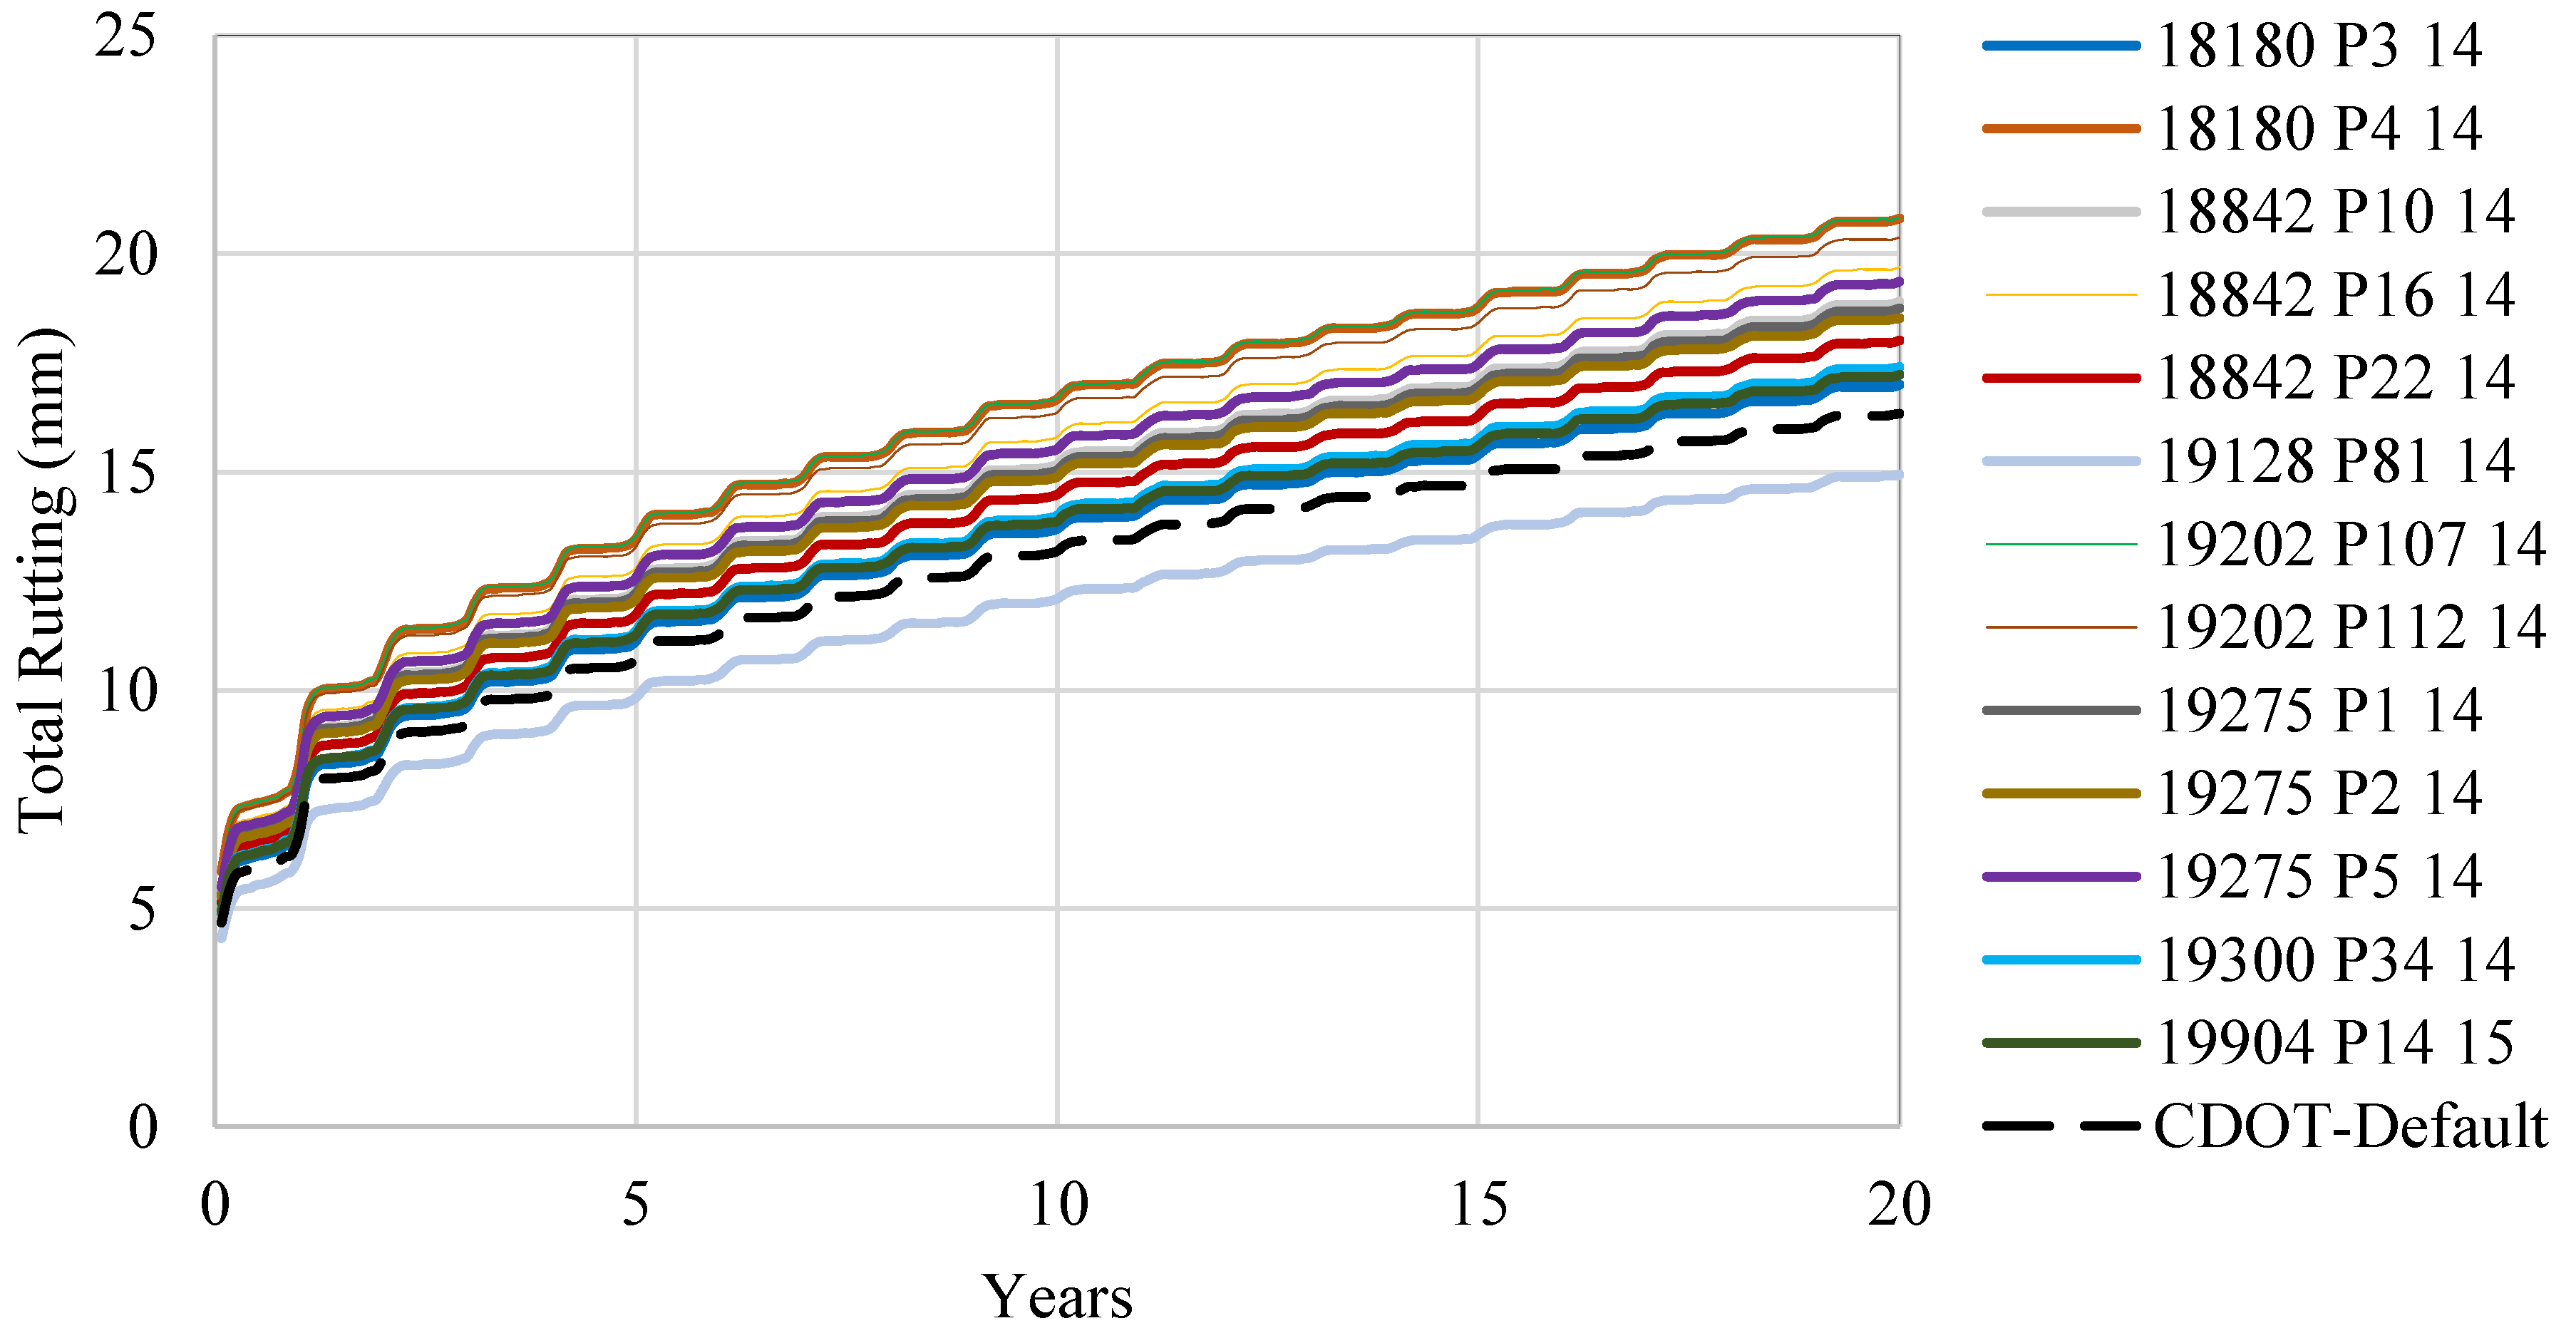
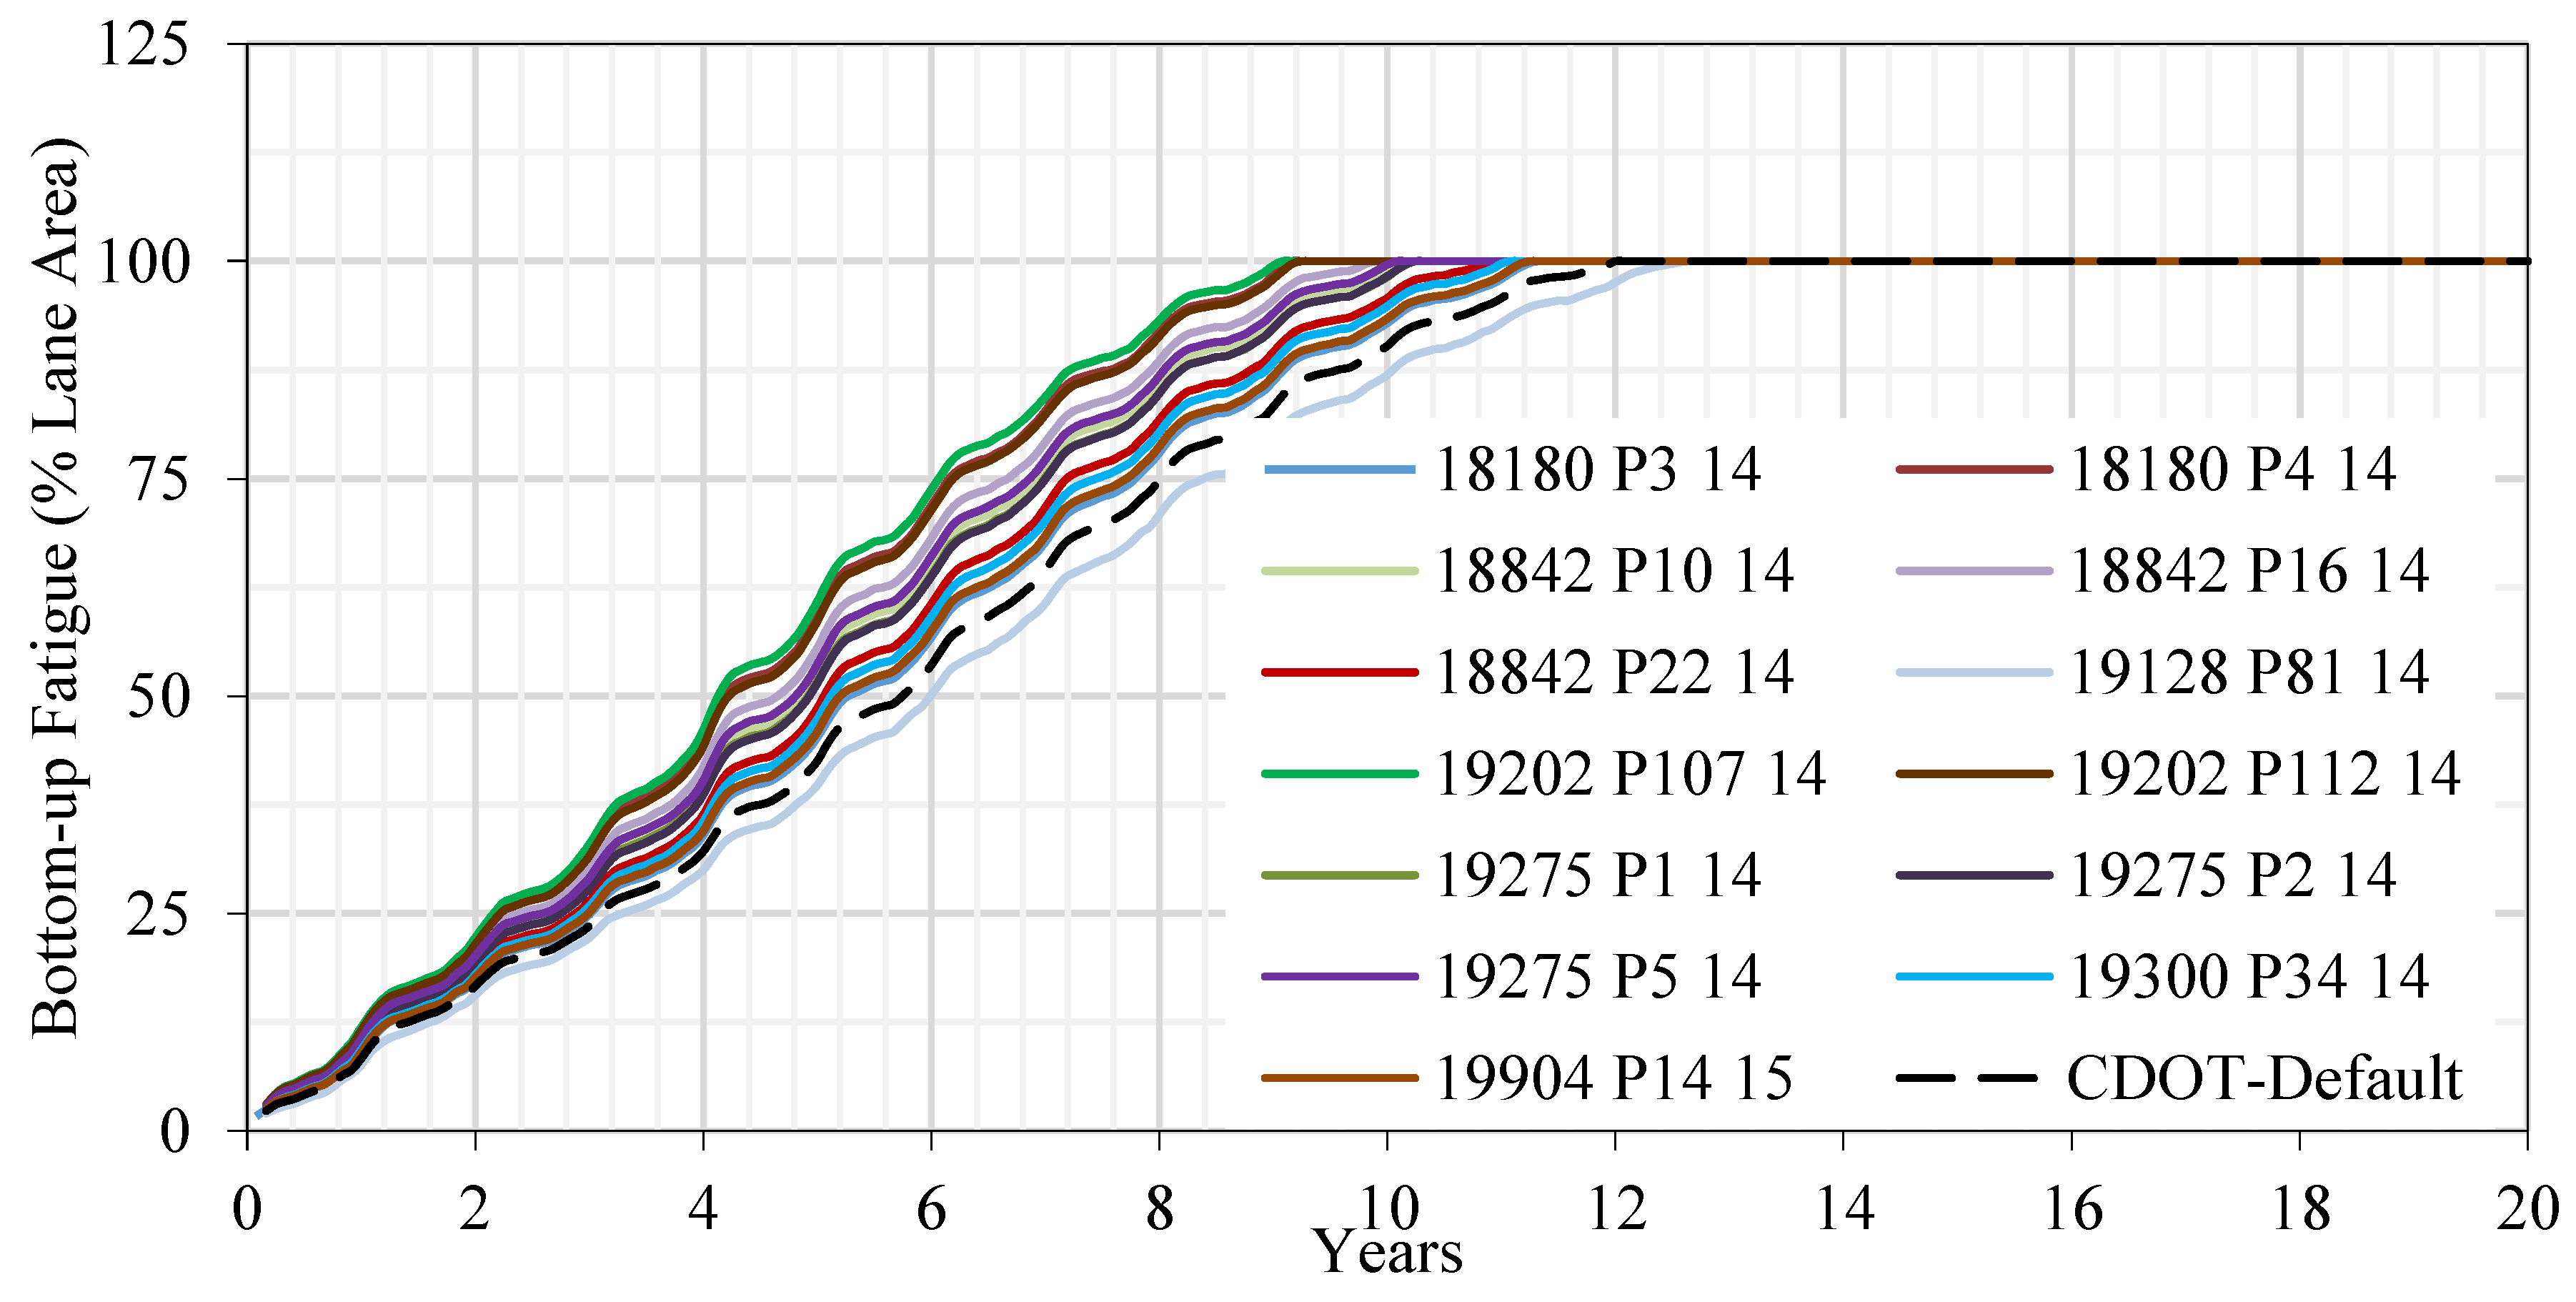
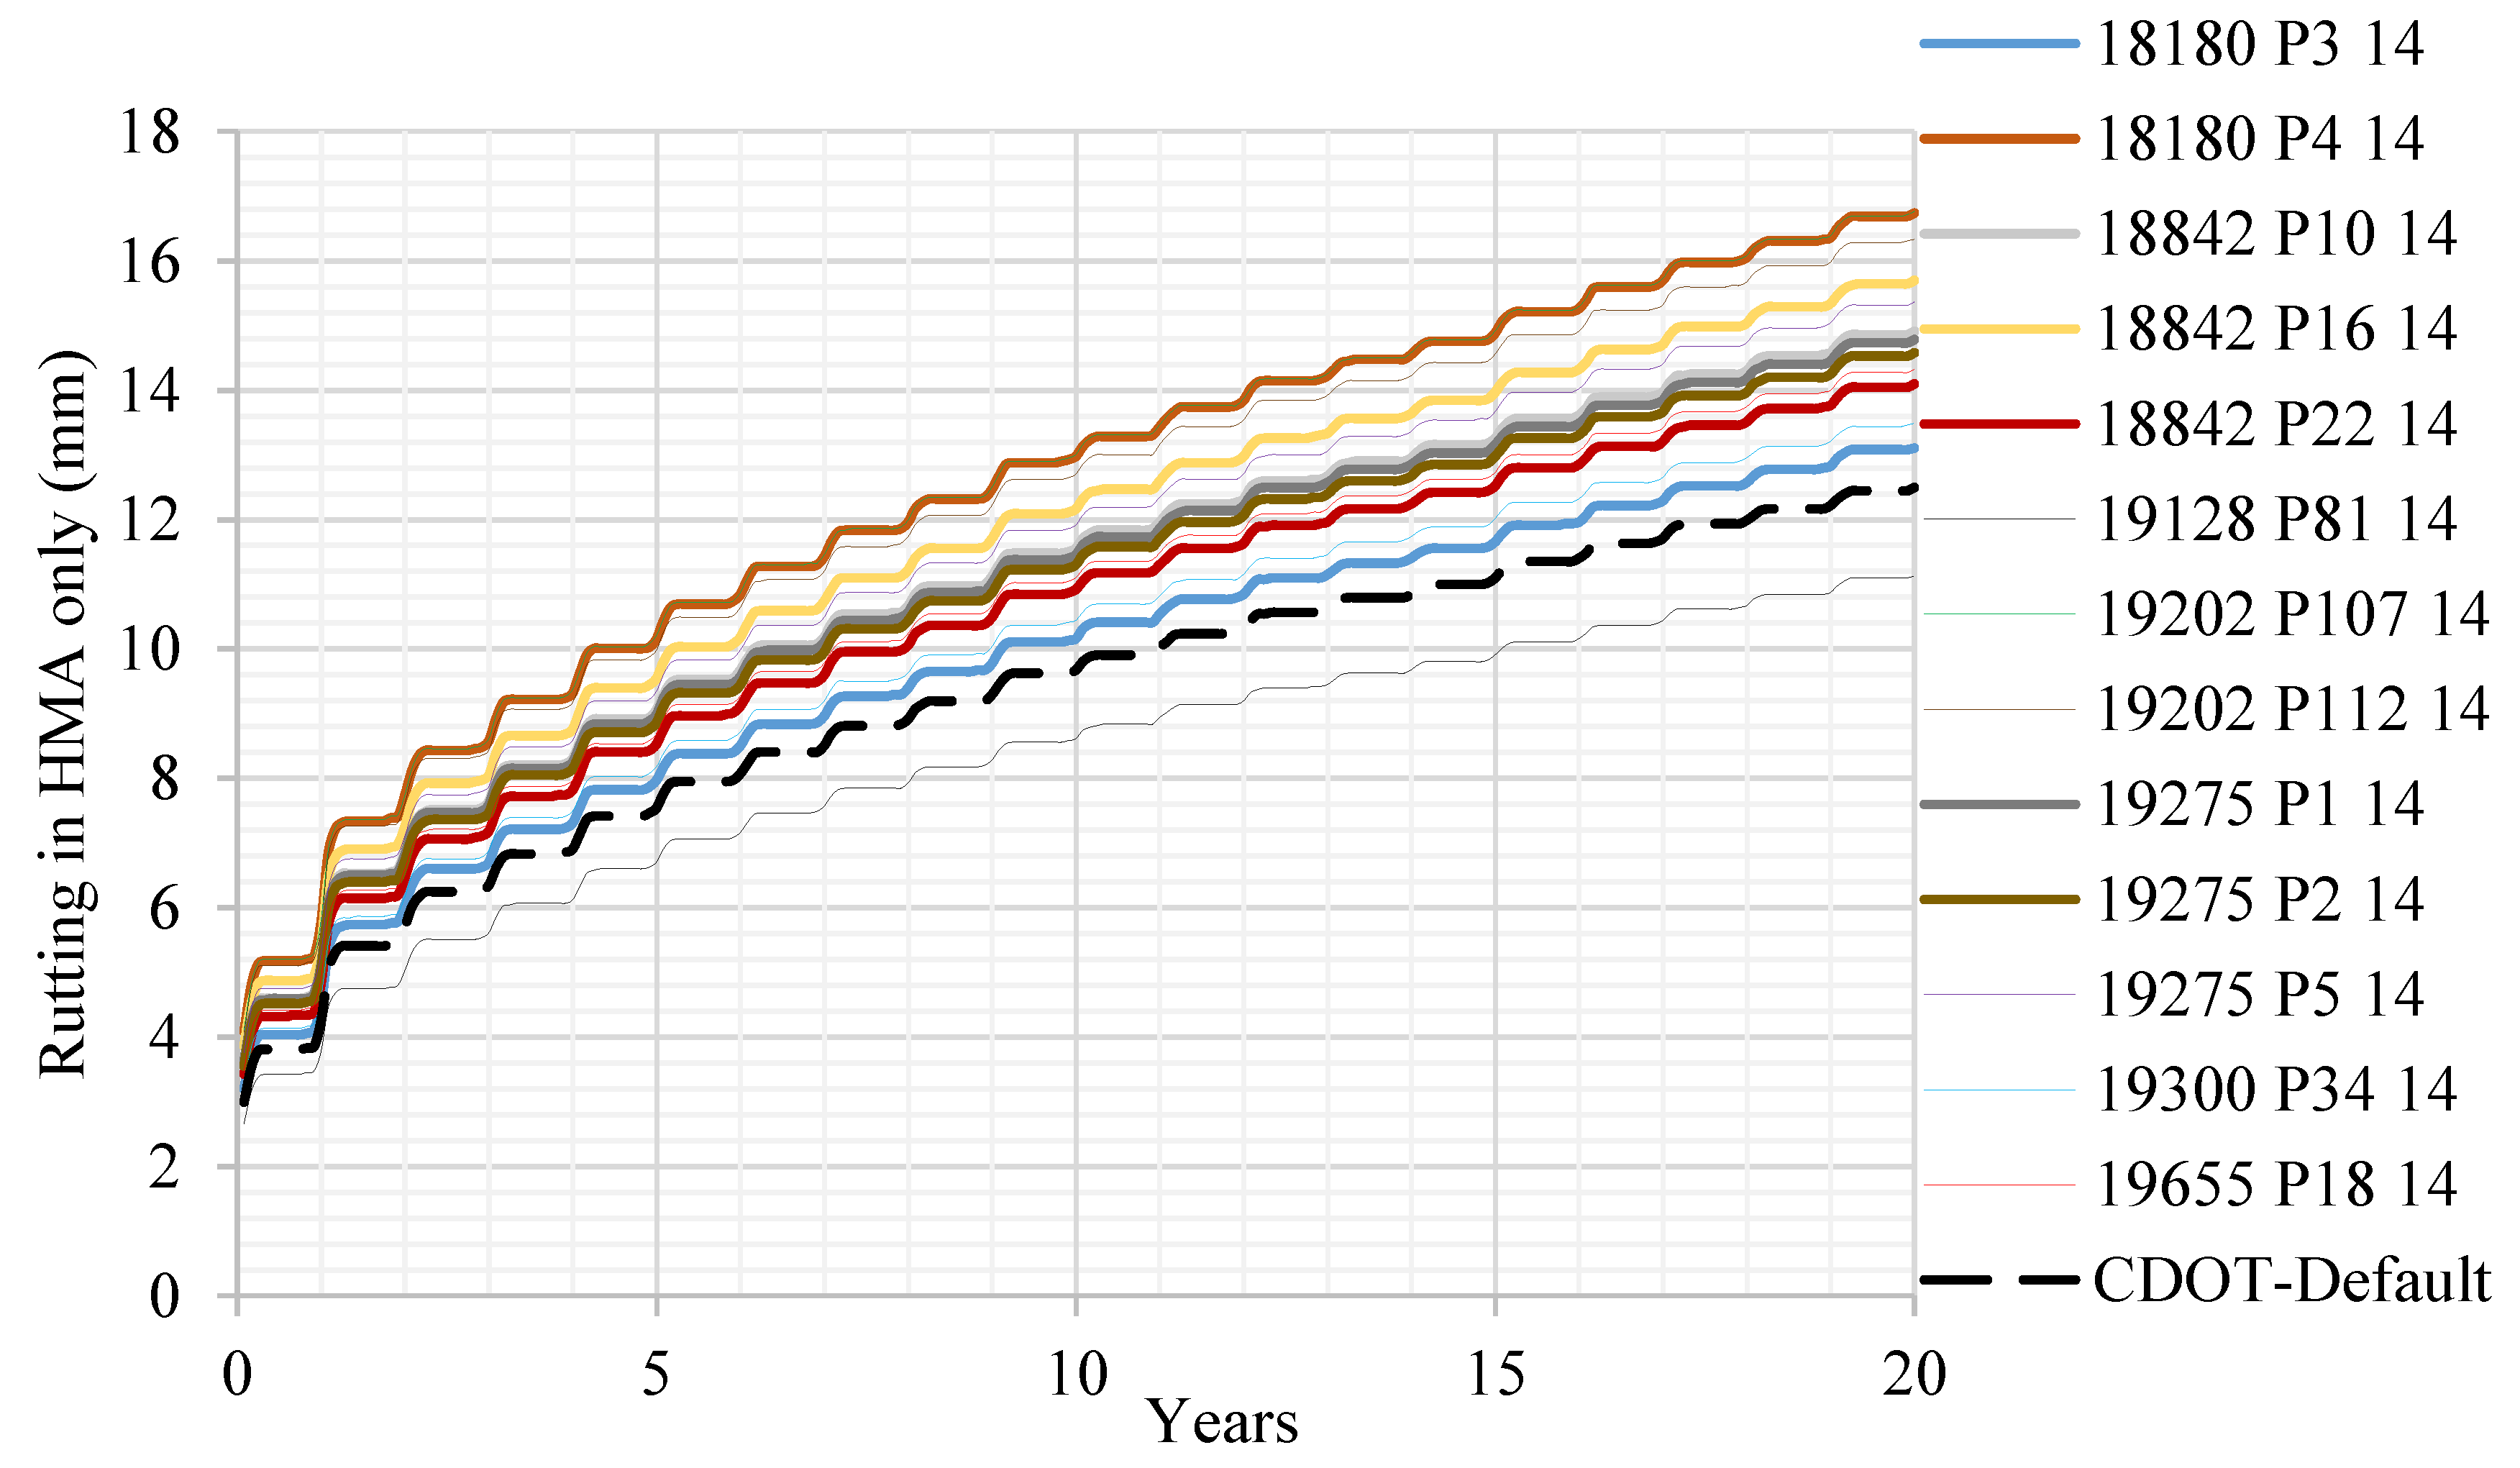
5. Effects of Mix Factors on Performance

The effects of different mix factors on the dynamic modulus are determined using AASHTOWare software analysis. The most recent version (Version 2.3 Revision 66) of the AASHTOWare software are used to predict the performance of the trial pavements. A trial section (Figure 1) with a 6-in. (150 mm) single layer of HMA, 6-in. (150 mm) of A-1-b base course, and A-6 sub-grade is used for all analysis. This geometry is most commonly used in Colorado and expected to be common in other areas as well. The resilient moduli (Mr) of the base, and the sub-grade are 38,000 psi (262 MPa), and 14,000 psi (96.5 MPa), respectively. In addition to the mix data, the CDOT-default mix data and the average-fit data is used in the AASHTOWare analysis.
Two types of traffic data are used for each group. For the SX (100), S (100), and SMA mixes, the traffic annual average daily truck-traffic (AADTT) is 7000 as these mixes are used for high-traffic roads. For the SX (75) mixes, an AADTT of 3000 is used as these mixes are used for low-traffic roads. Other than the dynamic modulus, the material properties are adopted from the CDOT 2017 M-E Pavement Design Manual [12]. The analysis period is 20 years starting from May 2018. Climate has been selected based on the region where the mixes are collected and is shown in Table 4.
The following five distresses at 90% reliability are analyzed to compare the differences in mix performance:
(a)
International roughness index (IRI);
(b)
Total rutting;
(c)
Rutting in asphalt layer (only);
(d)
Bottom-up fatigue cracking (FC) and;
(e)
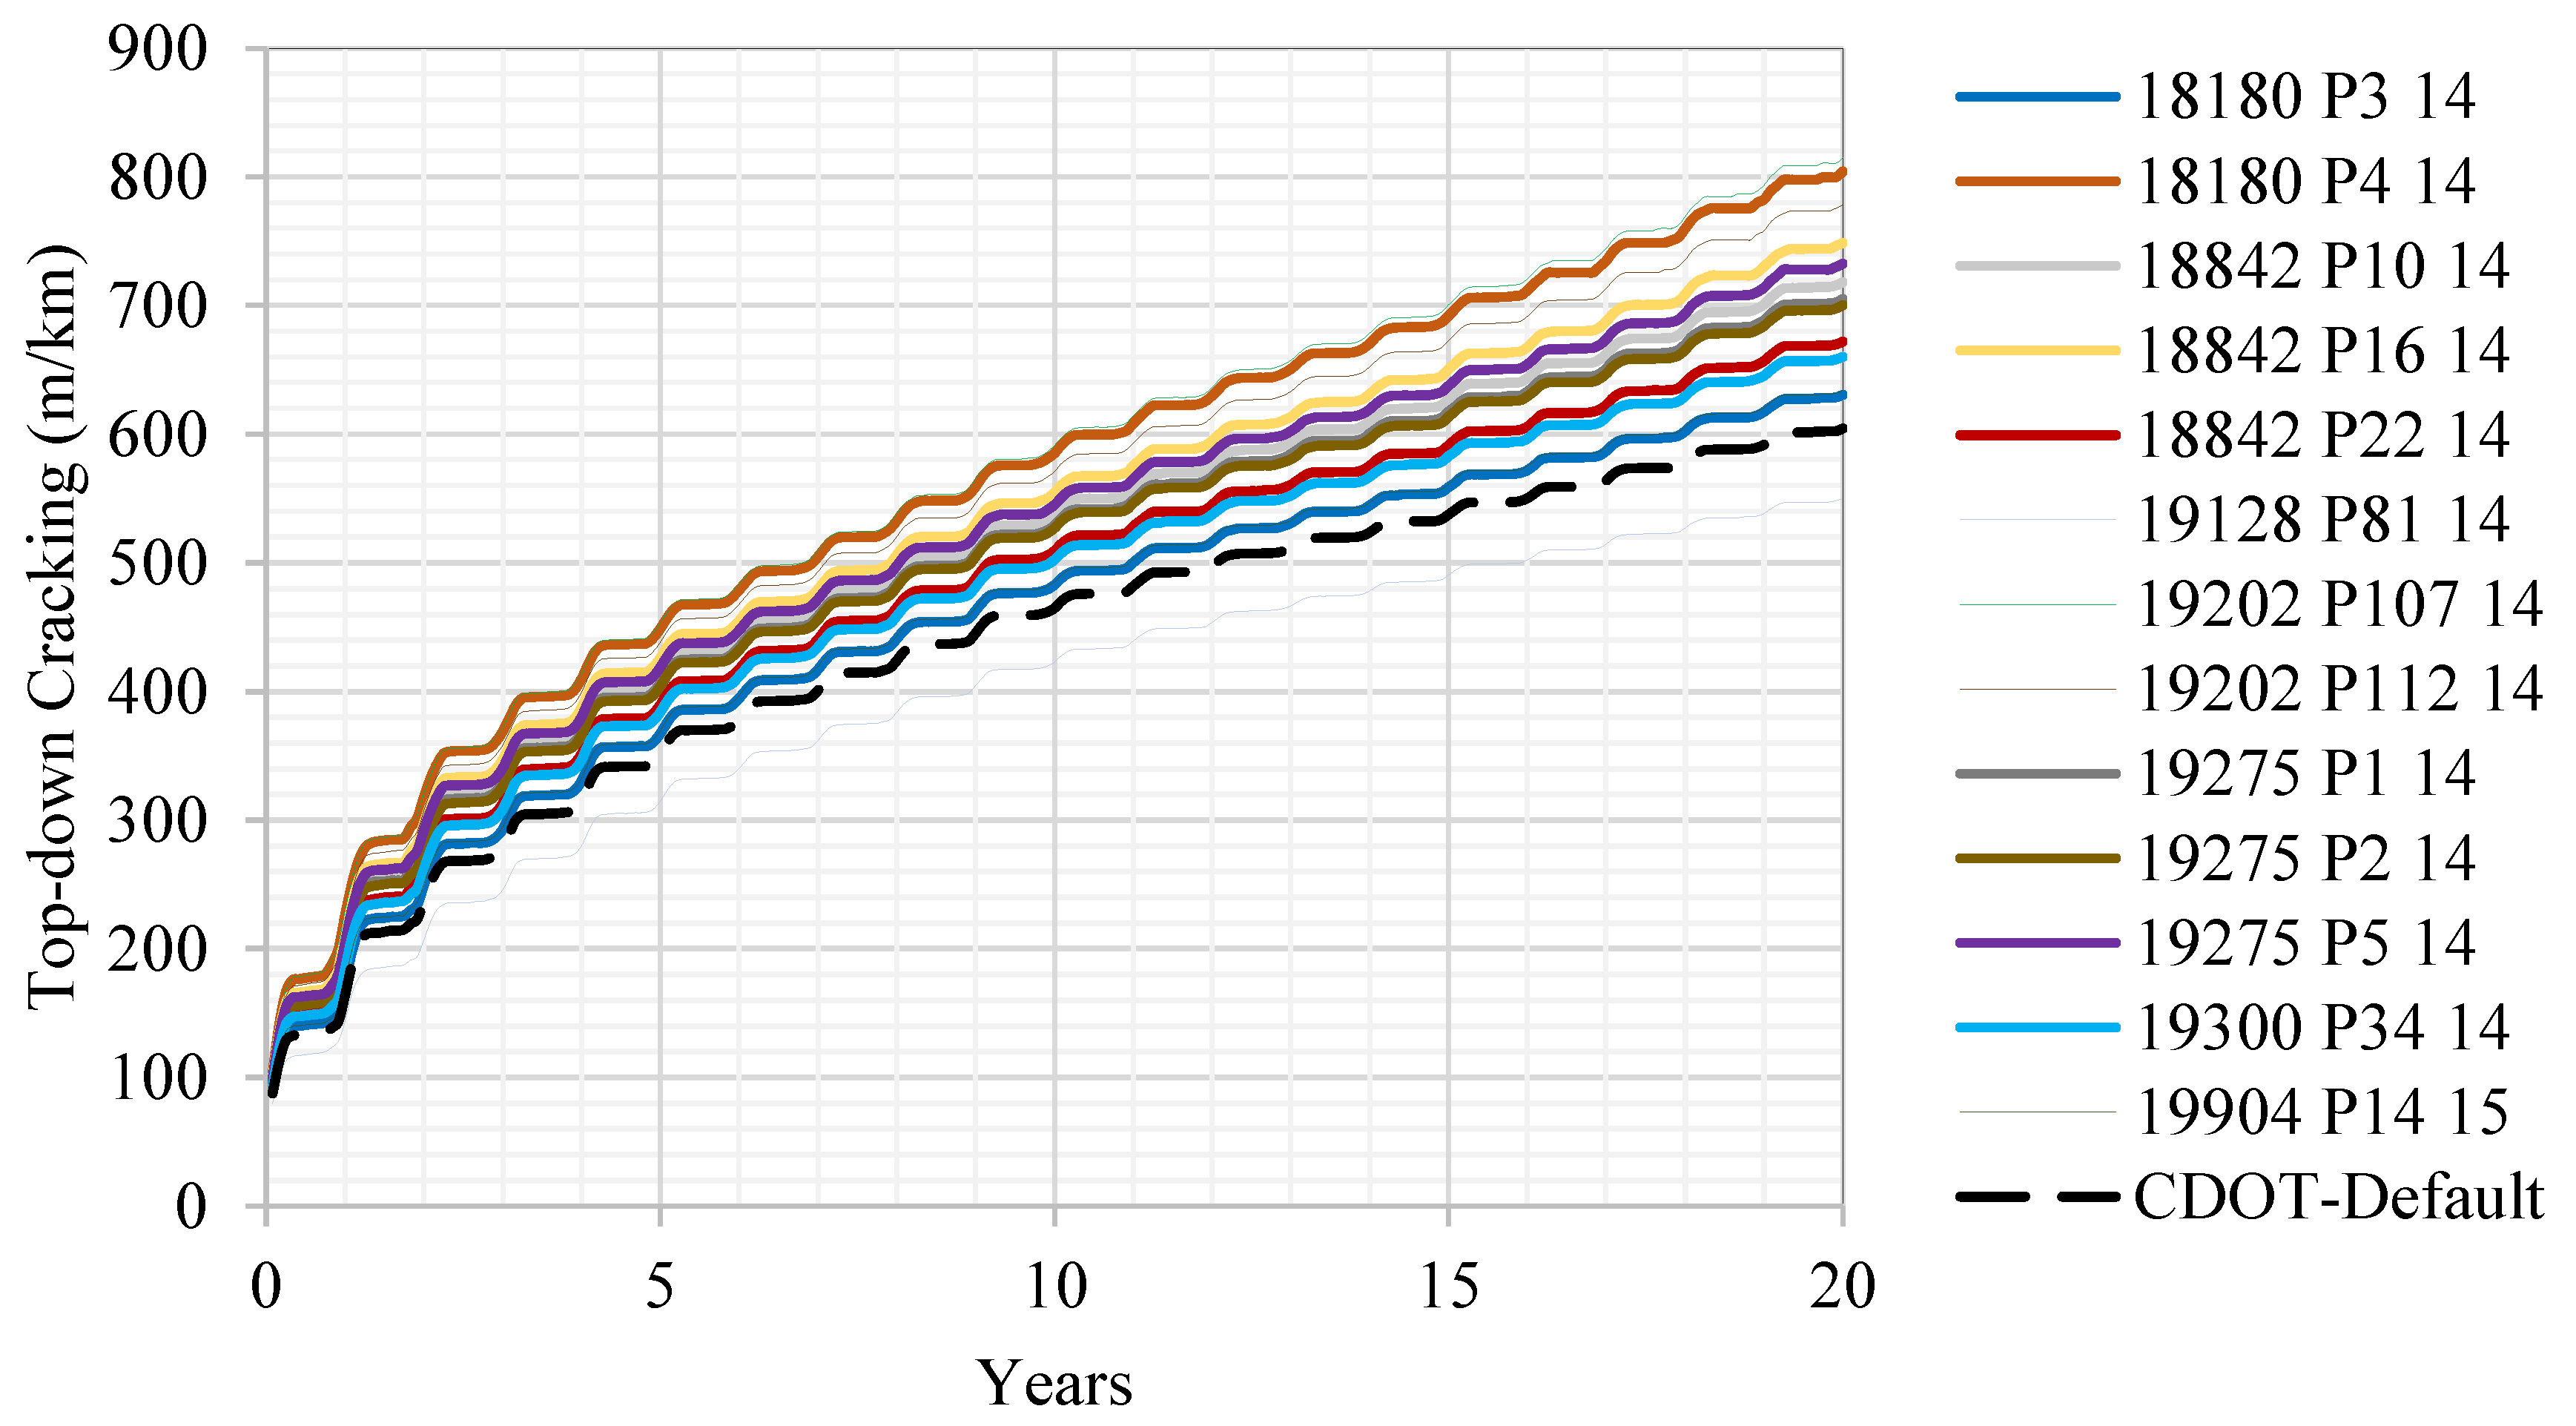
Top-down longitudinal cracking (TDC).
As an example of data analysis, SX (100) PG 64-22 mix has been discussed here. Table 5 lists the mix factors, aggregate pits, binder suppliers, and contractor information of the SX (100) PG 64-22 mix. Mix factors includes Vbe, Va, VMA, VFA, and AC. All this information is used while analyzing the performance of different mixes as discussed below.
International Roughness Index: Figure 2 shows the IRI of the trial pavement with the service life of the pavement for AADTT = 7000. It shows that the prediction of IRI by the CDOT-default mix (except 19128 P81 14) data is the lowest.
Total Rutting: Figure 3 shows the total rutting of the trial pavement with the service life of the pavement for AADTT = 7000. It shows that the prediction of total rutting by the CDOT-default mix (except 19128 P81 14) data is the lowest. This means the CDOT-default dynamic modulus data for the PG 62-22 binder predicts a lower rutting compared to that of the actual tested dynamic modulus (except for 19128 P81 14). Comparing contractor to contractor, the prediction varies a lot. For example, if the threshold total value is 15 mm (0.6 in.), then the prediction reaches the threshold from four years to nine years. The statistical analysis shows that several mixes are within the 95% Confidence Interval (CI) boundaries.
Rutting in the Asphalt Layer only: Figure 4 shows the rutting in the asphalt layer of the trial pavement with the service life of the pavement for AADTT = 7000. It shows that the prediction of rutting in the asphalt layer by the CDOT-default mix (except for 19128 P81 14) data is the lowest. This means that the CDOT-default dynamic modulus data for the PG 62-22 binder predicts lower rutting in the asphalt layer compared to that of the actual tested dynamic modulus (except for 19128 P81 14). Comparing contractor to contractor, the prediction varies a lot. For example, if the threshold total value is 8 mm (0.32 in.), then the prediction reaches the threshold from two to seven years. The statistical analysis shows that several mixes are within the 95% CI boundaries.
Bottom-up Fatigue Cracking: Figure 5 shows the bottom-up fatigue cracking of the trial pavement with the service life of the pavement for AADTT = 7000. It shows that the prediction of bottom-up fatigue cracking by the CDOT-default mix data (except for 19128 P81 14) is the lowest. This means that the CDOT-default dynamic modulus data for the PG 62-22 binder predicts lower bottom-up fatigue cracking compared to that of the actual tested dynamic modulus (except for 19128 P81 14). The assumed threshold of 35% of the lane area show that the mixes reach the threshold between three and four years, which is very close to each other. The statistical analysis shows that none of the mix listed in Figure 5 is within the 95% CI boundaries.
Top-down Longitudinal Cracking: Figure 6 shows the top-down longitudinal cracking of the trial pavement with the service life of the pavement for AADTT = 7000. It shows that the prediction of top-down longitudinal cracking by the CDOT-default mix (except for 19128 P81 14) data is the lowest. This means that the CDOT-default dynamic modulus data for the PG 62-22 binder predicts lower top-down longitudinal cracking compared to that of the actual tested dynamic modulus (except 19128 P81 14). Mixes reach the threshold value of 400 m/km (2000 ft./mi.) from three to eight years. The statistical analysis shows that none of the mixes (Figure 6) is within the 95% CI boundaries.
To determine the influence of Vbe, Va, VMA, VFA, and AC, a regression analysis is conducted, and the following correlations are obtained. The R2 of the correlations of IRI, total rutting, rutting in HMA, FC, and TDC are 0.65, 0.60, 0.59, 0.65, and 0.64, respectively. It can be seen that all distresses increase with the increase in VMA, VFA, and AC, and decrease with the increase in Vbe and Va. This regression analysis is for the mix, SX (100) PG 64-22.
  • IRI (mm/km) = 1579.92 − 34.369 Vbe − 14.363 Va + 66.184 VMA + 17.604 VFA + 22.423 AC
  • Total rutting (mm) = −12.11 − 0.5258 Vbe − 0.165 Va + 0.9525 VMA + 0.2515 VFA + 0.3048 AC
  • Rutting in HMA (mm) = −14.2977 − 0.4775 Vbe − 0.198 Va + 0.922 VMA + 0.2388 VFA + 0.2134 AC
  • FC (%) = −13.1366 − 0.461 Vbe − 0.1364 Va + 0.9536 VMA + 0.2036 VFA + 0.5026 AC
  • TDC (m/km) = −467.33 − 19.12 Vbe − 7.7193 Va + 33.1948 VMA + 9.818 VFA + 11.2242 AC
The AASHTOWare outputs for the other mixes listed in Table 1 are analyzed using the same procedure as discussed for the SX (100) PG 64-22 mix here. The influences of different mix factors are not consistent, as observed in the group analysis. The summary of the influence of different mix factors is provided in Table 6. Different mixes produce different regression coefficients. The reasons may be different aggregate sources, different technicians, human errors, binder source, etc. All distresses except rutting in HMA increase with an increase in Va, VMA, and VFA, and are insensitive to Vbe and AC in the study range of these parameters. Rutting in HMA increases with an increase in VMA and VFA, and is insensitive to Vbe, Va, and AC.

6. Conclusions

This study evaluates the effects of mix factors such as VMA, VFA, effective binder content, contractors, etc. on the pavement preferences. Laboratory testing was performed, and test results were analyzed using the AASHTOWare software. There are effects of aggregate pit, paving contractor, effective binder content, air voids, VMA, VFA, etc. on the prediction of distresses using the AASHTOWare software. The prediction of distresses using the AASHTOWare software by a mix prepared by a single contractor may differ by up to 11 years, although most of the data reveals three to seven years. IRI, total rutting, fatigue cracking, and top-down cracking increase with Va, VMA, but not VFA, and are insensitive to Vbe and AC. Rutting in HMA increases with the increase in VMA and VFA, but is insensitive to Vbe, Va, and AC. The prediction of distresses using the AASHTOWare software may differ by up to 170%, although most data show that the difference is less than 100%.
The results of this study are obtained studying the common mixtures used in Colorado, USA. As asphalt materials and pavement performance vary a lot from region to region for different local factors, local study is always recommended. All the results are valid for the study ranges used in this study.

Author Contributions

M.R.I. is the primary investigator of this research. He is the lead researcher with collecting the research ideas, pursuing funding, execution, delivery and publication. S.A.K. supervised all aspects of this research including editing and proofreading. S.K.N. helped in data analysis.

Funding

This research is funded by the Colorado Department of Transportation (CDOT), Grant No. CDOT 417.01.

Acknowledgments

The Colorado State University—Pueblo (CSU-Pueblo) research team appreciates the research funding by the Colorado Department of Transportation (CDOT). It would like to express its sincere gratitude and appreciation to Jay Goldbaum, Michael Stanford, Aziz Khan, Melody Perkins, Keith Uren, Vincent Battista, Skip Outcalt, Bill Schiebel, and Roberto E. DeDios from the CDOT.

Conflicts of Interest

The authors declare no conflict of interest.

References

  1. Clyne, T.R.; Li, X.; Marasteanu, M.O.; Skok, E.L. Dynamic and Resilient Modulus of Mn/DOT Asphalt Mixtures; Report No. MN/ RC-2003-09; Minnesota Department of Transportation: St. Paul, MN, USA, 2003.
  2. Rahman, A.; Islam, M.R.; Tarefder, R.A. Modifying the Viscosity Based Witczak Model and Developing Phase Angle Predictive Model for New Mexico’s Superpave Mixes. In Proceedings of the Transportation Research Board (TRB) 95th Annual Meeting, Washington, DC, USA, 10–14 January 2016. Paper ID. 16-3180. [Google Scholar]
  3. Birgisson, B.; Sholar, G.; Roque, R. Evaluation of Predicted Dynamic Modulus for Florida Mixtures. In Proceedings of the 84th Annual Meeting of the Transportation Research Board, Washington, DC, USA, 9–13 January 2005. Paper No. 05-1309. [Google Scholar]
  4. Ceylan, H.; Schwartz, C.; Kim, S.; Gopalakrishnan, K. Accuracy of Predictive Models for Dynamic Modulus of Hot-Mix Asphalt. J. Mater. Civ. Eng. 2009, 21, 286–293. [Google Scholar] [CrossRef] [Green Version]
  5. Christensen, D.W.; Pellinen, T.K.; Bonaquist, R.F. Hirsch Model for Estimating the Modulus of Asphalt Concrete. J. Assoc. Asph. Paving Technol. 2003, 72, 97–121. [Google Scholar]
  6. Kim, Y.R.; King, M.; Momen, M. Typical Dynamic Moduli Values of Hot Mix Asphalt in North Carolina and Their Prediction. In Proceedings of the 84th Annual Meeting of the Transportation Research Board, Washington, DC, USA, 9–13 January 2005. Paper No. 05-2568. [Google Scholar]
  7. Mohammad, L.N.; Wu, Z.; Myers, L.; Cooper, S.; Abadie, C. A Practical Look at Simple Performance Tests: Louisiana’s Experience. J. Assoc. Asph. Paving Technol. 2005, 74, 557–600. [Google Scholar]
  8. Sakhaeifar, M.; Kim, Y.; Kabir, P. New predictive models for the dynamic modulus of hot mix asphalt. Constr. Build. Mater. 2015, 76, 221–231. [Google Scholar] [CrossRef]
  9. Tran, N.H.; Hall, K.D. Evaluating the Predictive Equation in Determining Dynamic Moduli of Typical Asphalt Mixtures Used in Arkansas. J. Assoc. Asph. Paving Technol. 2005, 74, 1–17. [Google Scholar]
  10. Hu, H.; Shen, S. An Investigation of Dynamic Modulus and Flow Number Properties of Asphalt Mixtures in Washington State; Final Report, No. 709867; USDOT, Office of the Secretary of Transportation: Washington, DC, USA, 2012. [Google Scholar]
  11. AASHTO TP 62. Standard Method of Test for Determining Dynamic Modulus of Hot Mix Asphalt (HMA); American Association of State Highway and Transportation Officials (AASHTO): Washington, DC, USA, 2007; pp. 1–21. [Google Scholar]
  12. CDOT. Colorado Department of Transportation 2019 Pavement Design Manual; Colorado Department of Transportation (CDOT): Denver, CO, USA, 2019.
Figure 1. Geometry of the trial pavement for the AASHTOWare analysis of all groups.
Designs 03 00036 g001
Figure 2. International roughness index (IRI) due to AADTT = 7000 by SX (100) PG 64-22 mix.
Designs 03 00036 g002
Figure 3. Total rutting due to AADTT = 7000 by SX (100) PG 64-22 mix.
Designs 03 00036 g003
Figure 4. Rutting in asphalt layer due to AADTT = 7000 by SX (100) PG 64-22 mix.
Designs 03 00036 g004
Figure 5. Bottom-up fatigue cracking due to AADTT = 7000 by SX (100) PG 64-22 mix.
Designs 03 00036 g005
Figure 6. Longitudinal cracking due to AADTT = 7000 by SX (100) PG 64-22 mix.
Designs 03 00036 g006
Table 1. List of 11 mixtures used in this study.
Mix IDNMAS, in. (mm)BinderNumber of Gyrations
S (100) PG 64-220.75 (19)PG 64-22100
S (100) PG 76-280.75 (19)PG 76-28100
SMA PG 76-280.50 (12.5)PG 76-28100
SX (75) PG 58-280.50 (12.5)PG 58-2875
SX (75) PG 58-340.50 (12.5)PG 58-3475
SX (75) PG 64-220.50 (12.5)PG 64-2275
SX (75) PG 64-280.50 (12.5)PG 64-2875
SX (100) PG 58-280.50 (12.5)PG 58-28100
SX (100) PG 64-220.50 (12.5)PG 64-22100
SX (100) PG 64-280.50 (12.5)PG 64-28100
SX (100) PG 76-280.50 (12.5)PG 76-28100
Table 2. Average raw dynamic moduli of S (100) PG 64-22 mix.
Temperature
(°C)
Frequency
(Hz)
Dynamic Modulus
(ksi)
Dynamic Modulus
(MPa)
40.112068309
41.0175012,058
410.0231615,957
200.13222219
201.06384396
2010.011107648
350.0134234
350.154372
351.0117806
3510.02881984
Table 3. Fitted dynamic modulus of S (100) PG 64-22 mix.
No.TemperatureFrequency (Hz)|E*||E*|
°C°FKsiMPa
1−10.01425293920,250
2−10.01410286719,754
3−10.0145280319,313
4−10.0141261318,004
5−10.0140.5251217,308
6−10.0140.1222715,344
74.44025240416,564
84.44010223415,392
94.4405209114,407
104.4401171711,830
114.4400.5154410,638
124.4400.111377834
1321.1702513389219
1421.1701011087634
1521.17059426490
1621.17016074182
1721.1700.54893369
1821.1700.12841957
1937.8100254433052
2037.8100103252239
2137.810052551757
2237.81001144992
2337.81000.5113779
2437.81000.168469
2554.413025118813
2654.41301087599
2754.4130570482
2854.4130145310
2954.41300.538262
3054.41300.128193
Table 4. Climate station used for different mixes for the AASHTOWare analysis.
GroupsClimate StationAADTT
S (100) PG 64-22Denver 123427000
S (100) PG 76-28Denver 123427000
SMA PG 76-28Denver 123427000
SX (75) PG 58-28Gunnison 930073000
SX (75) PG 58-34Gunnison 930073000
SX (75) PG 64-22Pueblo 930583000
SX (75) PG 64-28Gunnison 930073000
SX (100) PG 58-28Gunnison 930077000
SX (100) PG 64-22Colorado Spring 930377000
SX (100) PG 64-28Pueblo 930587000
SX (100) PG 76-28Trinidad 230707000
Table 5. Generic information of SX (100) PG 64-22 mix.
Vbe
(%)
Va
(%)
VMA
(%)
VFA
(%)
AC
(%)
Pit
18180 P3 1412.246.6617.161.25.00Morrison, Plate River
18180 P4 1410.316.6617.963.45.00Morrison, Plate River
18842 P10 1411.635.0018.362.85.30Tezak Fountain/I25
18842 16 1411.396.9818.462.45.30Tezak Fountain/I25
18842 P22 1411.446.5218.164.35.30Tezak Fountain/I25
19128 P81 1413.186.9017.660.85.50Evans
19202 P107 1411.946.0018.864.26.34Four Corners
19202 P112 1411.296.0018.361.25.95Four Corners
19275 P1 1413.415.7817.066.35.65---
19275 P2 1413.416.6018.165.95.65---
19275 P5 1413.416.1417.365.25.65---
19300 P34 1412.045.6416.766.46.00Craig Ranch
19655 P18 1411.056.0616.764.35.60Valardi
19904 P14 1513.436.4017.162.55.50Spec Agg/Riverbend/Cottonwood
Table 6. Summary of the influence of different mix factors.
Vbe
(%)
Va
(%)
VMA
(%)
VFA
(%)
AC
(%)
IRI 4 Increases
4 Decreases
3 N/A
5 Increases
4 Decreases
2 N/A
6 Increases
3 Decreases
2 N/A
6 Increases
3 Decreases
2 N/A
4 Increases
2 Decreases
5 N/A
Total Rutting 4 Increases
4 Decreases
3 N/A
5 Increases
4 Decreases
2 N/A
6 Increases
3 Decreases
2 N/A
6 Increases
3 Decreases
2 N/A
3 Increases
3 Decreases
5 N/A
Rutting in HMA 4 Increases
3 Decreases
4 N/A
4 Increases
4 Decreases
3 N/A
7 Increases
3 Decreases
1 N/A
5 Increases
3 Decreases
3 N/A
3 Increases
3 Decreases
5 N/A
FC (%) 4 Increases
4 Decreases
3 N/A
5 Increases
4 Decreases
2 N/A
6 Increases
3 Decreases
2 N/A
6 Increases
3 Decreases
2 N/A
3 Increases
3 Decreases
5 N/A
TDC 4 Increases
4 Decreases
3 N/A
5 Increases
4 Decreases
2 N/A
6 Increases
3 Decreases
2 N/A
7 Increases
2 Decreases
2 N/A
4 Increases
2 Decreases
5 N/A

