Abstract
This paper presents the concept of check and balance approach in teachıng, learning and assessment processes with the development of a graphical interface tool to solve an advanced wastewater treatment design problem. The developed graphical interface improves the quality of teaching, learning, and the assessment of both, understanding the calculation approaches, as well as understanding the concepts. The tool acts as a calculator or a simulator of a unit converter, population equivalent, designing sewerage systems and selected unit processes of advanced wastewater treatment. A close-ended survey assessment was conducted with a total of 49 respondents who were the registered students for the subject of advanced wastewater treatment. About 79% of respondents agreed that it was hard to score a high mark in the advanced wastewater treatment exam. However, 100% of respondents agreed that the tool could help them to accelerate their understanding of the subject topic. All things considered, the findings of this study show that the developed tool is a potential tool that can aid in the teaching, learning, and assessment processes of any difficult subject that is taught in higher-learning institutions.
1. Introduction
The computer-based learning tool is widely applied in many sectors of society [1,2,3]. The easiest and most common learning aid tools are calculators and spreadsheets [4,5]. A learning aid tool is utilized to check the accuracy of prediction and other modeling programs of complex phenomena [6]. Some algebraic concepts, such as designing insulation for arctic dwellings, can also be explored by innovative learning tools, as reported by Ref. [7]. However, the application of learning aid tools is limited to the learning process less actively utilized in the teaching and assessment process.
In Malaysia, the Education Blueprint 2013–2025, which provides a long-term plan for the sustainable transformation of the Malaysian education system, was introduced [8]. This blueprint also includes the plan to improve the application of information and communication technology in the whole national education system [9]. The Malaysian government has consistently shown its determination to provide the best education system for its citizens. However, there are many challenges that need to be addressed, not only by the government as a policymaker but also the implementers and target groups, such as teachers and students. The challenges in the education system are to design and implement the concepts of teaching, learning and assessment (TLA) processes that take into consideration both knowledge about human cognition and practical applications, while at the same time reducing the time consumed to complete the TLA cycle.
Science, technology, engineering, and mathematics (STEM) are the difficult subjects and they are unpopular among students [10]. Difficult subjects that are associated with many calculations make the TLA process become harder to score, as well as demotivate students to choose it as an elective subject at university. In addition, a learning aid is needed to make the TLA process easier and faster. For this reason, this paper introduces a developed learning aid tool to implement the check and balance approach in the TLA process.
Advanced wastewater treatment (AWWT) is an elective subject offered at Universiti Malaysia Terengganu. The learning outcome of this subject is that the student will be able to explain the needs and processes, as well as be able to solve the engineering design problems, of an AWWT plant. For the course learning outcome (CLO) of this subject, the CLO1 to CLO3 are third to fifth cognitive and CLO4 is second affective. The CLO in Bloom’s taxonomy was discussed in detail by Krathwohl [11].
As a matter of fact, in designing wastewater treatment plants, it is required to ensure the ability of designed unit processes to reduce the level of constituents or pollutants in wastewater. The level of constituents in effluent should comply with the legislative requirements before discharging to a river or being reused for water reclamation. The AWWT plant design should also consider the levelized cost of construction and operation. Equally important, the environmental impact should also be considered by fending off any potential damage to the river or other water body caused by the treated effluent. In order to facilitate the simulation of an AWWT design problem at different influent conditions, a learning aid tool, namely Advanced Wastewater Treatment Computator (AWWTc), has been developed using a graphical user interface (GUI) in MATLAB R2018B version software, produced by the MathWorks, Inc., Natick, MA, USA.
2. The Benchmark of Simulation Tool
2.1. The Influent
Four files were created in MATLAB to represent four different kinds of wastewater that need to be treated with the different unit processes, including: (i) Standalone Depth Filtration, (ii) Depth Filtration with Membrane Separation, (iii) Depth Filtration with Adsorption, and (iv) Depth Filtration with Ion Exchange. Table 1 presents the type of constituents that could be removed by different unit processes of AWWT.

Table 1.
The wastewater constituents that could be removed by the different advanced wastewater treatment (AWWT) unit processes.
2.2. Theoretical Concepts
Advanced wastewater treatment is defined as an additional treatment needed to remove suspended, colloidal, and dissolved constituents remaining after conventional secondary treatment [12]. In the proposed learning aid tool, there are four selected AWWT unit processes to treat the secondary effluent, including: (i) Depth filtration, (ii) Membrane separation, (iii) Adsorption, and (iv) Ion Exchange.
2.2.1. Depth Filtration
Depth filtration involves the removal of constituents in wastewater by passing it through a granular filter bed [13]. In a wastewater treatment plant, depth filtration is commonly used to remove the residual biological floc in settled effluents from secondary treatment before disinfection or discharge to receiving water bodies. In addition, it also helps to remove residual precipitates from the metal salt, lime precipitation, and phosphate. In the depth filtration simulation, four design problems of depth filtration were considered, including; (i) Clean water headloss using Carman Kozeny and Rose equation, (ii) Backwash hydraulic, (iii) Changes of wastewater quality, and (iv) Dimensions of filter bed components
In filter hydraulics, the resistance to flow due to friction is called headloss. It is mainly caused by the accumulation of particles on top and within the depth of a filter [14]. A smaller size of granular media creates a higher tendency for smaller pore openings through which the water must pass. The small pore openings will increase the filtration efficiency, where the higher quality of water could be produced. However, as the size of a pore decreases, the headloss through the medium will increase. In contrast, the large size of granular media will create large pore size and reduce the headloss. However, many of the small particles in the influent will pass directly through the bed and cause a reduction of the filtered water quality.
To determine the clean water headloss in a granular-medium filter, two common methods were used, the Carman Kozeny [15] and Rose [16] equations. The variables that are involved in headloss calculation are the coefficients of drag, grain sizes, friction factor, acceleration due to gravity, depth of filter bed, granular porosity, granular shape factor, fraction of particles within the adjacent sieve sizes, superficial filtration velocity, and water density. The selection of headloss calculation methods depends on the uniformity of granular of the filter bed.
At the end of filtration, the backwash process needs to be conducted when the total suspended solids (TSS) in the influent start to rise and exceed the acceptable level. In addition, the occurrence of limiting headloss in the filter bed also the factors where the backwash process should be run, and the filtration terminated. The backwash is the process of cleaning or removing the TSS and other material that accumulated within the filter layer by reversing the flow of water through the filter by force. The simulation of backwash hydraulics for both uniform and non-uniform granular size requires the value of expanded depth, granular porosity, and expanded porosity.
2.2.2. Membrane Filtration
A membrane is a selective barrier that separates the constituents in wastewater during membrane separation, where the backwashing will be conducted at the end of the separation process due to membrane fouling [17]. There are four common types of pressure-driven membranes [18]: (i) Reverse osmosis, (ii) Nanofiltration, (iii) Ultrafiltration, and (iv) Microfiltration.
Inside the membrane technology, the transmembrane pressure is the pressure that is needed to press water through a membrane. The estimation of transmembrane pressure for both direct feed and cross-flow mode of operation requires the following variables, including the transmembrane pressure gradient, the inlet pressure of the feed stream, the pressure of the concentrate stream, and the pressure of the permeate stream. The transmembrane water flux rate is a function of the feed water quality, the degree of pretreatment, membrane characteristics, and the system operating parameter. The total permeate flow from the membrane system is the multiplication of the transmembrane water flux rate and the membrane area. As a matter of fact, some solute can pass through the membrane layer. Therefore, the solute flux through the membrane should be included in membrane separation simulation. The required variables in the estimation of flux rate are the solute mass transfer coefficient and a solute concentration gradient. Moreover, the recovery and rejection rate is also included in membrane simulation to estimate the percentage of treated water and separated solute.
Like the Depth Filtration method, the membrane separation also requires the backwash process to clean the foulant that accumulated inside the membrane layer. The foulant comprised of solute or particles that when entering into the membrane layer could reduce the membrane’s efficiency.
As a strategy to avoid the fouling potential on the membrane layer, the influent quality should be tested using several indexes. A widely used index to evaluate the wastewater quality is the Silt Density Index (SDI) [19]. To compute the SDI, the simple test was run. After the test, the value of time required to complete the initial sample of 500 mL, the time to collect a final sample of 500 mL, and the total time for running the test were collected before computing the SDI value.
Furthermore, the number of modules per rack is also determined as it is a significant factor that will affect the volume of separated effluent. To do so, the variables required to estimate the number of modules are influent flow rate, flux rate, membrane area per module, backwash interval per backwash cycle, and time required to complete the backwash process.
2.2.3. Adsorption
Adsorption is the process of adsorbate accumulation on a suitable adsorbent. The typical types of adsorbents include silica-based, synthetic polymeric, and activated carbon. The equations that are often used to describe the experimental isotherm data are Freundlich and Langmuir [20]. Freundlich Isotherm is frequently used to define the adsorption features of the activated carbon utilized in the wastewater treatment. The variables that are required in computing the Freundlich and Langmuir Isotherm are the mass of adsorbate adsorbed per unit mass of adsorbent, the Freundlich capacity factor, the equilibrium concentration of adsorbate in solution after adsorption, and the Freundlich intensity parameter. After all, to estimate the operational performance of the granular-activated carbon contactor, the following variables are required in the simulation: the empty bed contact time (EBCT), the activated carbon density, the specific throughput, the carbon usage rate (CUR), the volume of water treated for a given EBCT, and the bed life.
2.2.4. Ion Exchange
Ion Exchange is an AWWT unit process in which ions of a given species are displaced from an insoluble exchange material by ions of a different species in wastewater [21]. The water hardness is one of the effluent problems that can be reduced by the ion exchange unit process. The lessening of hardness is also known as water softening, where the sodium ions from a cationic-exchange resin replace the magnesium and calcium ions in the wastewater.
Wélté et al. (2009) presented in detail useful guidelines to implement the ion exchange unit process for portable water treatment [22]. The different concentrations and types of regenerant utilized to restore the resin will create different exchange capacities [23]. The typical exchanger capacities of the zeolite cation exchanger are in the range of 0.05 to 0.1 eq/kg and for synthetic resin is 2 to 10 eq/kg of resin. Strong acid or strong Sodium Chloride (NaCl) will be used to wash the resin to place all the exchange sites on the resin with H+ and Na+ form respectively. The exchange capacity of the resin can be estimated by multiplying the throughput volume between Cl− and Ca2+ breakthrough curves at C/Co is 0.5 with the calcium concentration, and then divided by the weight of the resin.
2.3. The Graphical Interface Development
The MATLAB-based learning aid tool was built to increase students’ understanding of the solving method of the selected AWWT design problem. The graphical user interface (GUI) is a graphical display of one or more windows that contain controls or components that allow users to perform tasks interactively. The developed interface contains various elements that are involved in processing the simulation such as buttons, tables, axes, or menus, as shown in Figure 1.
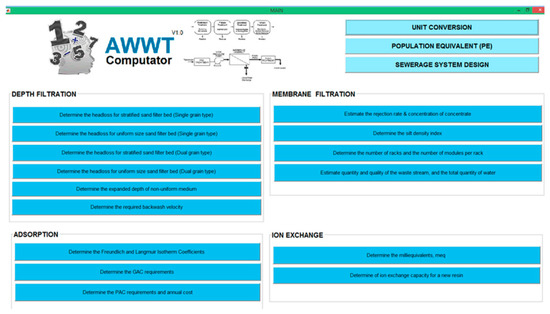
Figure 1.
The main screen of the AWWTc computator.
The AWWTc tool was designed to be able to solve the design problem for four different AWWT unit processes: (i) standalone depth filtration, (ii) depth filtration with membrane separation, (iii) depth filtration with adsorption, and (iv) depth filtration with ion exchange. In operating the tool, the user, either the student or teacher, manipulates the control element to perform an act of simulation. The architecture ranks of the simulation process were starting from the AWWT unit process that could remove the lowest number of wastewater constituents as presented in Figure 2. The membrane separation technique was arranged as the last choice in AWWTc simulation due to its ability to remove more constituents compared to ion exchange, adsorption, and depth filtration. For any computation that requires an iteration process to solve it, the linear and nonlinear equation solvers that are provided in the MATLAB optimization toolbox function were adopted. At the end of the simulation process, the result was produced and presented numerically and graphically.
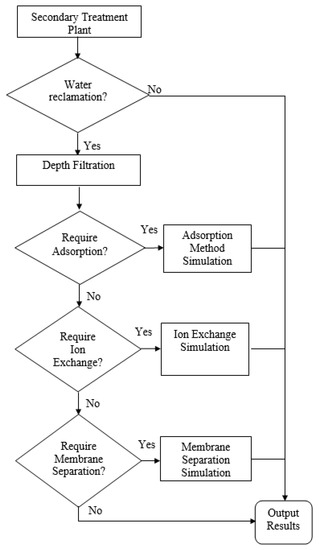
Figure 2.
The flow of tool run operation.
3. Application in Teaching, Learning, and Assessment
The developed AWWTc is an interactive tool that allows users to play an active role during simulation and discovery learning. All things considered, the Check and Balance Approach (CBA) was proposed to ease and fasten the period of the TLA process. Literally, according to Ref. [24], the check was defined as examining something in order to determine its accuracy, quality, or condition. While balance is defined as a situation in which different elements are equal or in the correct proportions. Therefore, the combination of word check and balance was introduced to the TLA process, where both teacher and student work together in understanding the fundamental concept, as well as accurately solving the AWWT design problems. The flow of CBA in the TLA process is presented in Figure 3.
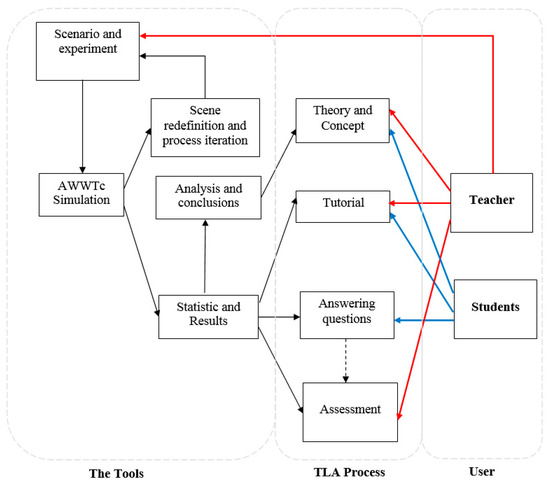
Figure 3.
The check and balance approach in TLA process.
In the CBA model, there are three components: (i) the tool (AWWTc), (ii) TLA process, and (iii) User (teacher or students). For teachers, AWWTc could be used as a teaching aid for AWWT concept and theory, as well as during teaching in the tutorial class. In addition, the teacher can also use the tool like a calculator to speed up the process of assessment of students’ assignments and examination. In the same way, for students, the AWWTc could be used as a learning aid for AWWT concept and theory, as well as for calculation in the tutorial class. The students can also use it as a calculator to check the accuracy of their answer during completing the assignment or self-learning.
There are benefits of the AWWTc application tool with the check and balance approach in the TLA process. The tool will help to enhance the understanding of the concept or theory of the AWWT subject by iterative computation and sensitivity analysis. The AWWTc also allows the students to observe the behavior of the AWWT plant by comparing the iterated results in different wastewater scenarios. In addition, the students can also strengthen their knowledge about AWWT technology as well as evaluate the effects of different AWWT unit processes in producing the desired water quality. In summary, there is a double-feedback process when the tool is used in the TLA process. The tool execution allows the user to analyze the different design performances of the AWWT unit process. On the other hand, after examining the global results of unit process performance, several conclusions can be inferred by the user, who can change the settings and restart the simulation. This repetitive process increases the understanding of the students about AWWT plant design and operation. Moreover, the developed tool allows students to check their works during self-learning and completing assignments. With the self-discovery learning offered by the developed tool will help the students to learn and solve their own problems and situations, learn AWWT technology and understand the process features. Furthermore, the developed tool also helps to reduce the time taken to complete the TLA process, especially during the short period of the semester.
4. Close-ended Survey Analysis
This study uses the google form, an open source website for conducting simple online surveys. A form was developed with two close-ended questions to assess the acceptance of students to the use of AWWT in teaching, learning, and assessment processes. The advantages of using a close-ended survey are the speedy responses from respondents; it is easier to answer questions; and the data is quickly coded, entered, and analyzed [25]. There were 75 students who registered to this subject in the early semester; 27 left (drop subject) and 49 out of the remaining 49 answered the questionnaire. Before conducting the online survey, the respondents were given experience with the AWWTc tool in their learning process.
In total, of the 49 valid entries, 43 respondents were females and 6 respondents were males with age in a close range of 21 to 23 years old. The gender distribution reflects that only 12% of male students registered to this elective subject compared to 88% of female students.
To understand the perceptions of respondents regarding the difficulty of the subject, their opinions were collected. Figure 4 below depicts the perception of the respondents towards the difficulty of the subject. About 79% of the respondents agree the the subject is hard to score in the examination. This result gives a strong indication that there is a need to find innovative solutions to reduce the perception of the student about the difficulty of this subject. Most respondents made an early assumption about the difficulty of this subject after knowing the subject syllabus requires them to solve many design problems by numerical computation.
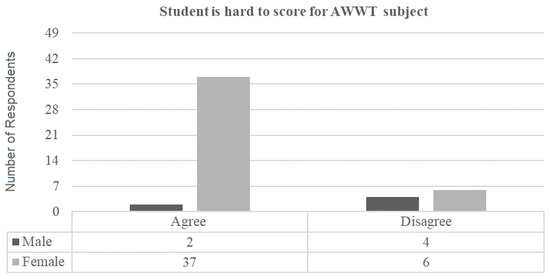
Figure 4.
The perception of respondents towards the difficulty of the subject.
To know the opinions of the students regarding the improvement of their learning experience after using the developed tool, the following chart is plotted in Figure 5. This figure depicts that all respondents agree that the developed tool helped them to accelerate their understanding of the subject topic. The results showed that the developed tool is an essential tool that can an aid in the TLA process.
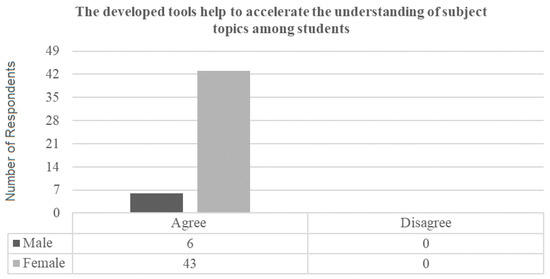
Figure 5.
The respondents’ opinions on the result of using the developed tool in their learning process.
From the analysis of the survey, the result for the first question suggests that the subject is difficult for most of the students. The first question reflects a significant number of students with some resistance to doing engineering calculations, although they are students in the third and fourth year, already in engineering mathematics and design disciplines. The students’ perceptions of the difficulty of the subject are usually due to the need to solve engineering problems or mathematics in the syllabus [26]. However, it has not been a sufficiently strong constraint that has prevented students from being able to answer the examination questions. The result of the first question also gives the indication that the teacher of the mentioned subject should consider important the use of diversified strategies that deviate from the conventional teaching of the subject.
Regarding the answers to the second question, it is found that they have a very strong majority opinion of the statement that the developed tool helps to accelerate their understanding of the topic of the mentioned subject. This indicates that the students consider that the tool has helped them to increase their learning process, which has also been more autonomous. This can be verified by comparing the result of the first and second test. Figure 6 showed that there is a gradual improvement of test results with a 2.5–65.3% enhancement with an average of 35.6%.
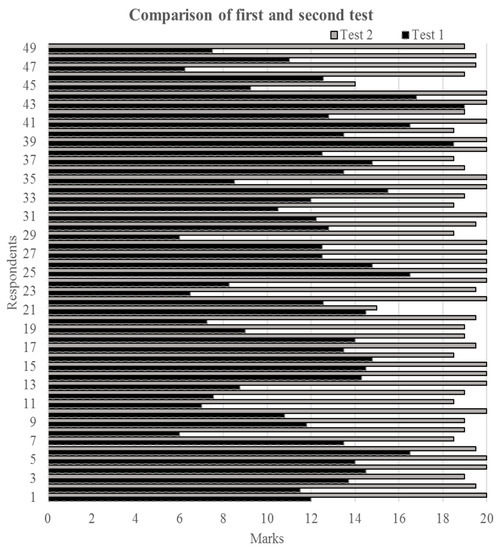
Figure 6.
The results for the first and second test.
Overall, the current limitation of this study is the number of students that were involved in the survey, despite the efforts of the authors to receive more data. In an upcoming study, more students will be involved. For future work, we intend to further develop the tool by integrating it with the drafting function and adding more unit processes of advanced wastewater treatment such as advanced oxidation and distillation.
5. Conclusions
In summary, this project highlights the application of the AWWTc tool in teaching, learning and assessment processes based on a check and balance approach. The AWWTc tool was developed in a MATLAB-based graphical interface. The graphical interface allows for a realization set of simulation based on different AWWT design scenarios. The developed tool is useful for the analysis of different design problems and the operation of the AWWT plant. In addition, the GUI also allows for an orderly display of the results of the simulation.
To sum up, using the AWWTc tool as a TLA support to understand the design and operation of advanced wastewater treatment contributes to several advantages:
- The installation of the developed interface can be easily processed in any computer which does not require to purchase a database or expensive software.
- The utilization of the developed tool as a teaching or learning aid will always suppose a cheaper solution for an easier and faster TLA process.
- The AWWTc tool allows the user to changing the settings of the different scenario components to reproduce new desired results.
- The simulation process using the tool allows the student to get a detailed statistical result that can be used to examine the design of advanced wastewater treatment unit processes.
Abbreviations
| AWWT | Advanced Wastewater Treatment |
| AWWTc | Advanced Wastewater Treatment Computator |
| CLO | Course Learning Outcome |
| TLA | Teaching, Learning, and Assessment |
References
- Atkinson, R.C. Computerized instruction and the learning process. Am. Psychol. 1968, 23, 225–239. [Google Scholar] [CrossRef] [PubMed]
- Suppes, P.; Morningstar, M. Computer-Assisted Instruction. Science 1969, 166, 343–350. [Google Scholar] [CrossRef] [PubMed]
- Ghavifekr, S.; Rosdy, W.A.W. Teaching and Learning with Technology: Effectiveness of ICT Integration in Schools. Int. J. Res. Educ. Sci. 2016, 1, 175–191. [Google Scholar] [CrossRef]
- Roschelle, J.; Kaput, J. Educational Software Architecture and Systemic Impact: The Promise of Component Software. J. Educ. Comput. Res. 1996, 14, 217–228. [Google Scholar] [CrossRef]
- Tajudin, N.M.; Tarmizi, R.A.; Ali, W.Z.W.; Konting, M.M. Effects of Using Graphic Calculator in Mathematics Teaching and Learning on Performance and Metacognitive Awareness. Am. Int. J. Contemp. Res. 2011, 1, 59–72. [Google Scholar]
- Jackson, S.L.; Stratford, S.J.; Krajcik, J.; Soloway, E. Making Dynamic Modeling Accessible to Precollege Science Students. Interact. Learn. Environ. 1994, 4, 233–257. [Google Scholar] [CrossRef]
- Goldman, A.I. Argumentation and Social Epistemology. J. Philos. 1995, 91, 27–49. [Google Scholar] [CrossRef]
- MOE. Preliminary report: Executive summary, Malaysia Education Blueprint 2013–2025. Putrajaya 2012. [Google Scholar] [CrossRef]
- Simin, G.; Sani, I.M. Effectiveness of ICT Integration in Malaysian Schools: A Quantitative Analysis. Int. Res. J. Qual. Educ. 2015, 2, 1–12. [Google Scholar] [CrossRef]
- Estonanto, A.J.J. Acceptability and Difficulty of the STEM Track Implementation in Senior High School. Asia Pac. J. Multidiscip. Res. 2017, 5, 43–50. [Google Scholar]
- Krathwohl, D.R. A Revision of Bloom’s Taxonomy: An Overview. Theory Pract. 2002, 41, 212–219. [Google Scholar] [CrossRef]
- Al-Rekabi, W.S.; Qiang, H.; Qiang, W.W. Improvements in wastewater treatment technology. Pak. J. Nutr. 2007, 6, 104–110. [Google Scholar] [CrossRef]
- Ncube, P.; Pidou, M.; Stephenson, T.; Jefferson, B.; Jarvis, P. Consequences of pH change on wastewater depth filtration using a multimedia filter. Water Res. 2018, 128, 111–119. [Google Scholar] [CrossRef]
- Boller, M.A.; Kavanaugh, M.C. Particle characteristics and headloss increase in granular media filtration. Water Res. 1995, 29, 1139–1149. [Google Scholar] [CrossRef]
- Tien, C.; Ramarao, B.V. Can filter cake porosity be estimated based on the Kozeny-Carman equation? Powder Technol. 2013, 237, 233–240. [Google Scholar] [CrossRef]
- Daneshi, N.; Banejad, H.; Hamedany, R.P.; Daneshi, V.; Farokhi, M. Evaluate of Head Loss, Sediment Value and Copper Removal in Sand Media (Rapid Sand Filter). Int. J. Environ. 2014, 3, 276–286. [Google Scholar] [CrossRef]
- Iorhemen, O.T.; Hamza, R.A.; Tay, J.H. Membrane bioreactor (Mbr) technology for wastewater treatment and reclamation: Membrane fouling. Membranes 2016, 6, 33. [Google Scholar] [CrossRef]
- Ejraei, A.; Aroon, M.A.; Saravani, A.Z. Wastewater treatment using a hybrid system combining adsorption, photocatalytic degradation and membrane filtration processes. J. Water Process Eng. 2019, 28, 45–53. [Google Scholar] [CrossRef]
- Rachman, R.M.; Ghaffour, N.; Wali, F.; Amy, G.L. Assessment of silt density index (SDI) as fouling propensity parameter in reverse osmosis (RO) desalination systems. Desalin. Water Treat. 2013, 51, 1091–1103. [Google Scholar] [CrossRef]
- Chung, H.-K.; Kim, W.-H.; Park, J.; Cho, J.; Jeong, T.-Y.; Park, P.-K. Application of Langmuir and Freundlich isotherms to predict adsorbate removal efficiency or required amount of adsorbent. J. Ind. Eng. Chem. 2015, 28, 241–246. [Google Scholar] [CrossRef]
- Zhang, X.; Ye, C.; Pi, K.; Huang, J.; Xia, M.; Gerson, A.R. Sustainable treatment of desulfurization wastewater by ion exchange and bipolar membrane electrodialysis hybrid technology, Sep. Purif. Technol. 2019, 211, 330–339. [Google Scholar] [CrossRef]
- Wélté, B.; Autugelle, C.; Boudenne, J.L.; Chambon, P.; Montiel, A.; Pontie, M.; Rumeau, M.; Feigenbaum, A.; Herault, S.; Thouet, A.; et al. Guidelines on the Assessment of Ion Exchangers Used for the Treatment of Water Intended for Human Consumption, 2009. Available online: https://www.anses.fr/en/system/files/EAUX-Ra-ResinesEN.pdf (accessed on 12 January 2019).
- Mohammadtabar, F.; Pillai, R.G.; Khorshidi, B.; Hayatbakhsh, A.; Sadrzadeh, M. Efficient Treatment of Oil Sands Produced Water: Process Integration Using Ion Exchange Regeneration Waste as a Chemical Coagulant. Sep. Purif. Technol. 2019. [Google Scholar] [CrossRef]
- Stevenson, A. Oxford Dictionary of English, 3rd ed.; Oxford University Press: Oxford, UK, 2010. [Google Scholar] [CrossRef]
- Hyman, M.R.; Sierra, J.J. Open-versus close-ended Survey Questions. Bus. Outlook 2016, 14, 1–5. [Google Scholar]
- Firouzian, S.; Ismail, Z.; Rahman, R.A.; Yusof, Y.M. Mathematical Learning of Engineering Undergraduates. Procedia Soc. Behav. Sci. 2012, 56, 537–545. [Google Scholar] [CrossRef]
© 2019 by the authors. Licensee MDPI, Basel, Switzerland. This article is an open access article distributed under the terms and conditions of the Creative Commons Attribution (CC BY) license (http://creativecommons.org/licenses/by/4.0/).