Abstract
Although condition monitoring is very important for a reliable operation of tram powertrain components, conventional wired sensor systems do not manage to find wide acceptance because of installation and security costs. To address those issues, we propose a novel condition monitoring system based on a wireless and energy self-sufficient sensor network, where the individual sensor nodes harvest energy from vibrations, occurring while the tram is in motion. First, we performed an experimental investigation to identify the most important boundary conditions for the system design. Second, we designed individual sensor nodes using parameters derived from the previous investigation. Finally, the sensor network was deployed and tested on the tram gearboxes. The obtained measurement data were recorded at a sufficient sampling rate of 4.56 kHz and were successfully transferred from the tram gearbox to the network base station within a radius of 10 m inside the tram despite factors such as reflections, fading and electromagnetic compatibility. A piezoelectric vibration harvester is the power supply for the sensor nodes and it delivers up to 21.22 mW for relevant vibration frequency range between 10 Hz and 30 Hz, thus enabling deployment of autonomous sensor nodes.
1. Introduction
In growing urban environments, trams are an essential part of public transportation. The challenge is to facilitate efficient transportation of ever-increasing number of passengers every day. That results in higher requirements for tram utilisation in terms of streetcar availability and service downtime due to technical breakdowns. This can be supported by, e.g., a condition-based maintenance strategy delivering current information about the state of the tram drive components, which are subject to daily wear and tear [1].
Inspections of tram vehicles are scheduled by the maintainer several times a month and inevitably lead to planned service downtime. In addition, according to the German regulations [2], a general inspection is required every eight years or 500,000 km. Today, the maintenance consists of gathering condition data by sensors and determining the specific maintenance work based on the collected information. Several sensors are attached to the tram drive components that are subject to wear, ensuring continuous monitoring. Together, they form a sensor network that send measurement data to a control centre via a star-shaped network configuration. The first wireless-based approaches for tram monitoring are presented in [3,4,5,6]. The power supply and data transmission within the sensor network must be wireless. In contrast, multiple cable bundles can be torn easily because of moving components caused by spring and damper strokes. Multiple cable bundles also lead to considerably increased maintenance and motor supply cables can induce parasitic influences in the measurement cabling. Long measurement cables reduce the transferable frequency range for an analogue signal, which limits the ability to analyse high frequency vibration signals. Another obvious advantage of the wireless diagnostic technology is the “drag and drop” of many individual sensors reducing installation and maintenance costs.
As wireless sensor nodes power supply, Vibration Energy Harvesting (VEH) appears to be a promising solution [7]. Unlike batteries, VEH can provide a continuous energy supply, while the batteries are temperature-dependent, which leads to non-deterministic battery end-of-life and premature replacement. As expected, the logistical effort to change batteries results in increased maintenance costs. The advantage of using VEH with respect to other types of harvesting (e.g., thermal [8] or solar [9] harvesting) is the permanent availability of unused tram vibration energy. An example of the use of thermal harvesting is given in [10]. This harvesting technology is unsuitable for use in summer because the temperature difference between heat source and environment is smaller than in the winter. It is also observed that the gearboxes are operated far below their design parameters and it is unrealistic to expect radiation of large amounts of heat. Another alternative application scenario is presented in [11]. In this setup, a single wheel set is examined. The possible application on gears is pointed out. From a diagnostic point of view, damage-relevant vibration signals of a wheel set occur in the lower frequency range, where the diagnosis on gears clearly stands out, as they are observed in the high-frequency range of up to 0.5–10 kHz. Another disadvantage of electromagnetic VEH is that its reliable functionality is not sufficient near metallic or magnetic components.
Measurements of vibrations can be analysed for diagnosis, because they contain suitable indicators for faulty behaviour of tribological components (e.g., rolling bearings or gears). In general, we take advantage of the correlation between the damage progress and the extracted indicators from the observed data. In addition, the indicators from the vibrations time domain contain spectral information that can provide insights about the specific type of damage [12].
The novelty in the presented paper is the feasibility investigation of a fully wireless sensor network for condition monitoring of tram powertrain components. We designed a wireless sensor network powered by VEH converters, which are specifically developed for the tram applications. We focused on experimental estimation of the specific application requirements and on performance evaluation of the system design.
2. Analysis of the Tram Drive Components
2.1. Installation Space and Component Analysis
The installation space analysis enables the identification of suitable measuring points on the tram drive components where the structure-borne sound can be better transmitted without additional coupling elements. In cases where the use of coupling elements is necessary, screw connections are most suitable because they do not significantly influence the signal to be transmitted. Their natural frequency does not match the frequency range of the transmitted signal [13].
Because low-floor vehicles have low entry height, the installation space is limited and must be examined for sufficient space for the sensors. Furthermore, parasitic influences from motor supply cables must be kept to a minimum. For successful operation, stable communication between the sensors must be maintained.
The tram component investigated is a motor bogie, as shown in Figure 1. Basically, it consists of a frame while the other components of the overall drive train are attached to it. This includes two smaller drive trains, each consisting of two wheels, a hollow shaft, a two-stage gearbox and a motor.
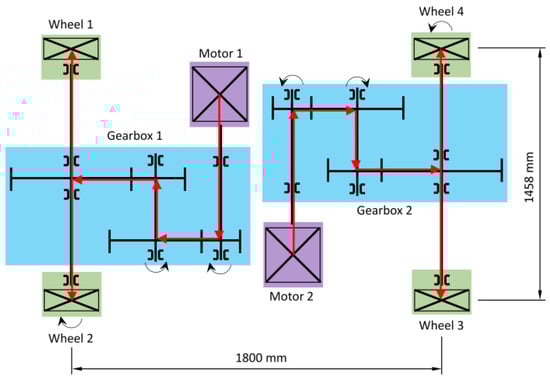
Figure 1.
Schematic diagram of the investigated motor bogie.
2.2. Metrological Analysis
For the mechanical resistance of the sensor system and for the identification of usable frequency ranges for the VEH, metrological cable-bound investigations were initially carried out with a conventional measuring system, as shown in Figure 2 [6]. For this purpose, relevant drive components were equipped with industrial acceleration sensors in vertical and horizontal measuring directions. Overall, they were fixed at suitable measuring points with epoxy resin adhesive, which has a good transfer behaviour, to avoid amplitude amplification in relevant frequency ranges. The effect of the amplitude amplification comes from the natural frequency behaviour of the coupling medium or the coupling conditions. To fasten the sensors to the gearbox measuring points, threaded holes were used to attach lifting eyes.
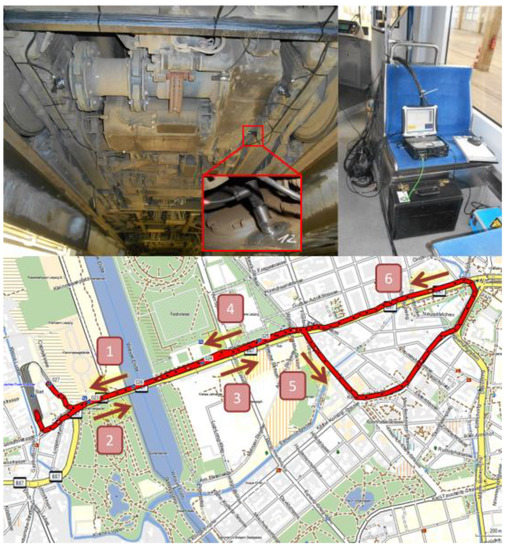
Figure 2.
Comparative investigations with cable-bound measurement technology [6]. The upper figure shows the installation conditions of the sensors.
To investigate various application scenarios, manually triggered vibration measurements were carried out under different track conditions. The measurements were taken during the acceleration drives as well as for three different tram speeds: 30, 40 and 50 km/h. To analyse the influence of the maintenance condition of the tram on the vibration level of the motor bogie, different trams in different maintenance conditions were also examined [6].
These data are important with regard to the amount of energy to be harvested to estimate how the energy life of the sensor node can be quantified, improved and optimised [14]. The frequency range 10–30 Hz is particularly suitable for the energy harvester. Due to the speed vibrations and the associated harmonics, the energy harvester can reliably operate in this frequency range because this frequency range includes the three rotary frequencies of the three gear shafts of the two-stage tram gearbox. This means that there are several excitation frequencies for the VEH during tram movement. In cases where the tram speed varies because of the driving profile (braking and acceleration), the resonance frequency of the VEH is passed through more often. Other external noises, e.g., from the wheel–rail contact, even favour the VEH operation, because these noises lead to shocks and always excite the VEH.
Figure 3a shows a time signal of the vertical oscillations (red) on a gearbox and the tram wheel speed (black). In the left area (from 0 to 4.5 s) the tram accelerates and in the right area (from 5.5 to 10 s) a deceleration takes place. The tram runs at a constant speed between 4.5 and 5.5 s. Due to the widely varying operating conditions, it can be seen that different frequency ranges are excited to a greater or lesser extent in different periods. For this purpose, the signal was analysed by using a short time Fourier transform in Figure 3b. To make it easier to interpret the frequency spectra, their curves were projected onto the axis of the vibration acceleration.
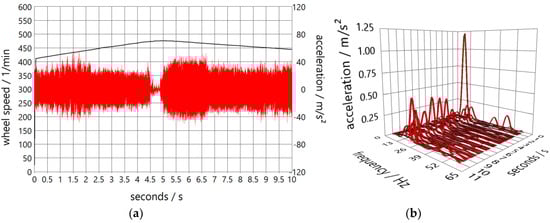
Figure 3.
Comparative measurement data from a tram gearbox under varying operating conditions (a); and an associated short time Fourier transform to determine suitable frequency ranges for vibration energy harvesting (b).
3. Structure and Development of the Sensor Network
3.1. Requirements and Structure
Many measuring points have to be equipped with sensors for the large-area measurement of the vibration state of a motor bogie. For the first test of a sensor network, it is sufficient to equip two measuring points with sensor nodes. The prototype implementation includes two sensor nodes, which form a star-shaped network. The base station or data server is located in the centre of the network and is accessed by a control centre during the measurements. It downloads, evaluates and visualises the sensor data.
The sensor nodes should be able to acquire the acceleration measurement data wirelessly and in an energy self-sufficient manner. Furthermore, all recorded raw measurement data should be transferred to the data server. The sensors are attached on the tram drive components of the motor bogie. The central data server is located in the passenger cabin of the tram, where it can be placed under a passenger seat. In addition, the network elements must be able to maintain reliable communication through the tram floor. The sensor nodes communicate only with the base station.
For the hardware implementation of the sensor nodes, electronic components and circuit boards that are already available on the market were selected at the lowest possible cost. As described in [15], a distinction is made between energy supply (harvester, energy converter (AC/DC), energy management and memory) and sensor technology with associated signal processing (acceleration sensor with integrated ADC, microcontroller and transmitter/receiver unit, if necessary).
3.2. Design
3.2.1. Energy Supply
Energy is supplied in the long term via a piezoelectric VEH. The advantage of a piezoelectric VEH compared to an electromagnetic VEH is the possibility of implementation in presence of magnetic components in addition to the high electromagnetic compatibility with the surrounding sensor system. In combination with an energy management module (EMM) and a lithium polymer accumulator (LiPo, 3.7 V and 2500 mAh), the sensor power supply and the associated signal processing are guaranteed. First, the volatile electrical energy generated by the VEH is rectified by the EMM. Then, the LiPo is charged according to the IU method (CCCV (Constant Current Constant Voltage)). In addition, the EMM already has a deep discharge protection for the LiPo.
On the basis of simulation investigations, the energy consumption of the electronic components can be estimated under certain conditions (e.g., duration of measurement pauses, sampling rate, and transmission rate) [1,16,17]. In addition, the selection of the electronic components was optimized with regard to their energy consumption. Based on this, the piezoelectric VEH (E-821.EHD) from PI CERAMICS [18] was selected. To estimate the real electrical energy output, measurements were carried out on a shaker (Figure 4). The piezoelectric VEH is applied as a film on a bending beam made of carbon fibre reinforced plastic (CFRP). The masses ( = 60 g and = 20 g) are used to adjust the natural frequencies ( = 15.3 Hz and = 24.2 Hz) of the spring–mass damper system. The settings made on the VEH (mass m or frequency f) and on the shaker (a, excitation amplitude of the acceleration signal) depend on the results of the cable-bound comparison measurements shown in Figure 3. To set the correct acceleration amplitude on the shaker, an acceleration sensor was used to measure it. Then, the amplitude was adjusted manually.
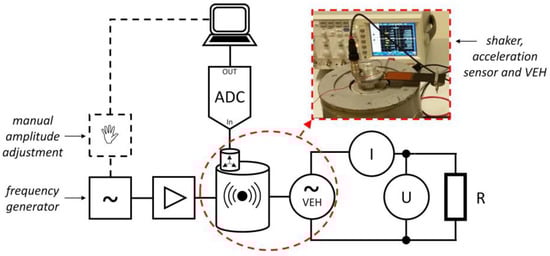
Figure 4.
Experimental set-up for the metrological investigation of the piezoelectric Vibration Energy Harvesting (VEH).
Specifically, at low-frequency oscillations, high displacement amplitudes are more often compared to at high-frequency signal components. Therefore, they are the reason for the choice of the frequency range. From Equations (1)–(4), it can be concluded that the amplitude of the oscillation path is inversely proportional to the square of the frequency.
where
is the constant amplitude at the frequency and , and are, respectively, the acceleration, the velocity and the displacement.
From the measurements, the power can be expressed as a function of the two measured variables voltage (U) and current (I) with load resistance (R), as given in Equation (5):
The measured behaviour is given in [18] and it gives a very good first impression of the expected electrical power, as given in Equation (6):
where C is the electrical capacitance of the piezo foil. For the tested VEH, it is [18]. The frequency f refers to the frequency at which the film or the bending beam is oscillating. If the system oscillates in resonance, the natural frequency can be simply selected.
It was observed that an electrical power of 21.22 mW can be harvested at the natural frequency of = 15.3 Hz and at a sinusoidal excitation with a = 3 m/s2, as depicted in Figure 5. For the application in the sensor node, a second piezo foil was glued with two-component epoxy resin adhesive on the bottom of the bending beam. By parallel connecting these two foils, the downstream components are to be protected against excessive voltage peaks, as shown in Figure 6. Subsequent measurements have confirmed that this almost doubles the electrical power that can be achieved.
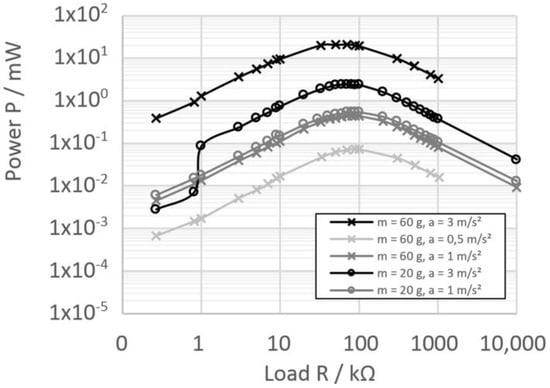
Figure 5.
Electrical power of the piezoelectric VEH (one foil) at different natural frequencies and excitation amplitudes.
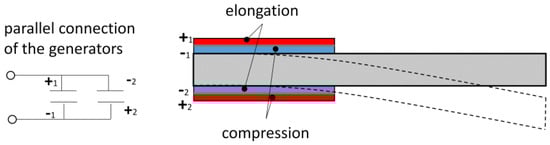
Figure 6.
Parallel connection of two piezo films on the carrier substrate to avoid excessive voltage peaks.
3.2.2. Energy Consumption and Overall Design
When selecting electrical consumers, the concept for optimised overall energy consumption is critical because the energy consumption depends on the actual measuring task and the following data handling. Therefore, a MEMS-based digital acceleration sensor (ADIS16223, [19]) was selected for data acquisition. The three-axis acceleration sensor already has its own analogue-to-digital converter (ADC) and is optimised for condition monitoring. For each acceleration axis, 1024 samples can be acquired at different sampling rate settings. In the extended measurement mode of the sensor, the memory locations of two acceleration axes (e.g., x and y axes) can also be used for the third axis to triple the measurement time. Furthermore, the temperature for calibration of the sensor is also recorded. The initialisation of the digital acceleration sensor and the readout of the measured data are carried out via a Serial Peripheral Interface (SPI) connection. Then, the read-out measurement data should be available for further (offline) analyses and sophisticated mathematical analyses (e.g., fast Fourier transform, Hilbert transform and order analyses), which are applied to the measurement data to detect failure parameters. In the case of a microcontroller board as a controller, the bottleneck would be the available energy, the limited memory and the performance of the microcontroller board. To overcome those limitations, it was decided to send the complete acceleration data to a central server unit. WLAN or Bluetooth are more suitable for sending large amounts of data, as is the case with acceleration data at high sampling rates (up to 51.2 kHz). More energy-efficient radio protocols are only suitable for sending very small amounts of data (e.g., controlling a radio switch). However, the use of these radio protocols results in an enormous loss of energy. This energy loss can later be compensated by the energy harvested with the VEH during the long “sleeping times” of the sensor node. The possibility to keep long measuring breaks becomes clear in the context of the measuring task because wear is a slow process. Thus, the intervals between two measurements can be longer until the first condition describing changes in the measurement data starts to appear. During this time, sufficient energy can be harvested via the VEH to be able to send new measurement data [16,17]. In addition, the used microcontroller board (ESP8266 demo kit) is very well suited for this task, since it already has energy-saving strategies due to various operating modes (“active mode”, “sleep mode” or “deep sleep mode”) [20].
Figure 7 shows the complete sensor node with all installed components and the associated block diagram including the current consumption. The housing is made of two types of materials. To be visible, the upper part is made of glued Plexiglas. The base is made of an aluminium plate (sensor plate). Aluminium is particularly suitable for use in the electromagnetic compatibility (EMC) area. Below and in the middle of the sensor plate there is a threaded mounting bolt for screwing the sensor node into the threaded hole for the gearbox lifting eyes. The digital acceleration sensor was placed almost in the centre above the threaded mounting bolt. This is designed to directly couple the structure-borne sound into the MEMS acceleration sensor. The VEH was clamped on one side while the inertia mass can be adjusted and slipped via a clamp for a specific application (thus, the natural frequency can be set). All components have been placed such that the bending beam has enough space for the displacement of the mass. The battery is attached to the side wall with a strong Velcro strap.
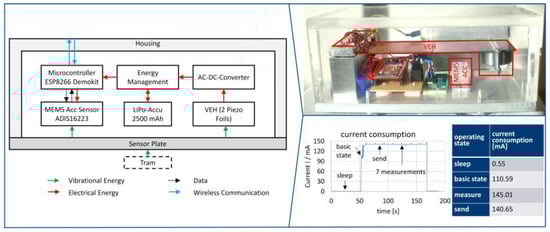
Figure 7.
Overall design of the wireless and energy self-sufficient sensor network node and measured current consumption in the four operating states.
The current measurements demonstrate how the current consumption of the whole sensor node (without VEH) varies during operation. With the installed components, the power consumption during “sleeping” can be reduced to 0.55 mA. However, in the basic state, the main loads (microcontroller board and acceleration sensor) are switched on. After initialisation of the sensor, the first of the seven proposed measurements starts. The number of measurements can be specified variably. Each measurement is carried out in an extended mode, which means that the triple measurement time of approximately 0.67 s has been achieved. The measuring time is calculated from the sample number S = 1024 (per axis buffer or memory location) multiplied by 3 (number of axis buffers) divided by the sampling frequency of 4560 Hz. It takes much longer to send than to measure. For instance, if only one measurement is carried out, the total switch-on time is 23.5 s. The sensor node wakes up after the “sleep mode” for a pre-defined period. If the WLAN signal of the central data server is received, the measurement can be initialised. Otherwise the sensor will go back to “sleep mode”.
4. Application on Tram Drive Components
The functional test of the sensor network was carried out under real operating conditions on the tram. During the test, only the scientific staff and the train driver were on the tram. The focus was on the verification of:
- the functionality of the mechanical design and the adaptability and coupling capability of the housing to the gearbox measuring points;
- the interaction of the software parts on the sensor node, the base station (Raspberry Pi) and on the control station (laptop);
- the transmission of measurement data from the area of the motor bogie to the passenger cabin via WLAN; and
- the reception of GPS data on the data server in the passenger cabin of the tram.
The sensor nodes worked in continuous operation to collect as many measurement data as possible. The amount of harvested energy was not logged. During the tram ride, GPS and acceleration measurement data were recorded without any problems. There was no evidence of interference from metallic objects or interfering radio frequencies of other participants (possible in larger city centres) or other RF interference.
The aim of using GPS was to roughly determine the position of the tram to check the suitability of the measuring point in the track network. The intention was to differentiate between straight track sections and curved track sections or crossing areas because of unacceptable track conditions, e.g., switches. Although the reflection of GPS on house wall led to large deviations in localisation, the quality of the GPS data was estimated to be sufficient. Therefore, the delay times caused by the communication, the GPS and the hardware were not compared.
As shown in Figure 8, the data server was located directly above the sensor nodes. The reception of the measurement data in the tram was possible within a radius of 10 m. The fourth participant in the network is the control station. It accesses the data or webserver’s homepage via Wi-Fi and visualises the acceleration and GPS data in almost real time. To extend the range of data transmission from the motor bogie to the passenger compartment, the following options are available:
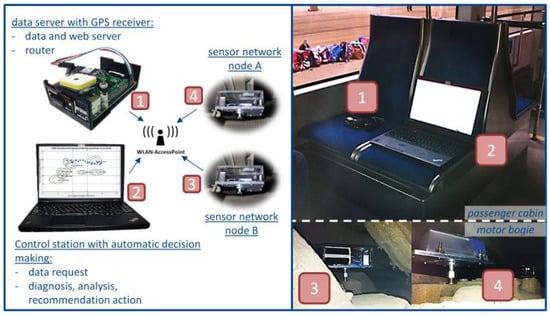
Figure 8.
Developed wireless sensor network on the motor bogie of a tram.
- set up a data server (Raspberry PI) for each motor bogie;
- use ESP8266s as repeaters to amplify the signal; or
- establish a meshed radio network (instead of a star network) between the nodes so they can transmit the data of the other nodes.
In Figure 9, an interface was created for evaluation and visualisation, which is also open for future evaluation algorithms. On the one hand, an evaluation can be carried out on the basis of fixed characteristic values and, on the other hand, a condition characterisation can take place on the basis of a priori known class by means of fuzzy (FUZZY) classification. A multidimensional characteristic space can be the basis for this, whereby the two-dimensional characteristic space is displayed for the selection of two characteristics [1,21].
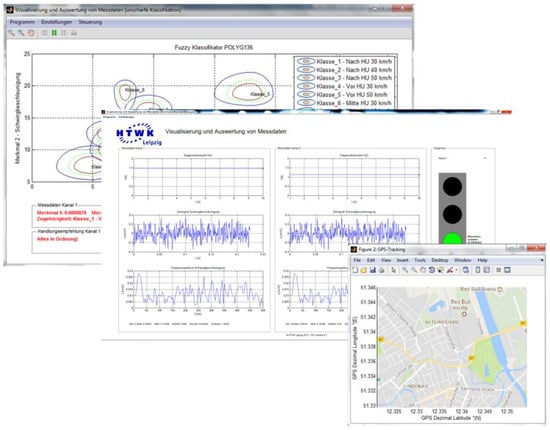
Figure 9.
Software interface for evaluation and visualisation of acceleration and GPS data.
During the application test, a gearbox of a tram was equipped with wireless sensors that was measured with conventional sensors 1.5 years ago. Even then, the gear mesh frequencies (GM) of the first and second stages as well as the associated harmonics (Harm.) and sidebands (SB) were clearly visible. A section of the spectrum is shown in Figure 10. These are usually the first signs of damage to gear drives, which are not discussed in more detail here.
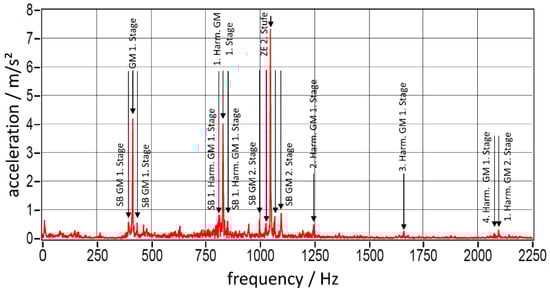
Figure 10.
Frequency spectrum of an acceleration signal detected with conventional (cable bounded) sensors on the gearbox of a tram in advanced maintenance condition at a speed of 50 km/h (detail).
The similar frequency spectrum of the acceleration signal obtained with the wireless sensors underlines the metrological suitability of the developed sensor system. In the following, the differences between results shown in Figure 10 and Figure 11 are explained and their causes are mentioned. First, the position of the first gearbox stage GM varies. Thus, the SBs also vary from the respective distance from their centre frequencies (GM, Harm.). One reason for the varying GM of the first stage is the approximate adherence to the test speed of 50 km/h, since the operation of the tram depended on the skill of the tram driver. In addition, no speed reference was measured. Another cause is the reprofiling of the wheel tyres of heavily worn tram wheels (polygon). The wheel tyres are turned around again by a turning machine. The wheel diameter is reduced to a still permissible dimension. However, the reduction in diameter results in an increase in the motor speed, as follows:
where represents the tram speed and , and are the wheel diameter, the engine speed and the transmission ratio of the gearbox, respectively.
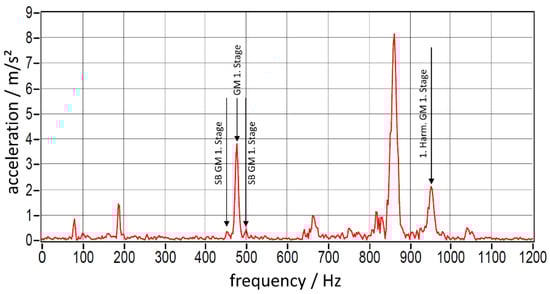
Figure 11.
Frequency spectrum of an acceleration signal detected with wireless sensors on the gearbox of the same tram approximately 1.5 years later at an approximate speed of 50 km/h (detail).
Furthermore, only 3072 samples can be acquired at a sampling rate of 4.56 kHz, which presents a reduction in the frequency resolution in contrast to the conventional measuring system (768 kS, 51.2 kHz). The allegedly missing spectral components (GM second stage and further Harm.) is due to the influence of acceleration and deceleration process as well as ride at constant speed. At all three motions, there is another real meshing of teeth. As explained in [22], chattering of teeth can occur at a constant speed. Sometimes the left or the right tooth flank of one gear wheel accidentally engages with another. In this way, rolling over tooth flank damage cannot be guaranteed and no damage frequencies can be observed.
The comparison illustrates that essential frequencies of the structure-borne sound are reliably transmitted to the MEMS sensor with respect to the transfer condition for the structure-borne sound.
The frequency components shown are typical frequencies that are always visible independently from the technical condition of the tram. They result from the mechanical construction of the gearbox, which has not changed over the period of 1.5 years. If there are technical faults in the motor bogie, the frequencies mentioned are only more pronounced. If the tram speed varies, the frequency varies.
5. Conclusions
In this paper, a novel sensor network has been developed for condition monitoring of tram drive components based on wireless nodes, which can be easily installed and maintained as they are powered by energy harvested from vibrations during drive. The developed wireless and self-sufficient network of sensor systems can collect vibration data on the examined tram with suitable measuring breaks over a longer period. The comparison between the recorded measurement data of the network and conventional measurements agrees to a large extent, even if the sampling rate and signal length have been reduced to achieve practicability of the wireless network.
Although the installation conditions pose some challenges regarding electromagnetic compatibility and installation conditions, the results of the implementation show that the measurement data could be transmitted wirelessly at distances of up to 10 m. Measurements on the VEH with tram typical acceleration values between 10 and 30 Hz show that a power level between 80 µW and 21.22 mW can be achieved by the designed piezoelectric vibration converter. However, it is not yet clear whether the integrated VEH provides enough energy to ensure operation for the whole system life time, or if it can only act as a range extender. To identify this, long-term tests for real energy harvesting elements on the tram are necessary. Further possibilities to reduce the energy consumption are to implement smart digital signal processing on the sensor node itself to send only representative “characteristic values”, so that the radio frequency communication can be realised with a higher efficiency. The VEH can be improved with regard to broadband capability to harvest energy in a wider bandwidth.
Author Contributions
Conceptualisation, M.W. and S.H.; Formal analysis, M.W.; Funding acquisition, M.W. and M.R.; Investigation, M.W. and S.H.; Methodology, M.W. and M.R.; Project administration, M.R.; Software, M.W. and S.H.; Validation, M.W.; Visualisation, M.W.; Writing—original draft, M.W.; and Writing—review and editing, M.R. and O.K.
Funding
This research was funded by the Federal Ministry for Economic Affairs and Energy, Germany, grant number KF2175210WD4.
Acknowledgments
The authors thanks Schwingungs Diagnose Service (SDS) GmbH and SINUS Messtechnik GmbH for the provided conventional measurement technology and the related measurement data as well as Leipziger Verkehrsbetriebe (LVB) GmbH and IFTEC GmbH & Co. KG for the provided trams and tram stuff.
Conflicts of Interest
The authors declare no conflict of interest.
References
- Wolf, M.; Hofbauer, J.; Rudolph, M. Drahtlose und energieautarke Sensorik zur Zustandsüberwachung von Straßenbahnen mit automatisierter Entscheidungsfindung. In VDE-Kongress 2016 “Internet der Dinge—Technologien/Anwendungen/Perspektiven”, November 2016, Mannheim, Tagungsband; VDE VERLAG GMBH, Berlin-Offenbach: Berlin, Germany, 2016; ISBN 978-3-8007-4308-7. [Google Scholar]
- Bundesministerium der Justiz und für Verbraucherschutz. Verordnung über den Bau und Betrieb der Straßenbahnen (Straßenbahn-Bau-und Betriebsordnung—BOStrab); Antiphon Verlag: Berlin, Germany, 1987; p. 57. [Google Scholar]
- Firlik, B.; Czechyra, B.; Chudzikiewicz, A. Condition Monitoring System for Light Rail Vehicle and Track. Key Eng. Mater. 2012, 518, 66–75. [Google Scholar] [CrossRef]
- Firlik, B.; Chudzikiewicz, A. Condition monitoring of a light rail vehicle—From concept to implementation. In Proceedings of the 6th European Workshop—Structural Health Monitoring 2012 (EWSHM 2012), Dresden, Germany, 3–6 July 2012; Volume 2, pp. 1401–1408. [Google Scholar]
- Hanusch, G.; Henkel, D. Sensor Nodes for Assessing Constructional Elements in Vehicles by Using Acoustical Monitoring Technologies. Available online: http://edok01.tib.uni-hannover.de/edoks/e01fb14/ 78111229X.pdf (accessed on 29 October 2018).
- Wolf, M.; Rudolph, M.; Köllner, J. Schwingungsdiagnostische Untersuchung von Straßenbahn-Antriebskomponenten mithilfe von Sensornetzwerken. ZWF Z. Wirtsch. Fabr. 2017, 112, 62–67. [Google Scholar] [CrossRef]
- Naifar, S.; Bradai, S.; Viehweger, C.; Kanoun, O. Survey of electromagnetic and magnetoelectric vibration energy harvesters for low frequency excitation. Measurement 2017, 106, 261–263. [Google Scholar] [CrossRef]
- General Principils and Basic Considerations. In Thermoelectric Handbook: Macro to Nano; Rowe, D.M., Ed.; CRC Press: Boca Raton, FL, USA, 2006. [Google Scholar]
- Hazelden, R. APSCAM—A Novel Sensor to Monitor Railway Earthworks: Energy Harvesting Case Study. Available online: http://eh-network.org/events/eh2016/speakers/Hazelden.pdf (accessed on 13 November 2018).
- LUST Hybrid Technik GmbH. MoSe—Mobile Sensorsysteme für die Instandhaltung im Transportwesen. Available online: https://www.tib.eu/suchen/id/TIBKAT:880572426/ (accessed on 29 October 2018).
- Perpetuum Ltd. Condition Monitored Maintenance Using Self-Powered Sensors & Vibration Based Analytics. Available online: http://www.passenger-rolling-stock-maintenance.com/media/downloads/ inline/perpetuum-case-study.1449847586.pdf (accessed on 29 October 2018).
- Sturm, A.; Foerster, R.; Hippmann, N.; Kinsky, D. Wälzlagerdiagnostik für Maschinen und Anlagen; Verlag Technik: Berlin, Germany, 1985; pp. 134–153. [Google Scholar]
- DIN Deutsches Institut für Normung e.V. Mechanical Vibration and Shock—Mechanical Mounting of Accelerometers (ISO 5348: 1998); Beuth Verlag GmbH: Berlin, Germany, 1999; pp. 6–7. [Google Scholar]
- Bradai, S.; Naifar, S.; Viehweger, C.; Kanoun, O. Electromagnetic Vibration Energy Harvesting for Railway Applications. MATEC Web Conf. 2018, 148, 12004. [Google Scholar] [CrossRef]
- Mukhopadhyay, S.C. Intelligent Sensing, Instrumentation and Measurements; Springer: Berlin/Heidelberg, Germany, 2013; ISBN 978-3-642-37026-7. [Google Scholar]
- Hofbauer, J.; Wolf, M.; Rudolph, M. Drahtlose, energieautarke Sensorik zur Zustandsüberwachung von Maschinen und Anlagen—Simulationsuntersuchung zur Abschätzung der energetischen Lebensdauer für den praktischen Einsatz. Wissenschaftliche Schriftenreihe des Institutes für Betriebswissenschaften und Fabriksysteme, Sonderheft 23, Tagungsband “Arbeitswelten 4.0—Chancen, Herausforderungen, Lösungen”, TBI 2017-16; des Betriebs, T., Systemingenieurs, S., Eds.; Institut für Print und Medientechnik der TU Chemnitz: Chemnitz, Germany, 2017; pp. 73–82. ISSN 0947-2495. [Google Scholar]
- Hofbauer, J.; Wolf, M.; Rudolph, M. Self-sufficient Sensors Based on Energy Harvesting—Validation and Evaluation Study of Tram Bearing Diagnostics Using Simulation Techniques. In Proceedings of the 13th International Multi-Conference on Systems, Signals & Devices (SSD), Leipzig, Germany, 21–24 March 2016; pp. 613–618, ISBN 978-1-5090-1291-9. [Google Scholar]
- PI Ceramics GmbH. E-821.EHD Evaluation Kit. Datasheet. Available online: https://www.piceramic.de/fileadmin/user_upload/physik_instrumente/files/datasheets/PI_Datenblatt_E-821_20150121.pdf (accessed on 29 October 2018).
- Analog Devices. Digital Tri-Axial Vibration Sensor ADIS16223. Datasheet. Available online: http://www.analog.com/media/en/technical-documentation/data-sheets/ADIS16223.pdf (accessed on 11 June 2018).
- Espressif. ESP8266EX Datasheet. Available online: https://www.espressif.com/sites/default/files/ documentation/0a-esp8266ex_datasheet_en.pdf (accessed on 29 October 2018).
- Rudolph, M.; Hempel, A.-J. Unscharfe Klassifikation von Messdaten zur Maschinenüberwachung. In Wt Werkstattstechnik Online; Springer-VDI-Verlag: Düsseldorf, Germany, 2013; Volume 103, pp. 915–920. [Google Scholar]
- Voß, G.; Lehmann, J. Vibration analysis as a method to increase the reliability and availability of a low-floor tram car—Einsatz der Schwingungsanalyse zur Erhoehung der Zuverlaessigkeit am Beispiel eines Niederflurfahrzeugs. ZEV-Z. Eisenb. Verk. J. Railw. Trans. 2000, 124, 151–158. [Google Scholar]
© 2018 by the authors. Licensee MDPI, Basel, Switzerland. This article is an open access article distributed under the terms and conditions of the Creative Commons Attribution (CC BY) license (http://creativecommons.org/licenses/by/4.0/).