Accommodative Response to Asymmetrical Accommodative Stimuli


Abstract
1. Introduction
2. Materials and Methods
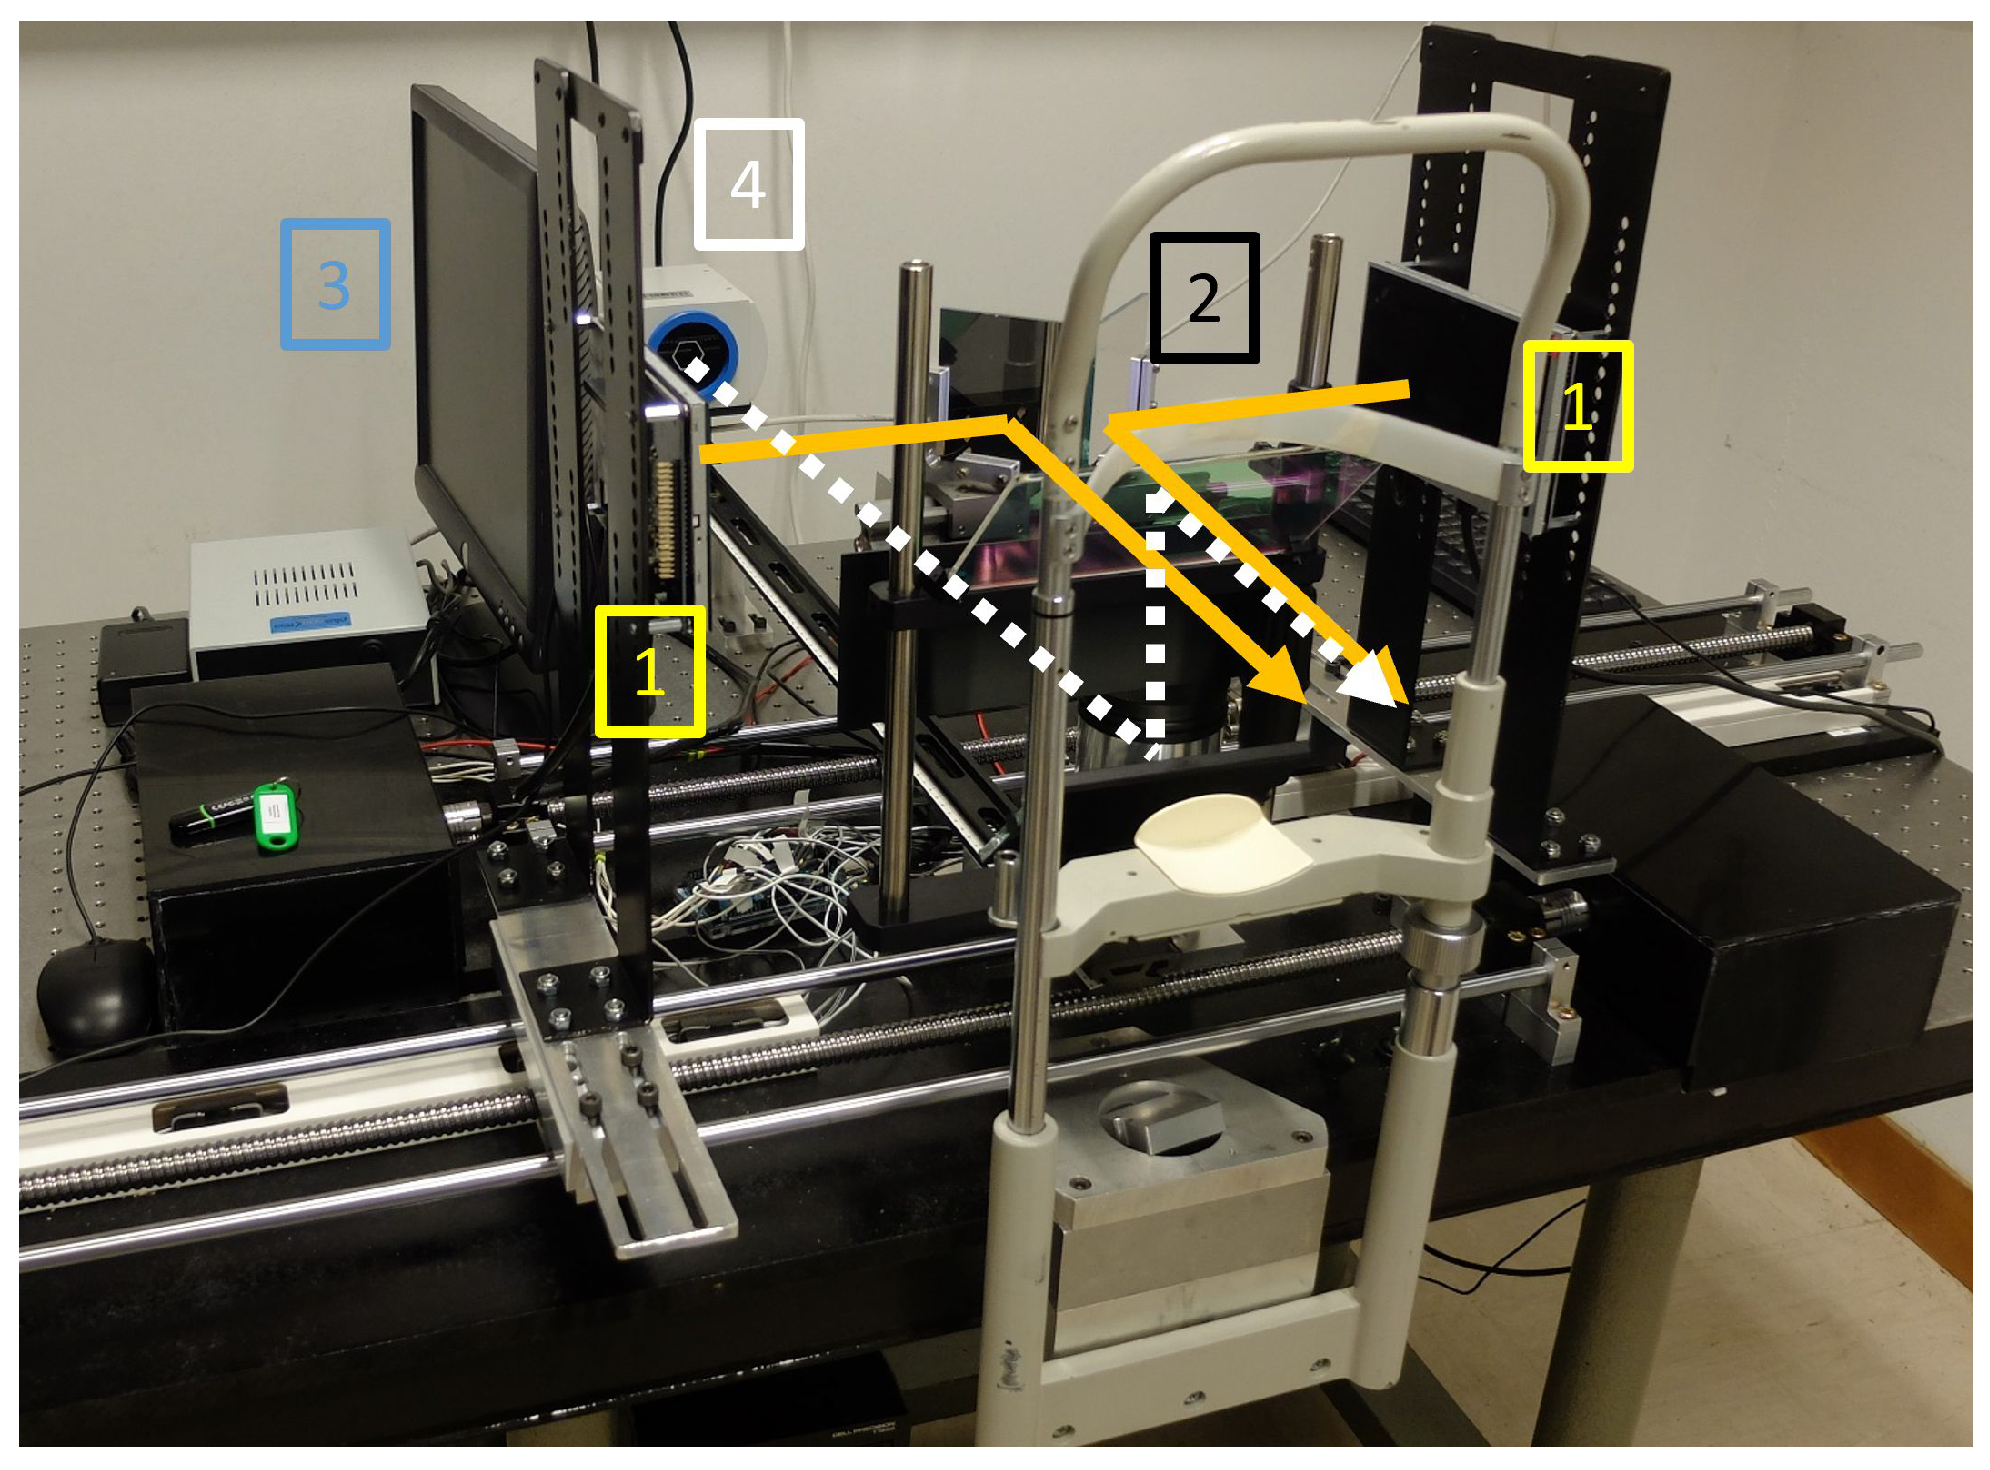
2.1. Haploscope Setup
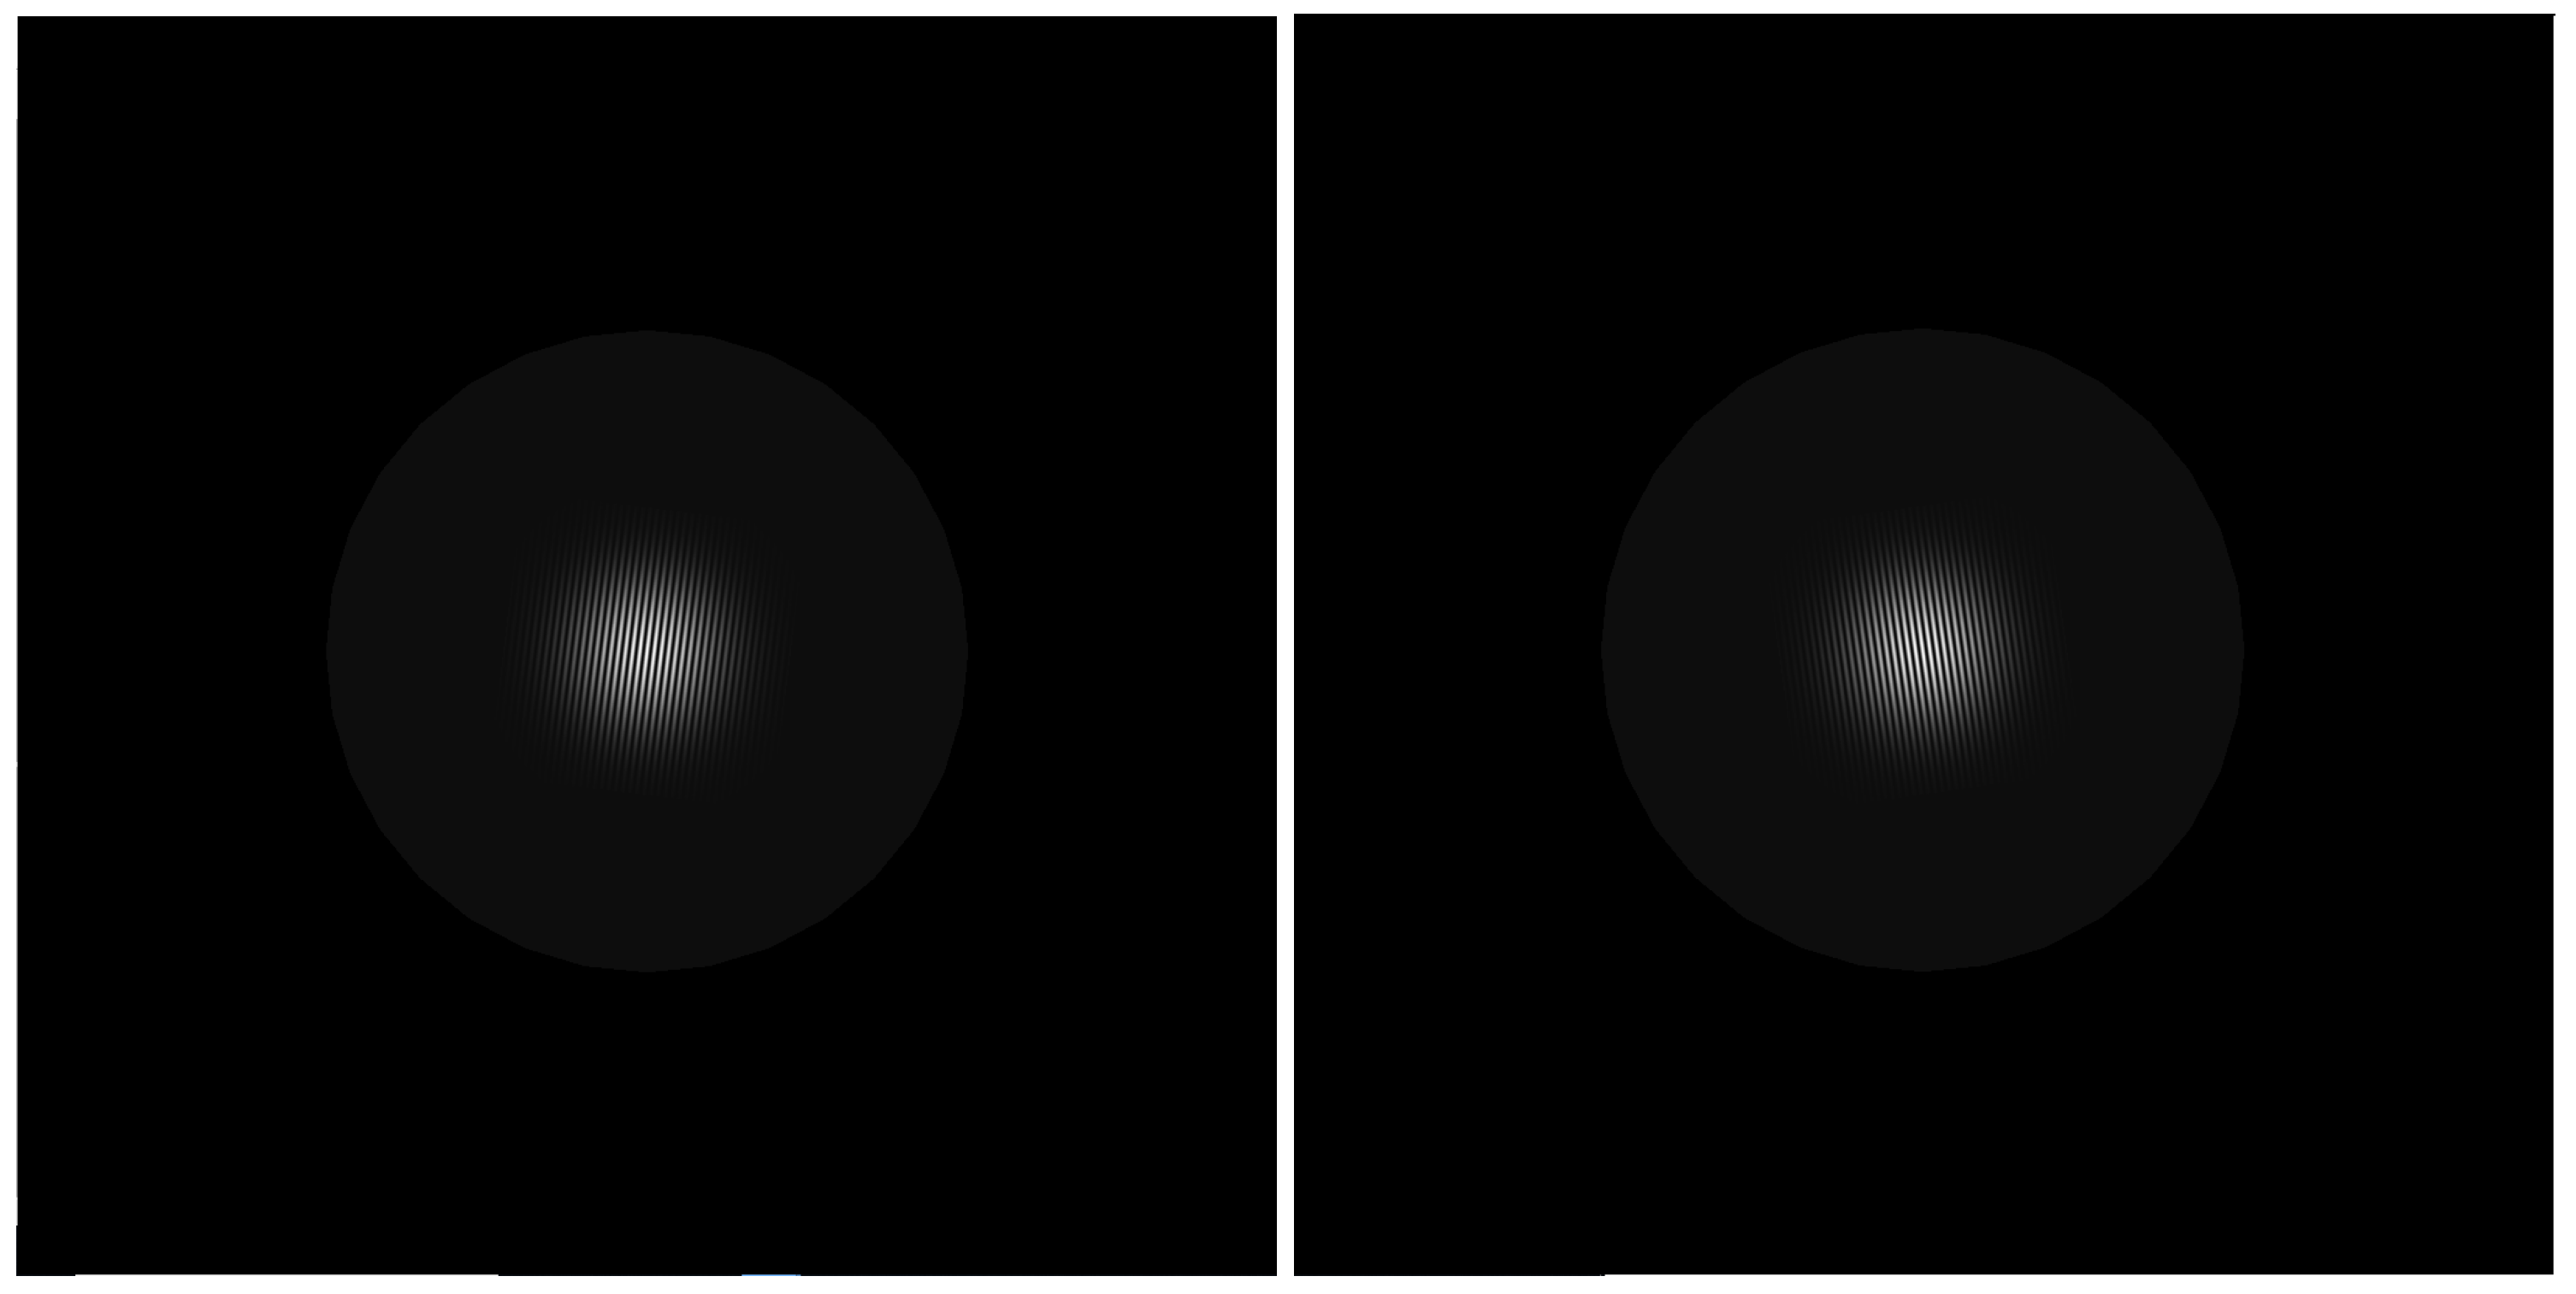
2.2. Stimuli and Procedure
2.3. Analyses
2.4. Subjects
3. Results
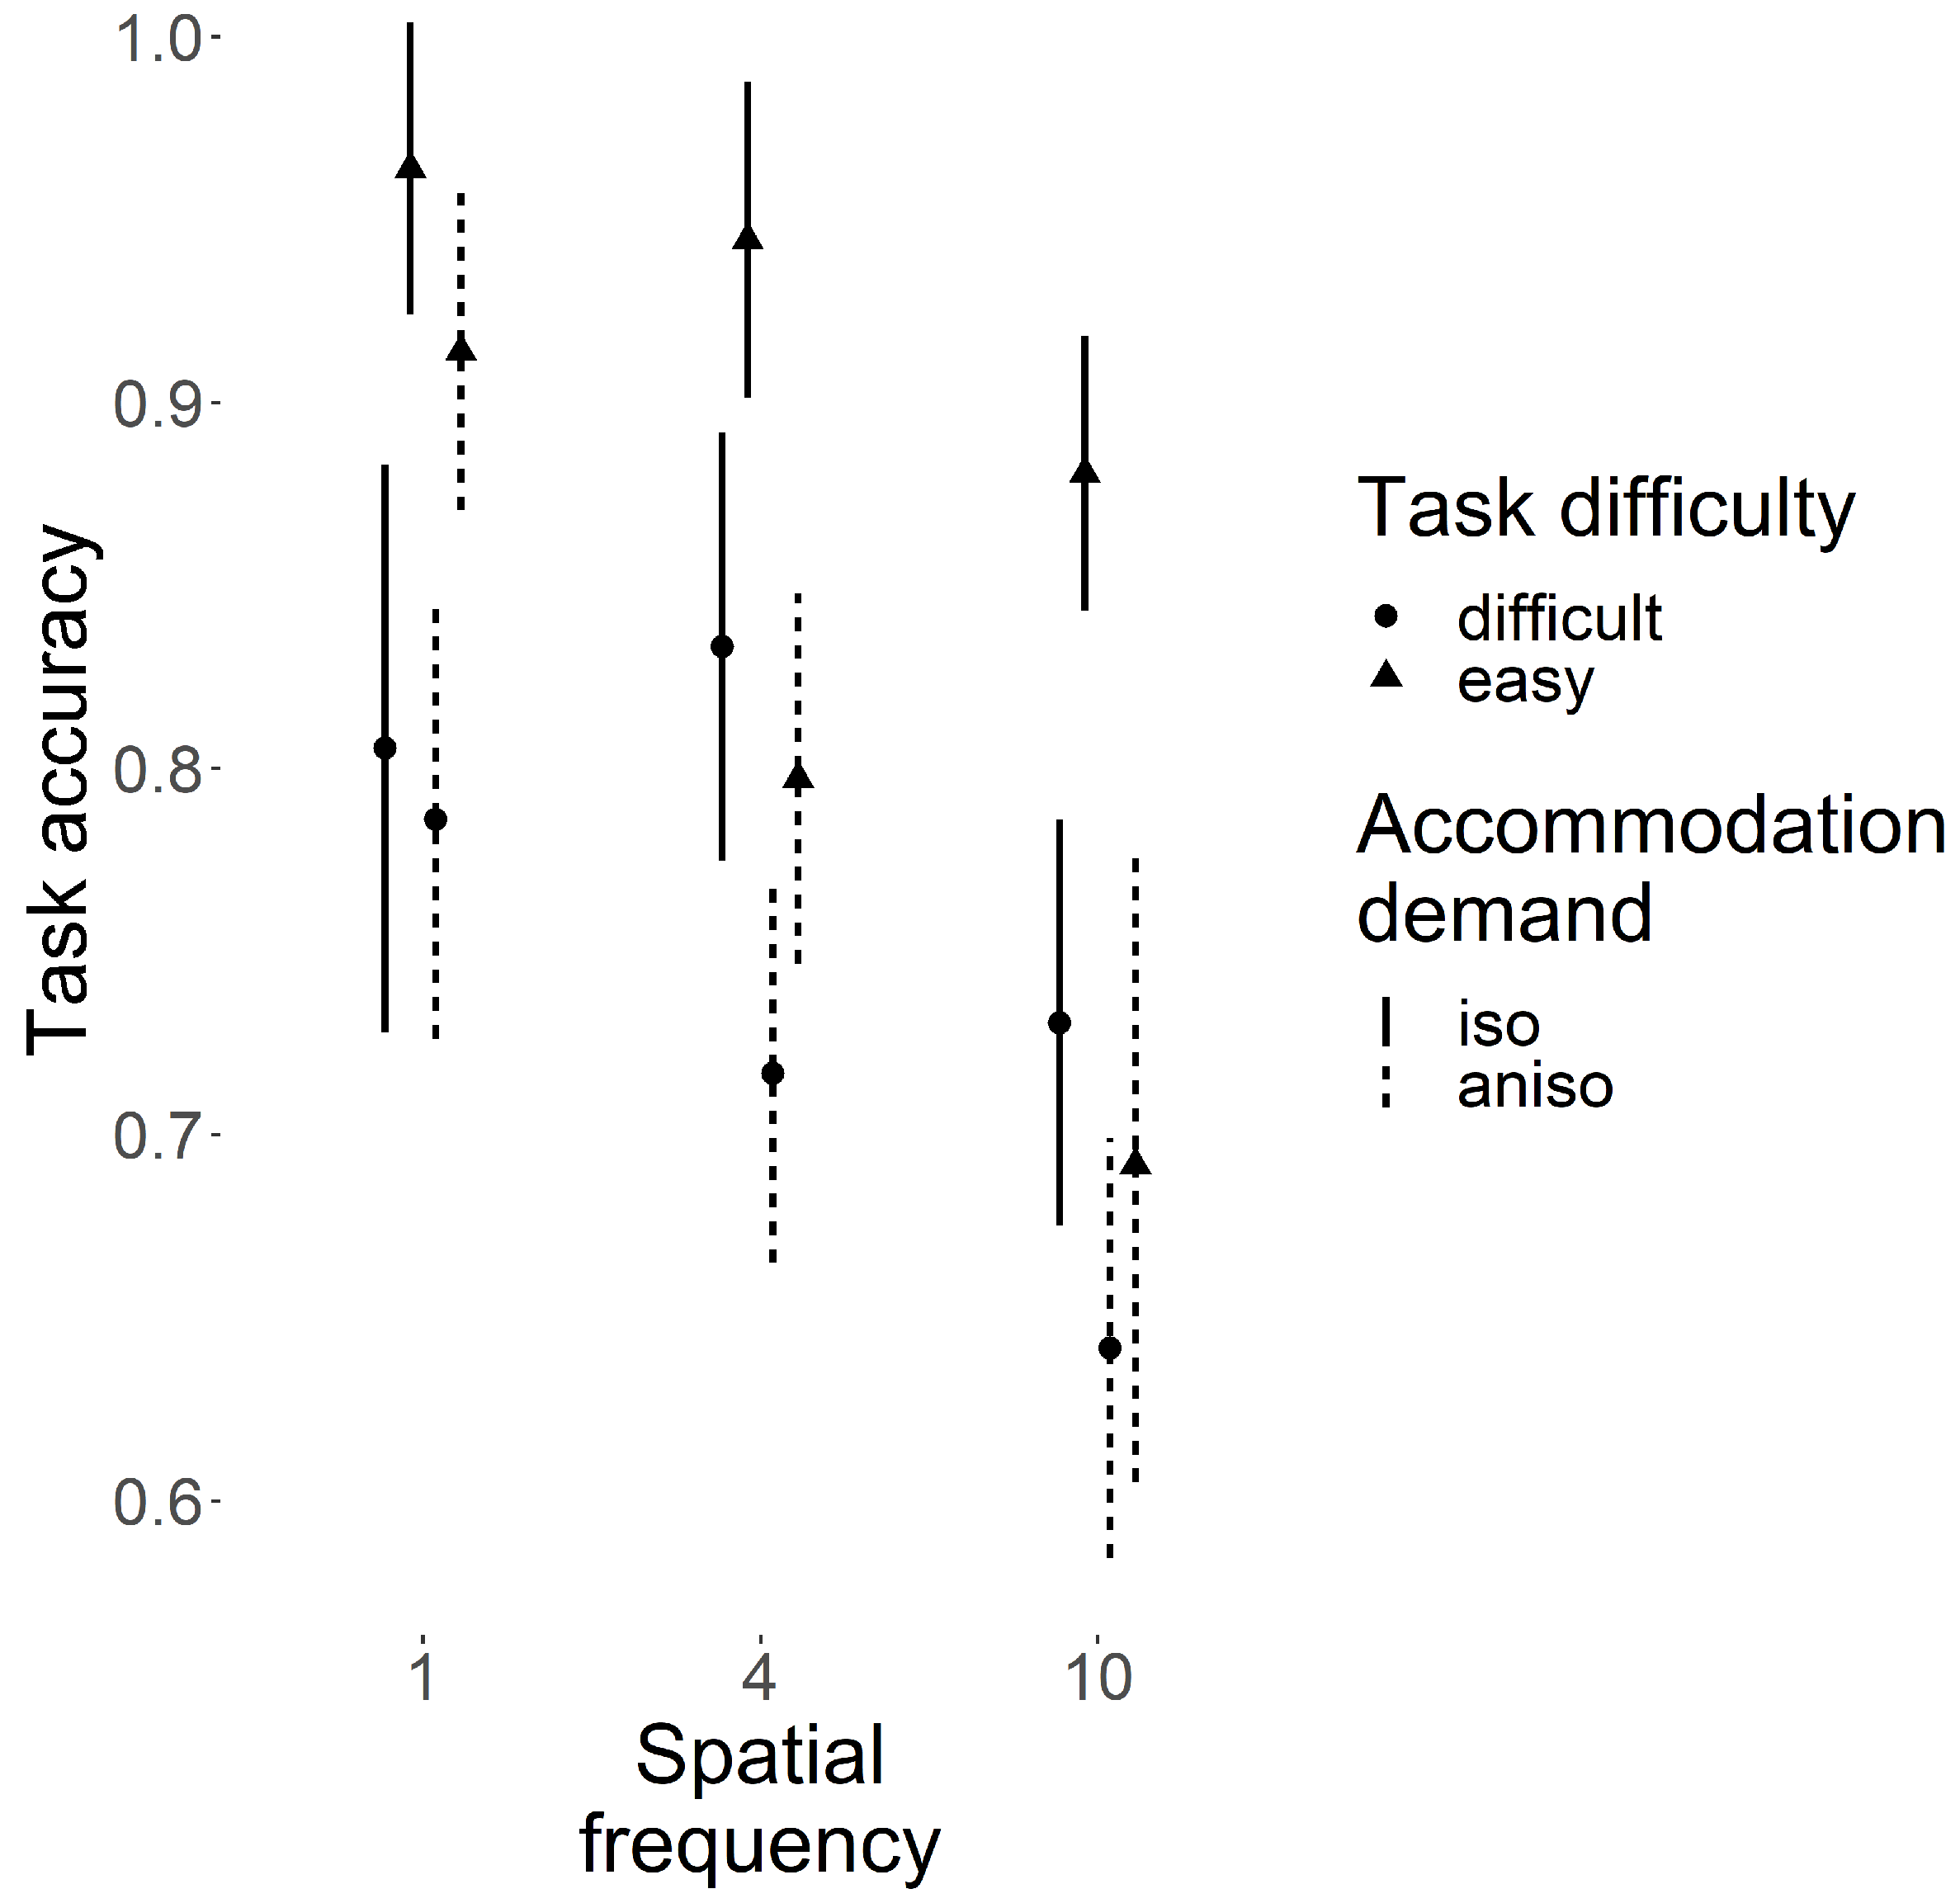
3.1. Task Accuracy
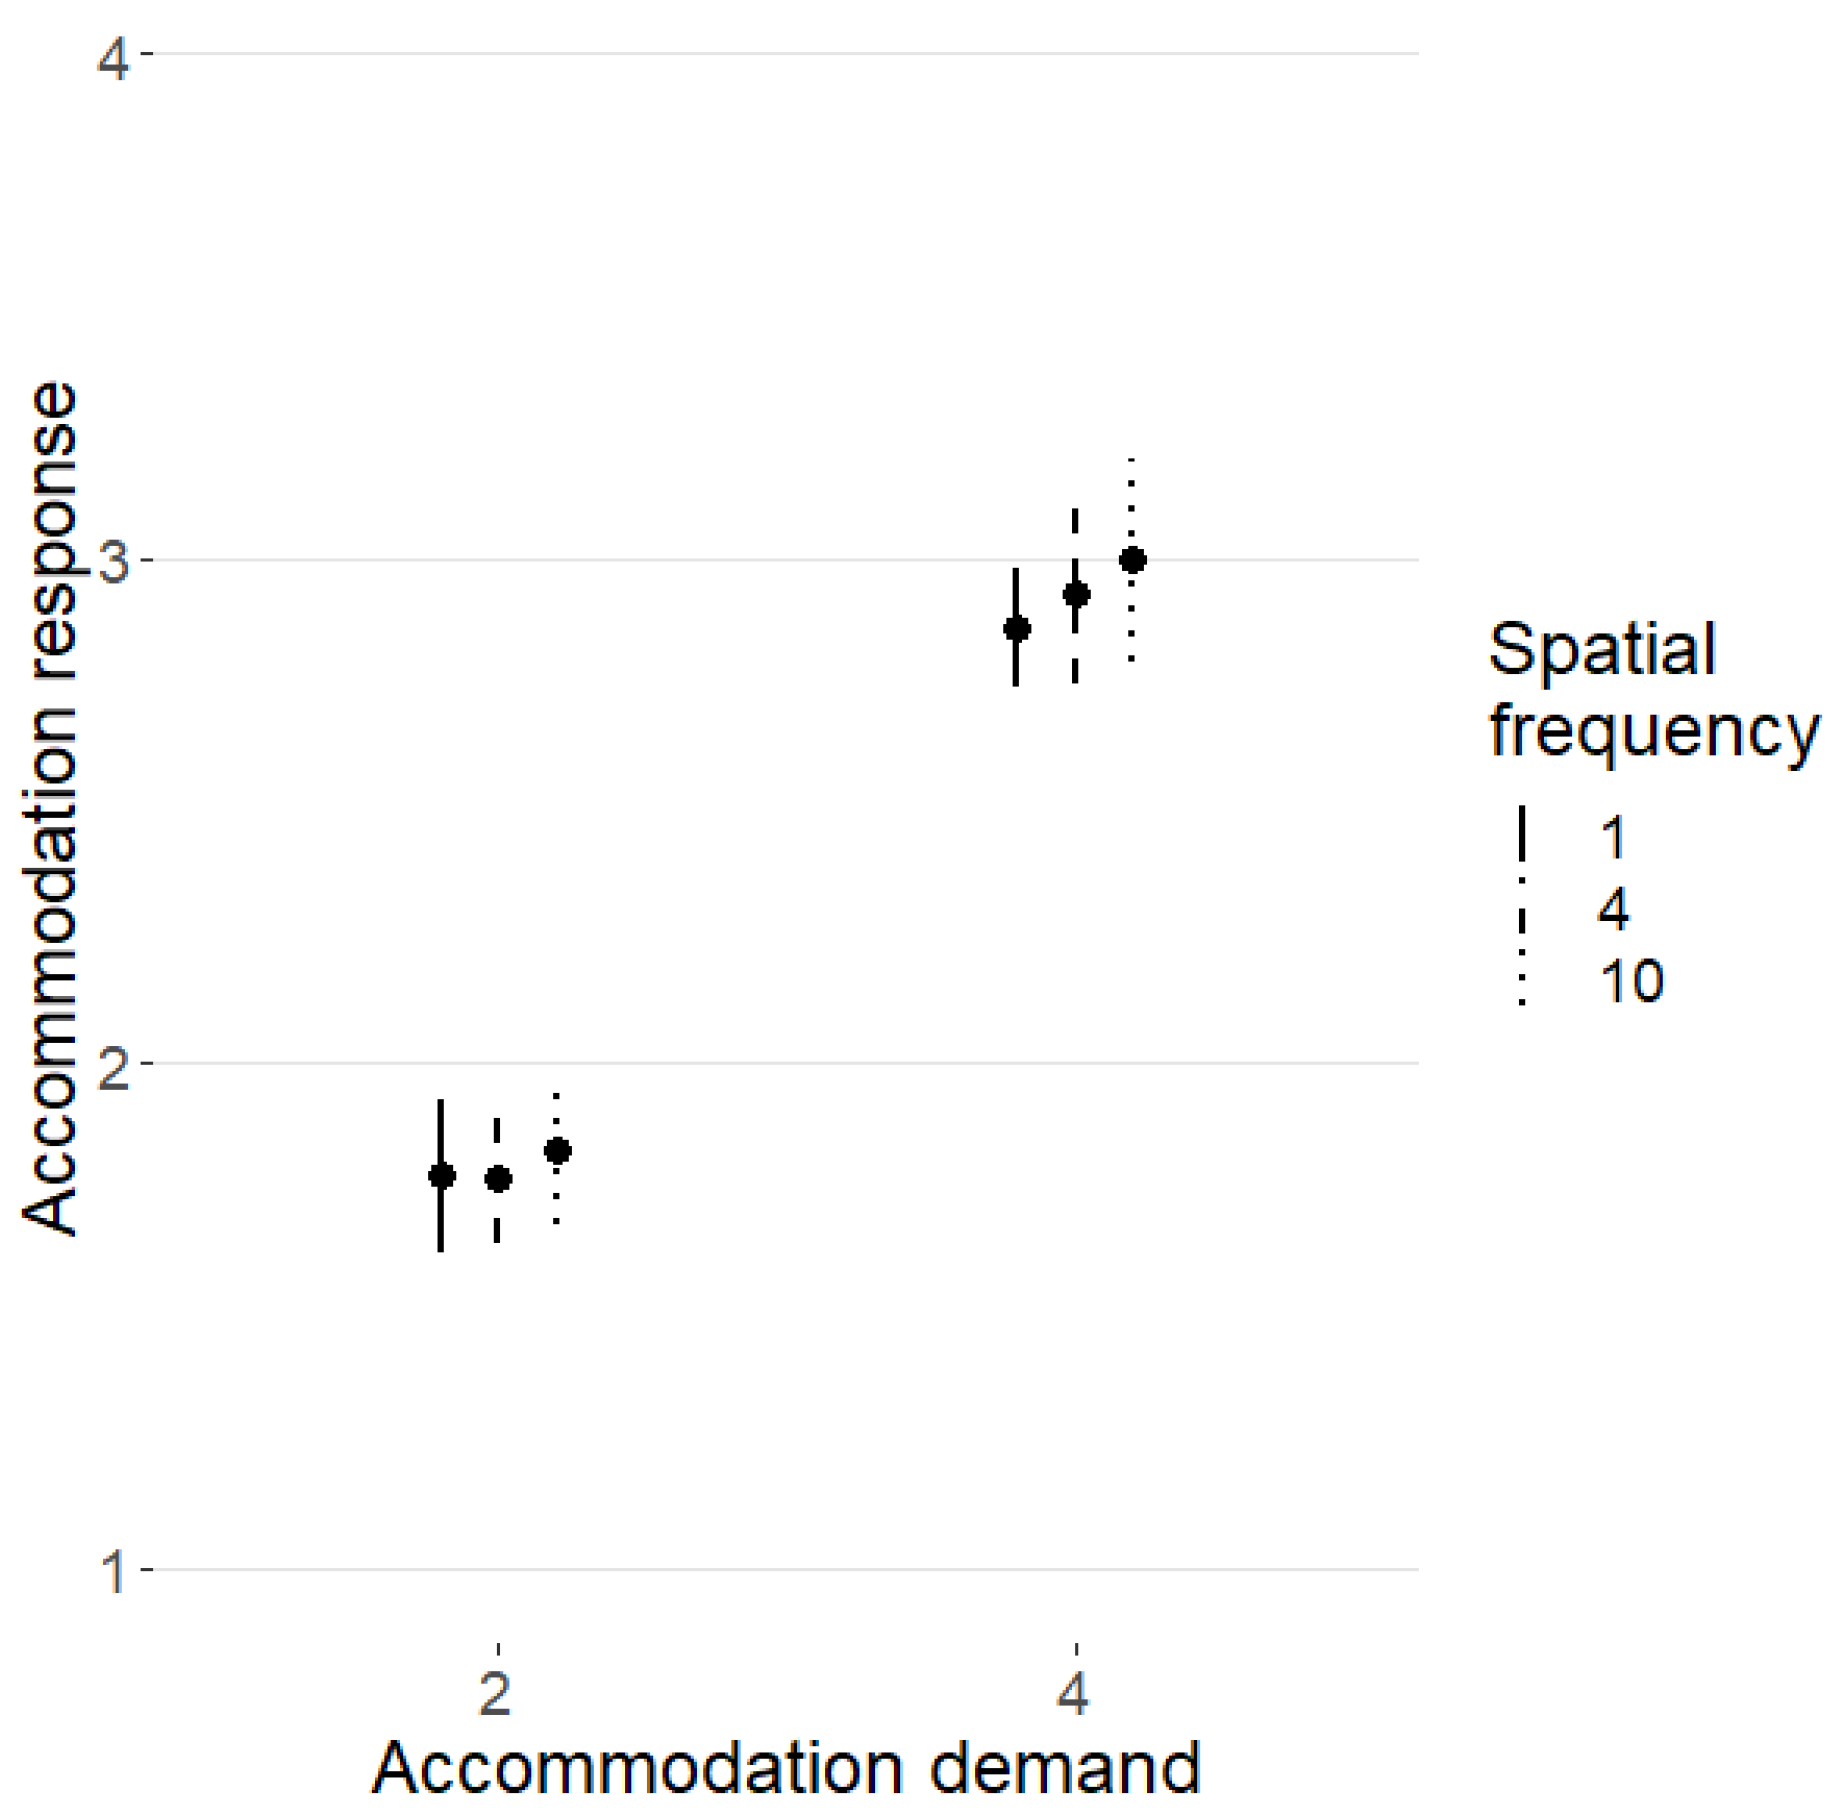
3.2. Accommodation Response
4. Discussion
4.1. The Effect of Spatial Frequency, in Isometropic Stimuli, on Accommodation Response
4.2. Aniso-Accommodation
5. Conclusions
Author Contributions
Funding
Institutional Review Board Statement
Informed Consent Statement
Data Availability Statement
Conflicts of Interest
Appendix A. Calculation of Required Sample Size for Aniso-Accommodation Hypothesis

Appendix B. The Choice of Spatial Frequencies
References
- Neveu, P.; Philippe, M.; Priot, A.E.; Fuchs, P.; Roumes, C. Vergence tracking: A tool to assess oculomotor performance in stereoscopic displays. J. Eye Mov. Res. 2012, 5, 1. [Google Scholar] [CrossRef]
- Hoffman, D.M.; Girshick, A.R.; Akeley, K.; Banks, M.S. Vergence–accommodation conflicts hinder visual performance and cause visual fatigue. J. Vis. 2008, 8, 33. [Google Scholar] [CrossRef] [PubMed]
- Koulieris, G.A.; Bui, B.; Banks, M.S.; Drettakis, G. Accommodation and comfort in head-mounted displays. ACM Trans. Graph. (TOG) 2017, 36, 1–11. [Google Scholar] [CrossRef]
- Zhang, D.; Nourrit, V.; de Bougrenet de la Tocnaye, J.-L. 3D visual comfort assessment by measuring the vertical disparity tolerance. Displays 2017, 50, 7–13. [Google Scholar] [CrossRef]
- Marshev, V.; de Bougrenet de la Tocnaye, J.L.; Cochener, B.; Nourrit, V. Impact of virtual reality head mounted display on the attentional visual field. Electron. Imaging 2021, 2021, 158. [Google Scholar] [CrossRef]
- Rebenitsch, L.; Owen, C. Review on cybersickness in applications and visual displays. Virtual Real. 2016, 20, 101–125. [Google Scholar] [CrossRef]
- Davis, S.; Nesbitt, K.; Nalivaiko, E. A systematic review of cybersickness. In Proceedings of the 2014 Conference on Interactive Entertainment, Newcastle, Australia, 2–3 December 2014; pp. 1–9. [Google Scholar]
- Bayle, E.; Hourlier, S.; Lelandais, S.; Salasc, C.A.; Leroy, L.; Plantier, J.; Neveu, P. Interocular conflict from a monocular augmented reality display: Impact of visual characteristics on performance. PLoS ONE 2021, 16, e0256766. [Google Scholar] [CrossRef]
- Marran, L.; Schor, C. Multiaccommodative stimuli in VR systems: Problems & solutions. Hum. Factors 1997, 39, 382–388. [Google Scholar]
- Marran, L.; Schor, C.M. Lens induced aniso-accommodation. Vis. Res. 1998, 38, 3601–3619. [Google Scholar] [CrossRef]
- Koh, L.; Charman, W. Accommodative responses to anisoaccommodative targets. Ophthalmic Physiol. Opt. 1998, 18, 254–262. [Google Scholar] [CrossRef]
- Flitcroft, D.; Judge, S.; Morley, J. Binocular interactions in accommodation control: Effects of anisometropic stimuli. J. Neurosci. 1992, 12, 188–203. [Google Scholar] [CrossRef]
- Vincent, S.J.; Collins, M.J.; Read, S.A.; Ghosh, A.; Chen, C.; Lam, A.; Sahota, S.; Vo, R. The short-term accommodation response to aniso-accommodative stimuli in isometropia. Ophthalmic Physiol. Opt. 2015, 35, 552–561. [Google Scholar] [CrossRef]
- Provine, R.R.; Enoch, J.M. On voluntary ocular accommodation. Percept. Psychophys. 1975, 17, 209–212. [Google Scholar] [CrossRef]
- Ciuffreda, K.; Hokoda, S. Effect of instruction and higher level control on the accommodative response spatial frequency profile. Ophthalmic Physiol. Opt. 1985, 5, 221–223. [Google Scholar] [CrossRef] [PubMed]
- Jiang, B.C.; Lin, H. Accommodative Responses Under Different Stimulus Conditions. Investig. Ophthalmol. Vis. Sci. 2007, 48, 1044. [Google Scholar]
- Schaeffel, F.; Wilhelm, H.; Zrenner, E. Inter-individual variability in the dynamics of natural accommodation in humans: Relation to age and refractive errors. J. Physiol. 1993, 461, 301–320. [Google Scholar] [CrossRef] [PubMed]
- Gehring, A.M.; Haensel, J.X.; Curtiss, M.K.; Roberts, T.L. Validation of the powerref 3 for measuring accommodation: Comparison with the Grand Seiko WAM-5500A autorefractor. Transl. Vis. Sci. Technol. 2022, 11, 25. [Google Scholar] [CrossRef]
- R Core Team. R: A Language and Environment for Statistical Computing. 2013. Available online: http://www.R-project.org/ (accessed on 11 March 2025).
- Westfall, J. (University of Texas at Austin). PANGEA: Power Analysis for General ANOVA Designs. Unpublished Manuscript. 2015. [Google Scholar]
- Strang, N.C.; Day, M.; Gray, L.S.; Seidel, D. Accommodation steps, target spatial frequency and refractive error. Ophthalmic Physiol. Opt. 2011, 31, 444–455. [Google Scholar] [CrossRef]
- Arnold, B.F.; Hogan, D.R.; Colford, J.M.; Hubbard, A.E. Simulation methods to estimate design power: An overview for applied research. BMC Med. Res. Methodol. 2011, 11, 94. [Google Scholar] [CrossRef]
- Carr, H.; Allen, J.B. Studies from the psychological laboratory of the University of Chicago: A study of certain relations of accommodation and convergence to the judgment of the third dimension. Psychol. Rev. 1906, 13, 258. [Google Scholar] [CrossRef]
- Maddox, E.E. The Clinical Use of Prisms; J. Wright: Napa, CA, USA, 1893. [Google Scholar]
- Heath, G.G. Components of accommodation. Optom. Vis. Sci. 1956, 33, 569–579. [Google Scholar] [CrossRef] [PubMed]
- Fogt, N.; Toole, A.J.; Rogers, D.L. A review of proximal inputs to the near response. Clin. Exp. Optom. 2016, 99, 30–38. [Google Scholar] [CrossRef]
- Schor, C.M.; Alexander, J.; Cormack, L.; Stevenson, S. Negative feedback control model of proximal convergence and accommodation. Ophthalmic Physiol. Opt. 1992, 12, 307–318. [Google Scholar] [CrossRef] [PubMed]
- Kruger, P.B.; Pola, J. Dioptric and non-dioptric stimuli for accommodation: Target size alone and with blur and chromatic aberration. Vis. Res. 1987, 27, 555–567. [Google Scholar] [CrossRef]
- Bullimore, M.A.; Gilmartin, B. The accommodative response, refractive error and mental effort: 1. The sympathetic nervous system. Doc. Ophthalmol. 1988, 69, 385–397. [Google Scholar] [CrossRef]
- Winn, B.; Gilmartin, B.; Mortimer, L.; Edwards, N. The effect of mental effort on open-and closed-loop accommodation. Ophthalmic Physiol. Opt. 1991, 11, 335–339. [Google Scholar]
- Francis, E.L.; Jiang, B.C.; Owens, D.A.; Tyrrell, R.A. Accommodation and vergence require effort-to-see. Optom. Vis. Sci. 2003, 80, 467–473. [Google Scholar] [CrossRef] [PubMed]
- Hung, G.K.; Ciuffreda, K.J.; Rosenfield, M. Proximal contribution to a linear static model of accommodation and vergence. Ophthalmic Physiol. Opt. 1996, 16, 31–41. [Google Scholar] [CrossRef]
- Jiang, B.C. A modified control model for steady-state accommodation. In Accommodation and Vergence Mechanisms in the Visual System; Springer: Berlin/Heidelberg, Germany, 2000; pp. 235–243. [Google Scholar]
- Van der Wildt, G.; Bouman, M.; Van de Kraats, J. The effect of anticipation on the transfer function of the human lens system. Opt. Acta Int. J. Opt. 1974, 21, 843–860. [Google Scholar] [CrossRef]
- Ciuffreda, K.J.; Kruger, P.B. Dynamics of human voluntary accommodation. Optom. Vis. Sci. 1988, 65, 365–370. [Google Scholar] [CrossRef]
- Stark, L.R.; Atchison, D.A. Subject instructions and methods of target presentation in accommodation research. Investig. Ophthalmol. Vis. Sci. 1994, 35, 528–537. [Google Scholar]
- Malmstrom, F.V.; Randle, R.J. Effects of visual imagery on the accommodation response. Percept. Psychophys. 1976, 19, 450–453. [Google Scholar] [CrossRef]
- Charman, W.; Tucker, J. Dependence of accommodation response on the spatial frequency spectrum of the observed object. Vis. Res. 1977, 17, 129–139. [Google Scholar] [CrossRef]
- Wang, B.; Ciuffreda, K.J. Depth-of-focus of the human eye: Theory and clinical implications. Surv. Ophthalmol. 2006, 51, 75–85. [Google Scholar] [CrossRef]
- Owens, D. A comparison of accommodative responsiveness and contrast sensitivity for sinusoidal gratings. Vis. Res. 1980, 20, 159–167. [Google Scholar] [CrossRef]
- Ward, P. The effect of spatial frequency on steady-state accommodation. Ophthalmic Physiol. Opt. 1987, 7, 211–217. [Google Scholar] [PubMed]
- Mathews, S.; Kruger, P.B. Spatiotemporal transfer function of human accommodation. Vis. Res. 1994, 34, 1965–1980. [Google Scholar] [CrossRef]
- Xu, J.; Zheng, Z.; Drobe, B.; Jiang, J.; Chen, H. The effects of spatial frequency on the accommodation responses of myopes and emmetropes under various detection demands. Vis. Res. 2015, 115, 1–7. [Google Scholar] [CrossRef]
- Xu, J.; Lu, X.; Zheng, Z.; Bao, J.; Singh, N.; Drobe, B.; Chen, H. The effects of spatial frequency on the accommodative responses of myopic and emmetropic Chinese children. Transl. Vis. Sci. Technol. 2019, 8, 65. [Google Scholar] [CrossRef]
- Blake, R.; Logothetis, N.K. Visual competition. Nat. Rev. Neurosci. 2002, 3, 13–21. [Google Scholar] [CrossRef]
- Flitcroft, D.I.; Morley, J.W. Accommodation in binocular contour rivalry. Vis. Res. 1997, 17, 121–125. [Google Scholar] [CrossRef] [PubMed]
- Tong, F.; Meng, M.; Blake, R. Neural bases of binocular rivalry. Trends Cogn. Sci. 2006, 10, 502–511. [Google Scholar] [CrossRef] [PubMed]
- Wolfe, J.M. Stereopsis and binocular rivalry. Psychol. Rev. 1986, 93, 269. [Google Scholar] [CrossRef]
- Hugrass, L.; Crewther, D. Willpower and conscious percept: Volitional switching in binocular rivalry. PLoS One 2012, 7, e35963. [Google Scholar] [CrossRef] [PubMed]
- Plainis, S.; Ginis, H.S.; Pallikaris, A. The effect of ocular aberrations on steady-state errors of accommodative response. J. Vis. 2005, 5, 466–477. [Google Scholar] [CrossRef]
- Li, J.; Thompson, B.; Deng, D.; Chan LYLYu, M.; Hess, R.F. Dichoptic training enables the adult amblyopic brain to learn. Curr. Biol. 2013, 23, R308–R309. [Google Scholar] [CrossRef]

Disclaimer/Publisher’s Note: The statements, opinions and data contained in all publications are solely those of the individual author(s) and contributor(s) and not of MDPI and/or the editor(s). MDPI and/or the editor(s) disclaim responsibility for any injury to people or property resulting from any ideas, methods, instructions or products referred to in the content. |
© 2025 by the authors. Licensee MDPI, Basel, Switzerland. This article is an open access article distributed under the terms and conditions of the Creative Commons Attribution (CC BY) license (https://creativecommons.org/licenses/by/4.0/).
Share and Cite
Marshev, V.; de Bougrenet de la Tocnaye, J.-L.; Nourrit, V. Accommodative Response to Asymmetrical Accommodative Stimuli. Vision 2025, 9, 22. https://doi.org/10.3390/vision9010022
Marshev V, de Bougrenet de la Tocnaye J-L, Nourrit V. Accommodative Response to Asymmetrical Accommodative Stimuli. Vision. 2025; 9(1):22. https://doi.org/10.3390/vision9010022
Chicago/Turabian StyleMarshev, Vasili, Jean-Louis de Bougrenet de la Tocnaye, and Vincent Nourrit. 2025. "Accommodative Response to Asymmetrical Accommodative Stimuli" Vision 9, no. 1: 22. https://doi.org/10.3390/vision9010022
APA StyleMarshev, V., de Bougrenet de la Tocnaye, J.-L., & Nourrit, V. (2025). Accommodative Response to Asymmetrical Accommodative Stimuli. Vision, 9(1), 22. https://doi.org/10.3390/vision9010022