Developmental Trajectories of Size Constancy as Implicitly Examined by Simple Reaction Times


Abstract
1. Introduction
2. Materials and Methods
2.1. Design
2.2. Participants
2.3. Apparatus and Stimuli
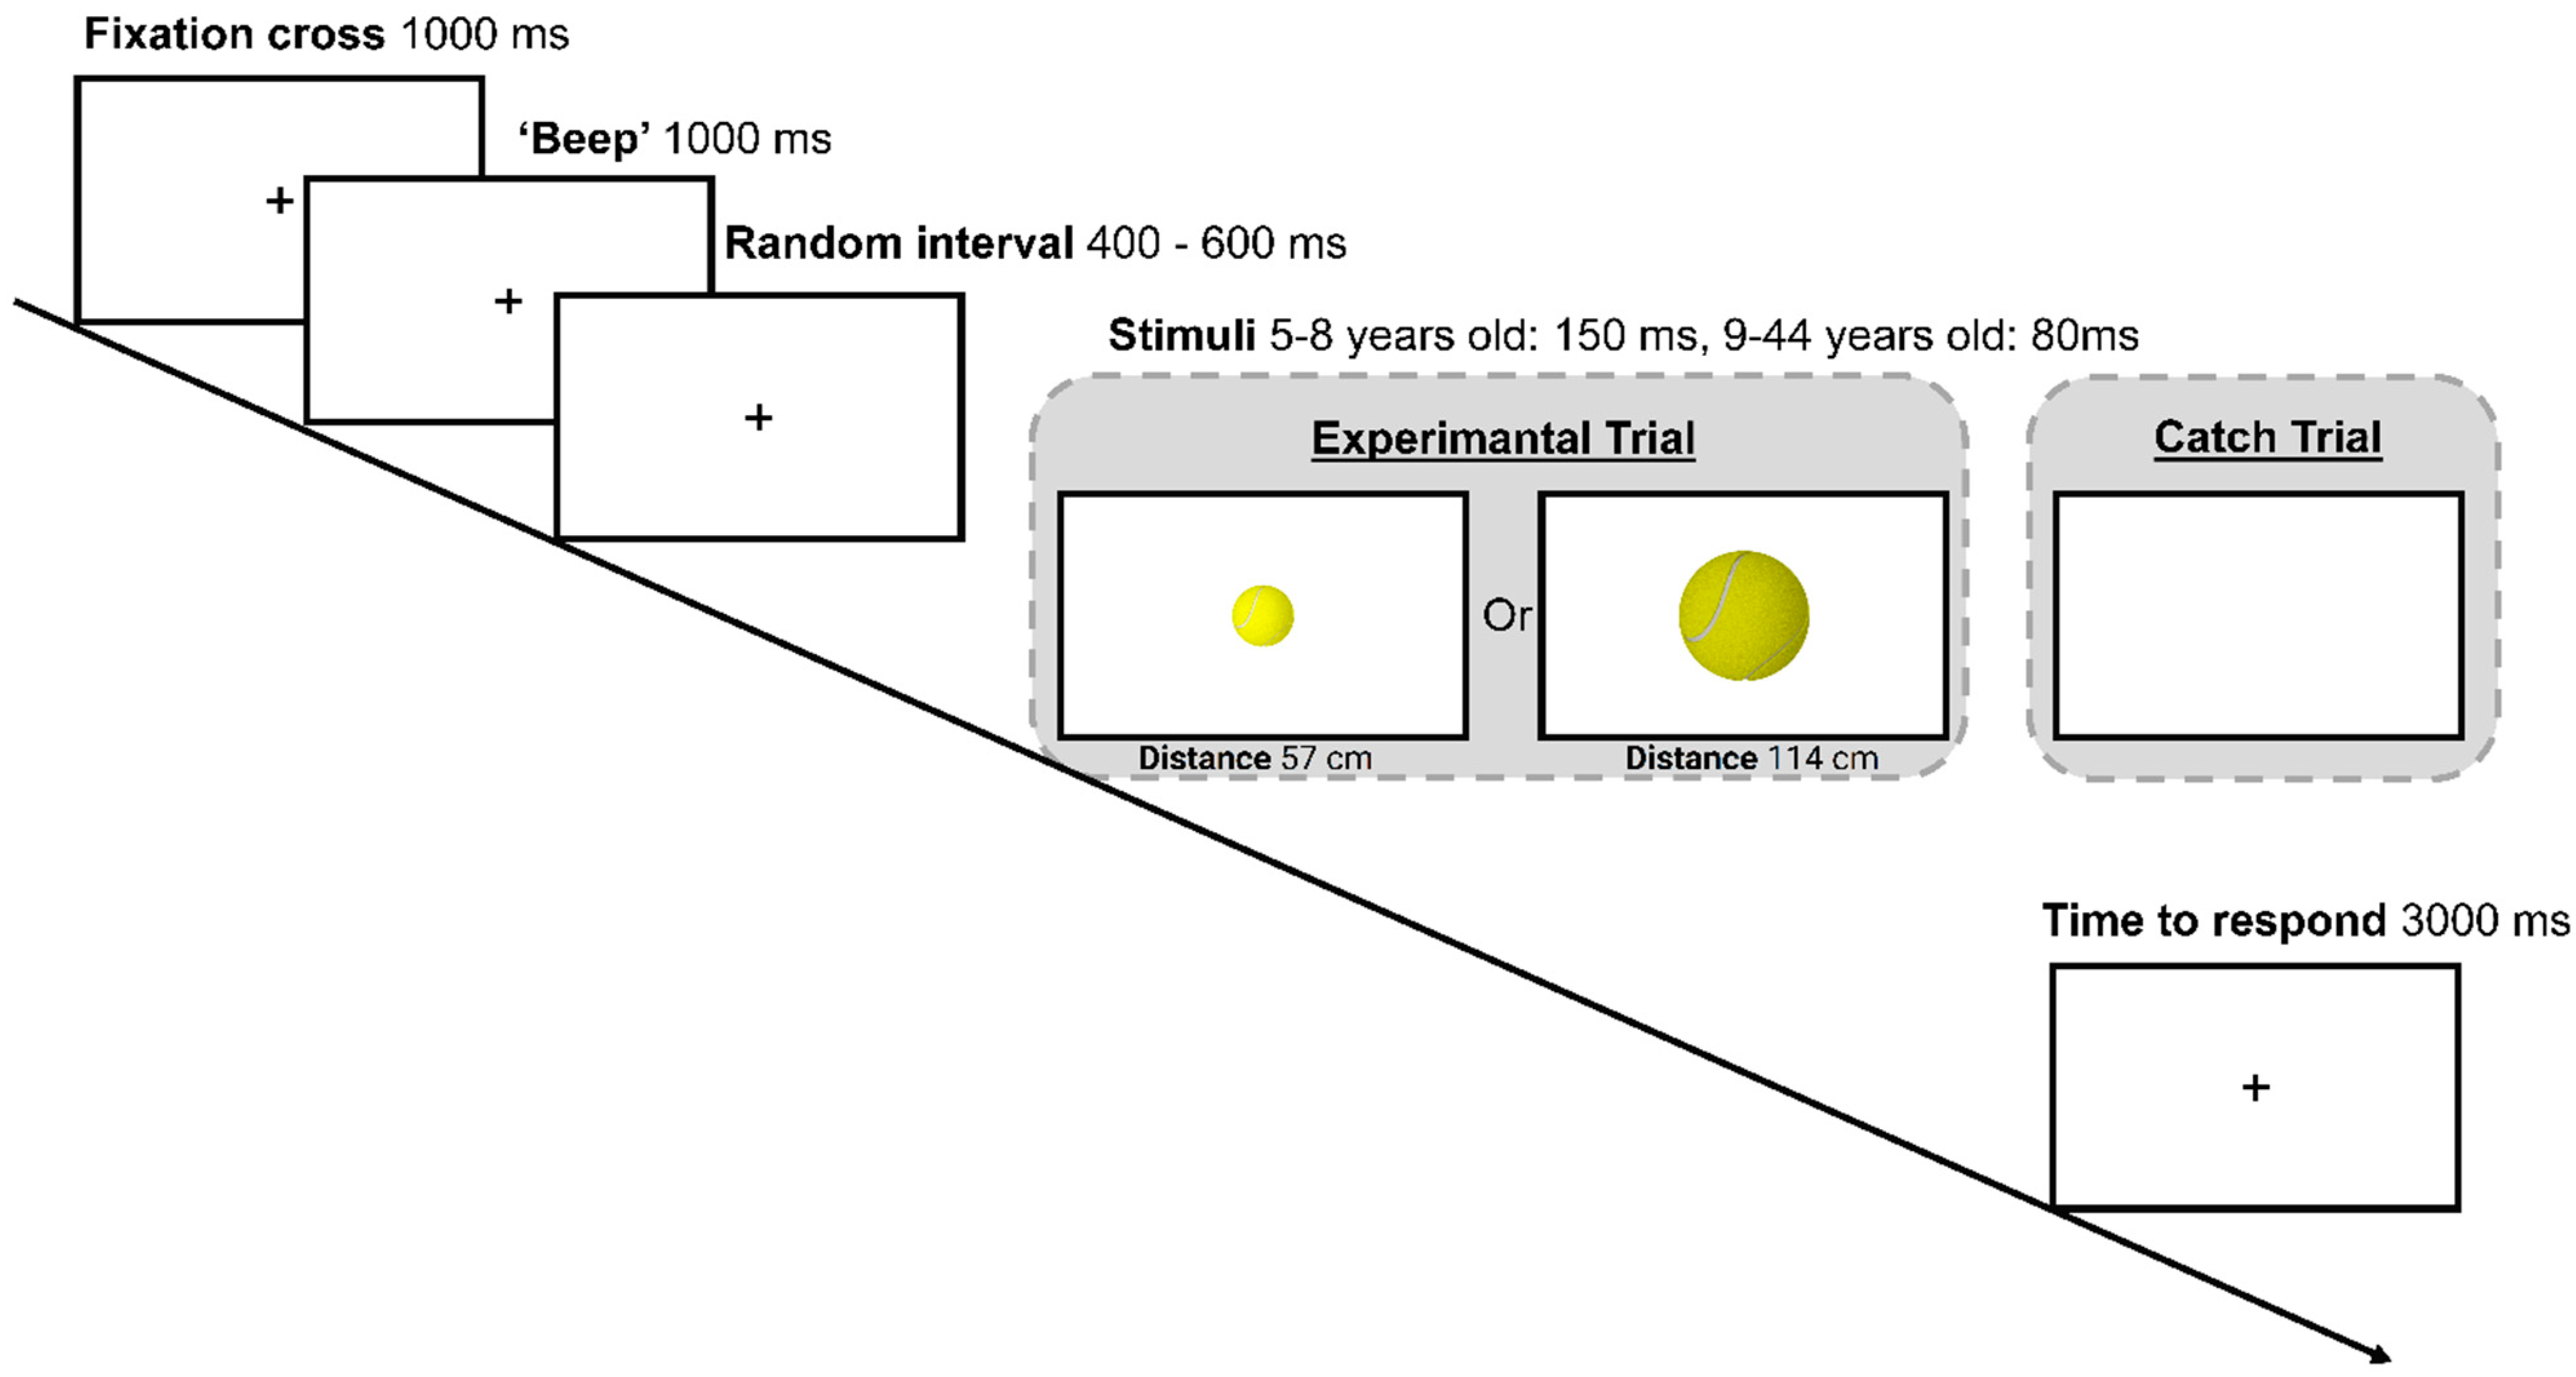
2.4. Procedure
2.5. Statistical Analysis
3. Results
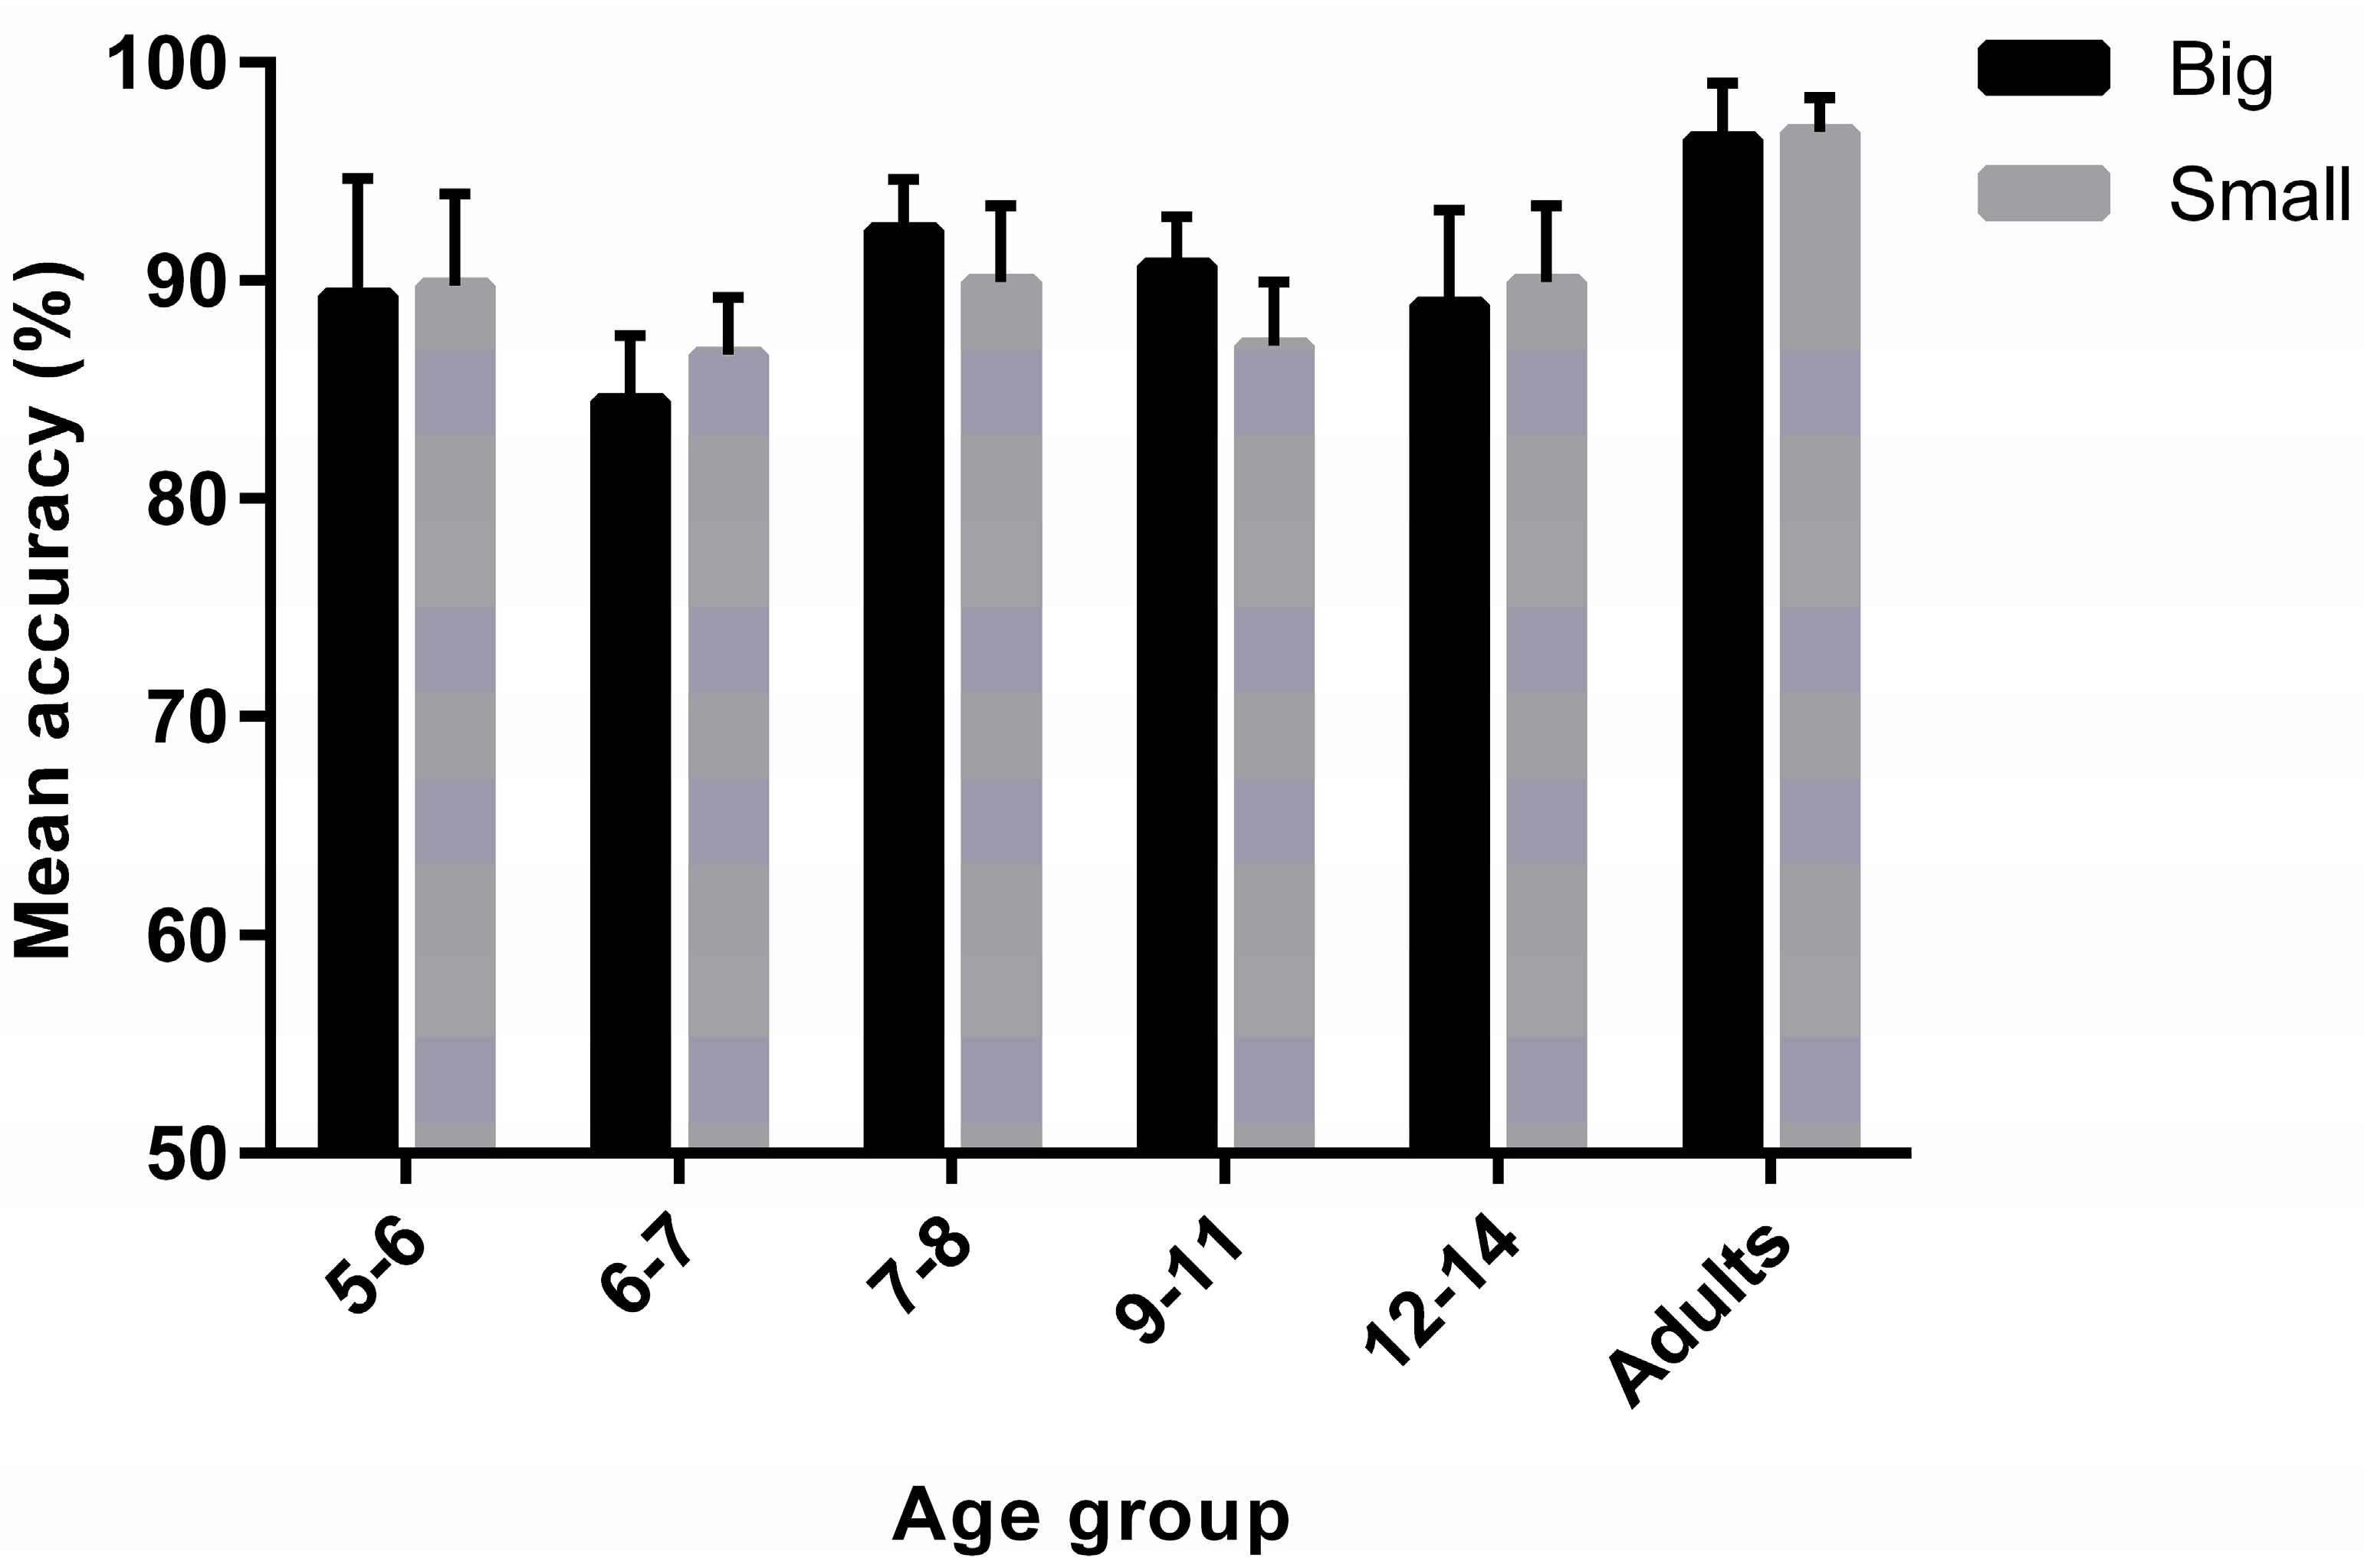
3.1. Task Accuracy
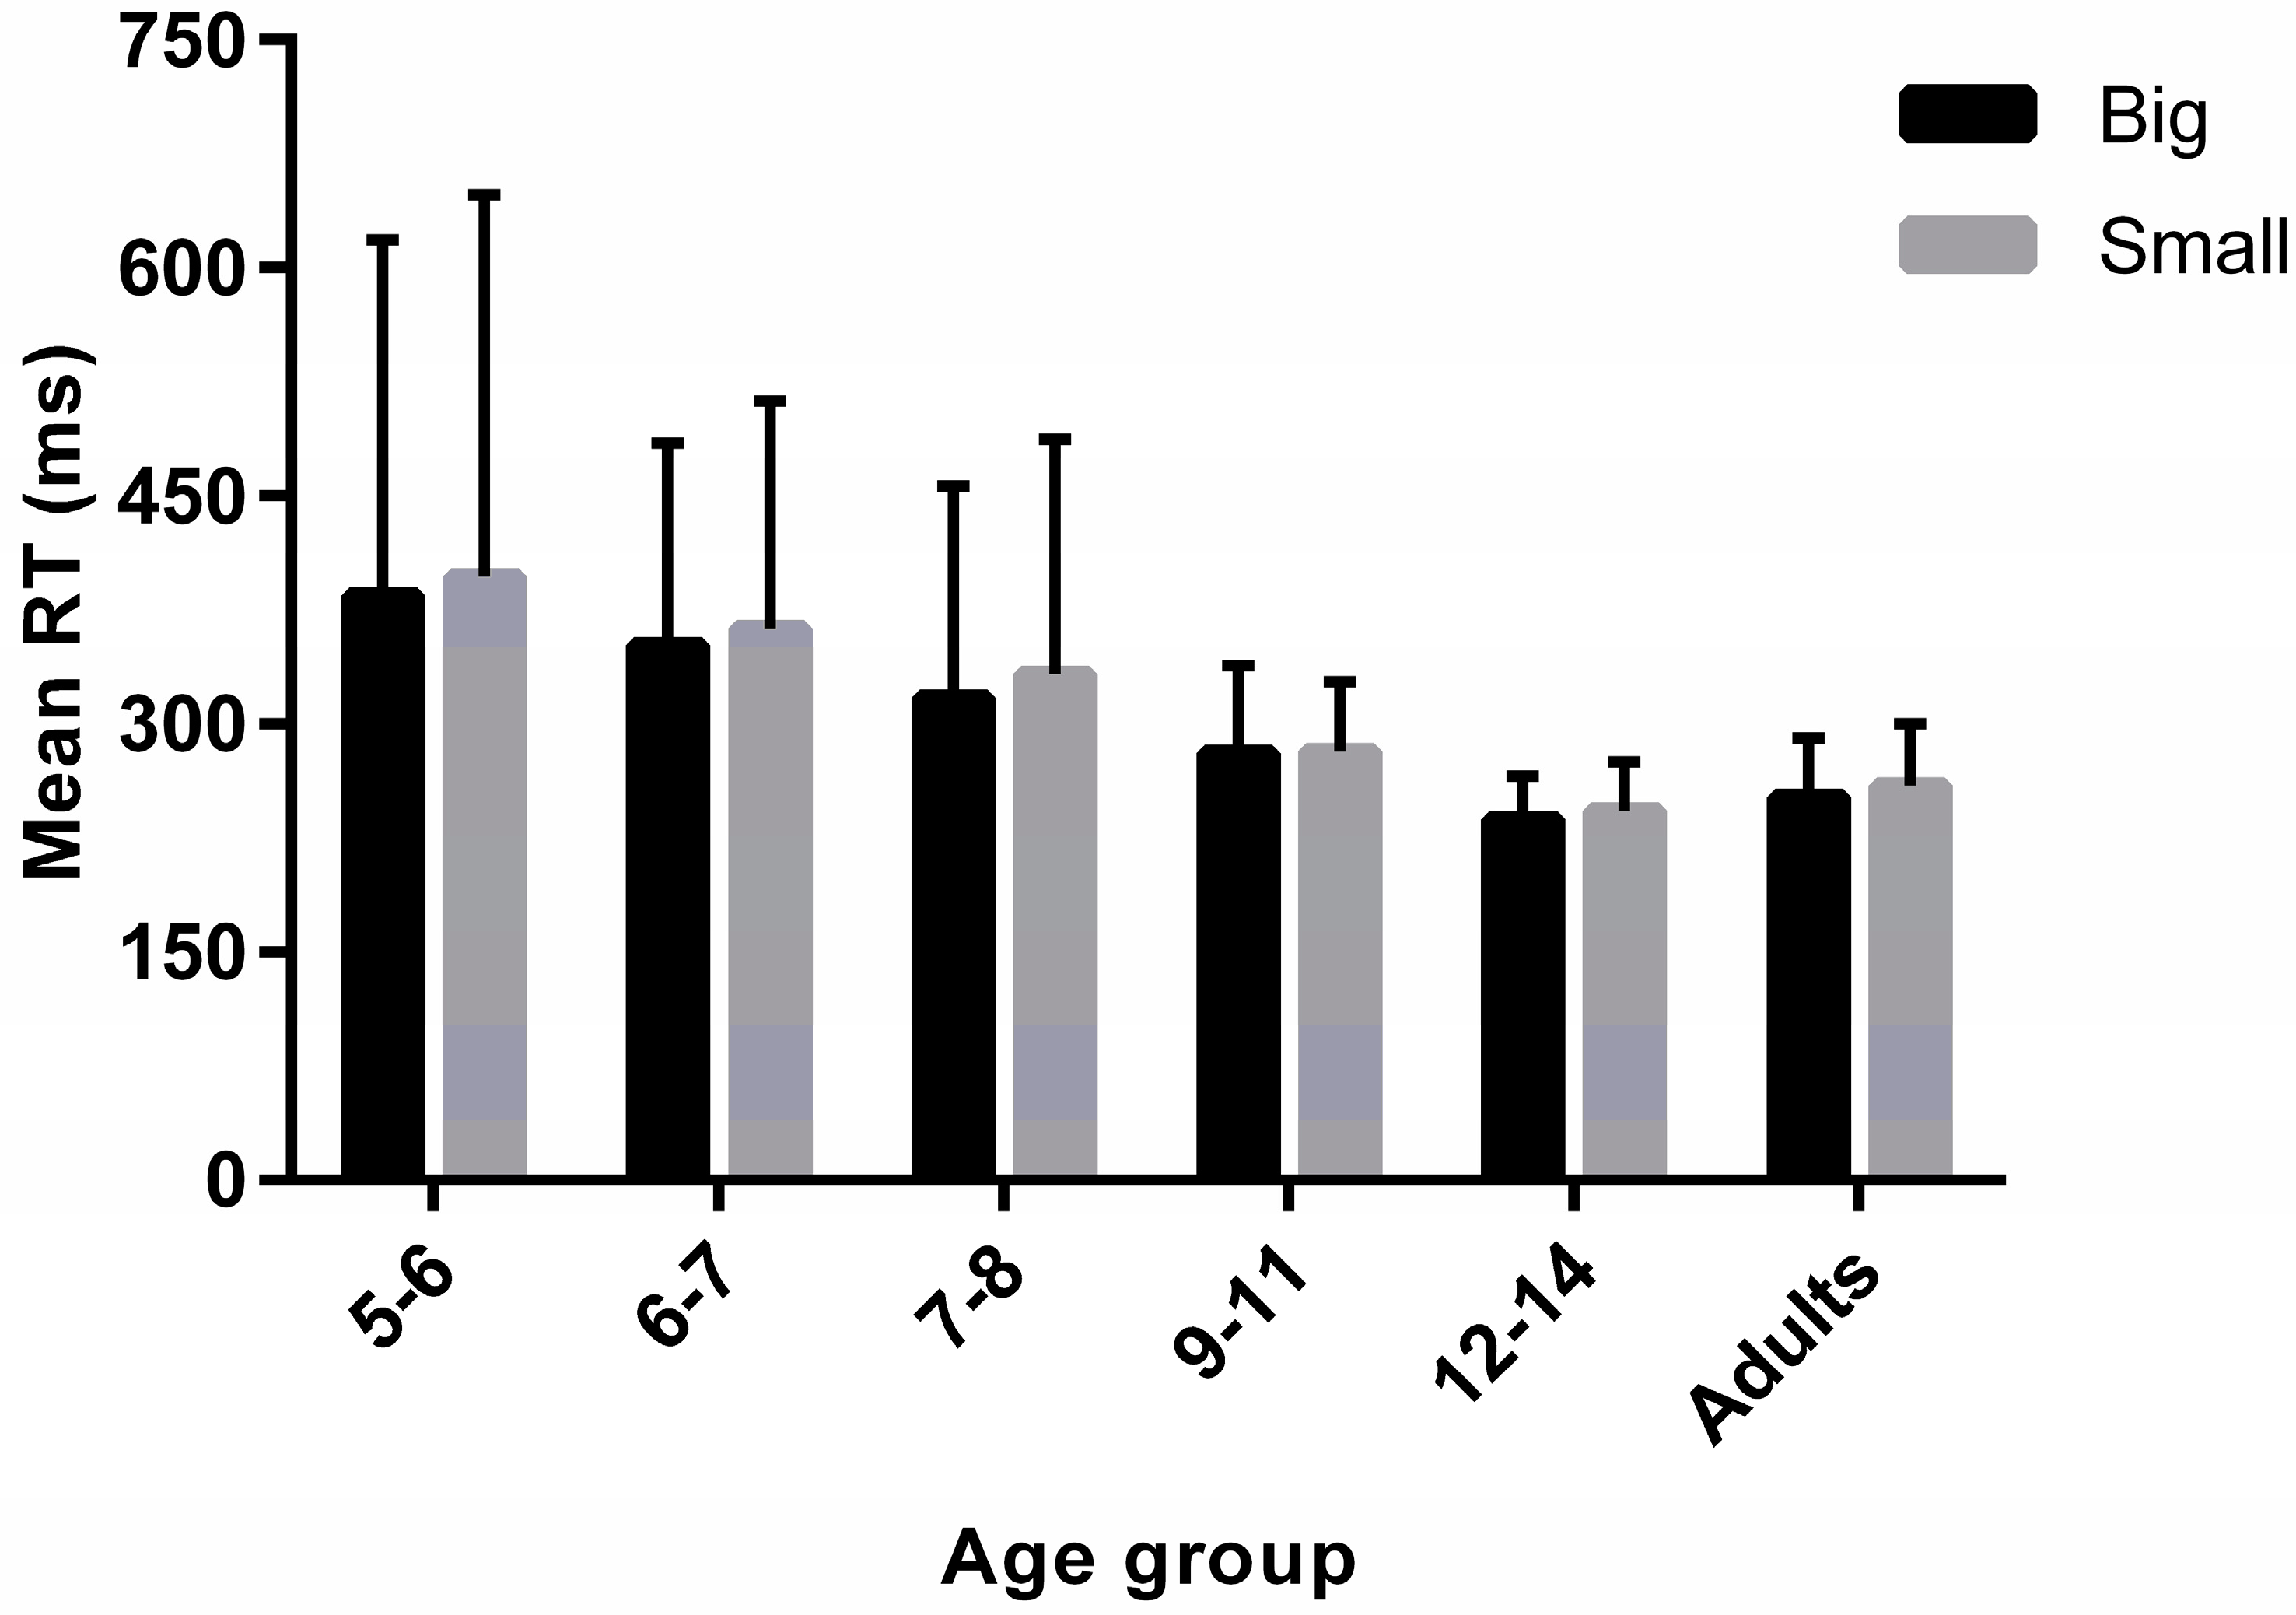
3.2. Simple Reaction Times
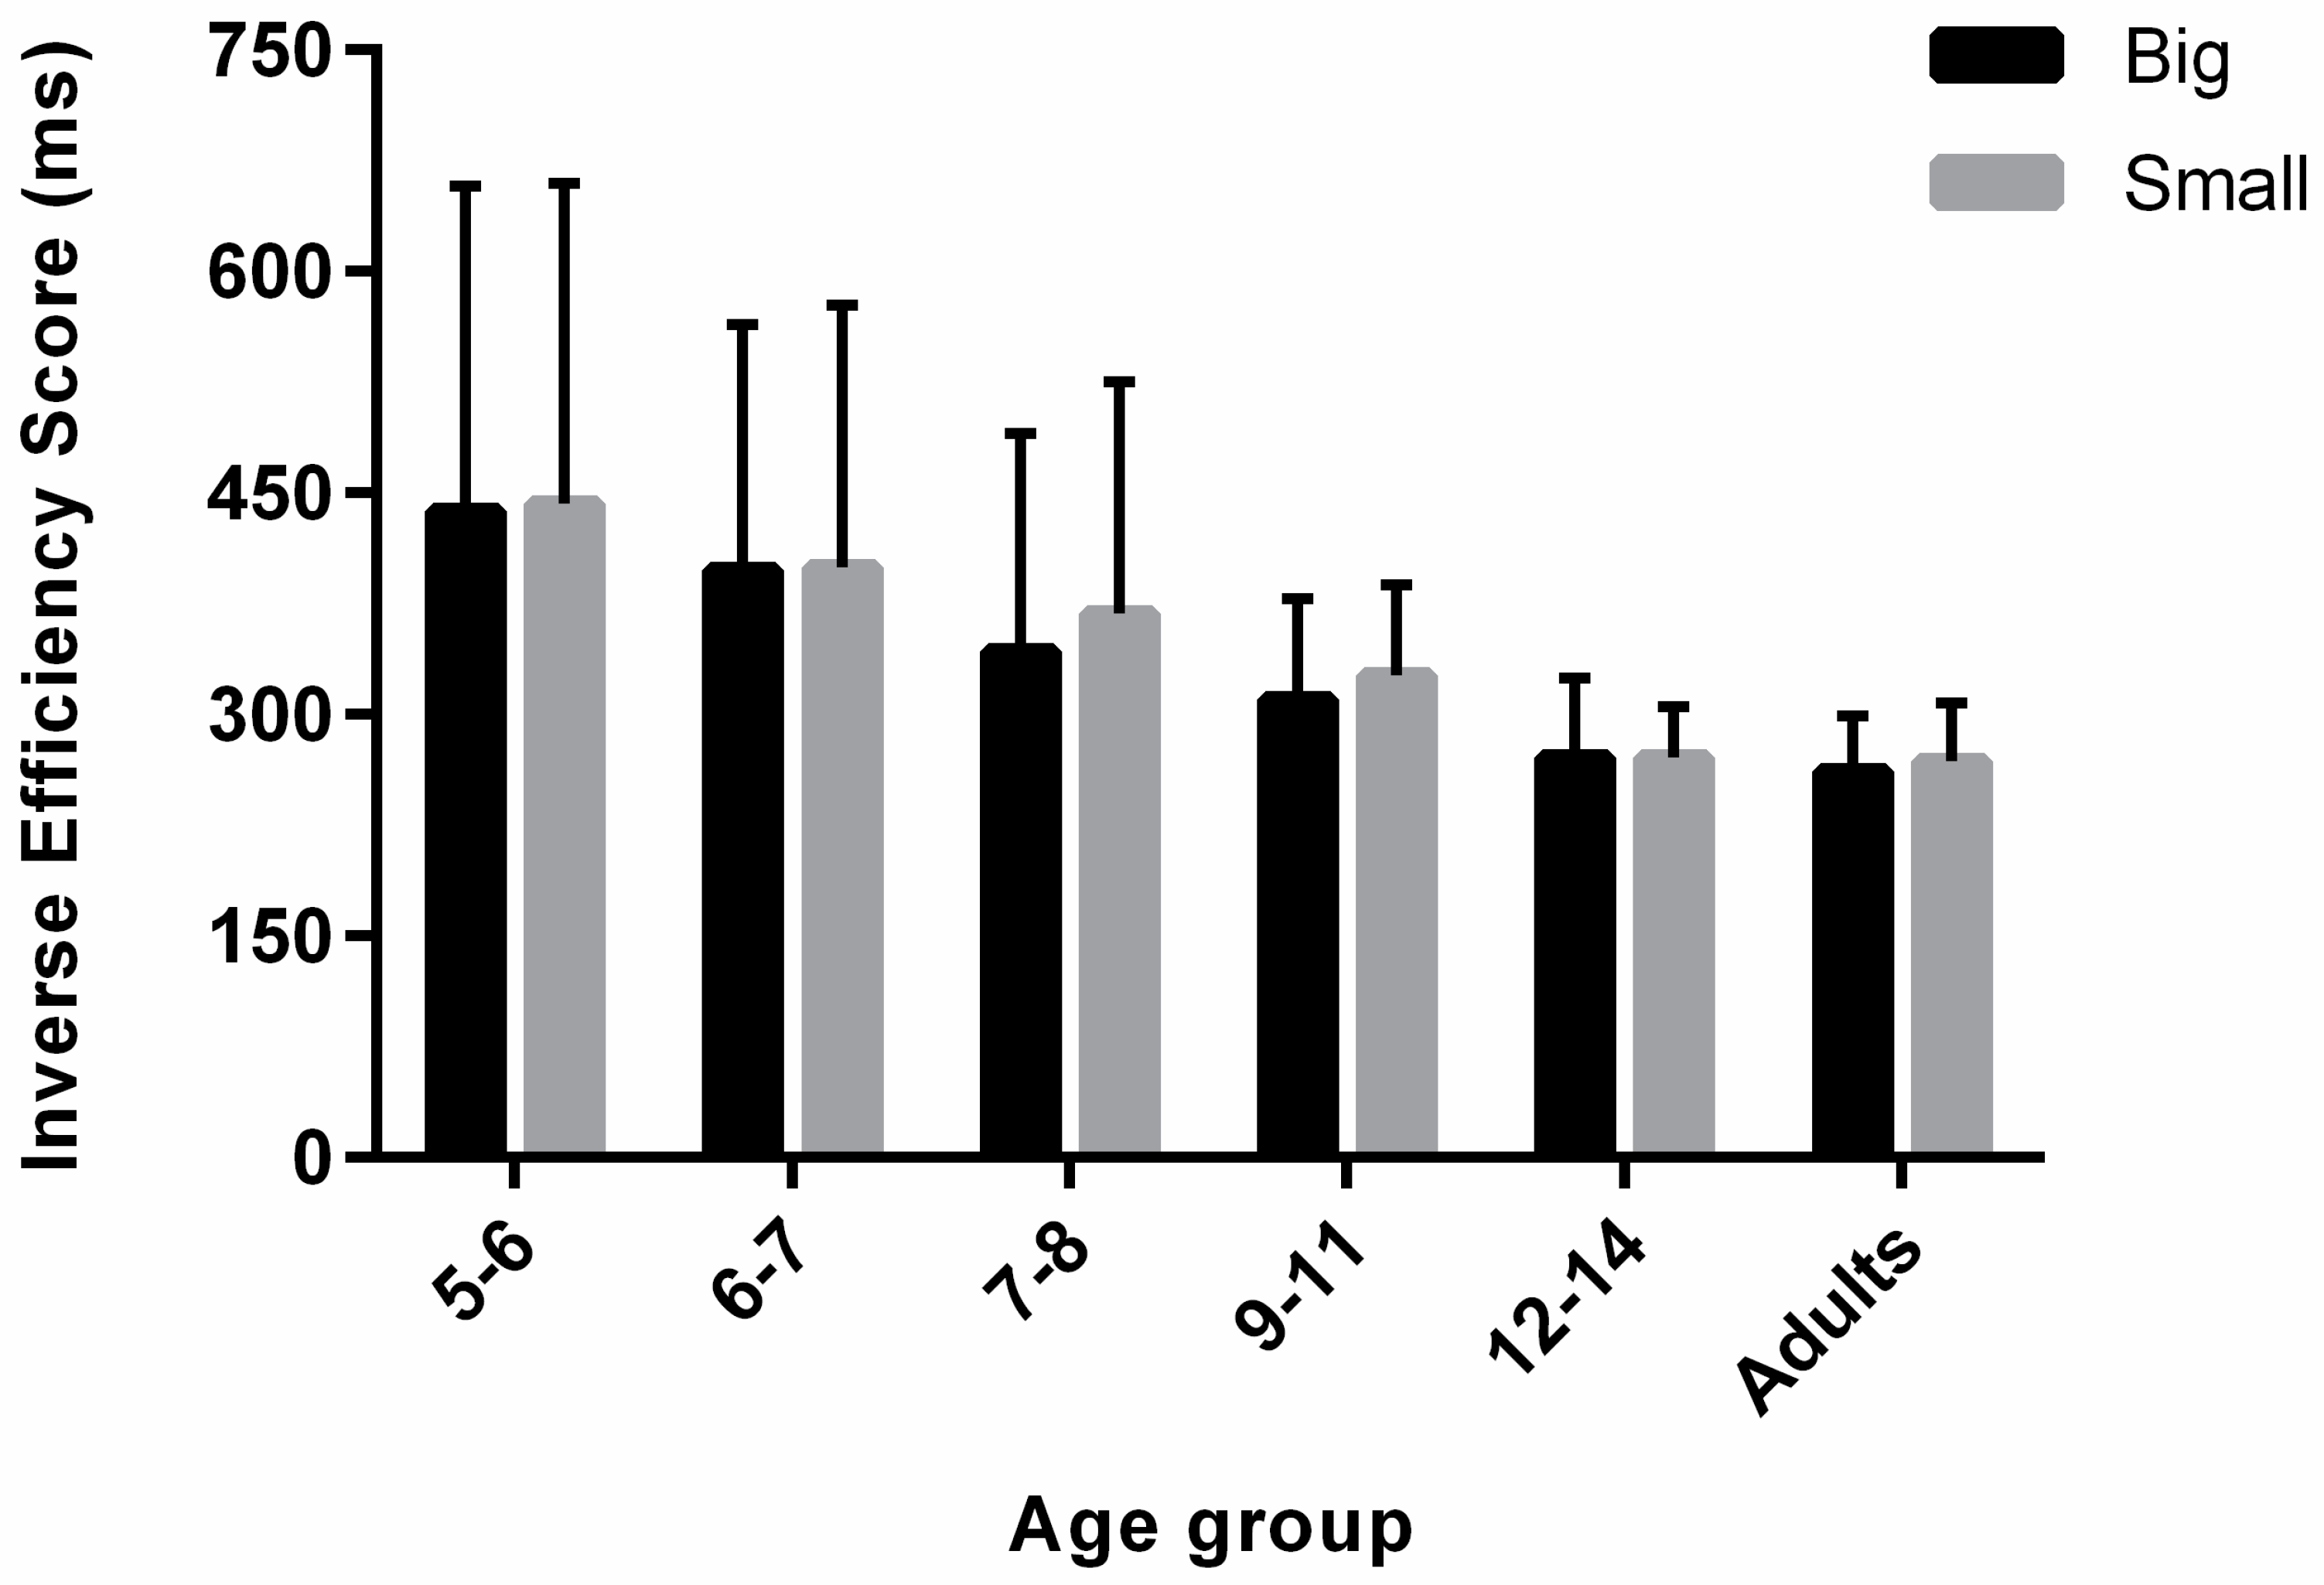
3.3. Inverse Efficiency Score
4. Discussion
Funding
Institutional Review Board Statement
Informed Consent Statement
Data Availability Statement
Acknowledgments
Conflicts of Interest
References
- Sperandio, I.; Chouinard, P.A. The Mechanisms of Size Constancy. Multisens. Res. 2015, 28, 253–283. [Google Scholar] [CrossRef]
- Ungerleider, L.G.; Ganz, L.; Pribram, K.H. Size constancy in rhesus monkeys: Effects of pulvinar, prestriate, and inferotemporal lesions. Exp. Brain Res. 1977, 27, 251–269. [Google Scholar] [CrossRef]
- Tanaka, S.; Fujita, I. Computation of Object Size in Visual Cortical Area V4 as a Neural Basis for Size Constancy. J. Neurosci. 2015, 35, 12033–12046. [Google Scholar] [CrossRef]
- Gunter, R. The absolute threshold for vision in the cat. J. Physiol. 1951, 114, 8–15. [Google Scholar] [CrossRef] [PubMed]
- Heller, D.P. Absence of size constancy in visually deprived rats. J. Comp. Physiol. Psychol. 1951, 65, 336–339. [Google Scholar] [CrossRef]
- Pastore, N. Form Perception and Size Constancy in the Duckling. J. Psychol. 1958, 45, 259–261. [Google Scholar] [CrossRef]
- Müller, C.A.; Mayer, C.; Dörrenberg, S.; Huber, L.; Range, F. Female but not male dogs respond to a size constancy violation. Biol. Lett. 2011, 7, 689–691. [Google Scholar] [CrossRef]
- Hataji, Y.; Kuroshima, H.; Fujita, K. Dynamic Corridor Illusion in Pigeons: Humanlike Pictorial Cue Precedence Over Motion Parallax Cue in Size Perception. i-Perception 2020, 11, 2041669520911408. [Google Scholar] [CrossRef] [PubMed]
- Granrud, C.E.; Haake, R.J.; Yonas, A. Infants’ sensitivity to familiar size: The effect of memory on spatial perception. Percept. Psychophys. 1985, 37, 459–466. [Google Scholar] [CrossRef] [PubMed]
- Slater, A.; Mattock, A.; Brown, E. Size constancy at birth: Newborn infants’ responses to retinal and real size. J. Exp. Child Psychol. 1990, 49, 314–322. [Google Scholar] [CrossRef]
- Bower, T.G.R. Stimulus Variables Determining Space Perception in Infants. Science 1965, 149, 88–89. [Google Scholar] [CrossRef]
- Day, R.H.; McKenzie, B.E. Infant perception of the invariant size of approaching and receding objects. Dev. Psychol. 1981, 17, 670–677. [Google Scholar] [CrossRef]
- Granrud, C.E. Size constancy in newborn human infants. Investig. Ophthalmol. Vis. Sci. 1987, 28. [Google Scholar] [CrossRef]
- Granrud, C.E. Size constancy in infants: 4-month-olds’ responses to physical versus retinal image size. J. Exp. Psychol. Hum. Percept. Perform. 2006, 32, 1398–1404. [Google Scholar] [CrossRef]
- McKenzie, B.E.; Tootell, H.E.; Day, R.H. Development of visual size constancy during the 1st year of human infancy. Dev. Psychol. 1980, 16, 163–174. [Google Scholar] [CrossRef]
- Brislin, R.W.; Leibowitz, H.W. The Effect of Separation between Test and Comparison Objects on Size Constancy at Various Age-Levels. Am. J. Psychol. 1970, 83, 372–376. [Google Scholar] [CrossRef] [PubMed]
- Granrud, C.E.; Schmechel, T.T.N. Development of size constancy in children: A test of the proximal mode sensitivity hypothesis. Percept. Psychophys. 2006, 68, 1372–1381. [Google Scholar] [CrossRef] [PubMed][Green Version]
- Granrud, C.E. Development of size constancy in children: A test of the metacognitive theory. Atten. Percept. Psychophys. 2009, 71, 644–654. [Google Scholar] [CrossRef] [PubMed]
- Leibowitz, H.W.; Pollard, S.W.; Dickson, D. Monocular and Binocular Size-Matching as a Function of Distance at Various Age-Levels. Am. J. Psychol. 1967, 80, 263–268. [Google Scholar] [CrossRef] [PubMed]
- Zeigler, H.P.; Leibowitz, H. Apparent Visual Size as a Function of Distance for Children and Adults. Am. J. Psychol. 1957, 70, 106–109. [Google Scholar] [CrossRef]
- Leibowitz, H.W. Multiple mechanisms of size perception and size constancy. Hiroshima Forum Psychol. 1974, 1, 47–53. [Google Scholar]
- Kavšek, M.; Granrud, C.E. Children’s and Adults’ Size Estimates at near and Far Distances: A Test of the Perceptual Learning Theory of Size Constancy Development. i-Perception 2012, 3, 459–466. [Google Scholar] [CrossRef] [PubMed]
- Rapoport, J.L. Attitude and size judgment in school age children. Child Dev. 1967, 38, 1188–1192. [Google Scholar] [CrossRef]
- Shimada, T. Developmental studies on size constancy (I): Experiments on size constancy in the photographs with single comparison method. Jpn. Psychol. Res. 1975, 17, 203–212. [Google Scholar] [CrossRef][Green Version]
- Merriman, W.E.; Moore, Z.; Granrud, C.E. Children’s strategic compensation for size underconstancy: Dependence on distance and relation to reasoning ability. Vis. Cogn. 2010, 18, 296–319. [Google Scholar] [CrossRef]
- Krahmer, E.; Noordewier, M.; Goudbeek, M.; Koolen, R. How big is the BFG? The impact of redundant size adjectives on size perception. Cogn. Sci. Soc. 2013, 35, 2772–2777. [Google Scholar]
- Carlson, V.R. Overestimation in size-constancy judgments. Am. J. Psychol. 1960, 73, 199–213. [Google Scholar] [CrossRef]
- Carlson, V.R. Size-constancy judgments and perceptual compromise. J. Exp. Psychol. 1962, 63, 68–73. [Google Scholar] [CrossRef]
- Epstein, W. Attitude of judgment and the size–distance invariance hypothesis. J. Exp. Psychol. 1963, 66, 78–83. [Google Scholar] [CrossRef]
- Gilinsky, A.S. The Effect of Attitude upon the Perception of Size. Am. J. Psychol. 1955, 68, 173–192. [Google Scholar] [CrossRef]
- Leibowitz, H.W.; Harvey, L.O. Effect of instructions, environment, and type of test object on matched size. J. Exp. Psychol. 1969, 81, 36–43. [Google Scholar] [CrossRef] [PubMed]
- Sperandio, I.; Savazzi, S.; Gregory, R.L.; Marzi, C.A. Visual Reaction Time and Size Constancy. Perception 2009, 38, 1601–1609. [Google Scholar] [CrossRef] [PubMed]
- Osaka, N. Reaction Time as a Function of Peripheral Retinal Locus around Fovea: Effect of Stimulus Size. Percept. Mot. Ski. 1976, 43, 603–606. [Google Scholar] [CrossRef]
- Plewan, T.; Weidner, R.; Fink, G.R. The influence of stimulus duration on visual illusions and simple reaction time. Exp. Brain Res. 2012, 223, 367–375. [Google Scholar] [CrossRef] [PubMed]
- Savazzi, S.; Emanuele, B.; Scalf, P.; Beck, D. Reaction times and perceptual adjustments are sensitive to the illusory distortion of space. Exp. Brain Res. 2012, 218, 119–128. [Google Scholar] [CrossRef]
- Sperandio, I.; Savazzi, S.; Marzi, C.A. Is simple reaction time affected by visual illusions? Exp. Brain Res. 2010, 201, 345–350. [Google Scholar] [CrossRef]
- Oldfield, R. The assessment and analysis of handedness: The Edinburgh inventory. Neuropsychologia 1971, 9, 97–113. [Google Scholar] [CrossRef]
- Henderson, R.M.; McCulloch, D.L.; Herbert, A.M. Event-related potentials (ERPs) to schematic faces in adults and children. Int. J. Psychophysiol. 2003, 51, 59–67. [Google Scholar] [CrossRef]
- Taylor, M.; Khan, S. Top-down modulation of early selective attention processes in children. Int. J. Psychophysiol. 2000, 37, 135–147. [Google Scholar] [CrossRef]
- Townsend, J.T.; Ashby, F.G. Stochastic Modeling of Elementary Psychological Processes; CUP Archive: Cambridge, UK, 1983. [Google Scholar]
- Bruyer, R.; Brysbaert, M. Combining speed and accuracy in cognitive psychology: Is the inverse efficiency score (IES) a better dependent variable than the mean reaction time (RT) and the percentage of errors (PE)? Psychol. Belg. 2011, 51, 5–13. [Google Scholar] [CrossRef]
- Rosner, B. On the Detection of Many Outliers. Technometrics 1975, 17, 221–227. [Google Scholar] [CrossRef]
- Hale, S. A Global Developmental Trend in Cognitive Processing Speed. Child Dev. 1990, 61, 653–663. [Google Scholar] [CrossRef] [PubMed]
- Kiselev, S.; Espy, K.A.; Sheffield, T. Age-related differences in reaction time task performance in young children. J. Exp. Child Psychol. 2009, 102, 150–166. [Google Scholar] [CrossRef]
- Philip, B.R. Reaction-Times of Children. Am. J. Psychol. 1934, 46, 379–396. [Google Scholar] [CrossRef]
- Cerasuolo, M.; Giganti, F.; Conte, F.; Costanzo, L.M.; Della Monica, C.; Arzilli, C.; Marchesano, R.; Perrella, A.; Ficca, G. Schooltime subjective sleepiness and performance in Italian primary school children. Chrono- Int. 2016, 33, 883–892. [Google Scholar] [CrossRef]
- Esmaeilzadeh, S. Reaction time: Does it relate to weight status in children? HOMO 2014, 65, 171–178. [Google Scholar] [CrossRef]
- Iida, Y.; Miyazaki, M.; Uchida, S. Developmental changes in cognitive reaction time of children aged 6–12 years. Eur. J. Sport Sci. 2010, 10, 151–158. [Google Scholar] [CrossRef]
- Van der Meere, J.; Stemerdink, N. The development of state regulation in normal children: An indirect comparison with children with ADHD. Dev. Neuropsychol. 1999, 16, 213–225. [Google Scholar] [CrossRef]
- Dockstader, C.; Gaetz, W.; Rockel, C.; Mabbott, D.J. White matter maturation in visual and motor areas predicts the latency of visual activation in children. Hum. Brain Mapp. 2012, 33, 179–191. [Google Scholar] [CrossRef]
- Mabbott, D.J.; Noseworthy, M.; Bouffet, E.; Laughlin, S.; Rockel, C. White matter growth as a mechanism of cognitive development in children. NeuroImage 2006, 33, 936–946. [Google Scholar] [CrossRef]
- Scantlebury, N.; Cunningham, T.; Dockstader, C.; Laughlin, S.; Gaetz, W.; Rockel, C.; Dickson, J.; Mabbott, D. Relations between White Matter Maturation and Reaction Time in Childhood. J. Int. Neuropsychol. Soc. 2013, 20, 99–112. [Google Scholar] [CrossRef]
- Bucsuházy, K.; Semela, M. Case Study: Reaction Time of Children According to Age. Procedia Eng. 2017, 187, 408–413. [Google Scholar] [CrossRef]
- Chen, J.; Sperandio, I.; Henry, M.J.; Goodale, M.A. Changing the Real Viewing Distance Reveals the Temporal Evolution of Size Constancy in Visual Cortex. Curr. Biol. 2019, 29, 2237–2243.e4. [Google Scholar] [CrossRef] [PubMed]
- Gregory, R.L. Distortion of Visual Space as Inappropriate Constancy Scaling. Nature 1963, 199, 678–680. [Google Scholar] [CrossRef] [PubMed]
- Gregory, R.L. Perceptual illusions and brain models. Proc. R. Soc. Lond. Ser. B Boil. Sci. 1968, 171, 279–296. [Google Scholar] [CrossRef]
- Gandhi, T.; Kalia, A.; Ganesh, S.; Sinha, P. Immediate susceptibility to visual illusions after sight onset. Curr. Biol. 2015, 25, R358–R359. [Google Scholar] [CrossRef] [PubMed]
- Andres, E.; McKyton, A.; Ben-Zion, I.; Zohary, E. Size constancy following long-term visual deprivation. Curr. Biol. 2017, 27, R696–R697. [Google Scholar] [CrossRef]
- Sperandio, I.; Kaderali, S.; Chouinard, P.A.; Frey, J.; Goodale, M.A. Perceived size change induced by non-visual signals in darkness: The relative contribution of vergence and proprioception. J. Neurosci. 2013, 33, 16915–16923. [Google Scholar] [CrossRef] [PubMed]
- Combe, E.; Wexler, M. Observer Movement and Size Constancy. Psychol. Sci. 2010, 21, 667–675. [Google Scholar] [CrossRef]
- Battaglia, P.W.; Di Luca, M.; Ernst, M.O.; Schrater, P.R.; Machulla, T.; Kersten, D. Within- and Cross-Modal Distance Information Disambiguate Visual Size-Change Perception. PLoS Comput. Biol. 2010, 6, e1000697. [Google Scholar] [CrossRef]
- Chen, J.; Sperandio, I.; Goodale, M. Proprioceptive Distance Cues Restore Perfect Size Constancy in Grasping, but Not Perception, When Vision Is Limited. Curr. Biol. 2018, 28, 927–932.e4. [Google Scholar] [CrossRef]
- Jaekl, P.; Soto-Faraco, S.; Harris, L.R. Perceived size change induced by audiovisual temporal delays. Exp. Brain Res. 2011, 216, 457–462. [Google Scholar] [CrossRef]
- Yamasaki, D.; Hiroshi, A. Size–Distance Scaling with Absolute and Relative Auditory Distance Information. Multisens. Res. 2020, 33, 109–126. [Google Scholar] [CrossRef]
- Leibowitz, H.; Hartman, T. Magnitude of the Moon Illusion as a Function of the Age of the Observer. Science 1959, 130, 569–570. [Google Scholar] [CrossRef]
- Leibowitz, H.W.; Judisch, J.M. The Relation between Age and the Magnitude of the Ponzo Illusion. Am. J. Psychol. 1967, 80, 105. [Google Scholar] [CrossRef]
- Tronick, E.; Hershenson, M. Size-distance perception in preschool children. J. Exp. Child Psychol. 1979, 27, 166–184. [Google Scholar] [CrossRef]
- Fisher, S.K.; Ciuffreda, K.J. Accommodation and Apparent Distance. Perception 1988, 17, 609–621. [Google Scholar] [CrossRef] [PubMed]
- Gogel, W.C. Convergence as a Cue to Absolute Distance. J. Psychol. 1961, 52, 287–301. [Google Scholar] [CrossRef]
- Gregory, R.L. Emmert’s Law and the moon illusion. Spat. Vis. 2008, 21, 407–420. [Google Scholar] [CrossRef] [PubMed]
- Hermans, T.G. Visual size constancy as a function of convergence. J. Exp. Psychol. 1937, 21, 307–324. [Google Scholar] [CrossRef]
- Holoway, A.H.; Boring, E.G. Determinants of apparent visual size with distance variant. Am. J. Psychol. 1941, 54, 21–37. [Google Scholar] [CrossRef]
- Millard, A.S.; Sperandio, I.; Chouinard, P.A. The contribution of stereopsis in Emmert’s law. Exp. Brain Res. 2020, 238, 1061–1072. [Google Scholar] [CrossRef] [PubMed]
- Mon-Williams, M.; Tresilian, J.R. Ordinal depth information from accommodation? Ergonomics 2000, 43, 391–404. [Google Scholar] [CrossRef] [PubMed]
- Tresilian, J.R.; Mon-Williams, M.; Kelly, B.M. Increasing confidence in vergence as a cue to distance. Proc. R. Soc. B Boil. Sci. 1999, 266, 39–44. [Google Scholar] [CrossRef] [PubMed]
- Linton, P. Does vision extract absolute distance from vergence? Atten. Percept. Psychophys. 2020, 82, 3176–3195. [Google Scholar] [CrossRef]
- Linton, P. Does Vergence Affect Perceived Size? Vision 2021, 5, 33. [Google Scholar] [CrossRef]
- Banks, M.S. The development of ocular accommodation during early infancy. Child. Dev. 1983, 51, 646–666. [Google Scholar] [CrossRef][Green Version]
- Bharadwaj, S.R.; Candy, T.R. Cues for the control of ocular accommodation and vergence during postnatal human development. J. Vis. 2008, 8, 1–16. [Google Scholar] [CrossRef]
- Haynes, H.; White, B.L.; Held, R. Visual Accommodation in Human Infants. Science 1965, 148, 528–530. [Google Scholar] [CrossRef]
- Thorn, F.; Gwiazda, J.; A Cruz, A.; A Bauer, J.; Held, R. The development of eye alignment, convergence, and sensory binocularity in young infants. Investig. Ophthalmol. Vis. Sci. 1994, 35, 544–553. [Google Scholar]
- Turner, J.; Horwood, A.; Houston, S.; Riddell, P. Development of the response AC/A ratio over the first year of life. Vis. Res. 2002, 42, 2521–2532. [Google Scholar] [CrossRef]
- Seemiller, E.S.; Wang, J.; Candy, T.R. Sensitivity of vergence responses of 5- to 10-week-old human infants. J. Vis. 2016, 16, 20. [Google Scholar] [CrossRef] [PubMed][Green Version]
- Sreenivasan, V.; Babinsky, E.E.; Wu, Y.; Candy, T.R. Objective Measurement of Fusional Vergence Ranges and Heterophoria in Infants and Preschool Children. Investig. Opthalmol. Vis. Sci. 2016, 57, 2678–2688. [Google Scholar] [CrossRef] [PubMed]


| Age Group | Gender | Handedness | N | |||
|---|---|---|---|---|---|---|
| Female | Male | Left | Right | Ambi | ||
| 5–6 | 7 | 2 | 2 | 7 | 0 | 9 |
| 6–7 | 11 | 17 | 3 | 25 | 0 | 28 |
| 7–8 | 11 | 8 | 1 | 18 | 0 | 19 |
| 9–11 | 20 | 24 | 6 | 38 | 1 | 44 |
| 12–14 | 14 | 17 | 5 | 26 | 0 | 31 |
| 18–45 | 20 | 5 | 2 | 23 | 0 | 25 |
| Overall | 83 | 73 | 19 | 137 | 1 | 156 |
Publisher’s Note: MDPI stays neutral with regard to jurisdictional claims in published maps and institutional affiliations. |
© 2021 by the author. Licensee MDPI, Basel, Switzerland. This article is an open access article distributed under the terms and conditions of the Creative Commons Attribution (CC BY) license (https://creativecommons.org/licenses/by/4.0/).
Share and Cite
Sperandio, I. Developmental Trajectories of Size Constancy as Implicitly Examined by Simple Reaction Times. Vision 2021, 5, 50. https://doi.org/10.3390/vision5040050
Sperandio I. Developmental Trajectories of Size Constancy as Implicitly Examined by Simple Reaction Times. Vision. 2021; 5(4):50. https://doi.org/10.3390/vision5040050
Chicago/Turabian StyleSperandio, Irene. 2021. "Developmental Trajectories of Size Constancy as Implicitly Examined by Simple Reaction Times" Vision 5, no. 4: 50. https://doi.org/10.3390/vision5040050
APA StyleSperandio, I. (2021). Developmental Trajectories of Size Constancy as Implicitly Examined by Simple Reaction Times. Vision, 5(4), 50. https://doi.org/10.3390/vision5040050