Muscle Synergies Reliability in the Power Clean Exercise

 ,
,  , ,
, ,  , and
, and 
Abstract
1. Introduction
2. Materials and Methods
2.1. Participants
2.2. Experimental Approach
2.3. Data Collection and Materials
2.4. Data Processing
2.5. Extraction of Muscle Synergies
2.6. Statistical Analysis
3. Results
3.1. Intra-Day Reliability
3.2. Inter-Day Reliability
4. Discussion
4.1. Intra-Day Reliability
4.2. Inter-Day Reliability
4.3. Limitations
5. Conclusions
Author Contributions
Funding
Acknowledgments
Conflicts of Interest
References
- Bernstein, N. The Co-Ordination and Regulation of Movements; Pergamon: Oxford, UK, 1967. [Google Scholar]
- Hirashima, M.; Oya, T. How does the brain solve muscle redundancy? Filling the gap between optimization and muscle synergy hypotheses. Neurosci. Res. 2016, 104, 80–87. [Google Scholar] [CrossRef] [PubMed]
- Tresch, M.C.; Jarc, A. The case for and against muscle synergies. Curr. Opin. Neurobiol. 2009, 19, 601–607. [Google Scholar] [CrossRef] [PubMed]
- Safavynia, S.A.; Torres-Oviedo, G.; Ting, L.H. Muscle Synergies: Implications for Clinical Evaluation and Rehabilitation of Movement. Top. Spin. Cord Inj. Rehabil. 2011, 17, 16–24. [Google Scholar] [CrossRef]
- d’Avella, A.; Saltiel, P.; Bizzi, E. Combinations of muscle synergies in the construction of a natural motor behavior. Nat. Neurosci. 2003, 6, 300–308. [Google Scholar] [CrossRef]
- Bizzi, E.; Cheung, V.C.K. The neural origin of muscle synergies. Front. Comput. Neurosci. 2013, 7, 51. [Google Scholar] [CrossRef]
- Bruton, M.; O’Dwyer, N. Synergies in coordination: A comprehensive overview of neural, computational, and behavioral approaches. J. Neurophysiol. 2018, 120, 2761–2774. [Google Scholar] [CrossRef]
- Mussa-Ivaldi, F.A.; Giszter, S.F.; Bizzi, E. Linear combinations of primitives in vertebrate motor control. Proc. Natl. Acad. Sci. USA 1994, 91, 7534–7538. [Google Scholar] [CrossRef]
- Saltiel, P.; Wyler-Duda, K.; D’Avella, A.; Tresch, M.C.; Bizzi, E. Muscle synergies encoded within the spinal cord: Evidence from focal intraspinal NMDA iontophoresis in the frog. J. Neurophysiol. 2001, 85, 605–619. [Google Scholar] [CrossRef]
- Hart, C.B.; Giszter, S.F. A neural basis for motor primitives in the spinal cord. J. Neurosci. 2010, 30, 1322–1336. [Google Scholar] [CrossRef]
- Takei, T.; Confais, J.; Tomatsu, S.; Oya, T.; Seki, K. Neural basis for hand muscle synergies in the primate spinal cord. Proc. Natl. Acad. Sci. USA 2017, 114, 8643–8648. [Google Scholar] [CrossRef]
- Desrochers, E.; Harnie, J.; Doelman, A.; Hurteau, M.F.; Frigon, A. Spinal control of muscle synergies for adult mammalian locomotion. J. Physiol. 2019, 597, 333–350. [Google Scholar] [CrossRef] [PubMed]
- Kutch, J.J.; Valero-Cuevas, F.J. Challenges and new approaches to proving the existence of muscle synergies of neural origin. PLoS Comput. Biol. 2012, 8, e1002434. [Google Scholar] [CrossRef]
- Hug, F. Can muscle coordination be precisely studied by surface electromyography? J. Electromyogr. Kinesiol. 2011, 21, 1–12. [Google Scholar] [CrossRef] [PubMed]
- Singh, R.E.; Iqbal, K.; White, G.; Hutchinson, T.E. A Systematic Review on Muscle Synergies: From Building Blocks of Motor Behavior to a Neurorehabilitation Tool. Appl. Bionics Biomech. 2018, 2018, 3615368. [Google Scholar] [CrossRef]
- Taborri, J.; Agostini, V.; Artemiadis, P.K.; Ghislieri, M.; Jacobs, D.A.; Roh, J.; Rossi, S. Feasibility of Muscle Synergy Outcomes in Clinics, Robotics, and Sports: A Systematic Review. Appl. Bionics Biomech. 2018, 2018, 1–19. [Google Scholar] [CrossRef]
- Chen, X.; Niu, X.; Wu, D.; Yu, Y.; Zhang, X. Investigation of the Intra- and Inter-Limb Muscle Coordination of Hands-and-Knees Crawling in Human Adults by Means of Muscle Synergy Analysis. Entropy 2017, 19, 229. [Google Scholar] [CrossRef]
- Cappellini, G.; Ivanenko, Y.P.; Poppele, R.E.; Lacquaniti, F. Motor Patterns in Human Walking and Running. J. Neurophysiol. 2006, 95, 3426–3437. [Google Scholar] [CrossRef]
- Kim, M.; Kim, Y.; Kim, H.; Yoon, B. Specific muscle synergies in national elite female ice hockey players in response to unexpected external perturbation. J. Sports Sci. 2018, 36, 319–325. [Google Scholar] [CrossRef]
- Hug, F.; Turpin, N.A.; Guével, A.; Dorel, S. Is interindividual variability of EMG patterns in trained cyclists related to different muscle synergies? J. Appl. Physiol. 2010, 108, 1727–1736. [Google Scholar] [CrossRef]
- Hug, F.; Turpin, N.A.; Couturier, A.; Dorel, S. Consistency of muscle synergies during pedaling across different mechanical constraints. J. Neurophysiol. 2011, 106, 91–103. [Google Scholar] [CrossRef]
- Turpin, N.A.; Guével, A.; Durand, S.; Hug, F. No evidence of expertise-related changes in muscle synergies during rowing. J. Electromyogr. Kinesiol. 2011, 21, 1030–1040. [Google Scholar] [CrossRef]
- Frère, J.; Hug, F. Between-subject variability of muscle synergies during a complex motor skill. Front. Comput. Neurosci. 2012, 6, 99. [Google Scholar] [CrossRef] [PubMed]
- Vaz, J.R.; Olstad, B.H.; Cabri, J.; Kjendlie, P.-L.; Pezarat-Correia, P.; Hug, F. Muscle coordination during breaststroke swimming: Comparison between elite swimmers and beginners. J. Sports Sci. 2016, 34, 1941–1948. [Google Scholar] [CrossRef]
- Kristiansen, M.; Madeleine, P.; Hansen, E.A.; Samani, A. Inter-subject variability of muscle synergies during bench press in power lifters and untrained individuals. Scand. J. Med. Sci. Sports 2015, 25, 89–97. [Google Scholar] [CrossRef]
- Silva, P.B.; Oliveira, A.S.; Mrachacz-Kersting, N.; Kersting, U.G. Effects of wobble board training on single-leg landing neuromechanics. Scand. J. Med. Sci. Sports 2018, 28, 972–982. [Google Scholar] [CrossRef] [PubMed]
- Kristiansen, M.; Samani, A.; Madeleine, P.; Hansen, E.A. Effects of 5 Weeks of Bench Press Training on Muscle Synergies: A Randomized Controlled Study. J. Strength Cond. Res. 2016, 30, 1948–1959. [Google Scholar] [CrossRef]
- Kristiansen, M.; Samani, A.; Madeleine, P.; Hansen, E.A. Muscle synergies during bench press are reliable across days. J. Electromyogr. Kinesiol. 2016, 30, 81–88. [Google Scholar] [CrossRef]
- Taborri, J.; Palermo, E.; Del Prete, Z.; Rossi, S. On the Reliability and Repeatability of Surface Electromyography Factorization by Muscle Synergies in Daily Life Activities. Appl. Bionics Biomech. 2018, 2018, 5852307. [Google Scholar] [CrossRef]
- Comfort, P.; McMahon, J.J. Reliability of Maximal Back Squat and Power Clean Performances in Inexperienced Athletes. J. Strength Cond. Res. 2015, 29, 3089–3096. [Google Scholar] [CrossRef]
- Hermens, H.J.; Freriks, B.; Disselhorst-Klug, C.; Rau, G. Development of recommendations for SEMG sensors and sensor placement procedures. J. Electromyogr. Kinesiol. 2000, 10, 361–374. [Google Scholar] [CrossRef]
- Zipp, P. Recommendations for the standardization of lead positions in surface electromyography. Eur. J. Appl. Physiol. Occup. Physiol. 1982, 50, 41–54. [Google Scholar] [CrossRef]
- de Sèze, M.P.; Cazalets, J.-R. Anatomical optimization of skin electrode placement to record electromyographic activity of erector spinae muscles. Surg. Radiol. Anat. 2008, 30, 137–143. [Google Scholar] [CrossRef]
- Lee, D.D.; Seung, H.S. Algorithms for non-negative matrix factorization. In Advances in Neural Information Processing Systems 13; Leen, T.K., Dietterich, T.G., Tresp, V., Eds.; MIT Press: Cambridge, MA, USA, 2001; pp. 556–562. [Google Scholar]
- Clark, D.J.; Ting, L.H.; Zajac, F.E.; Neptune, R.R.; Kautz, S.A. Merging of healthy motor modules predicts reduced locomotor performance and muscle coordination complexity post-stroke. J. Neurophysiol. 2010, 103, 844–857. [Google Scholar] [CrossRef] [PubMed]
- Koo, T.K.; Li, M.Y. A Guideline of Selecting and Reporting Intraclass Correlation Coefficients for Reliability Research. J. Chiropr. Med. 2016, 15, 155–163. [Google Scholar] [CrossRef]
- Weir, J.P. Quantifying test-retest reliability using the intraclass correlation coefficient and the SEM. J. Strength Cond. Res. 2005, 19, 231–240. [Google Scholar] [CrossRef]
- Sheskin, D.J. Handbook of Parametric and Nonparametric Statistical Procedures, 3rd ed.; CRC Press: Boca Raton, FL, USA, 2003. [Google Scholar]
- Steele, K.M.; Tresch, M.C.; Perreault, E.J. The number and choice of muscles impact the results of muscle synergy analyses. Front. Comput. Neurosci. 2013, 7, 105. [Google Scholar] [CrossRef] [PubMed]
- Hug, F.; Turpin, N.A.; Dorel, S.; Guével, A. Smoothing of electromyographic signals can influence the number of extracted muscle synergies. Clin. Neurophysiol. 2012, 123, 1895–1896. [Google Scholar] [CrossRef]
- Marshall, P.; Murphy, B. The validity and reliability of surface EMG to assess the neuromuscular response of the abdominal muscles to rapid limb movement. J. Electromyogr. Kinesiol. 2003, 13, 477–489. [Google Scholar] [CrossRef]
- Gail, S.; Künzell, S. Reliability of a 5-Repetition Maximum Strength Test in Recreational Athletes. Dtsch. Z. Sportmed. 2014, 2014, 314–317. [Google Scholar] [CrossRef]
- Taylor, J.D.; Fletcher, J.P. Reliability of the 8-repetition maximum test in men and women. J. Sci. Med. Sport 2012, 15, 69–73. [Google Scholar] [CrossRef]
- Ginn, K.A.; Halaki, M. Do surface electrode recordings validly represent latissimus dorsi activation patterns during shoulder tasks? J. Electromyogr. Kinesiol. 2015, 25, 8–13. [Google Scholar] [CrossRef] [PubMed]
- Leijnse, J.N.A.L.; Carter, S.; Gupta, A.; McCabe, S. Anatomic basis for individuated surface EMG and homogeneous electrostimulation with neuroprostheses of the extensor digitorum communis. J. Neurophysiol. 2008, 100, 64–75. [Google Scholar] [CrossRef] [PubMed]
- De Luca, C.J.; Kuznetsov, M.; Gilmore, L.D.; Roy, S.H. Inter-electrode spacing of surface EMG sensors: Reduction of crosstalk contamination during voluntary contractions. J. Biomech. 2012, 45, 555–561. [Google Scholar] [CrossRef] [PubMed]
- Latash, M.L.; Scholz, J.P.; Schöner, G. Toward a New Theory of Motor Synergies. Motor Control 2007, 11, 276–308. [Google Scholar] [CrossRef]
- Carroll, T.J.; Riek, S.; Carson, R.G. Neural adaptations to resistance training: Implications for movement control. Sports Med. 2001, 31, 829–840. [Google Scholar] [CrossRef]
- Carson, R.G. Changes in muscle coordination with training. J. Appl. Physiol. 2006, 101, 1506–1513. [Google Scholar] [CrossRef]
- Stronska, K.; Gołaś, A.; Wilk, M.; Zajac, A.; Maszczyk, A.; Stastny, P. The effect of targeted resistance training on bench press performance and the alternation of prime mover muscle activation patterns. Sports Biomech. 2020, 1–15. [Google Scholar] [CrossRef]
- Stastny, P.; Gołaś, A.; Blazek, D.; Maszczyk, A.; Wilk, M.; Pietraszewski, P.; Petr, M.; Uhlir, P.; Zając, A. A systematic review of surface electromyography analyses of the bench press movement task. PLoS ONE 2017, 12, e0171632. [Google Scholar] [CrossRef]
- Gołaś, A.; Maszczyk, A.; Pietraszewski, P.; Stastny, P.; Tufano, J.J.; Zając, A. Effects of Pre-exhaustion on the Patterns of Muscular Activity in the Flat Bench Press. J. Strength Cond. Res. 2017, 31, 1919–1924. [Google Scholar] [CrossRef]
- Lambert-Shirzad, N.; Van der Loos, H.F.M. On identifying kinematic and muscle synergies: A comparison of matrix factorization methods using experimental data from the healthy population. J. Neurophysiol. 2017, 117, 290–302. [Google Scholar] [CrossRef]


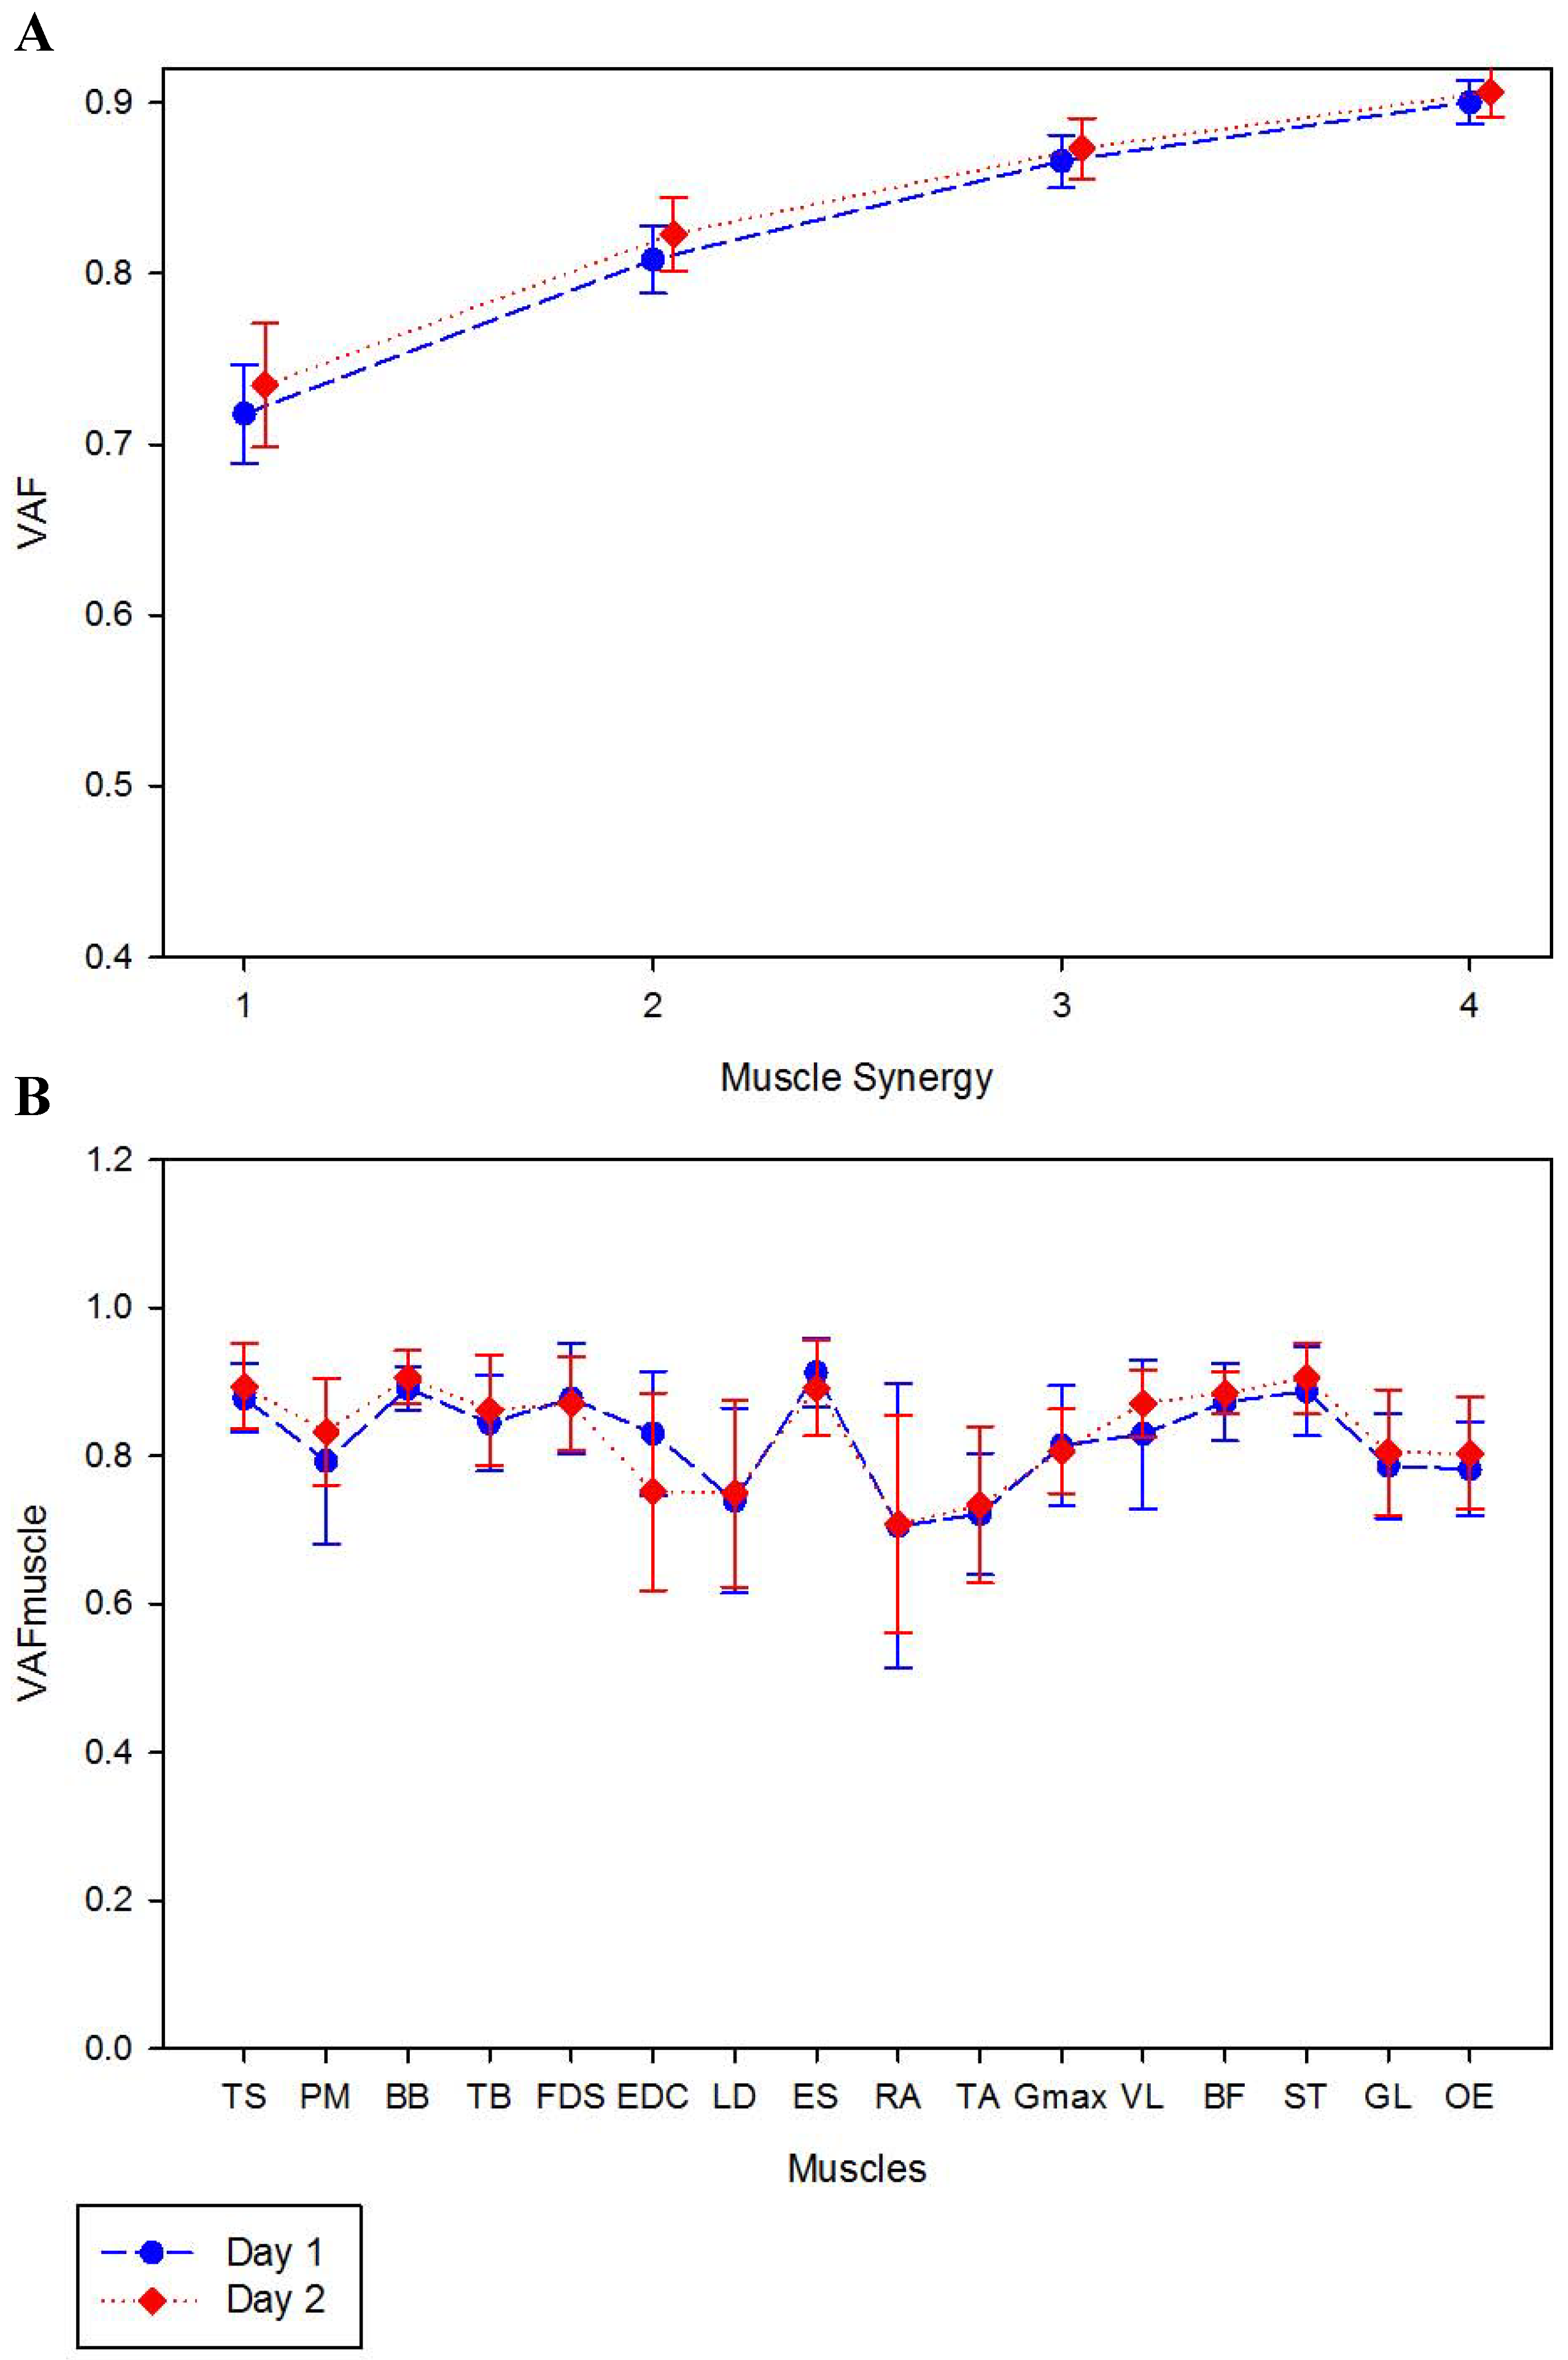
| VAF | VAF Muscle | |||||||||||||||||||
|---|---|---|---|---|---|---|---|---|---|---|---|---|---|---|---|---|---|---|---|---|
| #1 | #2 | #3 | TS | PM | BB | TB | FDS | EDC | LD | ES | RA | TA | Gmax | VL | BF | ST | GL | OE | ||
| Intra-day 1 | ICC (3,4) | 0.95 | 0.94 | 0.92 | 0.92 | 0.91 | 0.82 | 0.89 | 0.91 | 0.97 | 0.94 | 0.80 | 0.89 | 0.84 | 0.97 | 0.84 | 0.94 | 0.89 | 0.92 | 0.65 |
| SEM | 0.02 | 0.01 | 0.01 | 0.03 | 0.08 | 0.03 | 0.05 | 0.05 | 0.03 | 0.07 | 0.06 | 0.14 | 0.09 | 0.03 | 0.10 | 0.03 | 0.04 | 0.05 | 0.10 | |
| CI (95%) | 0.87 0.98 | 0.84 0.98 | 0.81 0.97 | 0.82 0.98 | 0.78 0.97 | 0.56 0.94 | 0.74 0.97 | 0.77 0.97 | 0.91 0.99 | 0.87 0.98 | 0.52 0.94 | 0.70 0.97 | 0.60 0.95 | 0.92 0.99 | 0.60 0.95 | 0.85 0.98 | 0.72 0.97 | 0.82 0.98 | 0.13 0.90 | |
| Intra-day 2 | ICC (3,4) | 0.98 | 0.97 | 0.92 | 0.98 | 0.97 | 0.94 | 0.97 | 0.95 | 0.97 | 0.95 | 0.94 | 0.92 | 0.93 | 0.95 | 0.88 | 0.88 | 0.81 | 0.95 | 0.89 |
| SEM | 0.01 | 0.01 | 0.00 | 0.02 | 0.03 | 0.02 | 0.03 | 0.03 | 0.05 | 0.06 | 0.03 | 0.07 | 0.07 | 0.03 | 0.04 | 0.02 | 0.05 | 0.04 | 0.05 | |
| CI (95%) | 0.95 0.99 | 0.93 0.99 | 0.81 0.98 | 0.95 0.99 | 0.91 0.99 | 0.84 0.94 | 0.92 0.99 | 0.88 0.99 | 0.91 0.99 | 0.87 0.99 | 0.84 0.98 | 0.76 0.98 | 0.81 0.98 | 0.87 0.98 | 0.70 0.96 | 0.69 0.96 | 0.52 0.94 | 0.87 0.99 | 0.70 0.97 | |
| Inter-day | ICC (3,1) | 0.66 | 0.62 | 0.54 | 0.09 | 0.43 | 0.48 | 0.83 | 0.24 | 0.13 | 0 | 0.09 | 0.42 | 0.30 | 0.63 | 0.29 | 0 | 0.26 | 0.38 | 0.19 |
| SEM | 0.03 | 0.02 | 0.01 | 0.07 | 0.10 | 0.03 | 0.04 | 0.09 | 0.15 | 0.20 | 0.08 | 0.18 | 0.11 | 0.06 | 0.08 | 0.07 | 0.07 | 0.09 | 0.09 | |
| CI (95%) | 0.14 0.90 | 0.07 0.88 | 0.06 0.85 | −0.52 0.63 | −0.19 0.81 | −0.13 0.83 | 0.49 0.95 | −0.39 0.72 | −0.51 0.68 | −0.69 0.44 | −0.51 0.64 | −0.24 0.82 | −0.34 0.75 | 0.08 0.88 | −0.34 0.74 | −0.72 0.38 | −0.37 0.73 | −0.25 0.79 | −0.43 0.69 | |
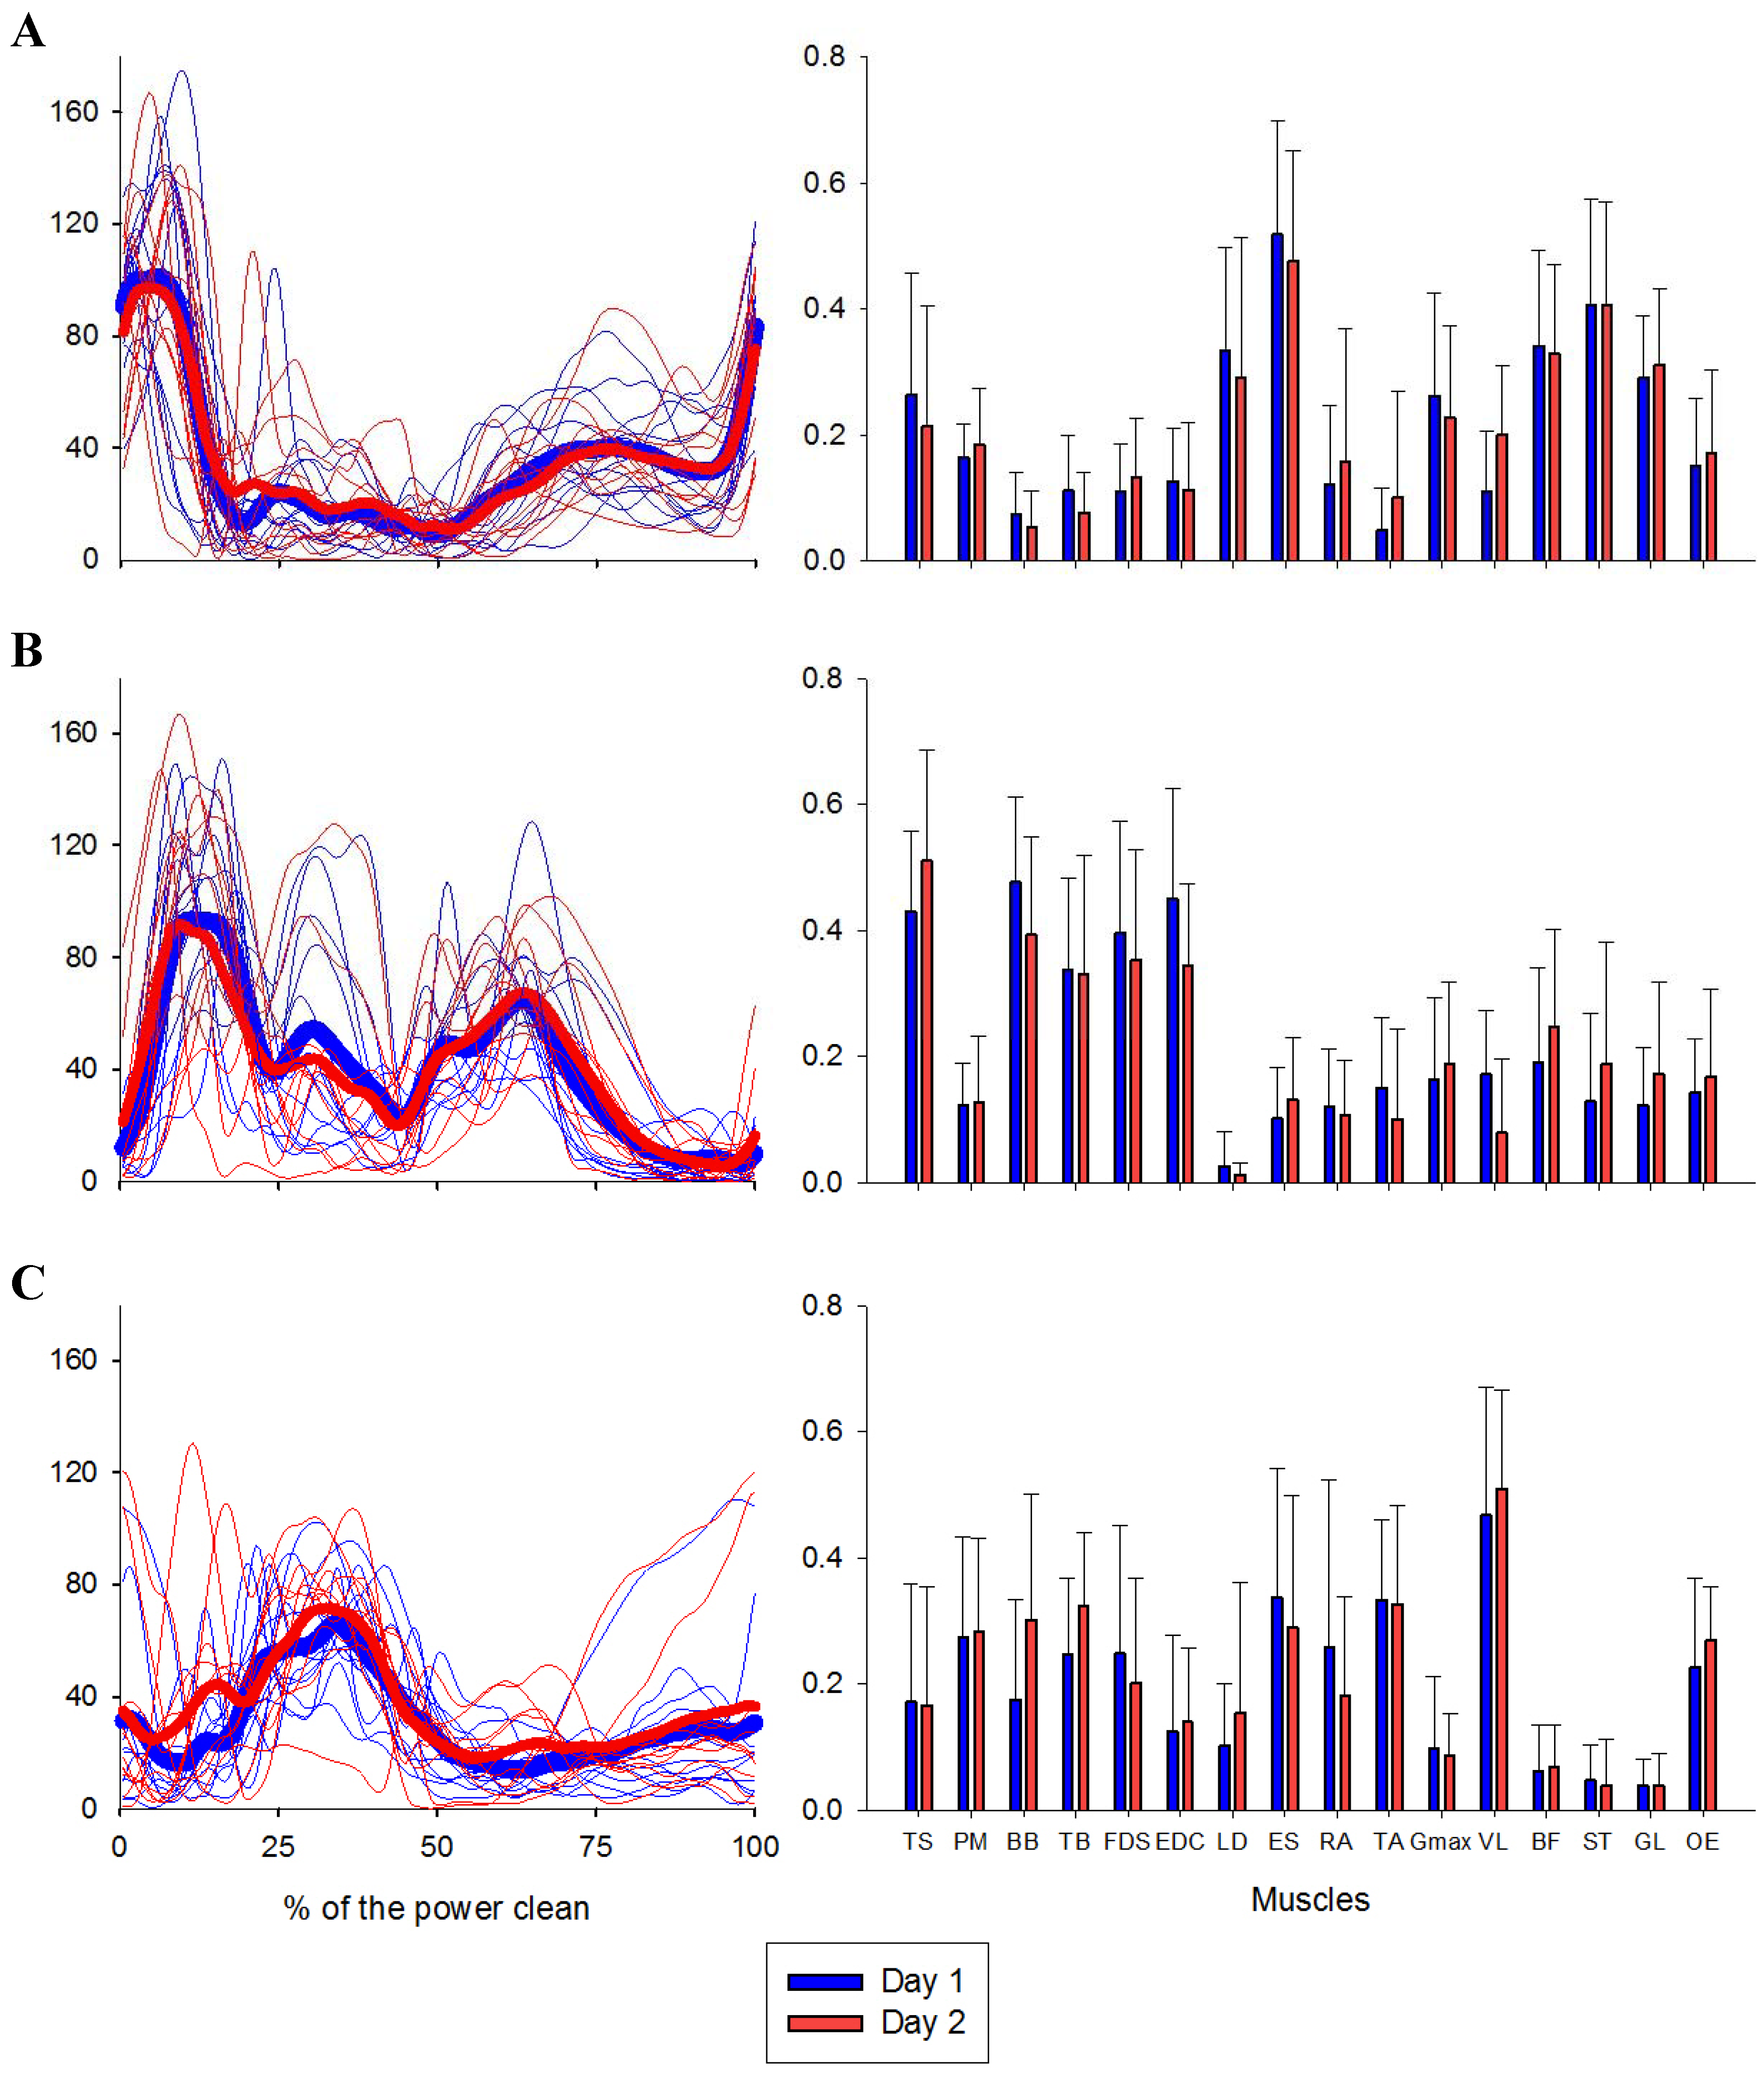
| Intra-Day | Day 1 | Intra-Day | Day 2 | Inter-Day | ||||||||||
|---|---|---|---|---|---|---|---|---|---|---|---|---|
| % lag | p | d | rmax | % lag | p | d | rmax | % lag | p | d | rmax | |
| Individual EMG Profiles | ||||||||||||
| TS | −0.22 ± 0.46 | 0.05 | −0.58 | 0.98 ± 0.01 | −0.33 ± 0.47 | 0.04 | −0.61 | 0.98 ± 0.01 | −0.22 ± 0.64 | 0.30 | −0.33 | 0.94 ± 0.02 |
| PM | −0.19 ± 0.33 | 0.03 | −0.63 | 0.96 ± 0.03 | −0.21 ± 0.30 | 0.04 | −0.61 | 0.98 ± 0.01 | −0.21 ± 0.63 | 0.21 | −0.38 | 0.90 ± 0.08 |
| BB | −0.30 ± 0.45 | 0.05 | −0.63 | 0.98 ± 0.00 | −0.37 ± 0.40 | 0.02 | −0.88 | 0.99 ± 0.01 | 0.09 ± 0.61 | 0.65 | 0.14 | 0.95 ± 0.04 |
| TB | −0.18 ± 0.48 | 0.24 | −0.36 | 0.98 ± 0.01 | −0.22 ± 0.42 | 0.13 | −0.50 | 0.98 ± 0.01 | 0.29 ± 0.76 | 0.26 | 0.36 | 0.95 ± 0.02 |
| FDS | −0.18 ± 0.45 | 0.21 | −0.39 | 0.98 ± 0.01 | −0.33 ± 0.60 | 0.12 | −0.52 | 0.98 ± 0.02 | −0.59 ± 1.65 | 0.44 | −0.23 | 0.93 ± 0.05 |
| EDC | −0.19 ± 0.38 | 0.21 | −0.40 | 0.98 ± 0.01 | −0.07 ± 0.30 | 0.53 | −0.20 | 0.97 ± 0.02 | 4.43 ± 9.05 | 0.05 | 0.58 | 0.92 ± 0.04 |
| LD | −0.01 ± 0.02 | 0.32 | −0.29 | 0.96 ± 0.02 | −0.06 ± 0.15 | 0.18 | −0.40 | 0.96 ± 0.02 | 1.86 ± 5.05 | 0.14 | 0.45 | 0.89 ± 0.08 |
| ES | 0.00 ± 0.00 | 1.00 | 0.00 | 0.98 ± 0.01 | 0.00 ± 0.00 | 1.00 | 0.00 | 0.98 ± 0.01 | 5.43 ± 17.16 | 0.32 | 0.30 | 0.96 ± 0.03 |
| RA | −0.30 ± 0.53 | 0.13 | −0.49 | 0.95 ± 0.02 | −0.02 ± 0.23 | 0.84 | −0.06 | 0.96 ± 0.02 | 7.30 ± 17.72 | 0.11 | 0.48 | 0.92 ± 0.04 |
| TA | −0.15 ± 0.76 | 0.54 | −0.18 | 0.97 ± 0.01 | −0.20 ± 040 | 0.15 | −0.47 | 0.96 ± 0.01 | 0.88 ± 1.74 | 0.14 | 0.48 | 0.93 ± 0.03 |
| Gmax | −0.06 ± 0.35 | 0.56 | −0.17 | 0.98 ± 0.01 | −0.08 ± 0.29 | 0.67 | −0.13 | 0.98 ± 0.01 | 0.05 ± 0.83 | 0.84 | 0.06 | 0.94 ± 0.05 |
| VL | −0.03 ± 0.17 | 0.71 | −0.11 | 0.99 ± 0.00 | −0.07 ± 0.13 | 0.11 | −0.48 | 0.99 ± 0.00 | 2.63 ± 8.67 | 0.89 | −0.04 | 0.97 ± 0.01 |
| BF | −6.87 ± 3.27 | <0.001 | −2.01 | 0.92 ± 0.03 | −8.80 ± 3.48 | <0.001 | −0.86 | 0.93 ± 0.02 | −0.12 ± 0.48 | 0.44 | −0.24 | 0.96 ± 0.02 |
| ST | −0.77 ± 0.94 | 0.03 | −0.75 | 0.94 ± 0.02 | −0.62 ± 0.71 | 0.02 | −0.83 | 0.94 ± 0.03 | 1.87 ± 5.74 | 0.80 | 0.08 | 0.95 ± 0.04 |
| GL | −6.45 ± 8.81 | 0.03 | −0.61 | 0.89 ± 0.01 | −5.16 ± 8.01 | 0.07 | −0.61 | 0.89 ± 0.02 | 1.22 ± 2.80 | 0.20 | 0.39 | 0.93 ± 0.05 |
| OE | −0.15 ± 0.43 | 0.29 | −0.32 | 0.97 ± 0.01 | −0.06 ± 0.21 | 0.42 | −0.26 | 0.97 ± 0.01 | 4.82 ± 14.15 | 0.12 | 0.47 | 0.93 ± 0.04 |
| Synergy Activation Coefficients | ||||||||||||
| #1 | −0.30 ± 0.85 | 0.11 | −0.46 | 0.97 ± 0.03 | 0.28 ± 1.45 | 0.71 | −0.11 | 0.95 ± 0.05 | 0.07 ± 1.12 | 0.69 | −0.12 | 0.87 ± 0.08 |
| #2 | 0.74 ± 4.35 | 0.05 | −0.58 | 0.97 ± 0.02 | −0.37 ± 0.78 | 0.17 | −0.45 | 0.97 ± 0.02 | −0.92 ± 2.26 | 0.07 | −0.54 | 0.90 ± 0.06 |
| #3 | −1.53 ± 4.76 | 0.37 | −0.26 | 0.93 ± 0.05 | −1.56 ± 3.26 | 0.08 | −0.54 | 0.96 ± 0.04 | −1.32 ± 16.92 | 0.14 | −0.45 | 0.87 ± 0.08 |
| Intra-Day | Inter-Day | ||
|---|---|---|---|
| Day 1 | Day 2 | ||
| Muscle Synergy Vectors | |||
| #1 | 0.84 ± 0.19 | 0.83 ± 0.24 | 0.56 ± 0.27 |
| #2 | 0.85 ± 0.20 | 0.87 ± 0.13 | 0.59 ± 0.25 |
| #3 | 0.74 ± 0.24 | 0.86 ± 0.20 | 0.50 ± 0.27 |
Publisher’s Note: MDPI stays neutral with regard to jurisdictional claims in published maps and institutional affiliations. |
© 2020 by the authors. Licensee MDPI, Basel, Switzerland. This article is an open access article distributed under the terms and conditions of the Creative Commons Attribution (CC BY) license (http://creativecommons.org/licenses/by/4.0/).
Share and Cite
Santos, P.D.G.; Vaz, J.R.; Correia, P.F.; Valamatos, M.J.; Veloso, A.P.; Pezarat-Correia, P. Muscle Synergies Reliability in the Power Clean Exercise. J. Funct. Morphol. Kinesiol. 2020, 5, 75. https://doi.org/10.3390/jfmk5040075
Santos PDG, Vaz JR, Correia PF, Valamatos MJ, Veloso AP, Pezarat-Correia P. Muscle Synergies Reliability in the Power Clean Exercise. Journal of Functional Morphology and Kinesiology. 2020; 5(4):75. https://doi.org/10.3390/jfmk5040075
Chicago/Turabian StyleSantos, Paulo D. G., João R. Vaz, Paulo F. Correia, Maria J. Valamatos, António P. Veloso, and Pedro Pezarat-Correia. 2020. "Muscle Synergies Reliability in the Power Clean Exercise" Journal of Functional Morphology and Kinesiology 5, no. 4: 75. https://doi.org/10.3390/jfmk5040075
APA StyleSantos, P. D. G., Vaz, J. R., Correia, P. F., Valamatos, M. J., Veloso, A. P., & Pezarat-Correia, P. (2020). Muscle Synergies Reliability in the Power Clean Exercise. Journal of Functional Morphology and Kinesiology, 5(4), 75. https://doi.org/10.3390/jfmk5040075