Evaluation of the Bourban Trunk Muscle Strength Test Based on Electromyographic Parameters


Abstract
:1. Introduction
2. Materials and Methods
2.1. Participants
2.2. Bourban Test
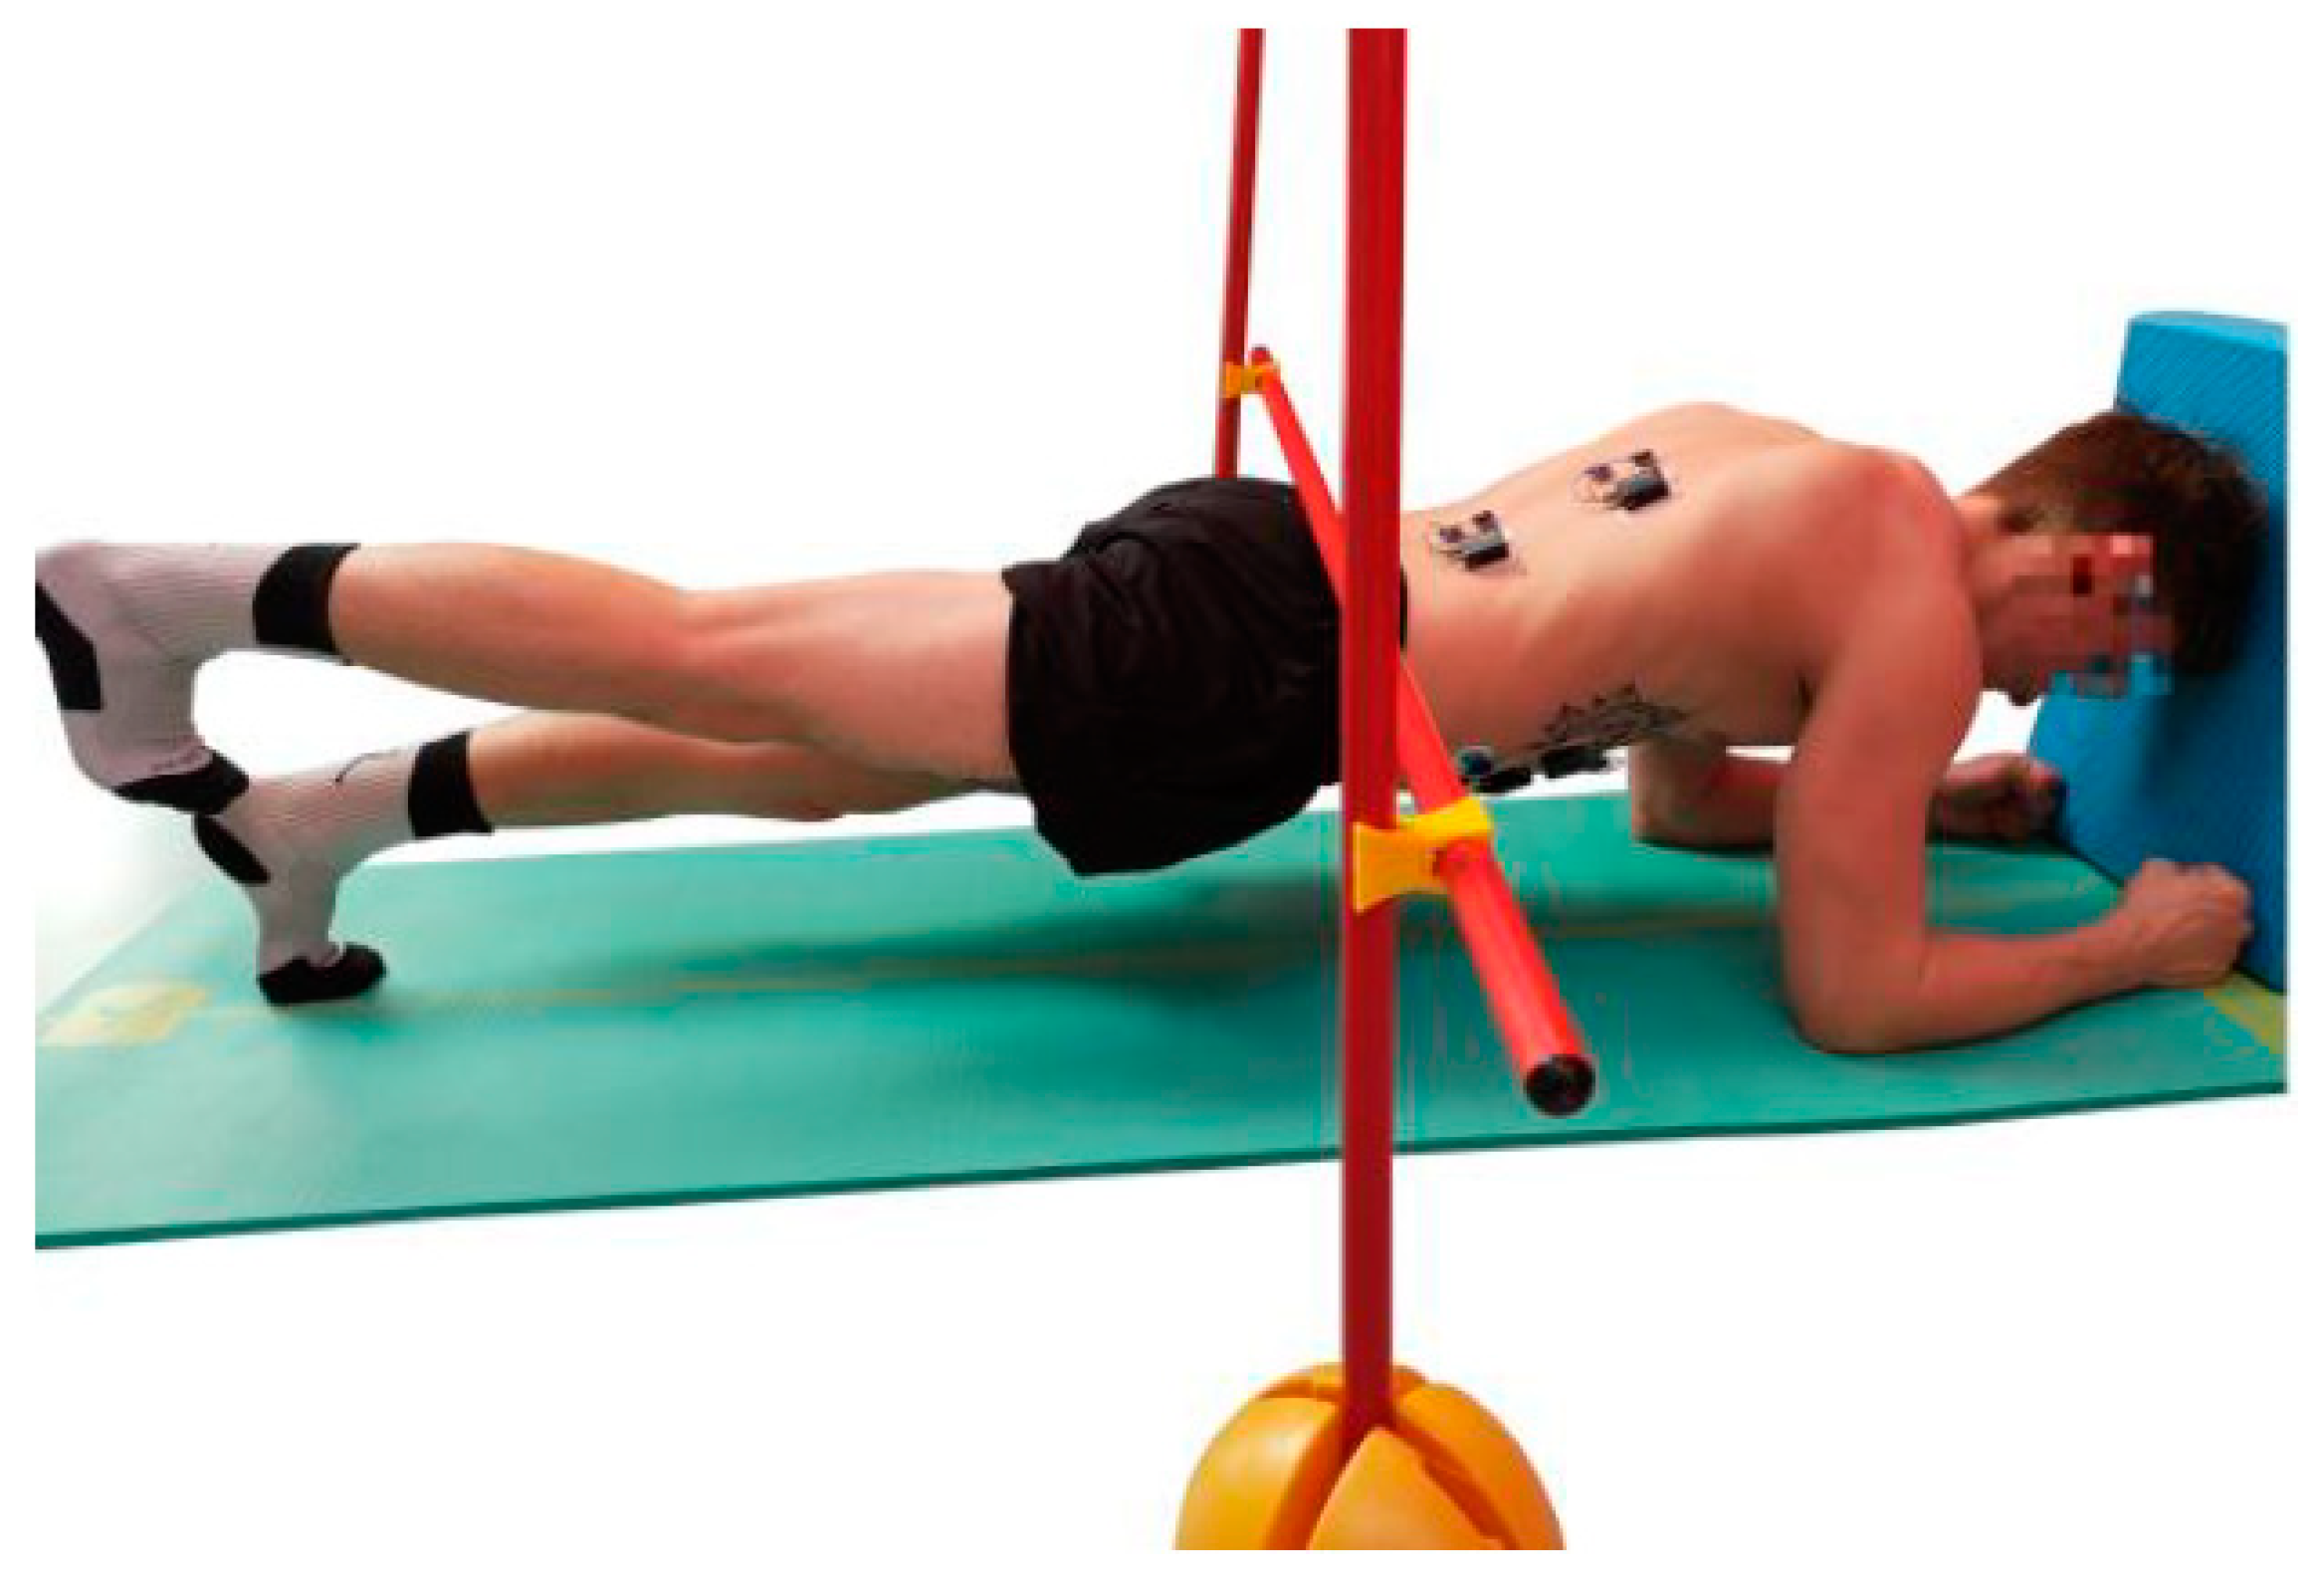
2.2.1. Ventral Muscle Chain
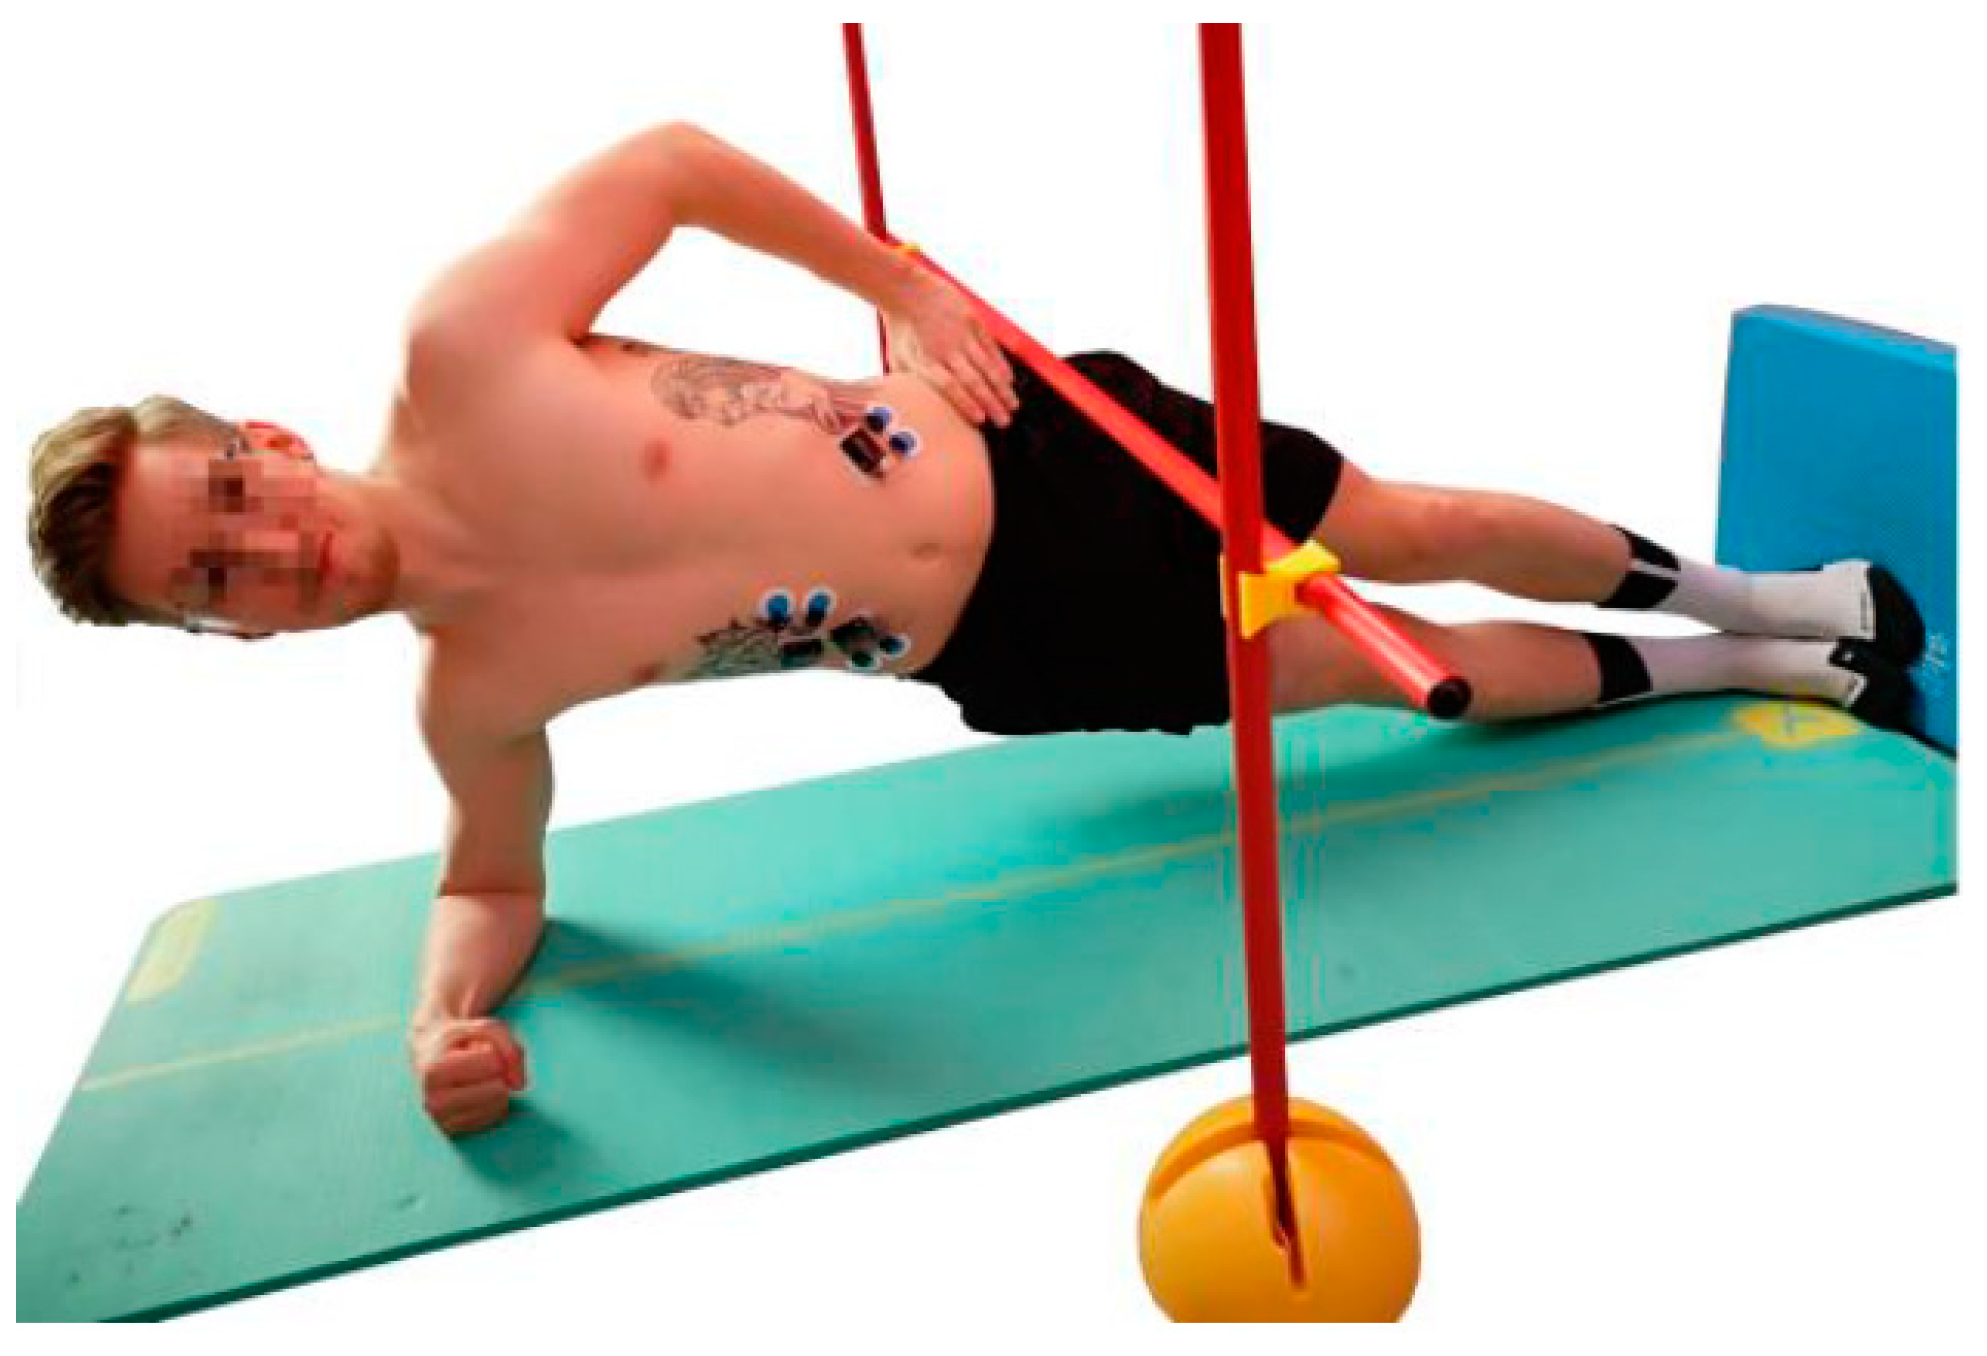
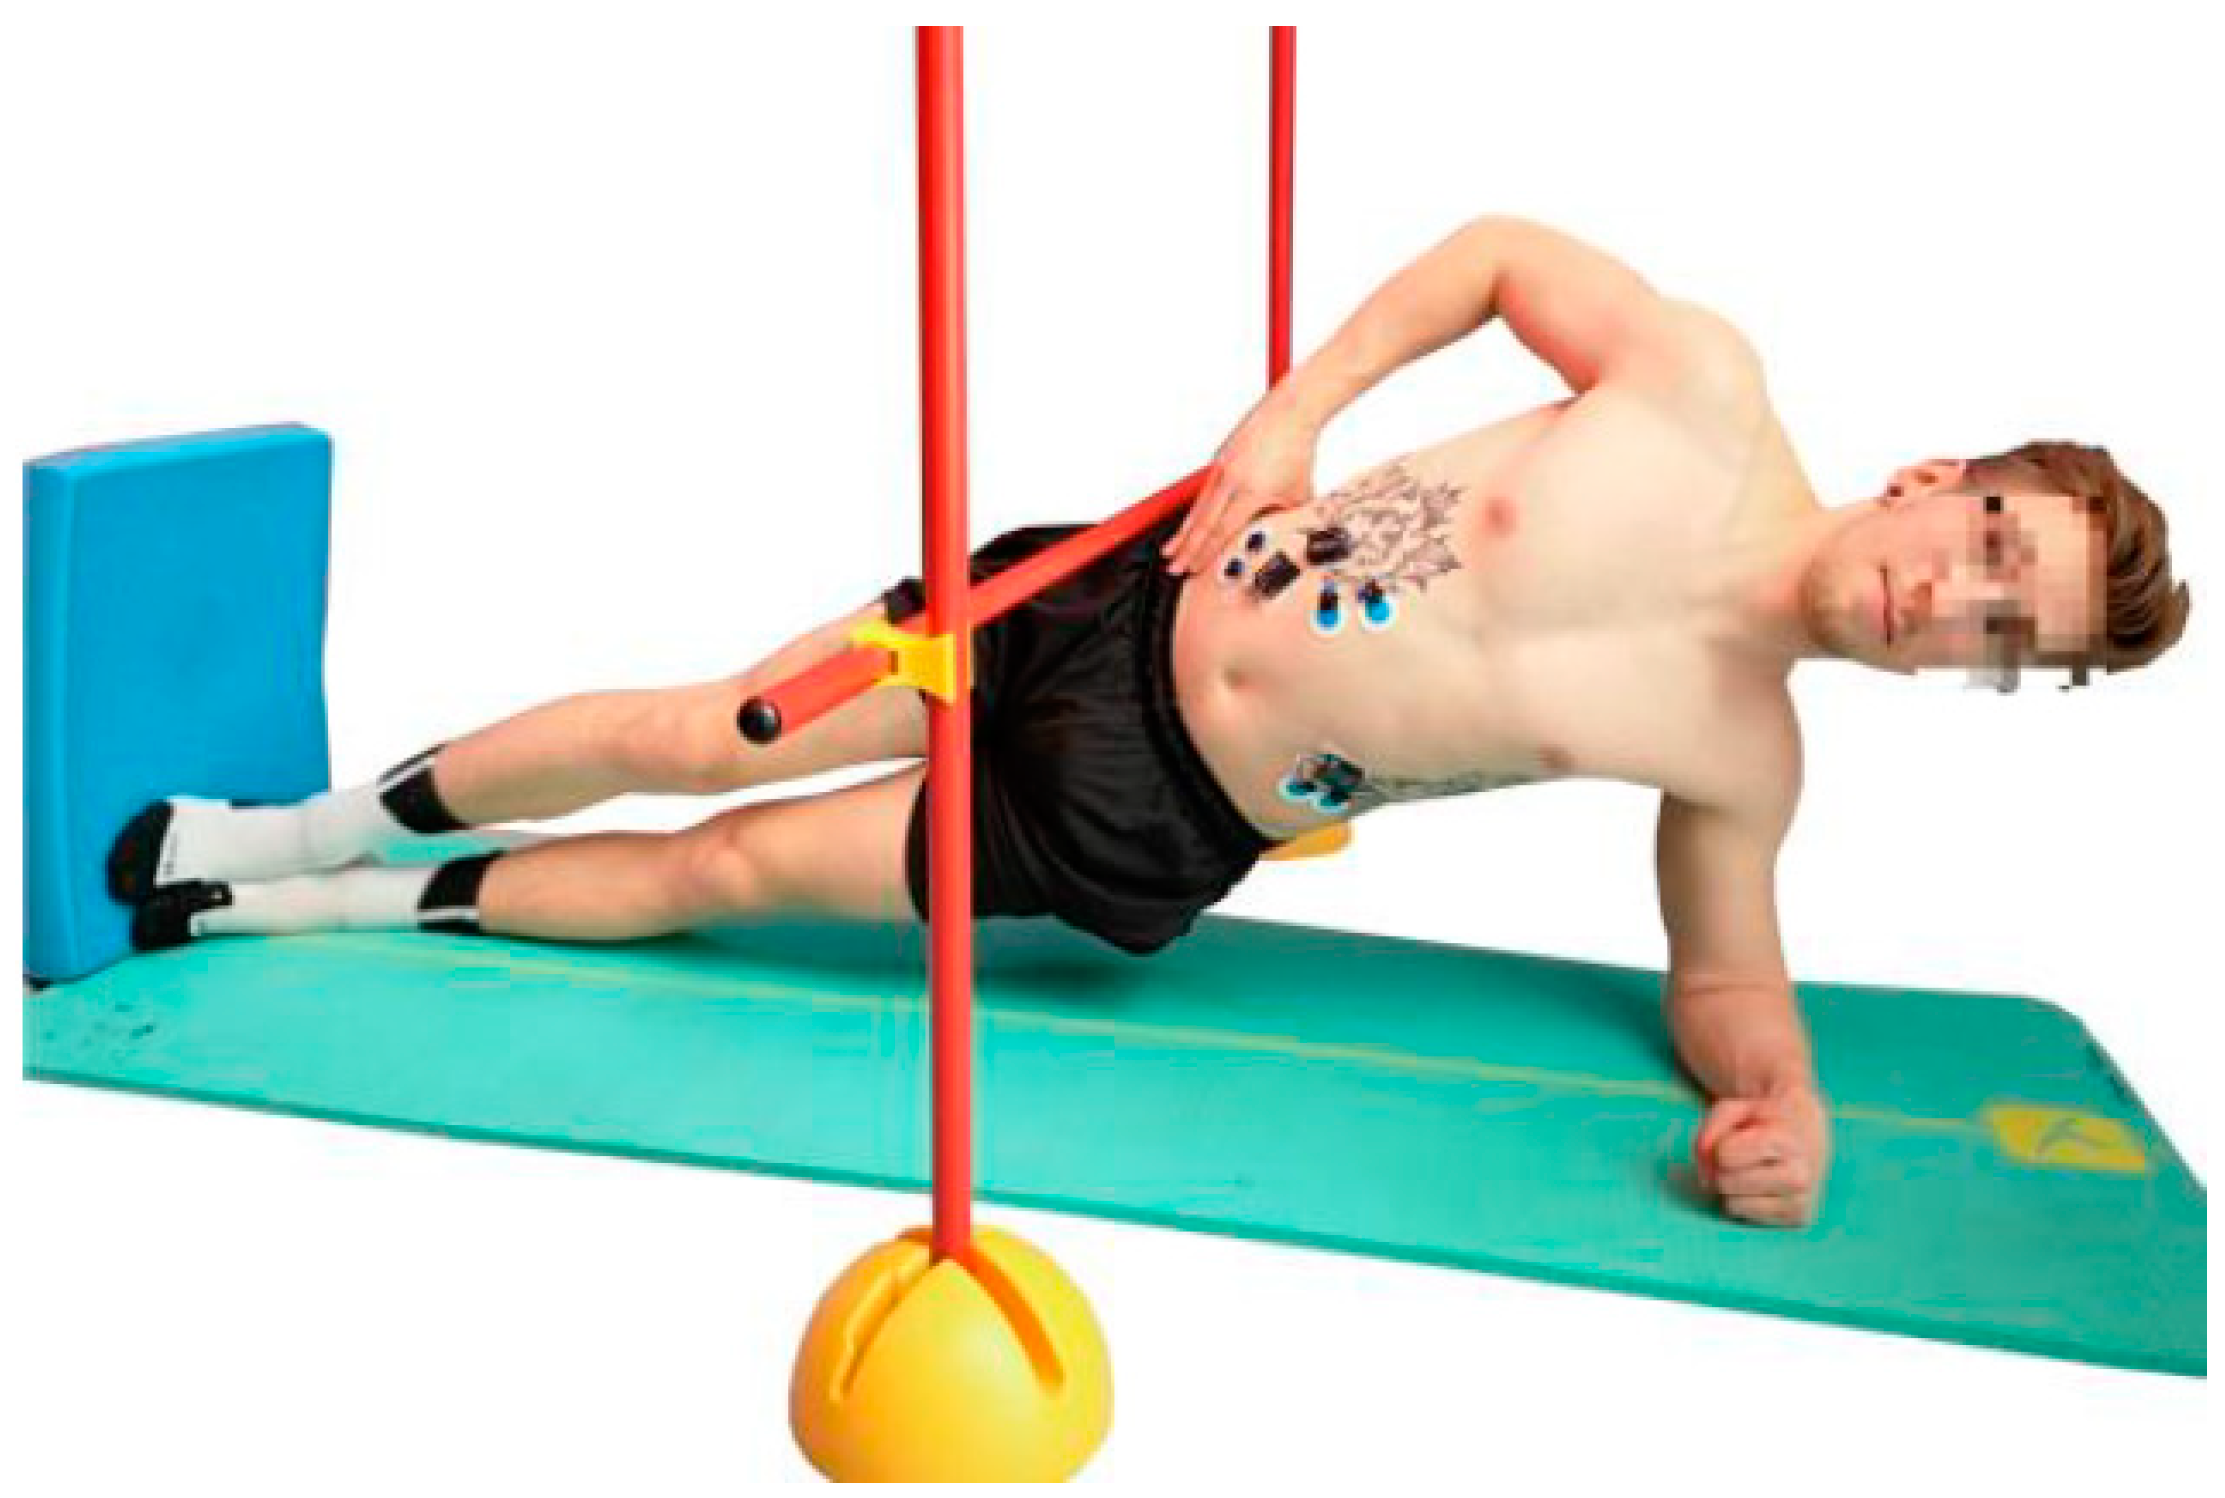
2.2.2. Lateral Muscle Chain
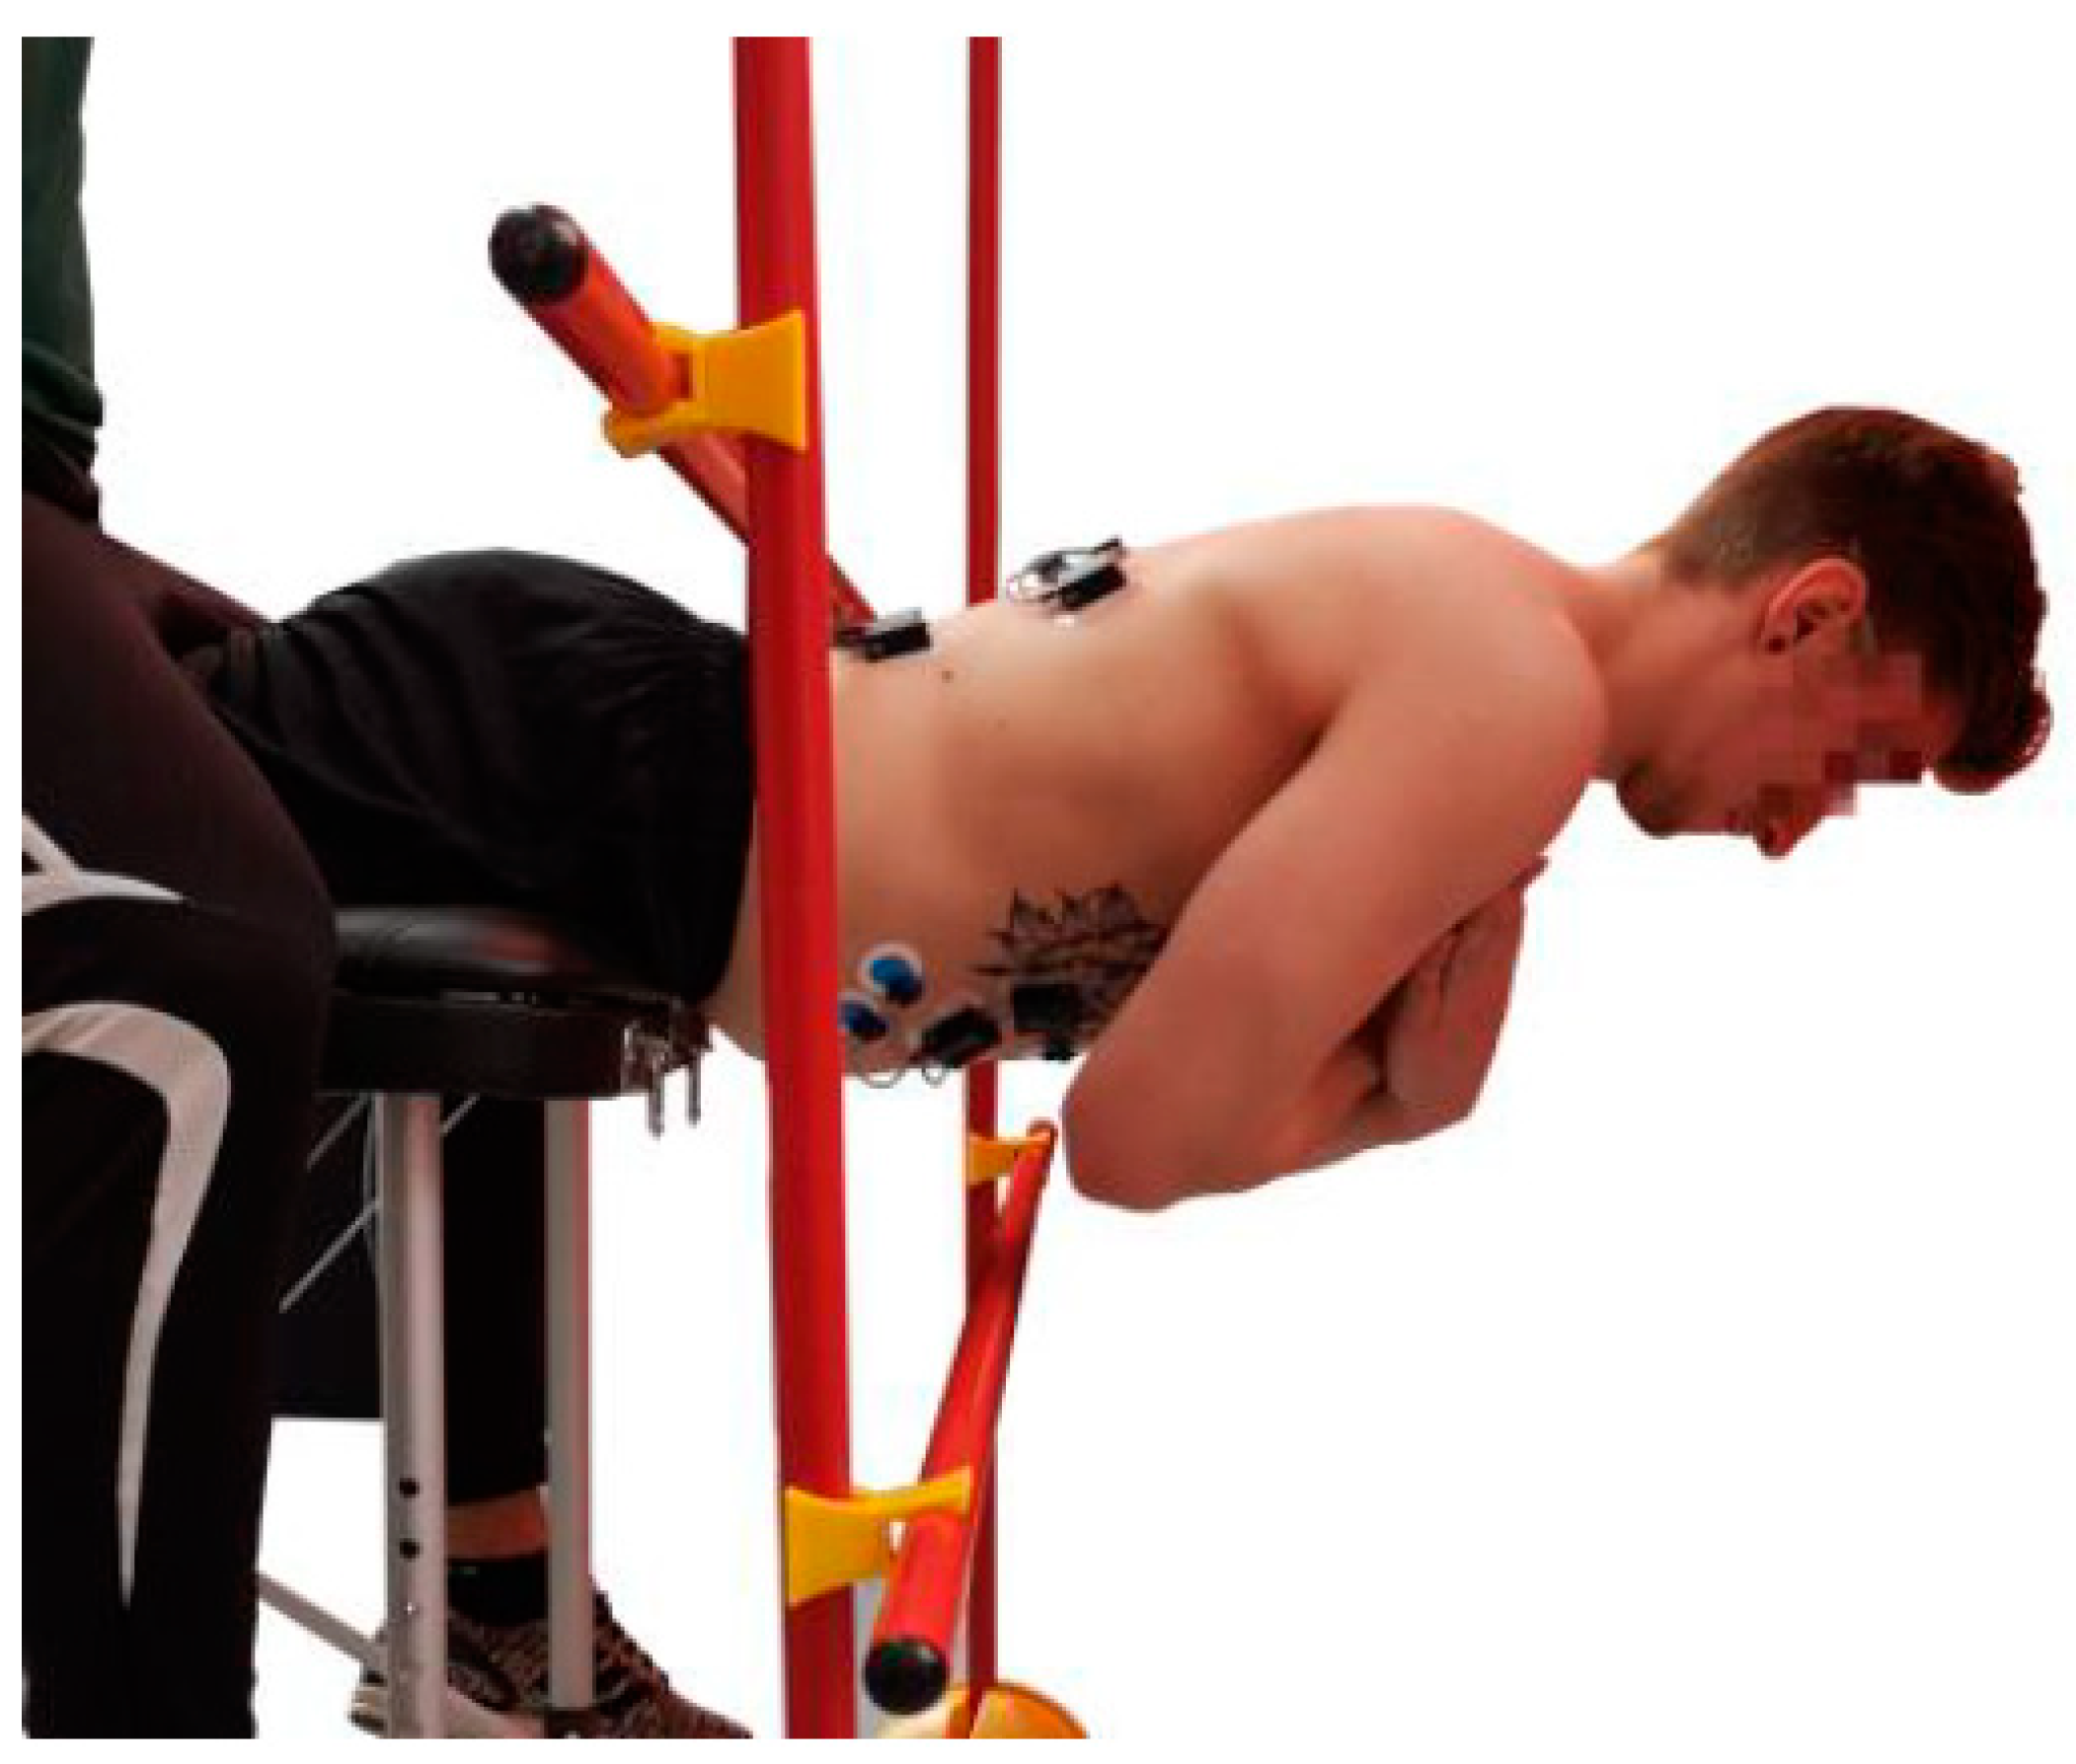
2.2.3. Dorsal Muscle Chain
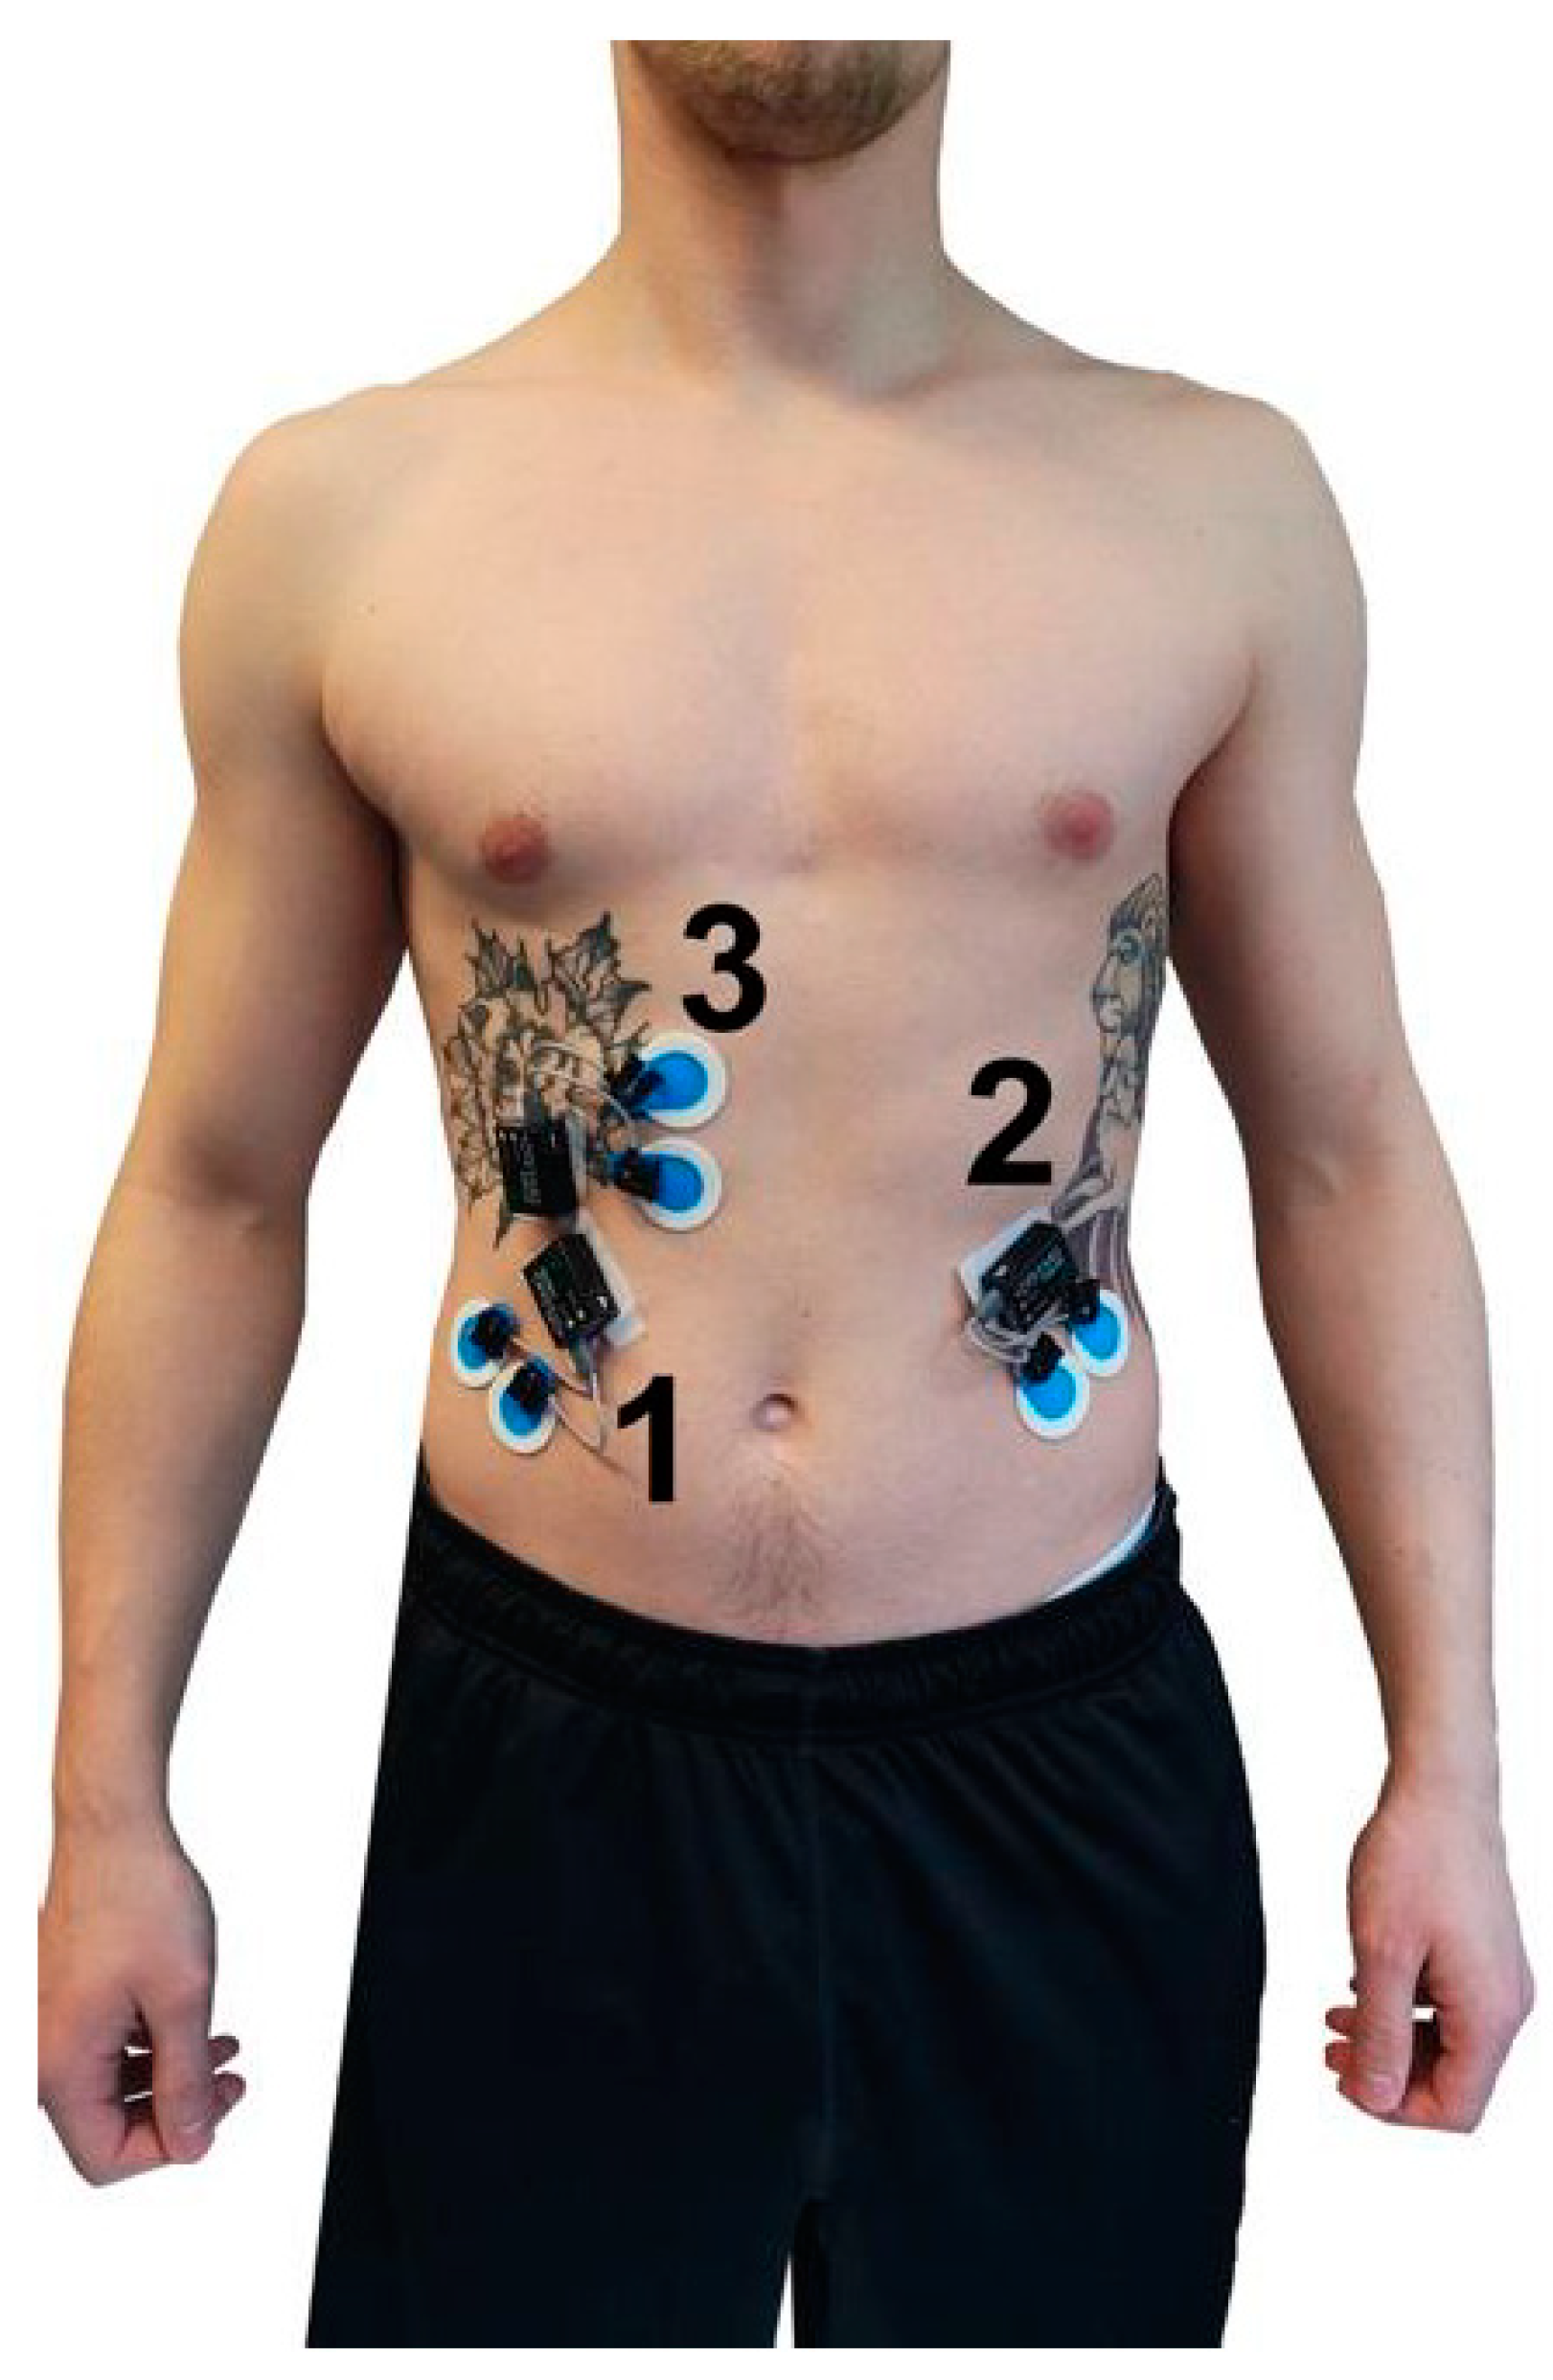
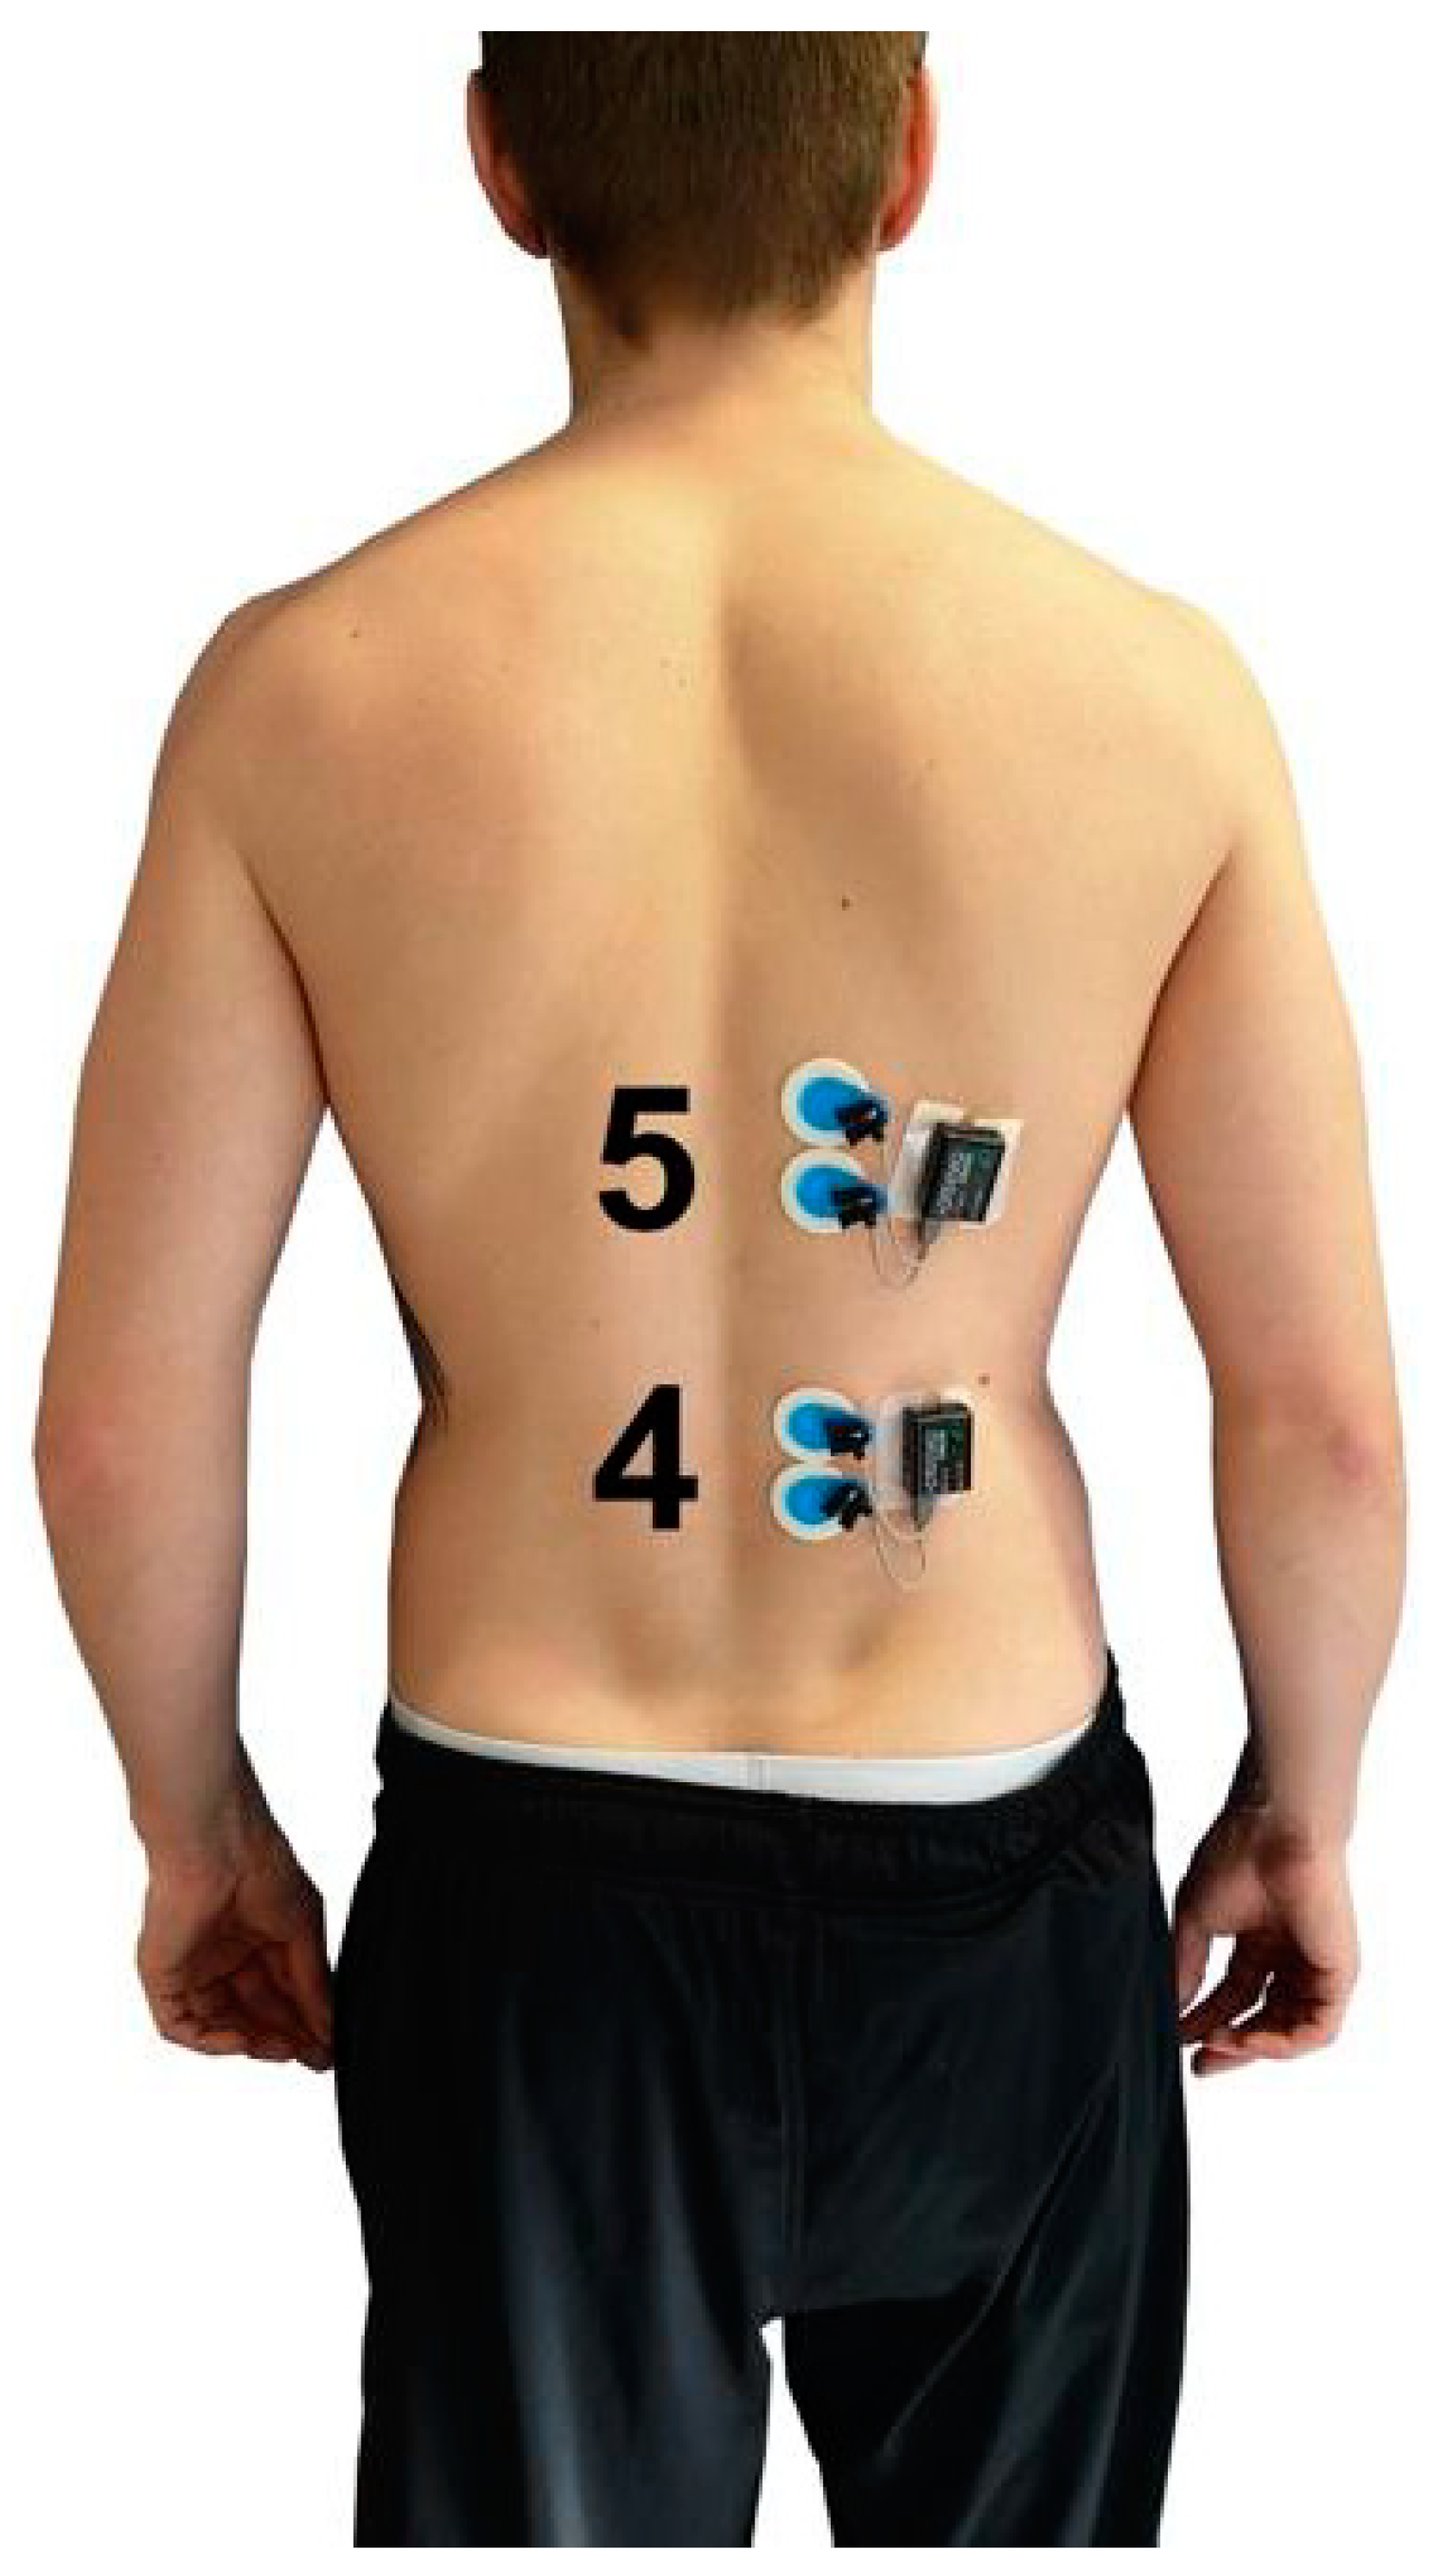
2.3. Myoelectrical Activity
2.4. Rate of Perceived Exertion (RPE) Scale
2.5. Statistics
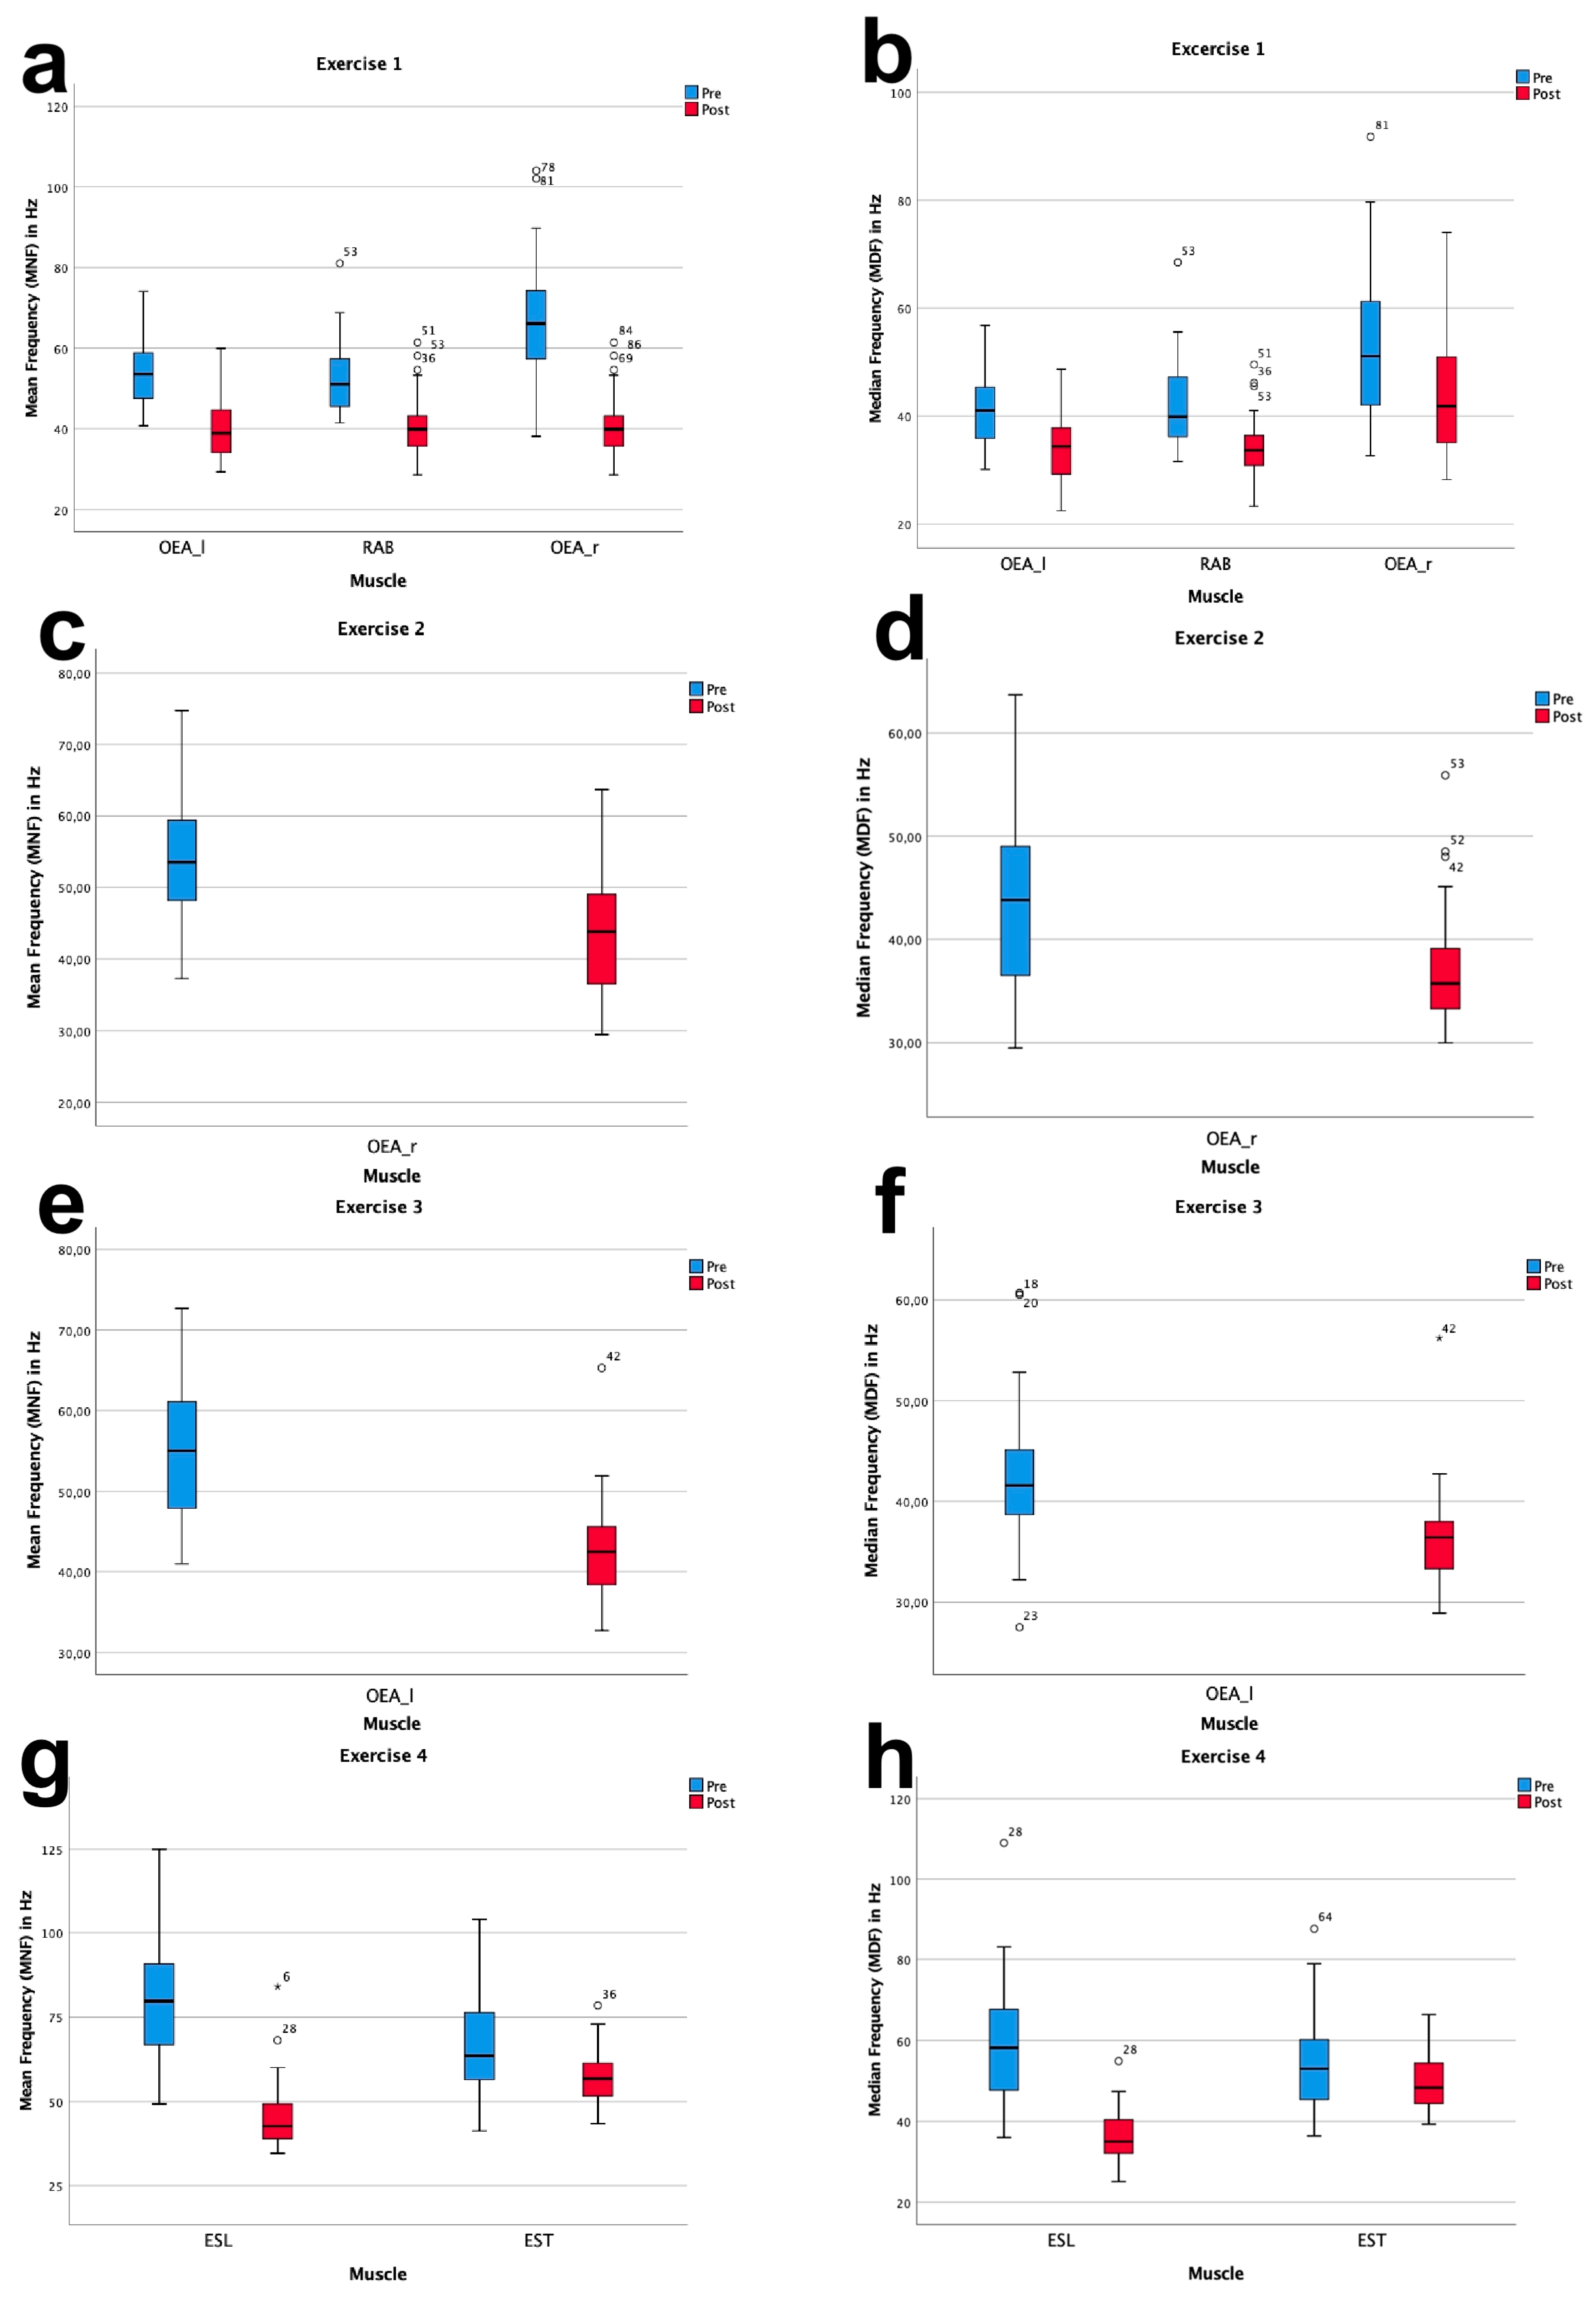
3. Results
4. Discussion
5. Conclusions
Author Contributions
Funding
Acknowledgments
Conflicts of Interest
References
- Kibler, W.B.; Press, J.; Sciascia, A. The role of core stability in athletic function. Sports Med. 2006, 36, 189–198. [Google Scholar] [CrossRef]
- Willardson, J.M. Core stability training: Applications to sports conditioning programs. J. Strength Cond. Res. 2007, 21, 979–985. [Google Scholar] [CrossRef]
- Sharrock, C.; Cropper, J.; Mostad, J.; Johnson, M.; Malone, T. A pilot study of core stablity and atheltic perfomance: Ist there a relationship? Int. J. Sports Phys.Ther. 2011, 6, 63–74. [Google Scholar]
- McGill, S.; Grenier, S.; Bluhm, M.; Preiss, R.; Brown, S.H.; Russell, C. Previous history of lbp with work loss is relatted to lingering deficits in biomechanical, physiological and motor control characteristics. Ergonomics 2003, 46, 731–746. [Google Scholar] [CrossRef]
- Granacher, U.; Schellbach, J.; Klein, K.; Prieske, O.; Baeyens, J.P.; Muehlbauer, T. Effects of core strength training using stable versus unstable surfaces on physical fitness in adolescents: A randomized controlled trial. BMC Sports Sci. Med. Rehabil. 2014, 6, 40. [Google Scholar] [CrossRef]
- Zemková, E.; Hamar, D. Sport-specific assessment of the effectiveness of neuromuscular training in young athletes. Front. Physiol. 2018, 9, 1–27. [Google Scholar] [CrossRef]
- Granacher, U. Effects of balance and resistance training in children, adolescents, and seniors. Sportwissenschaft 2012, 42, 17–29. [Google Scholar] [CrossRef]
- Gießing, J.; Fröhlich, M. A second look at the effectiveness and safety of strength training in children and adolescents. In Current Results of Strength Training Research. A Multi-Perspective Approach; Gießing, J., Fröhlich, M., Eds.; Cuvillier Verlag: Göttingen, Germany, 2008; Volume 2, pp. 119–127. [Google Scholar]
- Rabin, A.; Shashua, A.; Pizern, K.; Dickstein, R.; Dar, G. A clinical prediction rule to identify patients with low back pain who are likely to experience short-term success following lumbar sta- bilization exercises: A randomized controlled validation study. J. Orthop. Sports Phys. Ther. 2014, 44, 6–13. [Google Scholar] [CrossRef]
- Myer, G.D.; Chu, D.A.; Brent, J.L.; Hewett, T.E. Trunk and hip control neuromuscular training for the prevention of knee joint injury. Clin. Sports Med. 2008, 27, 425–448. [Google Scholar] [CrossRef]
- Okada, T.; Huxel, K.C.; Nesser, T.W. Relationship between core stability, functional movement, and performance. J. Strength Cond. Res. 2011, 25, 252–261. [Google Scholar] [CrossRef]
- Nesser, T.W.; Huxel, K.C.; Tincher, J.L.; Okada, T. The relationship between core stability and performance in division i football players. J. Strength Cond. Res. 2008, 22, 1750–1754. [Google Scholar] [CrossRef]
- Moreland, J.; Finch, E.; Stratford, P.; Balsor, B.; Gill, C. Interrater reliability of six tests of trunk muscle function and endurance. J. Orthop. Sports Phys. Ther. 1997, 26, 200–208. [Google Scholar] [CrossRef]
- Bourban, P.; Hubner, K.; Tschopp, M.; Marti, B. Basic requirements of trunk muscle strength in elite sport: Results of a set of 3 standardized trunk muscle strength test. Swiss J. Sports Med. Sports Traumatol. 2001, 49, 73–78. [Google Scholar]
- Büsch, D.; Meyer, G.; Wiegel, C.; Kurrat, H.; Braun, J.; Granacher, U. Importance, diagnostics and training of the local trunk muscle endurance in handball. Leistungssport 2016, 46, 30–35. [Google Scholar]
- Tschopp, M.; Bourban, P.; Hubner, K.; Marti, B. Reliability of a standardized, dynamic trunk muscle strength test: Experiences with healthy male elite athletes. Swiss J. Sports Med. Sports Traumatol. 2001, 49, 67–72. [Google Scholar]
- World Medical Association. World medical association declaration of helsinki: Ethical principles for medical research involving human subjects. J. Am. Med. Assoc. 2013, 310, 2191–2194. [Google Scholar] [CrossRef]
- Tschopp, M.; Hubner, K.; Bourban, P. Acceptance of new trunk muscle strength test in young top athletes and coaches. Swiss J. Sports Med. Sports Traumatol. 2001, 49, 176–177. [Google Scholar]
- Phinyomark, A.; Thongpanja, S.; Hu, H.; Phukpattaranont, P.; Limsakul, C. The usefulness of mean and median frequencies in electromyography analysis. In Computational Intelligence in Electromyography Analysis-A Perspective on Current Applications and Future Challenges; InTech: Rijeka, Croatia, 2012; pp. 195–220. [Google Scholar]
- Hermens, H.J.; Freriks, B.; Merletti, R.; Hägg, G.G.; Stegeman, D.; Blok, J.; Rau, G.; Disselhorst-Klug, C. Seniam 8. European Recommendations for Surface Electromyography; Roessingh Research and Development: Enschede, The Netherlands, 1999. [Google Scholar]
- Borg, G. Borg’s Perceived Exertion and Pain Scales; Human Kinetics: Champaign, IL, USA, 1998. [Google Scholar]
- Tong, T.K.; Wu, S.; Nie, J. Sport-specific endurance plank test for evaluation of global core muscle function. Phys. Ther. Sport 2014, 15, 58–63. [Google Scholar] [CrossRef]
- Willardson, J.M.; Behm, D.G.; Huang, S.Y.; Rehg, M.D.; Kattenbraker, M.S.; Fontana, F.E. A comparison of trunk muscle activation: Ab circle vs. Traditional modalities. J. Strength Cond. Res. 2010, 24, 3415–3421. [Google Scholar] [CrossRef]
- Yoshitake, Y.; Ue, H.; Miyazaki, M.; Morotani, T. Assessment of lower-back muscle fatigue using electromyography, mechanomyography, and near-infrared spectroscopy. Eur. J. Appl. Physiol. 2001, 84, 174–179. [Google Scholar] [CrossRef]
- Alaranta, H.; Hurri, H.; Heliövaara, M.; Soukka, A.; Harju, R. Non-dynamometric trunk performance tests: Realiability and normative data. Scand. J. Rehabil. Med. 1994, 26, 211–215. [Google Scholar]
- Moffroid, M.; Reid, S.; Herny, S.H.; Haugh, L.D.; Ricamato, A. Some endurance measures in persons with chronic low back pain. J. Orthop. Sports Phys. Ther. 1994, 20, 81–87. [Google Scholar] [CrossRef]
- Spring, H.; Kunz, H.-R.; Schneider, W.; Tritschler, T.; Unold, E. Testing of strength endurance. In Strength Training: In Theory and Practice; Kunz, H.-R., Schneider, W., Spring, H., Eds.; Thieme: Stuttgart, Germany, 1990; pp. 26–47. [Google Scholar]
- Nikolenko, M.; Brown, L.E.; Coburn, J.W.; Spiering, B.A.; Tran, T.T. Relationship between core power and measures of sport performance. Kinesiology 2011, 43, 163–168. [Google Scholar]
- Matheson, L.; Mooney, V.; Caiozzo, V.; Jarvis, G.; Pottinger, J.; DeBerry, C.; Backlund, K.; Klein, K.; Antoni, J. Effect of instructions on isokinetic trunk strength testing variability, reliablity, absolute value, and predictive validity. Spine 1992, 17, 914–921. [Google Scholar] [CrossRef]
- Park, H.J.; Oh, D.W.; Kim, S.Y. Effects of integrating hip movements into bridge exercises on electromyographic activities of selected trunk muscles in healthy individuals. Man. Ther. 2014, 19, 246–251. [Google Scholar] [CrossRef]
- Hoppe, M.W.; Freiwald, J.; Baumgart, C.; Born, D.-P.; Reed, J.L.; Sperlich, B. Relationship between core strength and key variables of performance in elite rink hockey players. J. Sports Med. Phys. Fit. 2015, 55, 150–157. [Google Scholar]
- Lee, J.; Jeong, K.; Lee, H.; Shin, J.; Choi, J.; Kang, S.; Lee, B.-H. Comparison of three different surface plank exercises on core muscle activity. Phys. Ther.Rehabil. Sci. 2015, 5, 29–33. [Google Scholar] [CrossRef]
- Andersson, E.A.; Nilsson, J.; Ma, Z.; Thorstensson, A. Abdominal and hip flexor muscle activation during various training exercises. Eur. J. Appl. Physiol. Occup. Physiol. 1997, 75, 115–123. [Google Scholar] [CrossRef]
- Escamilla, R.F.; Lewis, C.; Pecson, A.; Imamura, R.; Andrews, J.R. Muscle activation among supine, prone, and side position exercises with and without a swiss ball. Sports Health 2016, 8, 372–379. [Google Scholar] [CrossRef]
- Oliver, G.D.; Dwelly, P.M.; Sarantis, N.D.; Helmer, R.A.; Bonacci, J.A. Muscle activation of different core exercises. J. Strength Cond. Res. 2010, 24, 3069–3074. [Google Scholar] [CrossRef]


| Exercise | Muscle |
|---|---|
| Ex.1: ventral muscle chain | M. obliquus externus abdominis right-side (OEA_r) M. obliquus externs abdominis left-side (OEA_l) M. rectus abdominis (RAB) |
| Ex.2: lateral muscle chain (right-side) | M. obliquus externus abdominis right-side (OEA_r) |
| Ex.3: lateral muscle chain (left-side) | M. obliquus externus abdominis left-side (OEA_l) |
| Ex.4: dorsal muscle chain | M. erector spinae lumbalis (ESL) M. erector spinae thoracalis (EST) |
| Ex. | Parameter | Pre ± SD | CI | N | Post ± SD | CI | T | df | p | d |
|---|---|---|---|---|---|---|---|---|---|---|
| 1 | OEA_r MNF | 52.6 ± 8.8 | 49.4–55.7 | 33 | 40.7 ± 7.7 | 38.0–43.4 | 9.583 | 32 | 0.000 | 1.7 |
| OEA_r MDF | 41.7 ± 8.0 | 38.8–44.5 | 33 | 34.2 ± 5.9 | 32.2–36.3 | 6.705 | 32 | 0.000 | 1.2 | |
| OEA_l MNF | 53.9 ± 8.1 | 51.0–56.8 | 33 | 40.5 ± 7.7 | 37.5–43.4 | 10.027 | 32 | 0.000 | 1.7 | |
| OEA_l MDF | 41.7 ± 6.7 | 39.3–44.0 | 33 | 33.9 ± 6.4 | 31.6–36.1 | 6.756 | 32 | 0.000 | 1.2 | |
| RAB MNF | 66.3 ± 15.6 | 60.8–71.8 | 33 | 55.3 ± 14.1 | 50.3–60.3 | 4.278 | 32 | 0.000 | 0.7 | |
| RAB MDF | 53.4 ± 18.8 | 48.6–58.3 | 33 | 44.6 ± 11.4 | 40.6–48.7 | 3.726 | 32 | 0.001 | 0.6 | |
| 2 | OEA_r MNF | 54.7 ± 10.0 | 51.1–58.3 | 33 | 42.9 ± 7.6 | 40.3–45.6 | 7.614 | 32 | 0.000 | 1.3 |
| OEA_r MDF | 44.3 ± 9.1 | 41.0–47.5 | 33 | 37.0 ± 6.0 | 34.9–39.1 | 4.518 | 32 | 0.000 | 0.8 | |
| 3 | OEA_l MNF | 54.8 ± 8.7 | 51.7–57.9 | 33 | 42.5 ± 6.6 | 40.2–44.9 | 8.514 | 32 | 0.000 | 1.5 |
| OEA_l MDF | 42.2 ± 7.5 | 39.6–44.9 | 33 | 36.3 ± 5.1 | 34.5–38.1 | 4.571 | 32 | 0.000 | 0.8 | |
| 4 | ESL MNF | 80.8 ± 19.08 | 74.0–87.6 | 33 | 45.4 ± 10.5 | 41.6–49.1 | 10.866 | 32 | 0.000 | 1.9 |
| ESL MDF | 59.3 ± 10.5 | 53.6–65.1 | 33 | 36.2 ± 6.3 | 34.0–38.4 | 8.784 | 32 | 0.000 | 1.5 | |
| EST MNF | 65.6 ± 14.0 | 60.6–70.6 | 33 | 57.1 ± 8.2 | 54.3–60.0 | 4.561 | 32 | 0.000 | 0.8 | |
| EST MDF | 55.0 ± 12.6 | 50.5–59.4 | 33 | 49.8 ± 7.3 | 47.2–52.4 | 3.012 | 32 | 0.005 | 0.5 |
| Exercise | Duration in s | RPE Scale |
|---|---|---|
| 1 | 151.2 ± 49.2 | 16.9 ± 1.7 |
| 2 | 62.0 ± 18.0 | 16.6 ± 2.3 |
| 3 | 64.9 ± 20.2 | 16.8 ± 1.9 |
| 4 | 86.6 ± 20.07 | 17.0 ± 1.8 |
© 2019 by the authors. Licensee MDPI, Basel, Switzerland. This article is an open access article distributed under the terms and conditions of the Creative Commons Attribution (CC BY) license (http://creativecommons.org/licenses/by/4.0/).
Share and Cite
Becker, S.; Berger, J.; Backfisch, M.; Ludwig, O.; Fröhlich, M. Evaluation of the Bourban Trunk Muscle Strength Test Based on Electromyographic Parameters. J. Funct. Morphol. Kinesiol. 2019, 4, 35. https://doi.org/10.3390/jfmk4020035
Becker S, Berger J, Backfisch M, Ludwig O, Fröhlich M. Evaluation of the Bourban Trunk Muscle Strength Test Based on Electromyographic Parameters. Journal of Functional Morphology and Kinesiology. 2019; 4(2):35. https://doi.org/10.3390/jfmk4020035
Chicago/Turabian StyleBecker, Stephan, Joshua Berger, Marco Backfisch, Oliver Ludwig, and Michael Fröhlich. 2019. "Evaluation of the Bourban Trunk Muscle Strength Test Based on Electromyographic Parameters" Journal of Functional Morphology and Kinesiology 4, no. 2: 35. https://doi.org/10.3390/jfmk4020035
APA StyleBecker, S., Berger, J., Backfisch, M., Ludwig, O., & Fröhlich, M. (2019). Evaluation of the Bourban Trunk Muscle Strength Test Based on Electromyographic Parameters. Journal of Functional Morphology and Kinesiology, 4(2), 35. https://doi.org/10.3390/jfmk4020035