Physical Fitness Evaluation of School Children in Southern Italy: A Cross Sectional Evaluation


Abstract
1. Introduction
2. Materials and Methods
2.1. Participants
2.2. Methods
2.3. Statistical Analysis
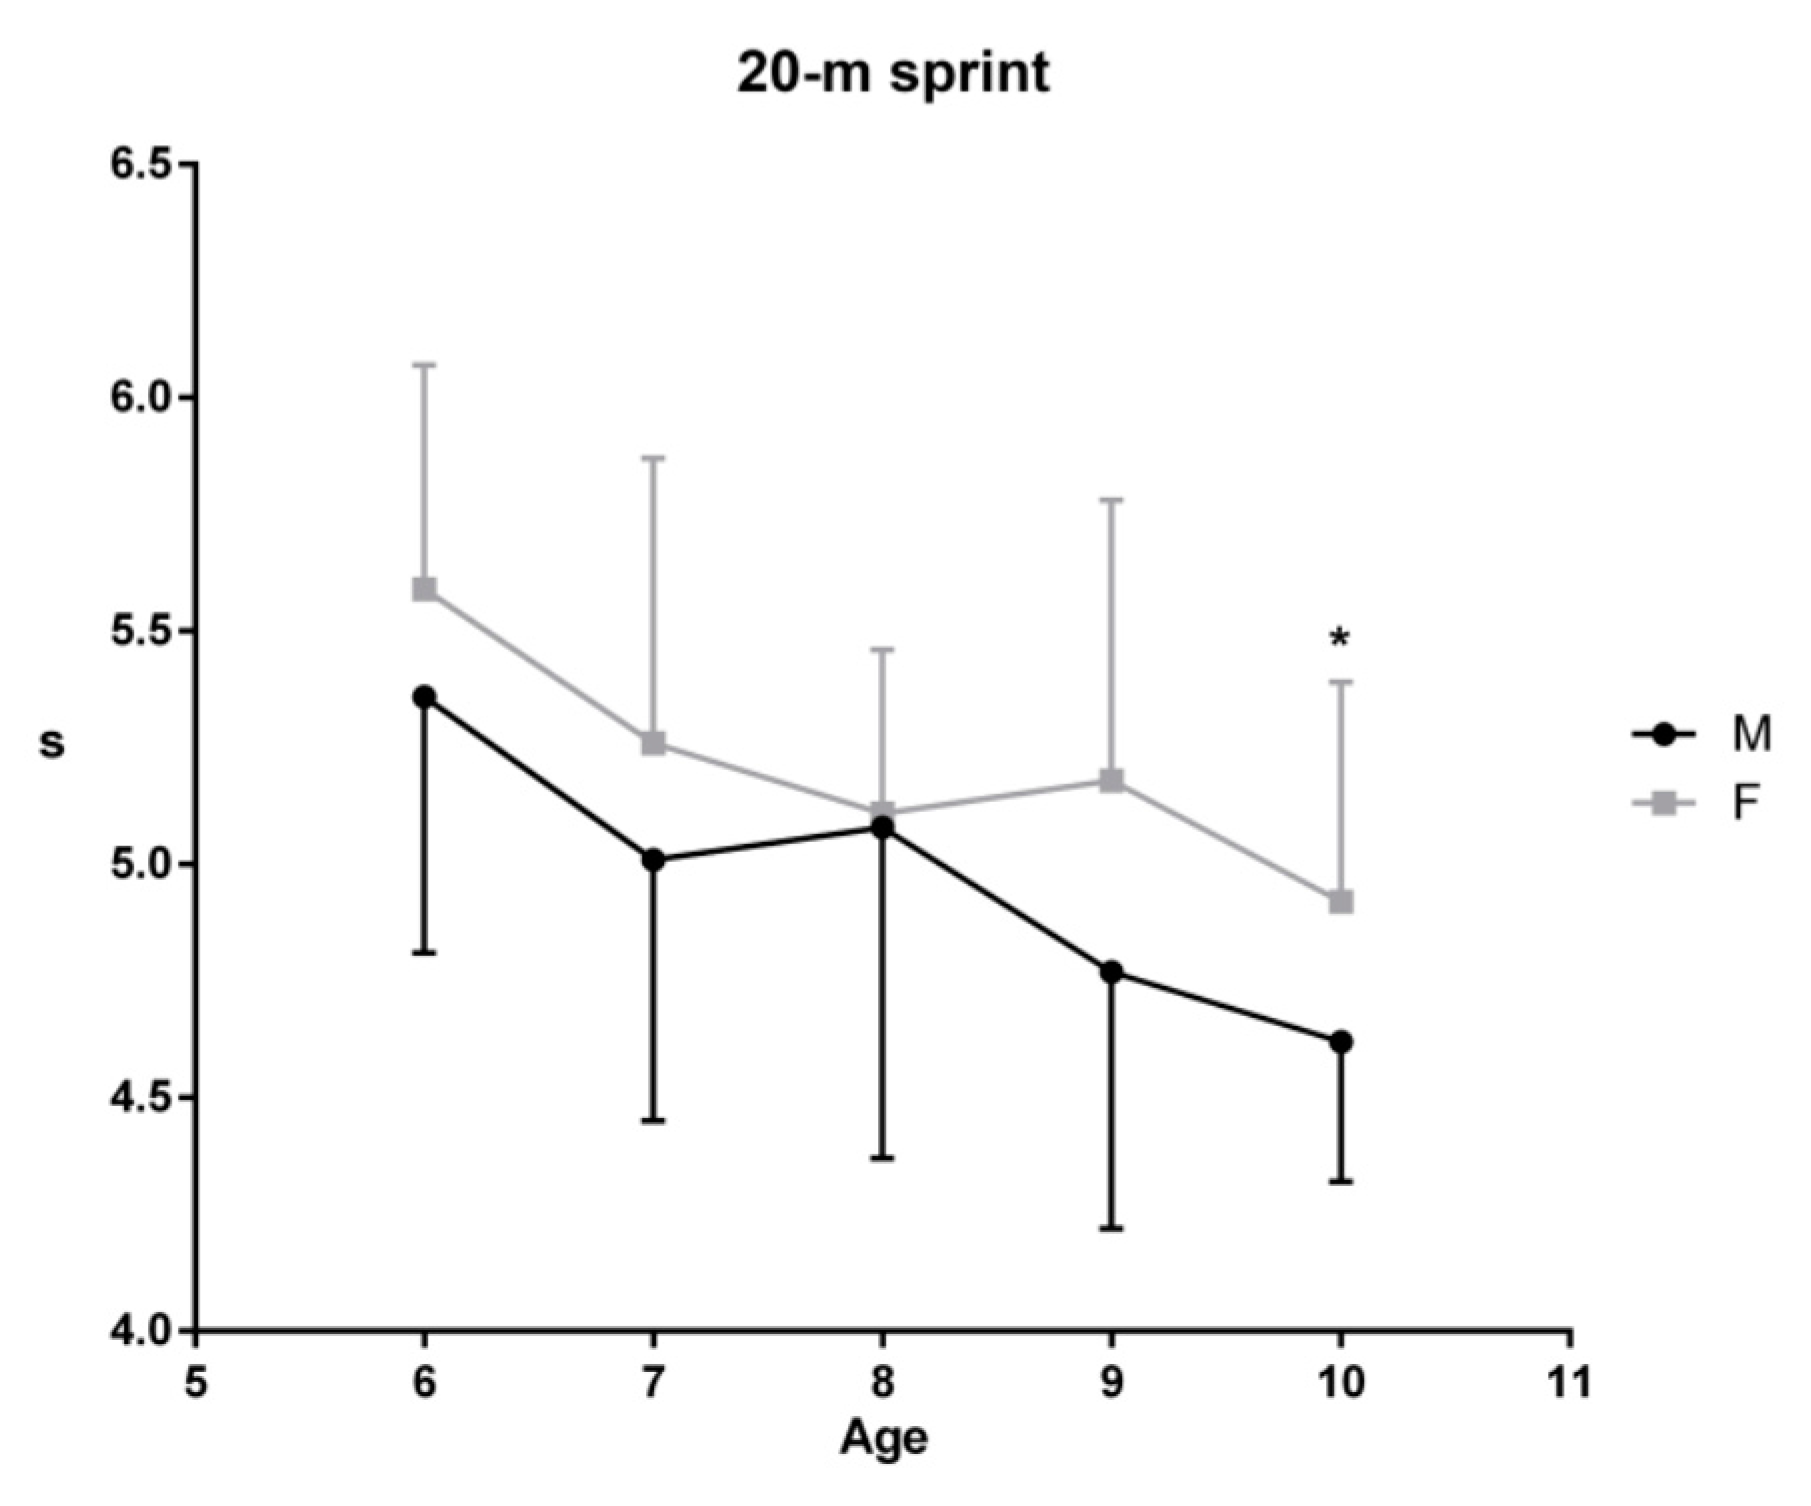
3. Results
4. Discussion
5. Conclusions
Author Contributions
Conflicts of Interest
References
- Ortega, F.B.; Ruiz, J.R.; Castillo, M.J.; Moreno, L.A.; Urzanqui, A.; Gonzalez-Gross, M.; Sjostrom, M.; Gutierrez, A.; Group, A.S. Health-related physical fitness according to chronological and biological age in adolescents. The AVENA study. J. Sports Med. Phys. Fit. 2008, 48, 371–379. [Google Scholar]
- Eime, R.M.; Young, J.A.; Harvey, J.T.; Charity, M.J.; Payne, W.R. A systematic review of the psychological and social benefits of participation in sport for children and adolescents: Informing development of a conceptual model of health through sport. Int. J. Behav. Nutr. Phys. Act. 2013, 10, 98. [Google Scholar] [CrossRef] [PubMed]
- Hajek, P.; Stead, L. F. Global Recommendations on Physical Activity for Health; WHO Press: Geneva, Switzerland, 2010. [Google Scholar]
- Paoli, A.; Bianco, A. Not all exercises are created equal. Am. J. Cardiol. 2012, 109, 305. [Google Scholar] [CrossRef] [PubMed]
- Ortega, F.B.; Ruiz, J.R.; Castillo, M.J.; Sjostrom, M. Physical fitness in childhood and adolescence: A powerful marker of health. Int. J. Obes. 2008, 32, 1–11. [Google Scholar] [CrossRef] [PubMed]
- Bianco, A.; Jemni, M.; Thomas, E.; Patti, A.; Paoli, A.; Ramos Roque, J.; Palma, A.; Mammina, C.; Tabacchi, G. A systematic review to determine reliability and usefulness of the field-based test batteries for the assessment of physical fitness in adolescents—The ASSO Project. Int. J. Occup. Med. Environ. Health 2015, 28, 445–478. [Google Scholar] [CrossRef] [PubMed]
- Heyward, V.H.; Gibson, A. Advanced Fitness Assessment and Exercise Prescription 7th Edition; Human Kinetics: Champagne, IL, USA, 2014. [Google Scholar]
- Ruiz, J.R.; Castro-Pinero, J.; Espana-Romero, V.; Artero, E.G.; Ortega, F.B.; Cuenca, M.M.; Jimenez-Pavon, D.; Chillon, P.; Girela-Rejon, M.J.; Mora, J.; et al. Field-based fitness assessment in young people: The ALPHA health-related fitness test battery for children and adolescents. Br. J. Sports Med. 2011, 45, 518–524. [Google Scholar] [CrossRef] [PubMed]
- Ortega, F.B.; Ruiz, J.R.; Castillo, M.J.; Moreno, L.A.; Gonzalez-Gross, M.; Warnberg, J.; Gutierrez, A.; Group, A. Low level of physical fitness in Spanish adolescents. Relevance for future cardiovascular health (Avena study). Rev. Esp. Cardiol. 2005, 58, 898–909. [Google Scholar] [CrossRef] [PubMed]
- Ortega, F.B.; Artero, E.G.; Ruiz, J.R.; Vicente-Rodriguez, G.; Bergman, P.; Hagstromer, M.; Ottevaere, C.; Nagy, E.; Konsta, O.; Rey-Lopez, J.P.; et al. Reliability of health-related physical fitness tests in European adolescents. The HELENA Study. Int. J. Obes. 2008, 32, S49–57. [Google Scholar] [CrossRef] [PubMed]
- Morrow, J.R., Jr.; Martin, S.B.; Jackson, A.W. Reliability and validity of the FITNESSGRAM: Quality of teacher-collected health-related fitness surveillance data. Res. Q. Exerc. Sport 2010, 81, S24–30. [Google Scholar] [CrossRef] [PubMed]
- Tomkinson, G.R.; Carver, K.D.; Atkinson, F.; Daniell, N.D.; Lewis, L.K.; Fitzgerald, J.S.; Lang, J.J.; Ortega, F.B. European normative values for physical fitness in children and adolescents aged 9–17 years: Results from 2,779,165 Eurofit performances representing 30 countries. Br. J. Sports Med. 2017. [Google Scholar] [CrossRef] [PubMed]
- Ortega, F.B.; Artero, E.G.; Ruiz, J.R.; Espana-Romero, V.; Jimenez-Pavon, D.; Vicente-Rodriguez, G.; Moreno, L.A.; Manios, Y.; Beghin, L.; Ottevaere, C.; et al. Physical fitness levels among European adolescents: The HELENA study. Br. J. Sports Med. 2011, 45, 20–29. [Google Scholar] [CrossRef] [PubMed]
- Vanhelst, J.; Beghin, L.; Fardy, P.S.; Ulmer, Z.; Czaplicki, G. Reliability of health-related physical fitness tests in adolescents: The MOVE Program. Clin. Physiol. Funct. Imaging 2016, 36, 106–111. [Google Scholar] [CrossRef] [PubMed]
- Bianco, A.; Mammina, C.; Jemni, M.; Filippi, A.R.; Patti, A.; Thomas, E.; Paoli, A.; Palma, A.; Tabacchi, G. A Fitness Index model for Italian adolescents living in Southern Italy: The ASSO project. J. Sports Med. Phys. Fit. 2016, 56, 1279–1288. [Google Scholar]
- Artero, E.G.; Espana-Romero, V.; Castro-Pinero, J.; Ortega, F.B.; Suni, J.; Castillo-Garzon, M.J.; Ruiz, J.R. Reliability of field-based fitness tests in youth. Int. J. Sports Med. 2011, 32, 159–169. [Google Scholar] [CrossRef] [PubMed]
- Castro-Pinero, J.; Artero, E.G.; Espana-Romero, V.; Ortega, F.B.; Sjostrom, M.; Suni, J.; Ruiz, J.R. Criterion-related validity of field-based fitness tests in youth: A systematic review. Br. J. Sports Med. 2010, 44, 934–943. [Google Scholar] [CrossRef] [PubMed]
- Ortega, F.B.; Cadenas-Sanchez, C.; Sanchez-Delgado, G.; Mora-Gonzalez, J.; Martinez-Tellez, B.; Artero, E.G.; Castro-Pinero, J.; Labayen, I.; Chillon, P.; Lof, M.; et al. Systematic review and proposal of a field-based physical fitness-test battery in preschool children: The PREFIT battery. Sports Med. 2015, 45, 533–555. [Google Scholar] [CrossRef] [PubMed]
- Veldhuizen, S.; Cairney, J.; Hay, J.; Faught, B. Relative age effects in fitness testing in a general school sample: How relative are they? J. Sports Sci. 2015, 33, 109–115. [Google Scholar] [CrossRef] [PubMed]
- Cobley, S.; Baker, J.; Wattie, N.; McKenna, J. Annual age-grouping and athlete development: A meta-analytical review of relative age effects in sport. Sports Med. 2009, 39, 235–256. [Google Scholar] [CrossRef] [PubMed]
- Wattie, N.; Cobley, S.; Baker, J. Towards a unified understanding of relative age effects. J. Sports Sci. 2008, 26, 1403–1409. [Google Scholar] [CrossRef] [PubMed]
- Bianco, A.; Lupo, C.; Alesi, M.; Spina, S.; Raccuglia, M.; Thomas, E.; Paoli, A.; Palma, A. The sit up test to exhaustion as a test for muscular endurance evaluation. Springerplus 2015, 4, 309. [Google Scholar] [CrossRef] [PubMed]
- Ruiz, J.R.; Espana Romero, V.; Castro Pinero, J.; Artero, E.G.; Ortega, F.B.; Cuenca Garcia, M.; Jimenez Pavon, D.; Chillon, P.; Girela Rejon, M.J.; Mora, J.; et al. ALPHA-fitness test battery: Health-related field-based fitness tests assessment in children and adolescents. Nutr. Hosp. 2011, 26, 1210–1214. [Google Scholar] [PubMed]
- Golle, K.; Muehlbauer, T.; Wick, D.; Granacher, U. Physical Fitness Percentiles of German Children Aged 9–12 Years: Findings from a Longitudinal Study. PLoS ONE 2015, 10, e0142393. [Google Scholar] [CrossRef] [PubMed]
- Gulias-Gonzalez, R.; Sanchez-Lopez, M.; Olivas-Bravo, A.; Solera-Martinez, M.; Martinez-Vizcaino, V. Physical fitness in Spanish schoolchildren aged 6–12 years: Reference values of the battery EUROFIT and associated cardiovascular risk. J. Sch. Health 2014, 84, 625–635. [Google Scholar] [CrossRef] [PubMed]
- Dobosz, J.; Mayorga-Vega, D.; Viciana, J. Percentile Values of Physical Fitness Levels among Polish Children Aged 7 to 19 Years—A Population-Based Study. Cent. Eur. J. Public Health 2015, 23, 340–351. [Google Scholar] [CrossRef] [PubMed]
- Roriz De Oliveira, M.S.; Seabra, A.; Freitas, D.; Eisenmann, J.C.; Maia, J. Physical fitness percentile charts for children aged 6–10 from Portugal. Sports Med. Phys. Fit. 2014, 54, 780–792. [Google Scholar]
- Castro-Pinero, J.; Gonzalez-Montesinos, J.L.; Mora, J.; Keating, X.D.; Girela-Rejon, M.J.; Sjostrom, M.; Ruiz, J.R. Percentile values for muscular strength field tests in children aged 6 to 17 years: Influence of weight status. J. Strength Cond. Res. 2009, 23, 2295–2310. [Google Scholar] [CrossRef] [PubMed]
- Schell, L.M. Fetus into man: Physical growth from conception to maturity (revised and enlarged edition). Am. J. Hum. Biol. 1991, 3, 217–218. [Google Scholar] [CrossRef]
- Ford, P.; Collins, D.; Bailey, R.; MacNamara, Á.; Pearce, G.; Toms, M. Participant development in sport and physical activity: The impact of biological maturation. Eur. J. Sport Sci. 2012, 12, 515–526. [Google Scholar] [CrossRef]


| Male | ||||||
| Age (years) | 8.10 ± 1.40 | 6 | 7 | 8 | 9 | 10 |
| Subjects (n) | 80 | 14 | 13 | 19 | 17 | 17 |
| Body Mass (kg) | 34.70 ± 9.90 | 26.1 ± 6.3 | 30.6 ± 7.6 | 33.9 ± 9.6 | 38.6 ± 9.6 | 42.2 ± 8.0 |
| Height (cm) | 132.90 ± 8.30 | 123.1 ± 6.1 | 127.5 ± 6.0 | 133.4 ± 5.8 | 137.0 ± 6.5 | 140.8 ± 4.1 |
| Female | ||||||
| Age (years) | 8 ± 1.50 | 6 | 7 | 8 | 9 | 10 |
| Subjects (n) | 74 | 17 | 17 | 8 | 15 | 17 |
| Body Mass (kg) | 32.70 ± 10.60 | 25.1 ± 4.8 | 28.5 ± 6.2 | 31.6 ± 9.5 | 39.4 ± 11.8 | 38.2 ± 11.0 |
| Height (cm) | 129.70 ± 17.70 | 119.2 ± 4.8 | 118.7 ± 28.3 | 131.0 ± 4.3 | 138.2 ± 6.7 | 142.8 ± 7.0 |
| Age | SBJ (cm) | 4 × 10 m (s) | SUT (reps) | HG R (kg) | HG L (kg) | 20 mST (s) |
|---|---|---|---|---|---|---|
| 6 | 115.6 ± 16.9 | 15.8 ± 1.6 | 16.7 ± 16.6 | 7.7 ± 2.2 | 7.2 ± 2.1 | 5.49 ± 0.52 |
| 7 | 118.3 ± 17.4 | 15.6 ± 1.7 | 24.9 ± 21.9 | 10.6 ± 2.4 | 9.8 ± 2.5 | 5.15 ± 0.59 |
| 8 | 126.9 ± 18.8 | 14.3 ± 1.9 | 42.4 ± 41.3 | 13.1 ± 3.2 | 11.2 ± 3.2 | 5.09 ± 0.62 |
| 9 | 137.6 ± 19.1 | 14.5 ± 1.5 | 50.3 ± 46.2 | 14.7 ± 3.4 | 13.2 ± 3.6 | 4.98 ± 0.60 |
| 10 | 140.6 ± 18.3 | 13.4 ± 1.1 | 55.91 ± 34.9 | 16.5 ± 3.3 | 14.7 ± 3.5 | 4.78 ± 0.42 |
| Age | SBJ (cm) | 4 × 10 m (s) | SUT (reps) | HG R (kg) | HG L (kg) | 20 mST (s) |
|---|---|---|---|---|---|---|
| 6 | 122.1 ± 16.8 | 15.4 ± 1.95 | 11.2 ± 8.9 | 8.4 ± 2.3 | 7.7 ± 2.3 | 5.36 ± 0.55 |
| 7 | 124.8 ± 20.2 | 15.8 ± 1.87 | 25.85 ± 28.9 | 11.8 ± 2.2 | 10.7 ± 2.9 | 5.01 ± 0.56 |
| 8 | 135.5 ± 18.4 | 13.6 ± 1.2 | 47.0 ± 46.7 | 13.6 ± 3.2 | 11.9 ± 3.4 | 5.08 ± 0.71 |
| 9 | 142.1 ± 19.1 | 13.8 ± 1.5 | 68.1 ± 54.9 | 15.5 ± 3.8 | 14.2 ± 3.9 | 4.77 ± 0.55 |
| 10 | 143.4 ± 15.5 | 12.9 ± 0.8 | 64.1 ± 32.5 | 18.4 ± 3.3 | 16.2 ± 3.6 | 4.62 ± 0.30 |
| Age | SBJ (cm) | 4 × 10 m (s) | SUT (reps) | HG R (kg) | HG L (kg) | 20 mST (s) |
|---|---|---|---|---|---|---|
| 6 | 110.3 ± 14.6 | 16.1 ± 1.2 | 21.3 ± 20.1 | 7.1 ± 1.5 | 6.8 ± 0.9 | 5.59 ± 0.48 |
| 7 | 113.3 ± 13.6 | 16.1 ± 1.4 | 24.2 ± 15.5 | 9.7 ± 2.1 | 9.1 ± 1.9 | 5.26 ± 0.61 |
| 8 | 118.2 ± 15.3 | 15.8 ± 2.4 | 30.9 ± 21.4 | 11.6 ± 2.9 | 9.71 ± 2.1 | 5.11 ± 0.35 |
| 9 | 126.5 ± 14.4 | 15.1 ± 1.2 | 32.7 ± 26.8 | 13.9 ± 2.9 | 12.2 ± 3.2 | 5.18 ± 0.60 |
| 10 | 137.9 ± 18.2 | 13.9 ± 1.2 | 48.2 ± 36.2 | 14.8 ± 2.2 | 13.3 ± 2.8 | 4.92 ± 0.47 |
| Tests | Gender | Age | 6 | 7 | 8 | 9 | 10 |
|---|---|---|---|---|---|---|---|
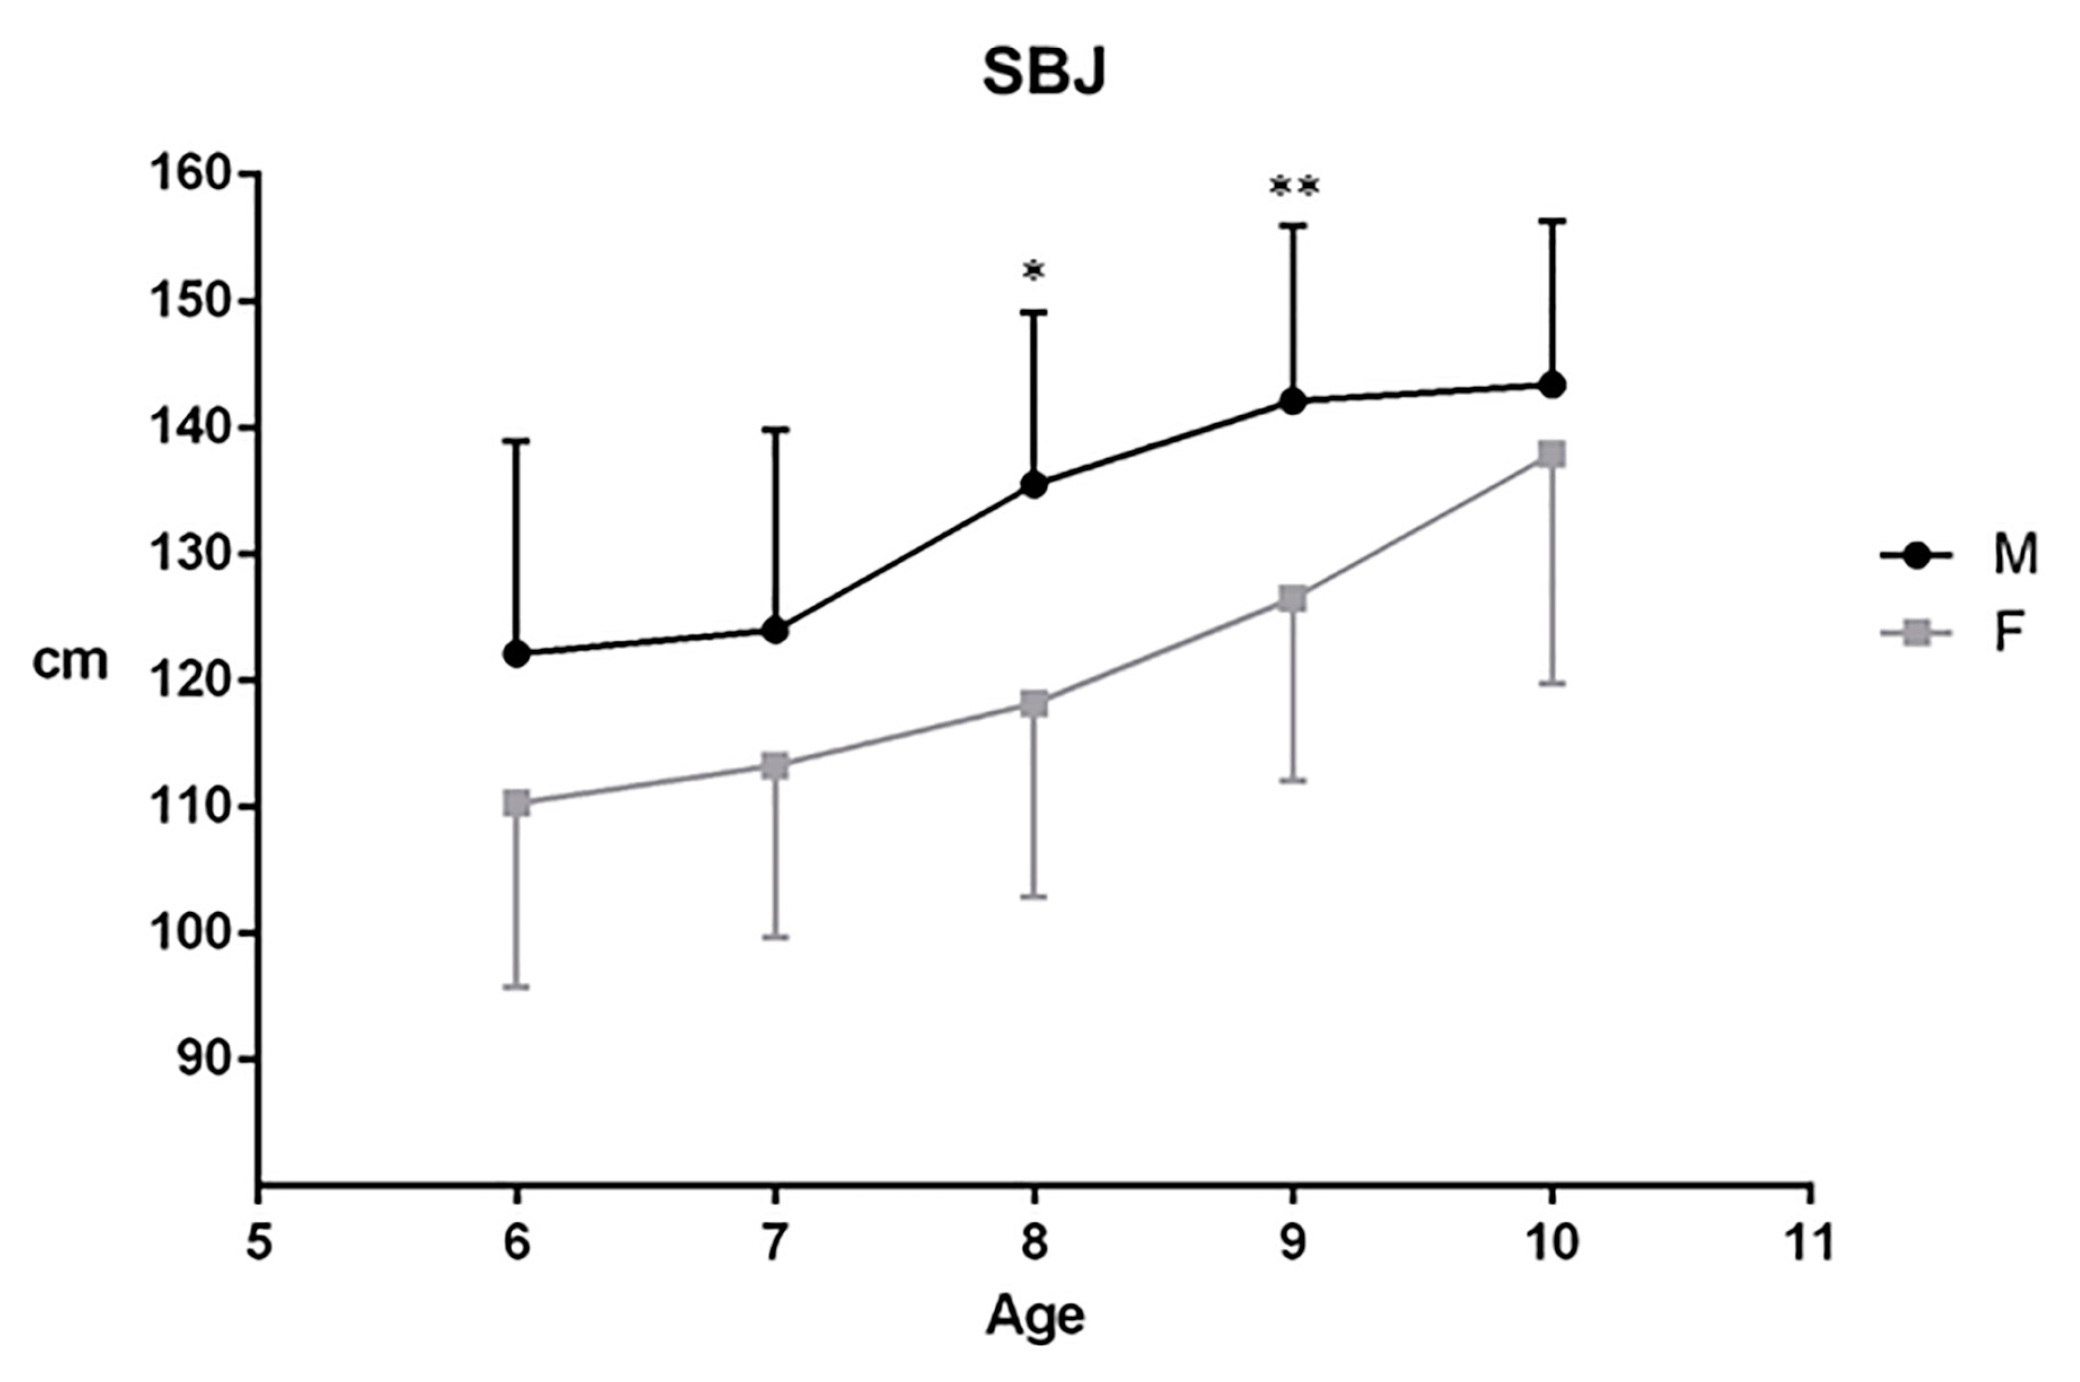
| SBJ | <0.0001 | <0.0001 | ns | ns | 0.047 | 0.007 | ns |
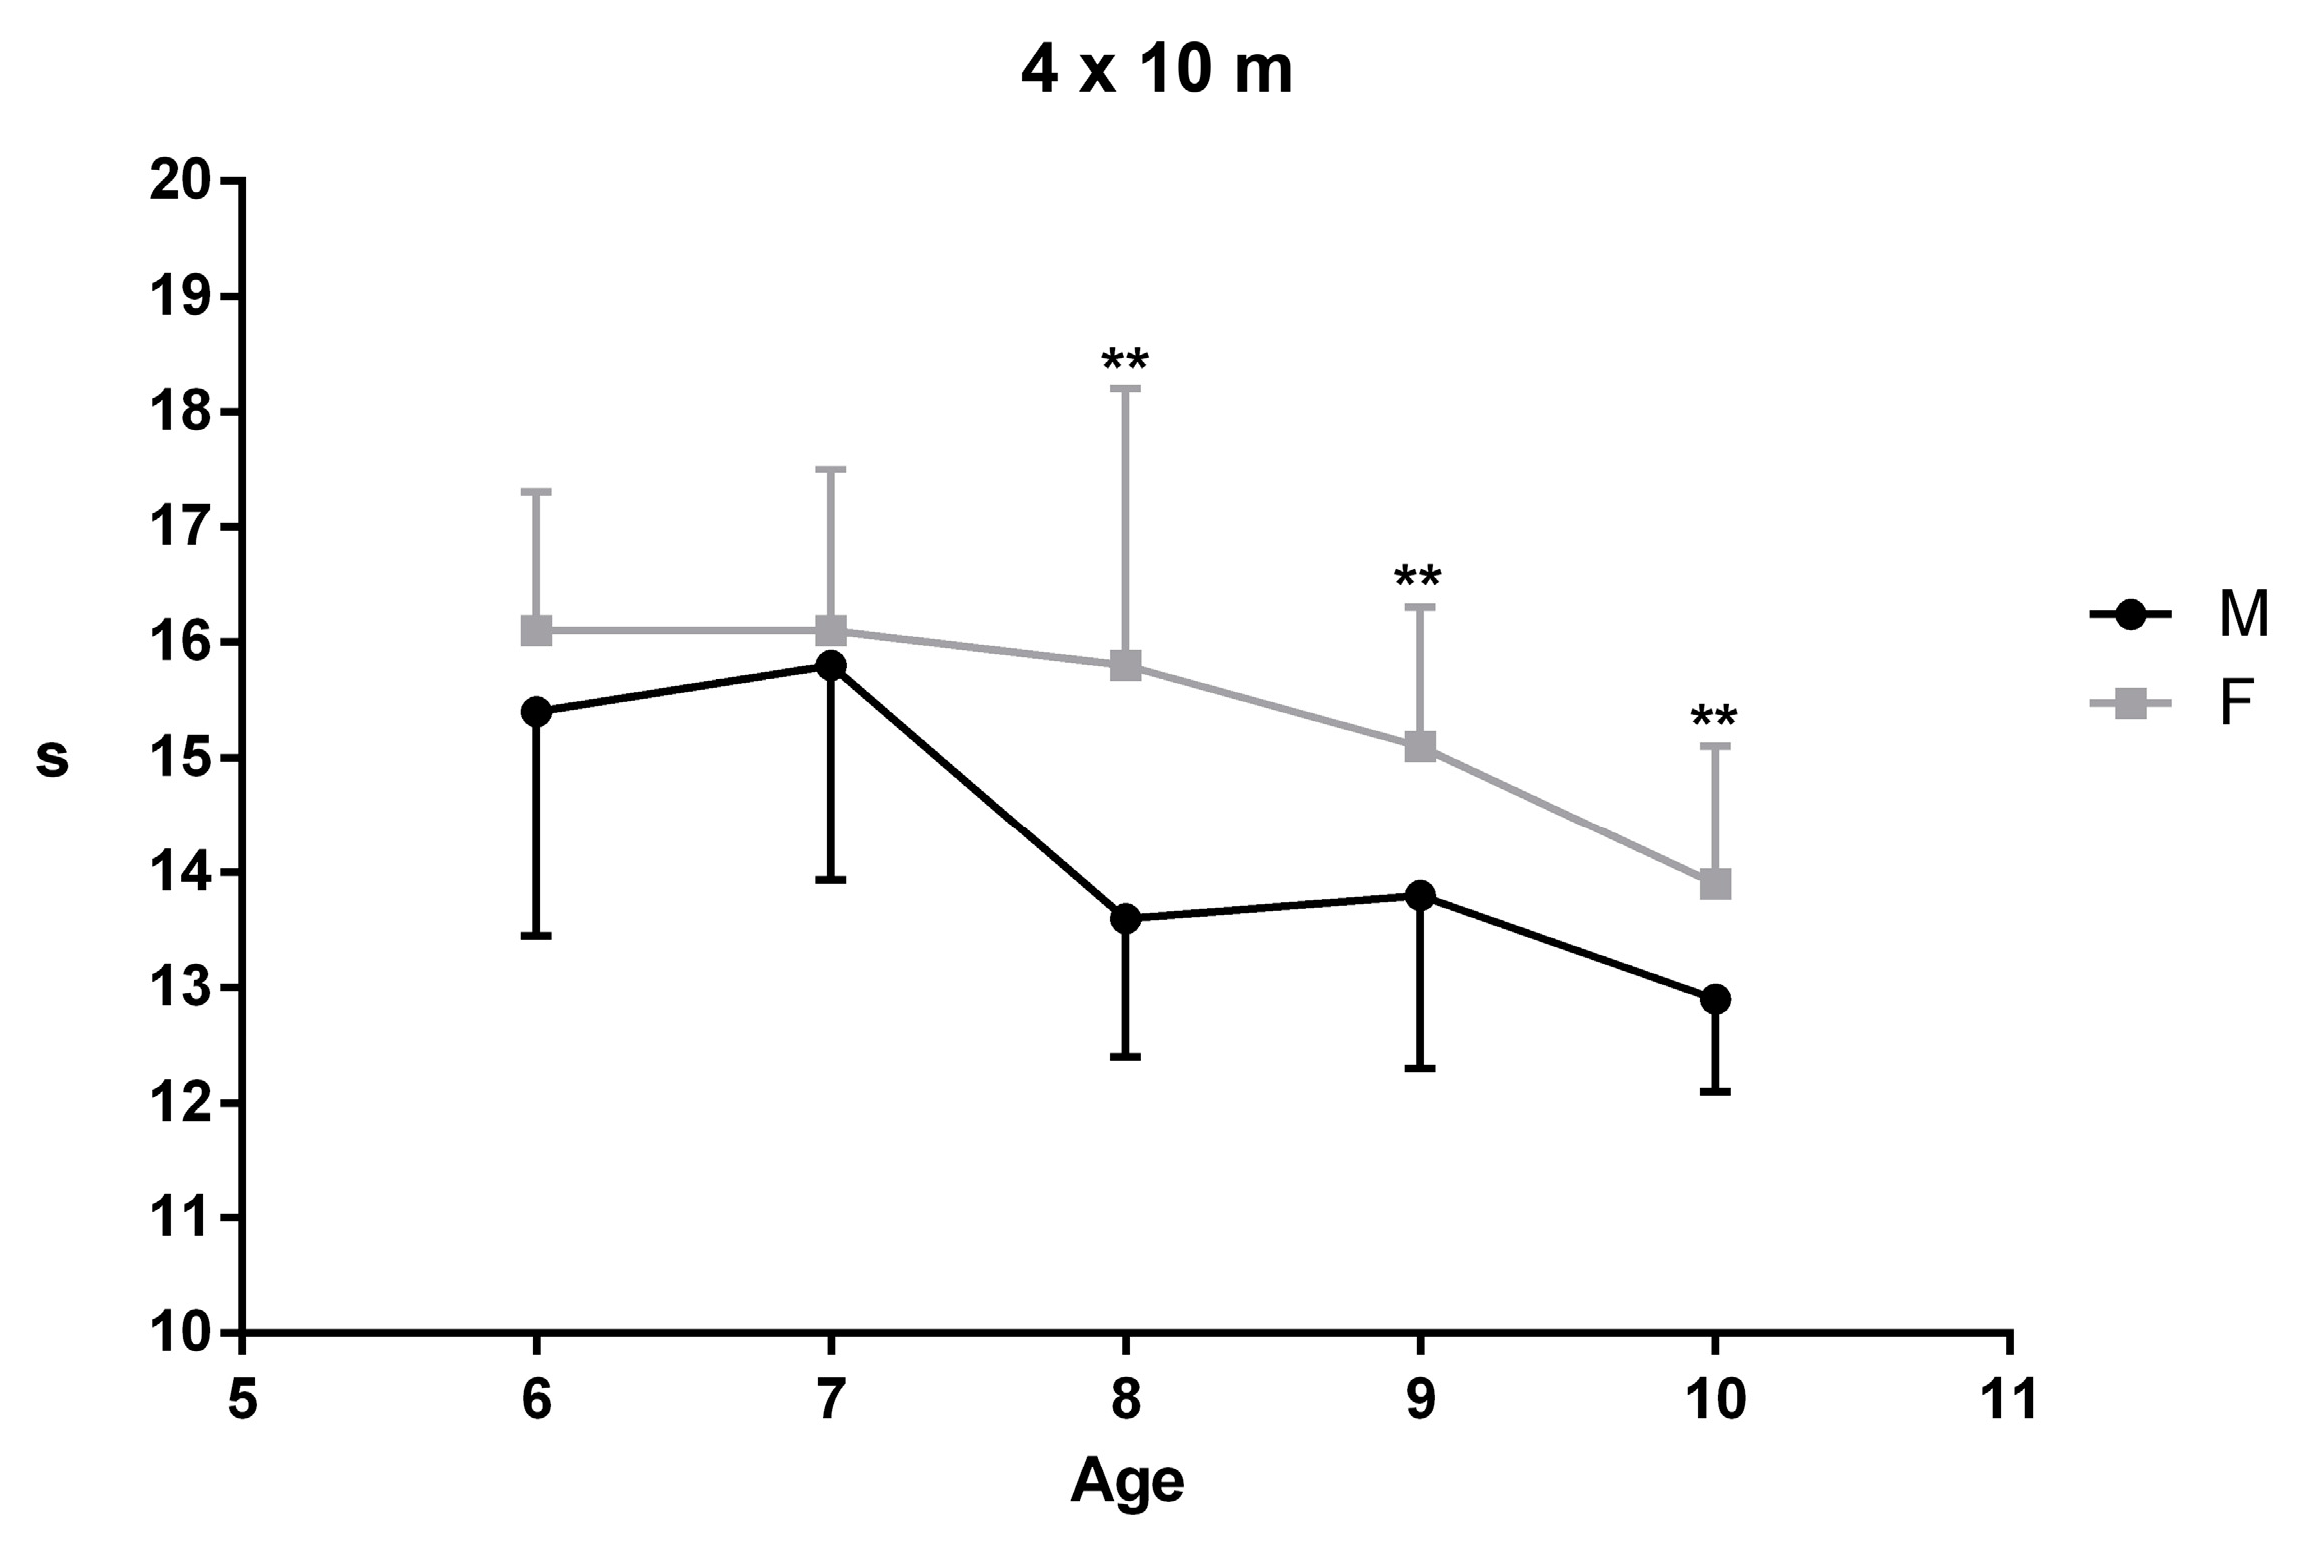
| 4 × 10 m | <0.0001 | <0.0001 b | ns | ns | 0.004 | 0.008 | 0.005 |
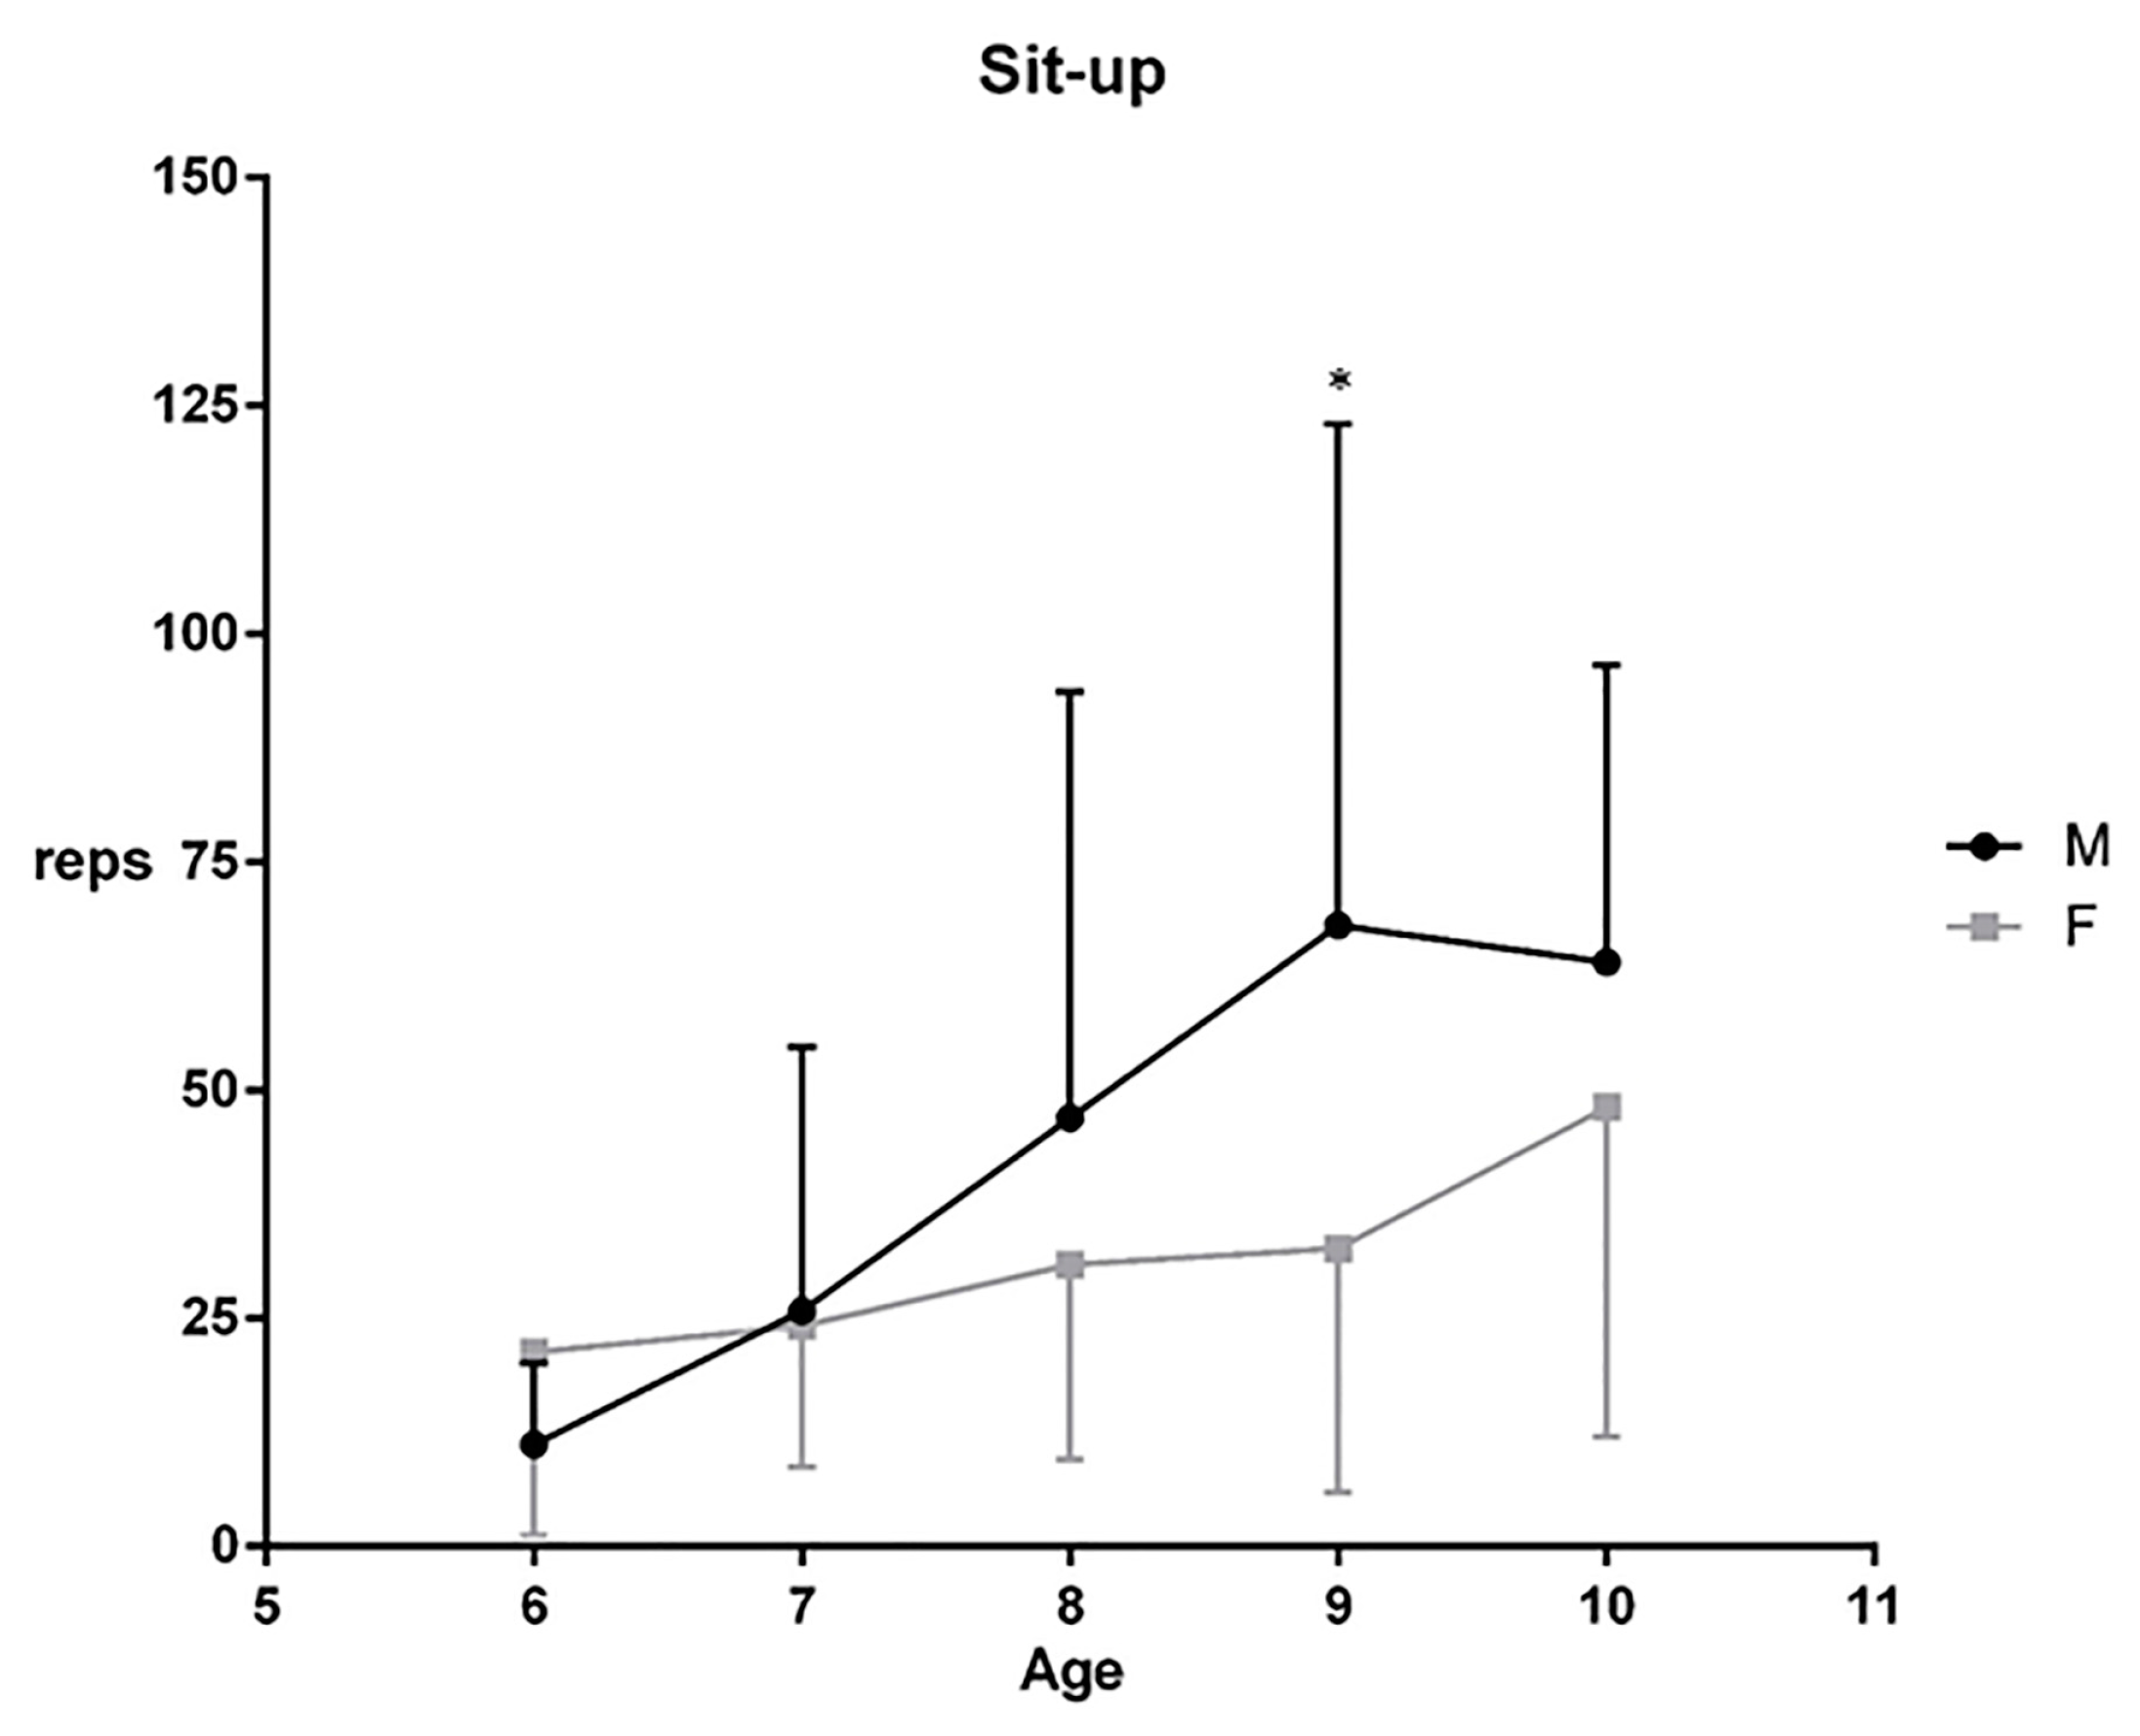
| SUT | 0.022 | <0.0001 | ns | ns | ns | 0.03 | ns |
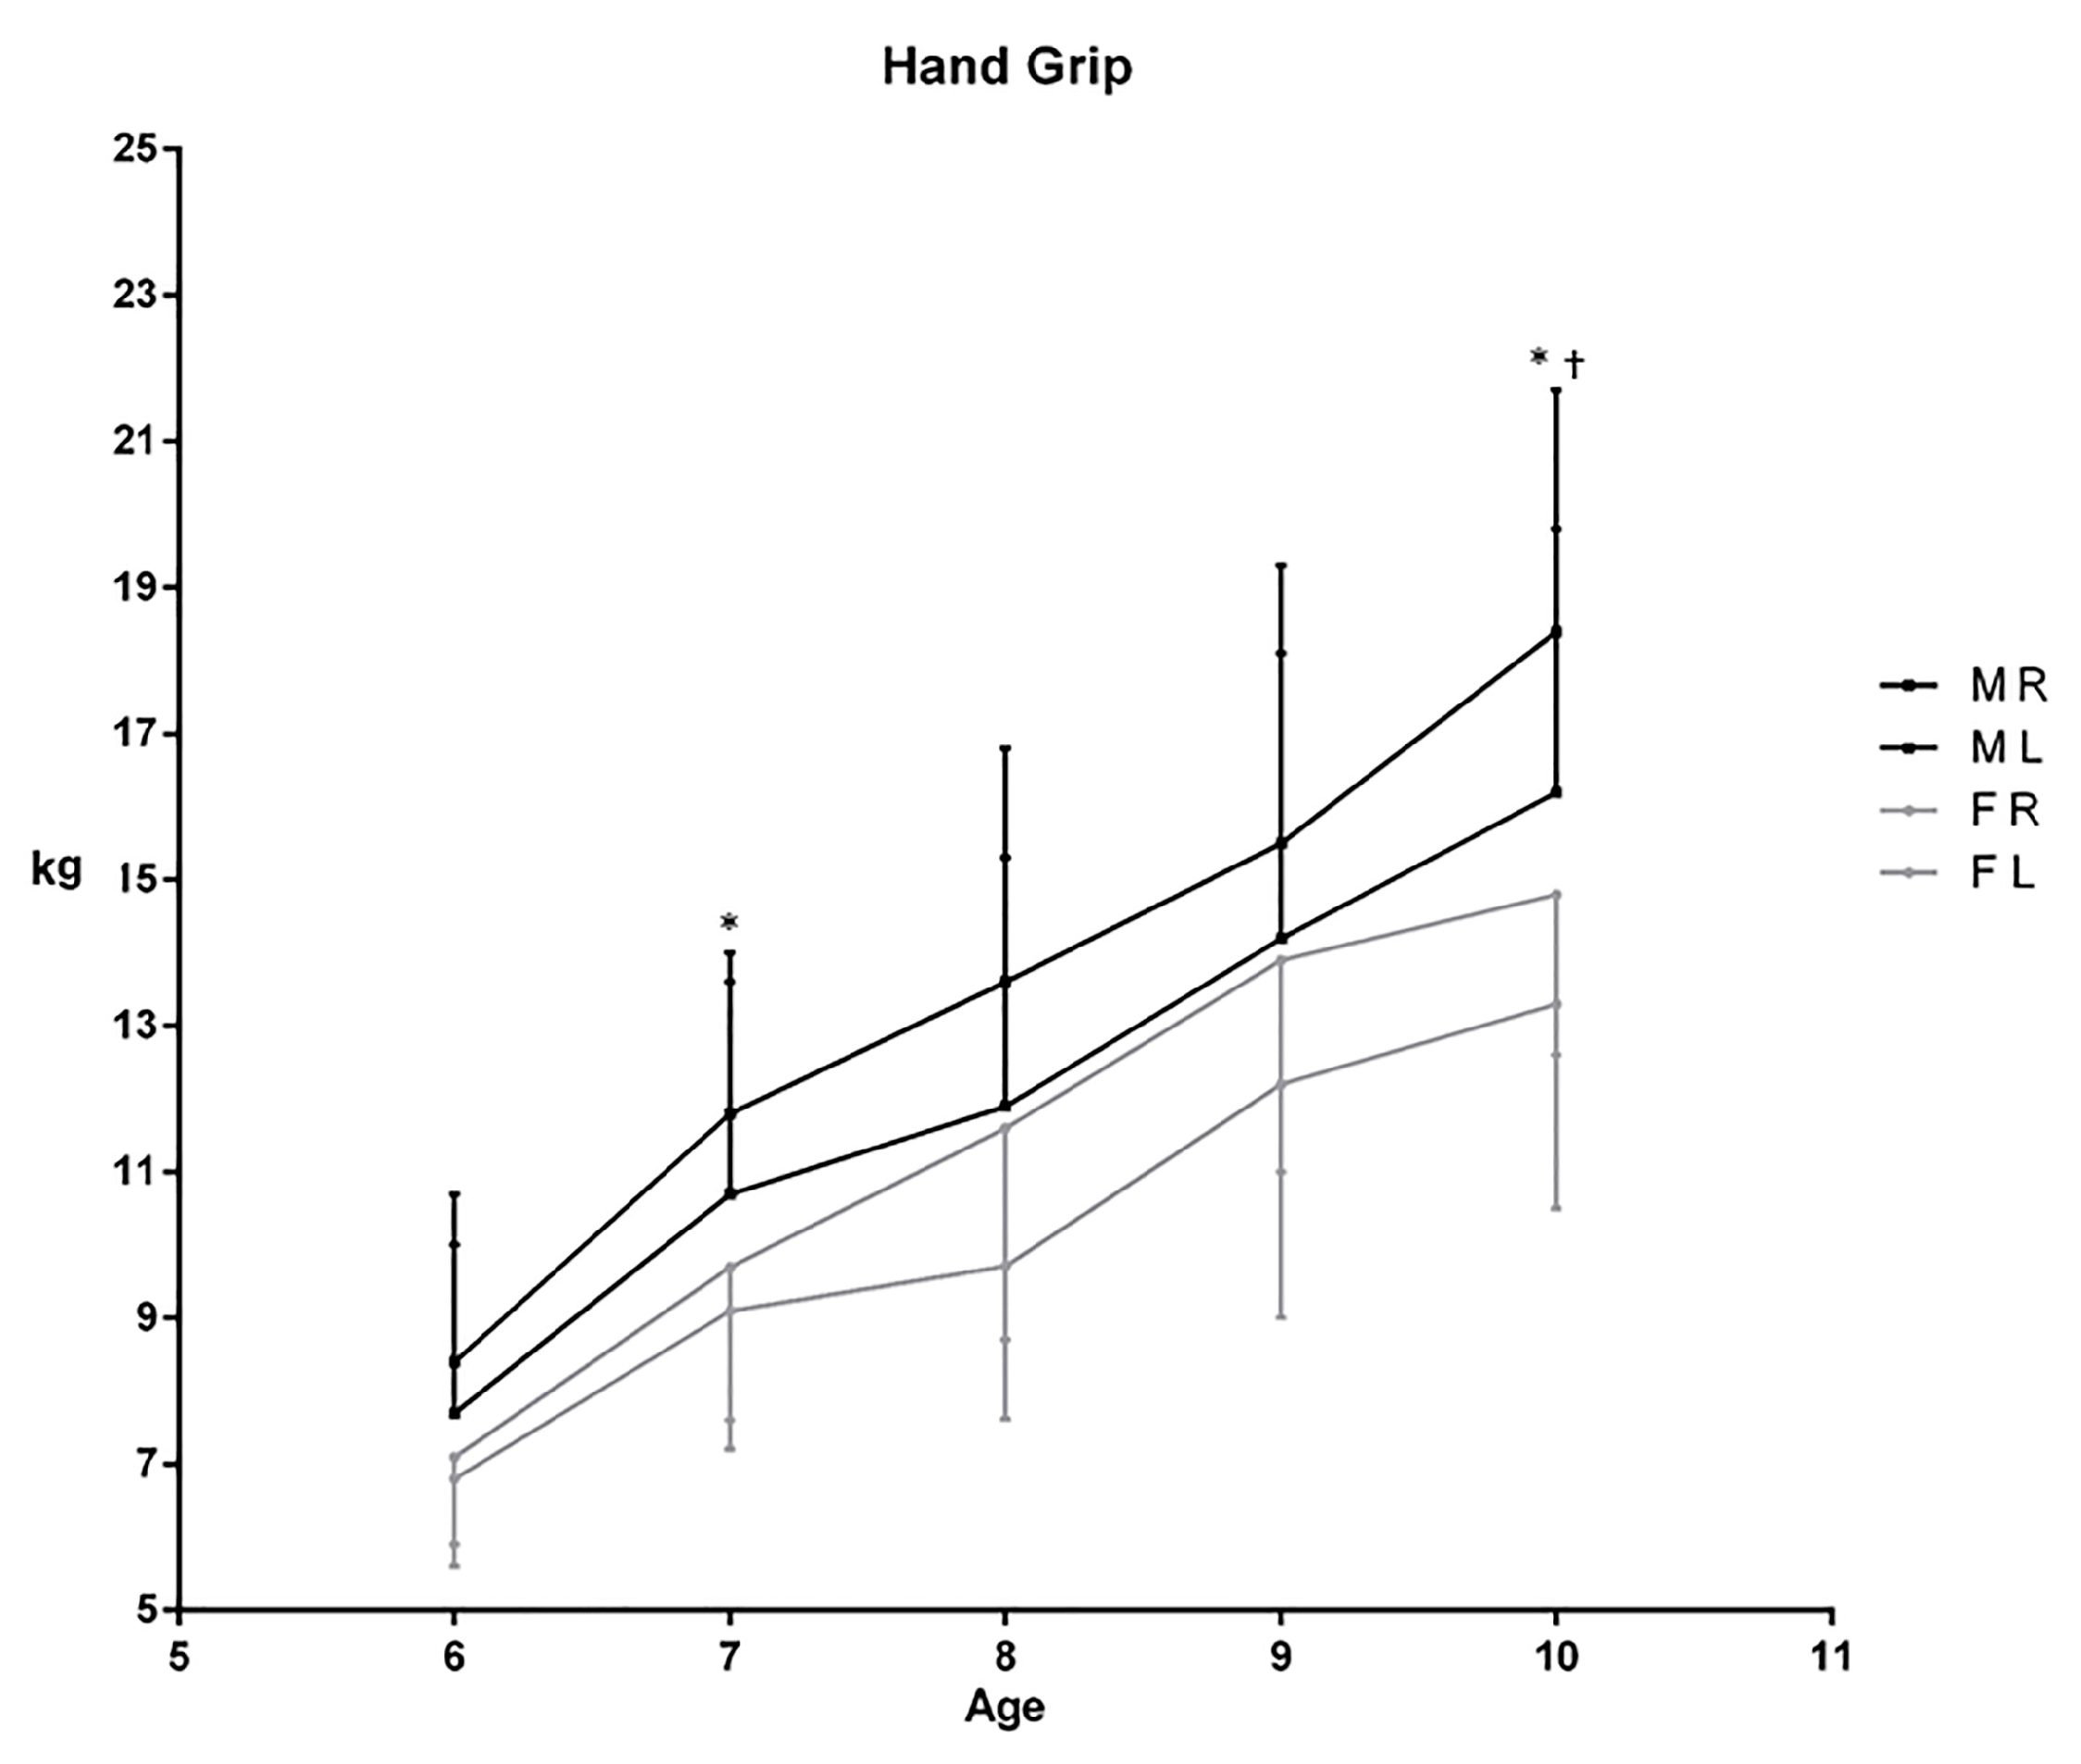
| HG R | 0.0002 | <0.0001 a,b | ns | 0.011 | ns | ns | 0.0005 |
| HG L | 0.0012 | <0.0001 a | ns | 0.048 | ns | ns | 0.012 |
| 20 mST | 0.0047 | <0.0001 | ns | ns | ns | ns | 0.034 |
© 2018 by the authors. Licensee MDPI, Basel, Switzerland. This article is an open access article distributed under the terms and conditions of the Creative Commons Attribution (CC BY) license (http://creativecommons.org/licenses/by/4.0/).
Share and Cite
Thomas, E.; Palma, A. Physical Fitness Evaluation of School Children in Southern Italy: A Cross Sectional Evaluation. J. Funct. Morphol. Kinesiol. 2018, 3, 14. https://doi.org/10.3390/jfmk3010014
Thomas E, Palma A. Physical Fitness Evaluation of School Children in Southern Italy: A Cross Sectional Evaluation. Journal of Functional Morphology and Kinesiology. 2018; 3(1):14. https://doi.org/10.3390/jfmk3010014
Chicago/Turabian StyleThomas, Ewan, and Antonio Palma. 2018. "Physical Fitness Evaluation of School Children in Southern Italy: A Cross Sectional Evaluation" Journal of Functional Morphology and Kinesiology 3, no. 1: 14. https://doi.org/10.3390/jfmk3010014
APA StyleThomas, E., & Palma, A. (2018). Physical Fitness Evaluation of School Children in Southern Italy: A Cross Sectional Evaluation. Journal of Functional Morphology and Kinesiology, 3(1), 14. https://doi.org/10.3390/jfmk3010014