Abstract
The purpose of the present study was to investigate the effects of psychological pressure on corticospinal excitability, the spinal reflex, lower limb muscular activity, and reaction times during a task involving dominant leg movements. Ten healthy participants performed a simple reaction time task by raising the heel of their dominant foot from a switch. After 20 practice trials, participants performed 20 non-pressure and 20 pressure trials in a counterbalanced order. A combination of pressure manipulations, including reward and penalty by monetary incentives, was used in the pressure trials. Stress responses were successfully induced, as indexed by significant increases in state anxiety, mental effort, and heart rates under pressure. Significant increases in motor evoked potential (MEP) amplitude of the tibialis anterior muscle (TA) occurred under pressure. In terms of task-related electromyography (EMG) amplitude, the co-contraction rate between the soleus (SOL) and TA muscles significantly increased along with SOL and TA EMG amplitudes under pressure. Hoffmann reflexes for SOL and reaction times did not change under pressure. These results indicate that corticospinal excitability and leg muscle-related EMG activity increase homogeneously during lower limb movements that are performed under psychological pressure.
1. Introduction
Psychological pressure is defined as “any factor or combination of factors that increases the importance of performing well on a particular occasion [1]”, and pressure can have both facilitative (“clutch”) and detrimental (“choking”) effects on motor performance. Neurophysiological mechanisms underlying these phenomena are of great concern to athletes, coaches, and scientists across several fields. In line with this, researchers have recently conducted several motor control studies, including investigations of cortical activity using electroencephalogram (EEG) techniques [2,3,4,5]. These studies found increased alpha or beta band coherence between mid-frontal (Fz) and other cortical regions during motor skill performance under pressure [3,4,5], indicating that pressure facilitates inter-cortical communication between the motor planning region and other sites. Additionally, decreased event-related potential (ERP) P3 amplitude was found when performing a dual task that involved responding to visual cues during a simulated driving task [2], suggesting a reduction in processing efficiency when performing motor skills under pressure.
In addition to such EEG studies, motor evoked potential (MEP) recordings can be used to examine motor neuron excitability in the efferent pathways extending from the primary motor area to the innervated muscles, which are elicited by monophasic transcranial magnetic stimulation (TMS) of the primary motor area. In these studies, increased MEP amplitude (i.e., higher corticospinal excitability) is observed before (motor preparation phase) [6], during [7] and after [8] participants perform voluntary hand movements, under pressure evoked using monetary incentives or competition.
Furthermore, electromyography (EMG) and force control functions have been examined while people perform various motor tasks under pressure. For example, increases in endurance time during a finger pinch task [9], EMG amplitude increases for task-involved muscles [10,11,12] as well as a muscle not directly involved [13], and co-contraction between agonists and antagonists [10,11] have all been found to occur under pressure.
Based on these previous findings, two arguments are pertinent to furthering our understanding of the neurophysiological basis of motor control system under pressure. First, the central nervous system (CNS) can be divided into higher (e.g., cortical and sub-cortical) and lower (e.g., spinal reflex) levels. Previous studies have focused on the cortical level and little is known about how spinal reflex mechanisms operate under pressure. It is therefore necessary to investigate multilevel CNS activities under pressure in a single experiment.
Second, while upper limb corticospinal excitability and muscular activities such as those of the hands and fingers have been the focus in previous studies, there are no studies investigating lower limb corticospinal excitability and muscular activities during performance of motor tasks under pressure. The upper and lower limbs are controlled via dorsolateral and ventromedial motor systems. Fine and rapid movements of hand and leg muscles are controlled mainly by the dorsolateral motor system via the pyramidal tract, whereas the ventromedial motor system underlies postural control via the extrapyramidal tract (e.g., gait and balance). In the present study, we focus on corticospinal excitability in the dorsolateral motor system controlling the leg muscles and EMG activities of these muscles under pressure. Most people experience motor skill dysfunction involving several movements in both upper and lower limbs under pressure. It would therefore be reasonable to propose that pressure influences not only the upper limb CNS and EMG functions indicated in previous studies but also motor functions that control the lower limbs.
Given the aforementioned background, the purpose of the present study was to investigate the effects of psychological pressure on corticospinal excitabilities (by recording MEP), spinal reflex (by recording Hoffmann reflex (H-reflex)), agonist and antagonist EMG excitations (EMG amplitude and co-contraction), and task performance on a reaction time (RT) task using dominant leg movement. In this study, MEP and EMG were evoked from the soleus (SOL) and tibialis anterior muscles (TA). The SOL functioned as agonist and the TA functioned as antagonist during the RT task used in this study.
It was hypothesized that increased corticospinal excitabilities controlling the agonist and antagonist (i.e., an increase in MEP amplitude for both SOL and TA) would be observed when participants performed the RT task under pressure. In terms of EMG amplitude, we hypothesized that increases in EMG amplitudes for both SOL and TA as well as co-contraction between the muscles would be observed under pressure. These predictions are based on previous upper limb findings that multiple corticospinal and EMG activities involving agonist, antagonist, synergist, and those muscles not directly involved are facilitated under pressure [6,7,10,11,12,13].
However, we predicted that reduced SOL spinal reflexes would occur under pressure when this muscle functioned as the agonist. It has been reported that being in a high place [14] and high levels of task difficulty [15] could result in a decrease in H-reflex SOL amplitude during a standing postural control task along with various cognitive and emotional reactions. Cognitive and emotional functions under pressure were expected to lead to similar reductions in spinal reflexes. Previous studies have also reported performance facilitation [3,13], maintenance [5], and decrement [11,12] under pressure, and, due to such varied outcomes, we expected difficulties in predicting changes in performance outcome during the RT task.
2. Materials and Methods
2.1. Participants
Ten healthy male university students (mean age = 19.9, standard deviation = 0.99, range = 19–21 years) participated in this study. Nine participants were right-footed (mean = +9.0, standard deviation = 3.8, range = +4–17) and one participant left-footed (-2), as assessed by the Waterloo Footedness Questionnaire-Revised [16]. Only males were tested in order to avoid the potential awkwardness that could arise if a male experimenter were to attach surface electrodes to a female participant. Participants did not report any history of neurological disorders such as epilepsy and seizure. Written informed consent was obtained from all participants prior to their participation in the study. The experimental protocol was approved by the ethics committee of the University of Fukui and was conducted in accordance with the Declaration of Helsinki.
2.2. Task
Participants sat in a comfortable chair. During the experiment, they stepped on a foot switch in order to record reaction times, keeping the knee and ankle angles of the dominant leg at approximately 90° by sitting in the chair. Figure 1 illustrates the time course of the task used in this experiment and a sample of EMG waveforms for both SOL and TA. On each series of trials, the participant received an auditory warning signal (WS) (i.e., a “beep”). After two seconds, the WS was followed by a similar auditory imperative stimulus (IS). Participants were instructed to release their dominant foot from the switch by raising their heel upward as quickly as possible, but only after the IS appeared (Go trial). To prevent an anticipatory reaction, participants were told that they must not move their heel upward in cases when the IS was not presented (Catch trials). No instructions were provided for the resting (non-dominant) leg.
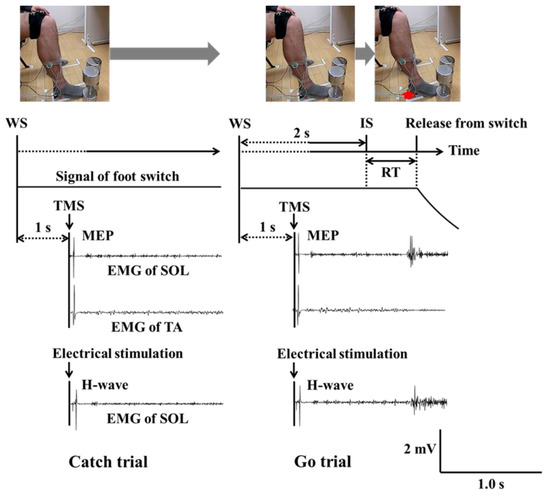
Figure 1.
Time course of the reaction time task and a sample of raw EMG waveforms during catch (left panel) and go trials (right panel). The red arrow shows that participant releases his dominant foot from the switch by raising their heel upward. (Note: WS = warning signal; IS = imperative stimulus; SOL = soleus; TA = tibialis anterior; MEP = motor evoked potential; H-wave = Hoffmann-wave; EMG = electromyography).
2.3. Induction and Recording of Physiological Indices
2.3.1. Corticospinal Excitability (MEP)
EMGs for the acting leg’s SOL and TA were amplified and extracted using Ag-AgCl bipolar surface electrodes (1 cm diameter and a 2 cm inter-electrode distance). Recordings were made with a sampling frequency of 2000 Hz and a bandwidth of 10 to 2000 Hz (Power Lab 26T, Chart 7 for Windows, AD Instruments Pty. Ltd., Bella Vista, Australia). A 110 mm double cone coil was connected to a magnetic stimulator (Model 2002, Magstim Company, Carmarthenshire, UK) to induce MEP. The coil was placed over the vertex (i.e., the hot spot where the largest MEP in the SOL could be elicited during weak contraction). Each participant wore a swimming cap during the experiment. The position of the coil was marked on the swimming cap so that the position could be continually monitored and maintained. TMS was administered to induce MEP from the acting leg’s SOL and TA (see Figure 2). We analyzed these muscles by recording MEP and EMG for the agonist (SOL) and antagonist (TA) during the reaction time task. Active MEP motor thresholds were defined as the lowest stimulus intensity that consistently evoked MEP in the SOL muscle, which had an amplitude of at least 50 µV and probability of at least 50% [17]. In the sample, the mean active MEP motor threshold was 46.10 ± 11.72% of the maximum TMS amplitude (2.0 Tesla). The TMS administered to each participant was 65.40 ± 12.07%. This TMS intensity was determined in such a way that sufficient MEP amplitudes in both SOL and TA muscles were obtained.
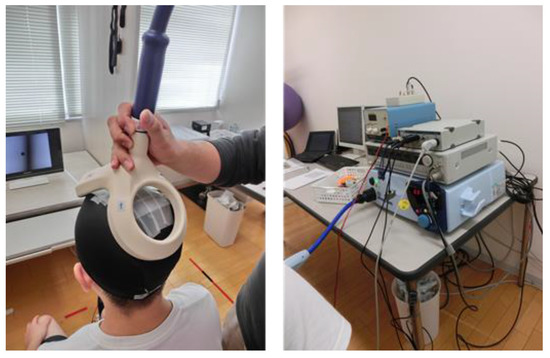
Figure 2.
Left picture shows the position of the double cone coil to induce MEP from the acting leg’s SOL and TA. Right picture shows the materials to record MEP, H-wave, and EMG. (Note: MEP = motor evoked potential; SOL = soleus; TA = tibialis anterior; H-wave = Hoffmann-wave; EMG = electromyography).
2.3.2. Spinal Reflex Excitability (H-reflex) and Heart Rate
For electrical stimulation of the tibial nerve, a circular cathodal stimulating electrode (6 mm diameter) was attached over a suitable spot at the popliteal fossa of the dominant leg. A rectangular anodal electrode (8 cm2 area) was placed over the skin of the patella. M- and H-waves were obtained by applying a square wave of 1 ms duration to the tibial nerve (SS-104j, Nihon Kohden, Tokyo, Japan; range of electrical intensity from 0 to 30 mA; see also Figure 2). Both anodal and cathodal electrodes were fixed using a rubber band in order to maintain stimulus stability during the experiment. The maximum amplitudes of the H-reflex (Hmax) were measured, keeping the knee angle at approximately 90° in the sitting position before the beginning of the experimental trials (see pictures in Figure 1). The mean electrical intensities for all participants to induce the Hmax were 8.41 mA (standard deviation = 3.00, range 5.2–15.0 mA). Mean peak-to-peak Hmax amplitudes for all participants were 10.70 mV (standard deviation = 4.19, range 4.02–17.10 mV). Administered electrical intensities during the experimental trials were determined such that H-reflex amplitude reached approximately 50% of each participant’s Hmax. This method for determining stimulus intensity has been used in many previous studies that examined the relationships between H-reflex amplitude and various psychological variables [15,18]. Mean intensity across all participants was 8.08 mA (standard deviation = 3.91, range 3.8–14.3 mA). Heart rate (HR) was measured using a transmitter attached to each participant’s chest (CE0537 N2965, Polar Electro, Kempele, Finland) and a wireless receiver placed in front of participant (MLAC35/ST, Polar Electro, Kempele, Finland).
2.4. Procedure
Participants performed 20 practice trials (two blocks of 10 trials each) in order to familiarize themselves with the reaction time task and experimental setting. In all practice trials, TMS or electrical stimulation of the tibial nerve were administered because participants also needed to familiarize themselves with TMS administration and electrical stimulation during the task. Following practice, participants performed 40 test trials (four blocks of 10 trials each). These four blocks, two non-pressure and two pressure blocks, were administered in a counterbalanced order. The two blocks in each non-pressure or pressure condition consisted of one TMS administration block (TMS block) and one electrical stimulation block (H-reflex block). TMS and H-reflex block order was also counterbalanced across participants. The ten trials within a block consisted of five randomized Go and five randomized Catch trials. TMS and electrical stimulation timing were fixed for all trials. The timing of stimulation occurred one second after the WS (i.e., the midpoint between the WS and IS). No feedback about reaction times was provided during the test trials, although such feedback was provided during the practice block.
The two induced pressure conditions differed as a function of the instructions that participants received. Prior to the first pressure block, participants received 1000 JPY as a reward for participation in the experiment. In order to create pressure, the following instructions were given prior to the two pressure blocks: “In the five Go trials in the next block, if your RT is faster than the fastest RT among the 20 practice trials on two or more occasions, I will give you an extra 2000 JPY as a reward. If your RT is faster than the fastest RT on only one occasion, your reward will be 1000 JPY, and if your RT is not faster, you will lose the reward”. During the non-pressure blocks, participants were instructed to respond as quickly as possible only during the Go trials, such that faster RTs were recorded compared with the fastest RT on any of the practice trials. In this study, a combination of psychological stressors, namely, reward and penalty, was used to induce stress responses that were as strong as possible. Many previous studies have used compound psychological stressors to induce greater stress responses [5,6,7,12,13].
Before and after the 60 experimental trials (20 practice and 40 test trials), the maximum EMG amplitudes of both the SOL and TA muscles during maximum isometric voluntary contraction (MVC) were measured in the sitting position. MVC of TA was recorded while an ankle angle of approximately 70° was maintained as the experimenter pushed the participant’s toes downward. MVC of SOL was recorded while an ankle angle of approximately 110° was maintained, in this case as the experimenter pushed the participant’s knee downward.
2.5. Dependent Variables
2.5.1. State Anxiety and Mental Effort
To determine the psychological effects of pressure, subjective state anxiety and mental effort for task performance were measured using the Visual Analog Scale (VAS) [19] prior to each test block. The VAS is a 100 mm straight line ranging from 0 (i.e., not at all, the left end) to 100 (i.e., extremely, the right end). Participants were asked to make a vertical mark on the straight line to indicate the perceived levels of anxiety and mental effort at the moment of anticipating task performance of the following test trials. Subjective state anxiety and mental effort scores were calculated by measuring the distance between the left end and the vertical mark on the VAS. This method to measure state anxiety and mental effort under pressure prior to task execution was used in previous studies, and significant increases in these variables were observed under pressure [4,6,20].
2.5.2. Heart Rate
As an index of physiological arousal during non-pressure and pressure trials, heart rate was recorded from 4 s before the WS. We calculated the heart rate (bpm) from 4 s before WS to the IS (i.e., a 6 s duration) during each trial.
2.5.3. MEP, H-Reflex, and EMG Amplitudes
For the SOL and TA, the MEP amplitudes (peak-to-peak) induced by TMS were calculated for each trial. Peak-to-peak amplitudes for H-wave activity of the SOL for each stimulus were calculated. However, the TA H-wave could not be assessed due to measurement difficulties. Averaged MEP and H-reflex amplitudes across 10 trials (five go and five catch trials) were calculated for each participant, in both non-pressure and pressure conditions. EMG activities for both the SOL and TA muscles during non-pressure and pressure trials were calculated and standardized in order to reduce inter-participant variability, in the form of ratios (%MVC) between EMG amplitude during the trial and MVC from the rectified EMG data of the SOL and TA. MVC was calculated from the largest average amplitude of the 100 ms duration during maximum contraction for each participant. Averaged background EMG amplitude (bEMG) was calculated for a duration of 100 ms before TMS or electrical stimulation. As an index of EMG activity during the RT task, the maximum single data point EMG from the IS to the time that the participant’s foot released the switch in each Go trial was calculated. Co-contraction rate between SOL and TA was calculated using the following formula based on standardized full time %MVC EMG waveforms [21]:
Co-contraction rate = {(integrated co-activation area between SOL and TA) × 2}/(integrated area of SOL + integrated area of TA) × 100
2.5.4. Task Performance
As an index of reaction time task performance, durations from the IS to the time that the foot released the switch were recorded as RT data with a sampling frequency of 2000 Hz (see Figure 1).
2.6. Statistical Analysis
For subjective state anxiety and mental effort scores, HR, all EMG variables, and RTs, Wilcoxon signed-rank tests were used to analyze differences between non-pressure and pressure conditions. Due to the small sample size, non-parametric tests were used. The significance level for all analyses was set at a p-value of less than 0.05. Tests to analyze state anxiety, mental effort, MEP, and EMG were all one-tailed, because many previous studies of upper limb movement have found that these variables increase under pressure [6,7,10,11,12,13]. The tests for other variables were two-tailed. To measure effect size, r-values (r = |Z|/√N) were also calculated for all tests. Values of 0.10, 0.30, and 0.50 for r indicate small, medium, and large effect sizes, respectively [22]. For the H-reflex, the data from eight participants were analyzed, with data from two participants being excluded due to recording difficulties. In addition, one participant marked VAS anxiety scores of 0 for all trials in both the non-pressure and pressure conditions, while having a VAS effort score of 100 for all trials in both conditions. This participant’s VAS data were removed from the VAS scores analyses.
3. Results
3.1. Pressure Manipulation Check
Table 1 shows the means and standard errors for task-related subjective state anxiety and mental effort as well as HR during the motor preparation phase. Wilcoxon signed-rank test results indicated that there were significant increases in state anxiety (Wilcoxon Z = −2.19, p = 0.014, r = 0.730), mental effort (Wilcoxon Z = −2.67, p = 0.004, r = 0.890), and HR (Wilcoxon Z = −2.29, p = 0.011, r = 0.724) from the non-pressure to the pressure condition.

Table 1.
Means and standard errors for subjective state anxiety, mental effort, and heart rate in the non-pressure and pressure conditions.
3.2. MEP, H-Reflex, and bEMG during Motor Preparation Phase
Figure 3 illustrates superimposed MEP and H-reflex waveforms from the SOL and TA, recorded from one participant. As shown in Figure 2, MEP amplitude increased from the non-pressure to the pressure condition only for the TA. Table 2 shows the means and standard errors for MEP, H-reflex, and bEMG amplitudes. Although SOL MEP and H-reflex amplitudes showed no significant differences (p-values > 0.327, r-values < 0.346), TA MEP amplitude increased significantly from the non-pressure to the pressure condition (Wilcoxon Z = −2.35, p = 0.010, r = 0.743). For bEMG amplitudes immediately prior to evoking the MEP or H-reflex in both the SOL and TA, there was no significant difference between conditions for SOL bEMG in the H-reflex block (p = 0.288, r = 0.198). However, SOL bEMG in the TMS block increased significantly from the non-pressure to the pressure condition (Wilcoxon Z = −2.24, p = 0.013, r = 0.708), and this also held true for TA bEMG in the TMS block (Wilcoxon Z = −1.78, p = 0.037, r = 0.563).
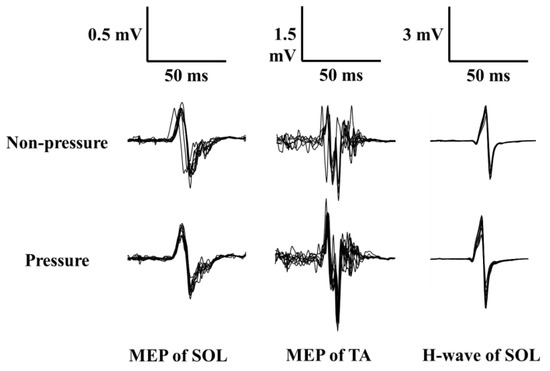
Figure 3.
Superimposed MEP and H waveforms of 10 trials recorded from one participant during the non-pressure condition (upper waveforms) and pressure condition (lower waveforms). (Note: SOL = soleus; TA = tibialis anterior; MEP = motor evoked potential; H-wave = Hoffmann-wave).
Table 2.
Means and standard errors for subjective MEP, H-reflex, and bEMG amplitudes in the non-pressure and pressure conditions.
Because changes in TA MEP amplitude under pressure may be dependent upon increased TA EMG activity, further analysis was conducted for the ratio of TA MEP amplitude to TA bEMG (MEP amplitude/bEMG) in both conditions. This index also showed a significant increase from the non-pressure condition (mean ± SE = 0.87 ± 0.25) to the pressure condition (1.16 ± 0.46) (Wilcoxon Z = −1.74, p = 0.041, r = 0.550). This result indicates that increased MEP amplitude in the pressure condition was not due to increased background muscular activity.
3.3. EMG Amplitude and Reaction Time during Task Execution Phase
Table 3 shows the means and standard errors for maximum EMG amplitudes of the SOL and TA, co-contraction rate between SOL and TA, and task RTs. Wilcoxon signed-rank tests showed that EMG amplitude for SOL (Wilcoxon Z = −2.40, p = 0.009, r = 0.759) and TA (Wilcoxon Z = −1.79, p = 0.037, r = 0.566) increased. Co-contraction rate (Wilcoxon Z = −2.09, p = 0.018, r = 0.661) also increased significantly from the non-pressure to the pressure condition. RTs showed no significant change (p = 0.575, r = 0.177). All participants responded correctly during all test go trials and did not respond during any test catch trials.
Table 3.
Means and standard errors for SOL and TA maximum EMG amplitudes, co-contraction, and RT in the non-pressure and pressure conditions.
4. Discussion
Subjective state anxiety, mental effort, and HR were measured in this study to validate the pressure manipulation used here. These variables all significantly increased from the non-pressure to the pressure condition, indicating that the pressure manipulation used in this study induced both psychological and physiological stress responses in participants and that the manipulation of pressure was therefore effective. Nonetheless, the mean increase in HR was approximately 3 bpm. The HR of piano players is approximately 35 bpm higher during competitive situations in front of an audience [11]. It can therefore be concluded that the stress induced in this study was at a relatively low level. However, along with such manifestations of a low-grade stress response, changes in neurophysiological functions were observed in this study.
The first purpose of the present study was to independently investigate changes in corticospinal excitability and spinal reflex under pressure. The hypothesis that increased MEP amplitudes for both SOL and TA would be observed under pressure was partially supported, given that only TA MEP amplitude significantly increased from the non-pressure to the pressure condition, whereas SOL MEP amplitude went unchanged under pressure. There are two possible explanations of this MEP difference between the TA and SOL muscles. First, muscle-specific differences might be caused by stronger cortical control of the TA compared with the SOL [23]. Due to this stronger cortical control, it could be surmised that only TA corticospinal excitability is readily influenced by psychological factors, namely, pressure.
The second possibility might pertain to agonist/antagonist limb movement pattern. Corticospinal excitability might not be influenced from the control region of the lower-limb agonist muscle but instead be enhanced via the antagonist during motor preparation. Previous studies have reported that corticospinal excitability associated with controlling the finger muscles was facilitated in both the synergist muscle and those not directly involved in the task under pressure, whereas no MEP changes were found for the agonist muscle [6,13]. It might therefore be suggested that corticospinal excitability of the control region of the antagonist (compared with the agonist) is easily influenced by psychological pressure. Future research could test these potential explanations by examining dorsiflexion movement of the ankle joint, during which the TA functions as agonist while the SOL functions as antagonist.
It would be reasonable to propose that enhancement of corticospinal excitation under pressure is the product of inter- and intra-cortical neural connectivity. It has been pointed out that increased corticospinal excitability under pressure may be associated with pressure-related psychological and physiological changes in domains such as attention, affect, and arousal level [6,7,13]. According to EEG studies that have investigated CNS responding during motor tasks under pressure, ERP P3 amplitudes at the mid-central (Cz) and mid-parietal (Pz) sites were reduced under pressure during performance of a dual-task involving quickly responding to visual cues during simulated driving [2]. In addition, increased alpha frequency band coherences between mid-frontal (Fz) and other cortical regions were observed during a golf-putting task [4] and a pistol shooting task under pressure [5]. These results also support the possibility that inter-cortical neural communications related to motor planning, affect, attention, and perception serve to modulate commands within the primary motor area or from other downstream sub-cortical regions such as the basal ganglia and the brain stem.
From the viewpoint of intra-cortical neural communication of the primary motor area, it is possible that both intracortical inhibition and intracortical facilitation might be related to increased corticospinal excitability under pressure, as indicated using voluntary hand movement [13]. However, it has been reported that there are fewer inhibitory circuits in the leg area of the motor cortex compared to the hand motor area, given that leg movements require more gross motor function, whereas hand actions require more precise and fine movements [24,25,26]. Future investigations could use the paired-pulse TMS technique to assess intracortical inhibition and facilitation under pressure in foot or leg movements.
In addition to investigating corticospinal excitability, we also examined the effects of psychological pressure on agonist and antagonist EMG excitations (including co-contraction) and leg movement reaction times. In terms of maximum EMG amplitude during the trials, SOL EMG amplitude for all participants was greater in the pressure than in the non-pressure condition. TA EMG amplitude also showed a significant increase from non-pressure to pressure, with co-contraction rate showing a corresponding increment. Previous studies have reported that upper limb muscular activities were enhanced during some fine motor tasks performed under pressure [11,12]. It has been suggested that increased co-contractions observed in upper limb reaching tasks under perturbation are effective for rapid movement and motor inhibition [27]. A similar function might be observed for upper and lower limb movement under psychological pressure.
Despite such corticospinal and EMG excitation under pressure, no significant difference between the non-pressure and pressure conditions was found for task RTs, a performance index. This result indicates that the neurophysiological changes observed in this study did not lead to performance facilitation (clutch) or decrement (choking) under pressure. In prior studies, increased MEP and EMG amplitude during a reaction time task led to faster RTs after participants viewed unpleasant emotional pictures [28] and heard unpleasant auditory stimuli [29,30,31]. These findings suggest that modulations of neurophysiological function via emotional responses led to enhanced motor performance. Contrary to these previous findings, the present result might suggest that pressure resulted in the generation of inefficient neurophysiological activity (i.e., higher corticospinal and EMG excitation) during motor performance (i.e., no changes in RT).
In terms of spinal reflex contributions, the prediction that reduced SOL H-reflex amplitude would occur under pressure was not supported despite the previous finding that SOL H-reflex amplitude decreased during a postural control task under psychological pressure [20]. This discrepancy would be dependent on motor task type and intensity of stress response. The HR increment under pressure in Tanaka’s study was approximately 21 bpm, although the increment was only 3 bpm in the present study. In addition, Tanaka’s study employed a postural control task on a balance disk while the present study used an RT task that required quick responses. Because it has been understood that reduced H-reflex excitability during postural control task motor learning represents adaptive neural changes to aid postural control during task performance [32,33,34,35], further work is needed to examine spinal reflex functioning under pressure, with due consideration of motor task type and intensity of stress response evoked.
This study provides the first evidence that corticospinal excitability and EMG activity controlling leg muscles homogeneously increase during lower limb movement tasks performed under psychological pressure. The present results do suggest some implications for mental health. In short, an accumulation of increased cortical excitability and muscular activity along with acute psychological stress in daily life would lead to chronic stress. It might be speculated that such chronic stress is associated with reduced vitality and mental health scores on the SF-36 (MOS Short-Form 36-Item Health Survey) [36,37,38].
However, these findings are constrained by certain limitations, one major limitation being the small sample size of the study. Nevertheless, corticospinal and EMG excitabilities under pressure were demonstrated despite the small sample size. It is expected that the findings of this study would be relevant across several scientific fields such as sport science, psychology, and neuroscience. The second limitation concerns intensity of stress response in both non-pressure and pressure conditions. A subtle increase in stress response was observed in the pressure relative to the non-pressure condition. During the non-pressure condition, it might be reasonable to assume that psychological stress was induced by unfamiliar experimental settings such as the magnetic and electrical stimuli to evoke MEP and the H-reflex. In future studies, it would be useful to measure resting heart rate in addition to heart rate during non-pressure and pressure conditions. Moreover, motivational state should be measured via questionnaire because such motivation to obtain a monetary reward might relate to stress responses in the pressure condition. There is a thought to be an inverted-U shaped relationship between physiological arousal and motor performance under pressure [39], and it will be necessary to further examine motor control mechanisms under a higher level of stress in the pressure condition. Finally, only males participated in this study to avoid potential ethical complications. It has been reported that females have larger MEP variability than males [40]. Future studies should recruit not only male but also female participants.
Acknowledgments
This work was supported by a Grant-in-Aid for Young Scientists (B) (No. 25750290) and Scientific Research (C) (No. 16K01686) from the Japan Society for the Promotion of Science (JSPS) KAKENHI. The funders had no role in the study design, data collection and analysis, decision to publish, or preparation of the manuscript.
Author Contributions
Yoshifumi Tanaka conceived and designed the experiments; Yoshifumi Tanaka and Tatsunori Shimo performed the experiments; Yoshifumi Tanaka and Tatsunori Shimo analyzed the data; and Yoshifumi Tanaka wrote the paper.
Conflicts of Interest
The authors declare no conflict of interest. The founding sponsors had no role in the design of the study; in the collection, analyses, or interpretation of data; in the writing of the manuscript, and in the decision to publish the results.
References
- Baumeister, R.F. Choking under pressure: Self-consciousness and paradoxical effects of incentives on skillful performance. J. Pers. Soc. Psychol. 1984, 46, 610–620. [Google Scholar] [CrossRef] [PubMed]
- Murray, N.P.; Janelle, C.M. Event-related potential evidence for the processing efficiency theory. J. Sports Sci. 2007, 25, 161–171. [Google Scholar] [CrossRef] [PubMed]
- Rietschel, J.C.; Goodman, R.N.; King, B.R.; Lo, L.C.; Contreras-Vidal, J.L.; Hatfield, B.D. Cerebral cortical dynamics and the quality of motor behavior during social evaluative challenge. Psychophysiology 2011, 48, 479–487. [Google Scholar] [CrossRef] [PubMed]
- Zhu, F.F.; Poolton, J.M.; Wilson, M.R.; Maxwell, J.P.; Masters, R.S.W. Neural co-activation as a yardstick of implicit motor learning and the propensity for conscious control of movement. Biol. Psychol. 2011, 87, 66–73. [Google Scholar] [CrossRef] [PubMed]
- Hatfield, B.D.; Costanzo, M.E.; Goodman, R.N.; Lo, L.C.; Oh, H.; Rietschel, J.C.; Saffer, M.; Bradberry, T.; Contreras-Vidal, J.; Haufler, A. The influence of social evaluation on cerebral cortical activity and motor performance: A study of “Real-Life” competition. Int. J. Psychophysiol. 2013, 90, 240–249. [Google Scholar] [CrossRef] [PubMed]
- Tanaka, Y.; Funase, K.; Sekiya, H.; Sasaki, J.; Tanaka, Y.M. Psychological pressure facilitates corticospinal excitability: Motor preparation processes and EMG activity in a choice reaction task. Int. J. Sport Exerc. Psychol. 2014, 12, 287–301. [Google Scholar] [CrossRef]
- Tanaka, Y.; Funase, K.; Sekiya, H.; Murayama, T. Modulation of corticospinal motor tract excitability during a fine finger movement under psychological pressure: A TMS study. Int. J. Sport Health Sci. 2012, 10, 39–49. [Google Scholar] [CrossRef]
- Rollnik, J.D.; Schubert, M.; Dengler, R. Effects of a competitive stressor on motor cortex excitability: A pilot study. Stress. Med. 2000, 16, 49–54. [Google Scholar] [CrossRef]
- Cooke, A.; Kavussanu, M.; McIntyre, D.; Ring, C. Effects of competition on endurance performance and the underlying psychological and physiological mechanisms. Biol. Psychol. 2011, 86, 370–378. [Google Scholar] [CrossRef] [PubMed]
- Yoshie, M.; Kudo, K.; Ohtsuki, T. Effects of psychological stress on state anxiety, electromyographic activity, and arpeggio performance in pianists. Med. Probl. Perform. Art. 2008, 23, 120–132. [Google Scholar]
- Yoshie, M.; Kudo, K.; Murakoshi, T.; Ohtsuki, T. Music performance anxiety in skilled pianists: Effects of social-evaluative performance situation on subjective, autonomic, and electromyographic reactions. Exp. Brain Res. 2009, 199, 117–126. [Google Scholar] [CrossRef] [PubMed]
- Cooke, A.; Kavussanu, M.; McIntyre, D.; Ring, C. Psychological, muscular and kinematic factors mediate performance under pressure. Psychophysiology 2010, 47, 1109–1118. [Google Scholar] [CrossRef] [PubMed]
- Tanaka, Y.; Funase, K.; Sekiya, H.; Sasaki, J.; Takemoto, T. Multiple EMG activity and intracortical inhibition and facilitation during a fine finger movement under pressure. J. Mot. Behav. 2011, 43, 73–81. [Google Scholar] [CrossRef] [PubMed]
- Sibley, K.M.; Carpenter, M.G.; Perry, J.C.; Frank, J.S. Effects of postural anxiety on the soleus H-reflex. Hum. Mov. Sci. 2007, 26, 103–112. [Google Scholar] [CrossRef] [PubMed]
- Hoffman, M.A.; Koceja, D.M. The effects of vision and task complexity on Hoffmann reflex gain. Brain Res. 1995, 700, 303–307. [Google Scholar] [CrossRef]
- Elias, L.J.; Bryden, M.P. Footedness is a better predictor of language lateralization that handedness. Laterality 1998, 3, 41–51. [Google Scholar] [PubMed]
- Rossini, P.M.; Barker, A.T.; Berardelli, A.; Caramia, M.D.; Caruso, G.; Cracco, R.Q.; Dimitrijević, M.R.; Hallett, M.; Katayama, Y.; Lücking, C.H.; et al. Non-invasive electrical and magnetic stimulation of the brain, spinal cord and roots: Basic principles and procedures for routine clinical application. Report of an IFCN committee. Electroencephalogr. Clin. Neurophysiol. 1994, 91, 79–92. [Google Scholar] [CrossRef]
- Mynark, R.G.; Koceja, D.M. Comparison of soleus H-reflex gain from prone to standing in dancers and controls. Electroencephalogr. Clin. Neurophysiol. 1997, 105, 135–140. [Google Scholar] [CrossRef]
- Cella, D.F.; Perry, S.W. Reliability and concurrent validity of three visual-analogue mood scales. Psychol. Rep. 1986, 59, 827–833. [Google Scholar] [CrossRef] [PubMed]
- Tanaka, Y. Spinal reflexes during postural control under psychological pressure. Motor Control 2015, 19, 242–249. [Google Scholar] [CrossRef] [PubMed]
- Winter, D.A. Biomechanics and Motor Control of Human Movement, 5th ed.; Wiley: Hoboken, NJ, USA, 2009. [Google Scholar]
- Field, A. Discovering Statistics Using SPSS, 4th ed.; Sage Publications: London, UK, 2013. [Google Scholar]
- Yang, F.A.; Gorassini, M. Spinal and brain control of human walking: Implications for retraining of walking. Neuroscientist 2006, 12, 379–389. [Google Scholar] [CrossRef] [PubMed]
- Matsumura, M.; Sawaguchi, T.; Oishi, T.; Ueki, K.; Kubota, K. Behavioral deficits induced by local injection of bicuculline and muscimol into the primate motor and premotor cortex. J. Neurophysiol. 1991, 65, 1542–1553. [Google Scholar] [PubMed]
- Tokimura, H.; Di Lazzaro, V.; Tokimura, Y.; Oliviero, A.; Profice, P.; Insola, A.; Mazzone, P.; Tonali, P.; Rothwell, J.C. Short-latency inhibition of human motor cortex by somatosensory input from the hand. J. Physiol. 2000, 523, 503–513. [Google Scholar] [CrossRef] [PubMed]
- Hallett, M. Surround inhibition. Suppl. Clin. Neurophysiol. 2003, 56, 153–159. [Google Scholar] [PubMed]
- Osu, R.; Franklin, D.W.; Kato, H.; Gomi, H.; Domen, K.; Yoshioka, T.; Kawato, M. Short- and long-term changes in joint co-contraction associated with motor learning as revealed from surface EMG. J. Neurophysiol. 2002, 88, 991–1004. [Google Scholar] [PubMed]
- Coombes, S.A.; Tandonnet, C.; Fujiyama, H.; Janelle, C.M.; Cauraugh, J.H.; Summers, J.J. Emotion and motor preparation: A transcranial magnetic stimulation study of corticospinal motor tract excitability. Cogn. Affect. Behav. Neurosci. 2009, 9, 380–388. [Google Scholar] [CrossRef] [PubMed]
- Vall-Solé, J.; Rothwell, J.C.; Goulart, F.; Cossu, G.; Muňoz, E. Patterned ballistic movements triggered by a startle in healthy humans. J. Physiol. 1999, 516, 931–938. [Google Scholar] [CrossRef]
- Siegmund, G.P.; Inglis, J.T.; Sanderson, D.J. Startle response of human neck muscles sculpted by readiness to perform ballistic head movements. J. Physiol. 2001, 535, 289–300. [Google Scholar] [CrossRef] [PubMed]
- Nijhus, L.B.O.; Janssen, L.; Bloem, B.R.; van Dijk, J.G.; Gielen, S.C.; Borm, G.F.; Overeem, S. Choice reaction times for human head rotations are shortened by startling acoustic stimuli, irrespective of stimulus direction. J. Physiol. 2007, 584, 97–109. [Google Scholar] [CrossRef] [PubMed]
- Koceja, D.M.; Burke, J.R.; Kamen, G. Organization of segmental reflexes in trained dancers. Int. J. Sports Med. 1991, 12, 285–289. [Google Scholar] [CrossRef] [PubMed]
- Nielsen, J.; Crone, C.; Hultborn, H. H-reflexes are smaller in dancers from The Royal Danish Ballet than in well-trained athletes. Eur. J. Appl. Physiol. Occup. Physiol. 1993, 66, 116–121. [Google Scholar] [CrossRef] [PubMed]
- Trimble, M.H.; Koceja, D.M. Modulation of the triceps surae H-reflex with training. Int. J. Neurosci. 1994, 76, 293–303. [Google Scholar] [CrossRef] [PubMed]
- Mynark, R.G.; Koceja, D.M. Down training of the elderly soleus H reflex with the use of a spinally induced balance perturbation. J. Appl. Physiol. 2002, 93, 127–133. [Google Scholar] [CrossRef] [PubMed]
- Ware, J.E.; Sherboune, C.D. The MOS 36-item Short-Form Health Survey (SF-36): I. Conceptual framework and item selection. Med. Care 1992, 30, 473–489. [Google Scholar] [CrossRef] [PubMed]
- Mchorney, C.A.; Ware, J.E.; Raczek, A.E. The MOS 36-item Short-Form Health Survey (SF-36): II. Psychometric and clinical tests of validity in measuring physical and mental health constructs. Med. Care 1994, 31, 247–263. [Google Scholar] [CrossRef]
- Mchorney, C.A.; Ware, J.E.; Raczek, A.E. The MOS 36-item Short-Form Health Survey (SF-36): III. Tests of data quality, scaling assumptions, and reliability across diverse patient groups. Med. Care 1994, 32, 40–66. [Google Scholar] [CrossRef] [PubMed]
- Martens, R.; Landers, D.M. Motor performance under stress: A test of the inverted-U hypothesis. J. Pers. Soc. Psychol. 1970, 16, 29–37. [Google Scholar] [CrossRef] [PubMed]
- Pitcher, J.B.; Ogston, K.M.; Miles, T.S. Age and sex differences in human motor cortex input–output characteristics. J. Physiol. 2003, 546, 605–613. [Google Scholar] [CrossRef] [PubMed]


© 2017 by the authors. Licensee MDPI, Basel, Switzerland. This article is an open access article distributed under the terms and conditions of the Creative Commons Attribution (CC BY) license (http://creativecommons.org/licenses/by/4.0/).