Review

Optimizing Athletic Performance: A Systems Framework for Adaptive Training, Load Management, and Decision-Making


by
Dan Cristian Mănescu
,
Cristina Filip
*,
Cristina Ionela Nae
* and
Rela Valentina Ciomag
Department of Sport and Physical Education, Bucharest University of Economic Studies, 010374 Bucharest, Romania
*
Authors to whom correspondence should be addressed.
J. Funct. Morphol. Kinesiol. 2026, 11(3), 245; https://doi.org/10.3390/jfmk11030245
Submission received: 8 May 2026 / Revised: 16 June 2026 / Accepted: 19 June 2026 / Published: 23 June 2026

Abstract

Although athlete monitoring can quantify training exposure and athlete status with increasing detail, conversion into daily training decisions remains inconsistent. This structured narrative review synthesizes evidence on training load, neuromuscular readiness, recovery, fatigue interpretation, measurement reliability, applied decision-making, and proposes the LOAD-R framework: a systems model linking Load, Organism response, Adaptive state, Decision, and Re-evaluation. A transparent non-PRISMA strategy was used because the aim was conceptual integration and framework development rather than effect-size pooling. Evidence was organized around field-applicable monitoring domains and their decision value. LOAD-R builds on existing monitoring approaches by organizing single indicators, fixed thresholds, and dashboard alerts into an explicit interpretation-to-action sequence. It classifies athlete state into adaptive, functional-overload, underloaded, uncertain, or maladaptive zones, each linked to progress, maintain, modify, deload, or recover decisions. The framework also provides implementation levels and testable predictions. By framing monitoring as adaptive decision support rather than passive data collection, LOAD-R may improve decision consistency, reduce maladaptive training responses, and enhance the practical value of athlete monitoring in applied sport settings.

1. Introduction

Contemporary athlete monitoring has moved from specialist laboratories into routine coaching practice. External-load systems, session rating of perceived exertion (sRPE), wellness questionnaires, heart-rate-derived markers, countermovement-jump (CMJ) testing, and wearable technologies can now describe both training exposure and athlete response with high temporal density. Yet measurement capacity is not the same as decision quality: monitoring improves practice only when it changes what coaches do, when they do it, and how strongly they adjust training [1,2,3,4,5,6,7,8,9,10,11,12,13,14].
This distinction is central because adaptation depends on the interaction between the imposed stimulus and the athlete’s current response capacity. The same workload may be productive, insufficient, or excessive according to sleep, soreness, autonomic status, recent load trajectory, injury history, competitive phase, and psychological or environmental stress. The same readiness score may also imply different actions in maximal-strength, sprint-power, endurance, or congested team-sport contexts [15,16,17,18,19,20,21,22].
In applied settings, monitoring data are usually managed through a recurring workflow. External-load information is captured during or immediately after training; internal-load and session-difficulty information are commonly collected shortly after the session; readiness, wellness, sleep, soreness, and autonomic markers are often reviewed before the next training exposure or on the following morning; and performance quality is checked during key sessions or across the microcycle. These signals are then interpreted against individual baselines, measurement reliability, recent load trajectory, injury or illness status, competition timing, and coach observations before being translated into training modification. The weak point is often not data collection itself, but the lack of an explicit rule for combining these layers, selecting a proportional action, and re-evaluating whether that action improved readiness, performance, or training tolerance.
A further limitation is interpretative fragmentation. Training load, fatigue, readiness, and injury risk are often interpreted through isolated indicators, such as week-to-week load changes or acute-to-chronic workload ratios. Such tools can summarize exposure, but they become weaker when used as universal thresholds, detached from reliability, measurement error, context, and individual response. Dashboard alerts can also multiply signals without establishing an action hierarchy. The field may therefore benefit from a systems architecture that supports decisions without creating false precision [23,24,25,26,27,28,29,30,31,32,33,34,35].

Research Questions and Aims

To address these gaps, this structured narrative review is guided by six interrelated questions:
Q1. 
Which external and internal load variables are most useful for describing the training stimulus in applied sport settings?
Q2. 
Which readiness, fatigue, recovery, and performance markers are most applicable for field-based decision-making?
Q3. 
Why does athlete monitoring frequently fail to translate into explicit training actions?
Q4. 
How can load, organism response, adaptive state, decision-making, and re-evaluation be integrated into a coherent systems model?
Q5. 
Which practical decision rules can guide training progression, maintenance, modification, deloading, or recovery emphasis?
Q6. 
Which testable predictions emerge from a systems-based model of adaptive training and load management?
The aim of this review is therefore not to produce another catalog of monitoring tools. Its purpose is to synthesize the applied sport-science literature into a practical framework—the LOAD-R model—that connects training load, athlete response, adaptive-state classification, training decisions, and repeated re-evaluation. The specific contribution is to position athlete monitoring as a decision-support process rather than as a data-collection process.
Accordingly, the novelty claimed here is organizational and translational rather than physiological: LOAD-R integrates established monitoring principles into a coach-facing sequence that makes the transition from data interpretation to training action explicit, auditable, and revisable.

2. Methodological and Conceptual Framework

2.1. Methodological Approach

This article was designed as a structured narrative review with a conceptual-framework component. This format was selected because the question spans heterogeneous evidence domains and the intended output is an integrative decision model, not a pooled effect estimate. The review followed established narrative-review quality principles: clear aim, transparent search logic, relevance-based selection, critical synthesis, and explicit conceptual contribution [15].
Literature was searched iteratively in PubMed/MEDLINE, Scopus, Web of Science, SPORTDiscus, and Google Scholar. Searches prioritized work published from January 2010 to April 2026; however, foundational pre-2010 sources were retained when they were necessary for historical or conceptual positioning. Terms were combined across six blocks: training load, athlete monitoring, internal response, neuromuscular readiness, recovery, and decision-making. Key reference lists were also screened.
The decision to prioritize 2010–2026 evidence was intended to capture contemporary athlete-monitoring practice; pre-2010 sources were included where they established key concepts such as fitness-fatigue modeling, perceived exertion, and session-RPE monitoring. Recent 2025–2026 sources were retained only when directly relevant to the manuscript’s conceptual domains and were not used as substitutes for foundational literature.
Evidence was charted against predefined translational themes: external and internal load; athlete-reported status; neuromuscular readiness; autonomic and sleep-related recovery; workload-injury and workload-performance interpretation; reliability and individual response; and field implementation. For each domain, attention was given to study type, athlete population, variables, outcomes, measurement constraints, and actionability.
Inclusion criteria were: (1) relevance to athletes, trained individuals, team sports, individual sports, or structured performance settings; (2) discussion or reporting of load, readiness, recovery, fatigue, performance, injury risk, or adaptation; (3) implications for monitoring interpretation or training prescription; and (4) sufficient detail to inform a decision framework.
Exclusion criteria were clinical rehabilitation without athletic-performance context, physical-activity studies without training relevance, technology-validation papers disconnected from action, animal or molecular-only studies without sport-relevant mechanisms, and papers describing tools without interpretation or decision value.
Study selection proceeded through title/abstract screening, full-text conceptual screening, and backward/forward citation tracking. Because this was a narrative review, the purpose was not exhaustive retrieval, PRISMA flow reporting, formal risk-of-bias scoring, or meta-analysis. The non-PRISMA approach was selected to support conceptual integration across heterogeneous evidence. This approach is appropriate for conceptual synthesis in applied sport science, where evidence is distributed across heterogeneous study designs, monitoring technologies, athlete populations, and outcome measures. Rather than estimating a pooled effect, the objective was to identify convergent principles that could support field-based interpretation and decision-making. Accordingly, studies were not treated as interchangeable units of evidence, but were weighted according to conceptual relevance, ecological validity, methodological quality, and practical actionability.
The iterative search and screening process identified approximately 280–320 potentially relevant records across databases and citation tracking sources. After title/abstract and full-text conceptual screening, approximately 110–140 articles were retained for synthesis based on relevance and decision-making applicability.
Evidence weighting was descriptive and decision-oriented. Consensus statements, systematic reviews, longitudinal monitoring studies, intervention studies, and reliability papers were given greater weight when they directly informed decision logic; cross-sectional, technology-validation, and expert-practice papers were used mainly to clarify measurement feasibility, implementation constraints, or conceptual positioning. No study was treated as providing universal thresholds across all sports.
A representative search strategy included combinations such as: (“training load” OR “athlete monitoring”) AND (“fatigue” OR “readiness” OR “recovery”) AND (“decision-making” OR “performance”).
To improve reproducibility, database-specific search templates were added as follows: PubMed/MEDLINE: (“training load” OR “athlete monitoring” OR “session RPE”) AND (fatigue OR readiness OR recovery OR performance) AND (athlete* OR sport*); Scopus: TITLE-ABS-KEY((“training load” OR “athlete monitoring” OR “internal load” OR “external load”) AND (fatigue OR readiness OR recovery OR “decision-making”) AND (athlete OR sport OR “team sport”)); Web of Science: TS = ((“training load” OR “athlete monitoring” OR “readiness monitoring”) AND (fatigue OR recovery OR performance) AND (sport OR athlete)); SPORTDiscus: (“training load” OR “session RPE” OR “athlete monitoring”) AND (readiness OR fatigue OR recovery OR “load management”); Google Scholar: “athlete monitoring” “training load” readiness recovery “decision-making”; the first 100 results were screened because relevance declined substantially beyond that point.
The descriptive retrieval log was: PubMed/MEDLINE, n = 64; Scopus, n = 86; Web of Science, n = 72; SPORTDiscus, n = 43; Google Scholar, n = 100 screened records; and backward/forward citation tracking, n = 31. After duplicate removal, approximately 282 unique records were screened at the title/abstract level; 164 sources were assessed in full-text or full conceptual screening; and 139 sources were retained in the final reference list after the reviewer-requested additions. These numbers are reported to improve transparency, but they should not be interpreted as a PRISMA flow diagram or as evidence of exhaustive retrieval.
While the review was not designed as a systematic or exhaustive retrieval, emphasis was placed on relevance to decision-making, ecological validity, and translational value.
These choices mean that the synthesis is reproducible at the level of search logic, selection rationale, and conceptual weighting, but not in the same way as a systematic review with registered protocol, duplicate screening, and formal risk-of-bias scoring.

2.2. Conceptual Contribution and Positioning

The conceptual contribution is deliberately framed as translational rather than entirely de novo: LOAD-R reorganizes established athlete-monitoring concepts into an explicit decision architecture. LOAD-R is not proposed as a new physiological law, universal threshold system, or replacement for coaching expertise. It links five elements often treated separately: imposed load, organism-level response, inferred adaptive state, training decision, and subsequent re-evaluation.
Relative to existing approaches, LOAD-R adds four decision-facing elements. Compared with fitness-fatigue models, it emphasizes daily field interpretation rather than retrospective performance modeling. Compared with acute-to-chronic workload approaches, it avoids stand-alone load-ratio thresholds and interprets load through response capacity, trajectory, and measurement error. Compared with dashboards, it converts convergent signals into action categories. Compared with generic readiness monitoring, it requires each decision to be checked against subsequent outcomes and used to update the athlete's baseline [16,17,18,19,20].
This distinction is important because prior work already supports individualized monitoring, contextual interpretation, and decision-support logic. LOAD-R is intended to make its sequence operational by requiring each monitoring signal to pass through reliability appraisal, individual baseline comparison, contextual interpretation, action selection, and outcome re-checking before it influences training prescription.
Consequently, the manuscript does not claim that LOAD-R is empirically superior to earlier frameworks at this stage. Its claim is limited to synthesis, operational sequencing, and decision transparency: the model specifies how existing monitoring concepts can be linked to auditable training actions and then tested empirically.
More specifically, existing monitoring cycles emphasize collecting, interpreting, and applying data, but they often leave the action boundary implicit. Fitness-fatigue and performance-modeling approaches describe the relationship between training input and performance output, but they are frequently retrospective or parameter-estimation oriented. Acute-to-chronic workload approaches summarize recent exposure, but they do not by themselves explain whether a given athlete should progress, maintain, modify, deload, or recover on a specific day. Readiness dashboards increase visibility, but may present multiple signals without a hierarchy for reliability, redundancy, context, and outcome checking. LOAD-R therefore advances current practice primarily by converting these established ideas into a state-action-re-evaluation sequence rather than by proposing a new biomarker, ratio, or physiological mechanism.
Its practical advantages are explicitness and auditability: each decision can be traced back to the stimulus, athlete response, adaptive-state interpretation, selected action, and subsequent outcome. Its limitations are equally important: the framework requires local calibration, reliable measurements, sport-specific variable selection, practitioner expertise, and empirical validation before it can be treated as superior to alternative monitoring workflows.
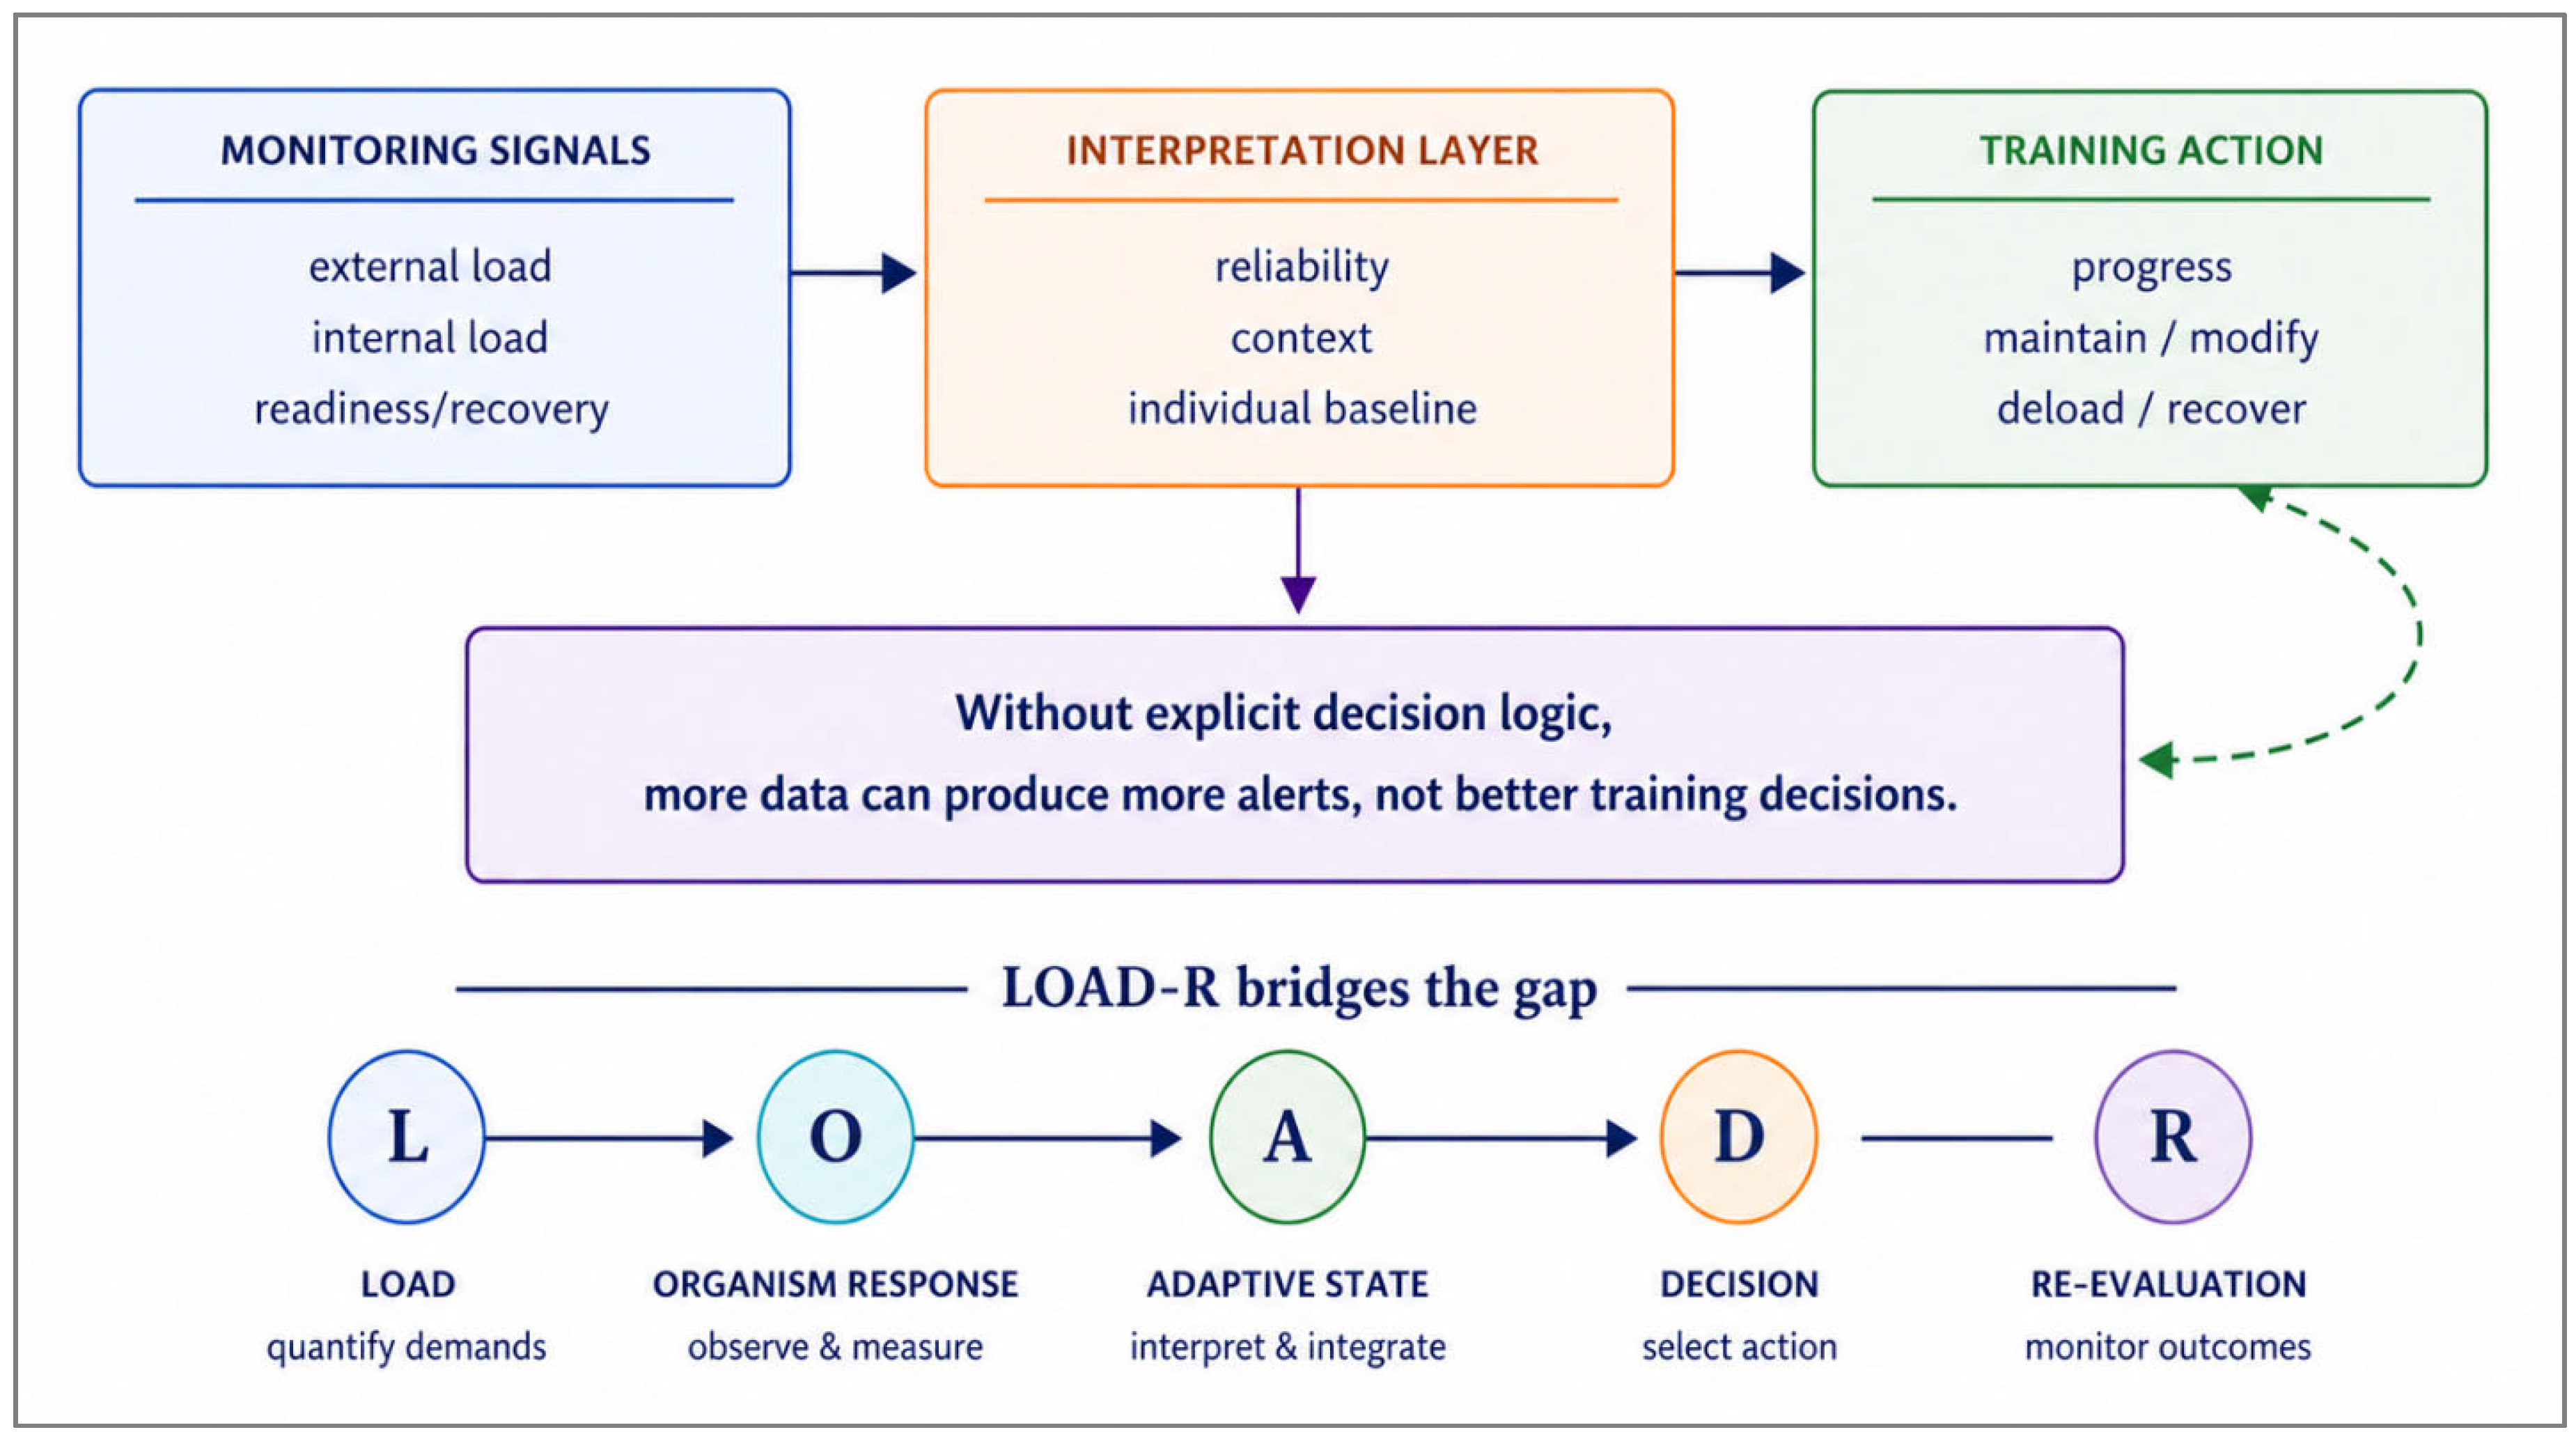
Despite the rapid expansion of athlete-monitoring technologies, the translation of data into consistent and actionable training decisions remains limited. This disconnect between measurement and decision-making represents a central challenge in applied sport science. Figure 1 illustrates this monitoring–decision gap.
The LOAD-R framework was developed to address this gap. Its intended contribution lies not in introducing new monitoring variables, but in structuring a decision-oriented architecture that explicitly connects measurement, interpretation, and action.
Unlike existing approaches that emphasize quantification (e.g., load metrics) or description (e.g., readiness status), LOAD-R formalizes one possible transition from data to decision by integrating adaptive-state classification and feedback-driven re-evaluation into a single operational loop.
In this sense, the framework aims to reposition athlete monitoring as a decision-support process rather than a data-collection process, with explicit links between observed signals and training actions.
To operationalize the LOAD-R framework in applied settings, Table 1 organizes the major evidence domains according to their specific role in the decision-making process.

3. Closing the Monitoring–Decision Gap: Interpreting Data for Action

Monitoring often fails to improve decisions because metrics describe different layers of the training process. External-load variables quantify mechanical or task exposure but not how costly the stimulus was for a given athlete. Internal-load variables describe perceived or physiological strain, but can also reflect sleep, stress, nutrition, illness, emotional load, or environmental conditions. Either domain can mislead when interpreted alone [36,37,38,39,40].
This limitation is magnified in team sports and mixed-method training environments. The same drill can impose different sprint, acceleration, contact, and cognitive demands across players, while similar sRPE values may follow very different mechanical exposures. The relevant question is therefore not whether external or internal load is superior, but whether their convergence, mismatch, and trajectory justify a specific training action [41,42,43,44,45,46].
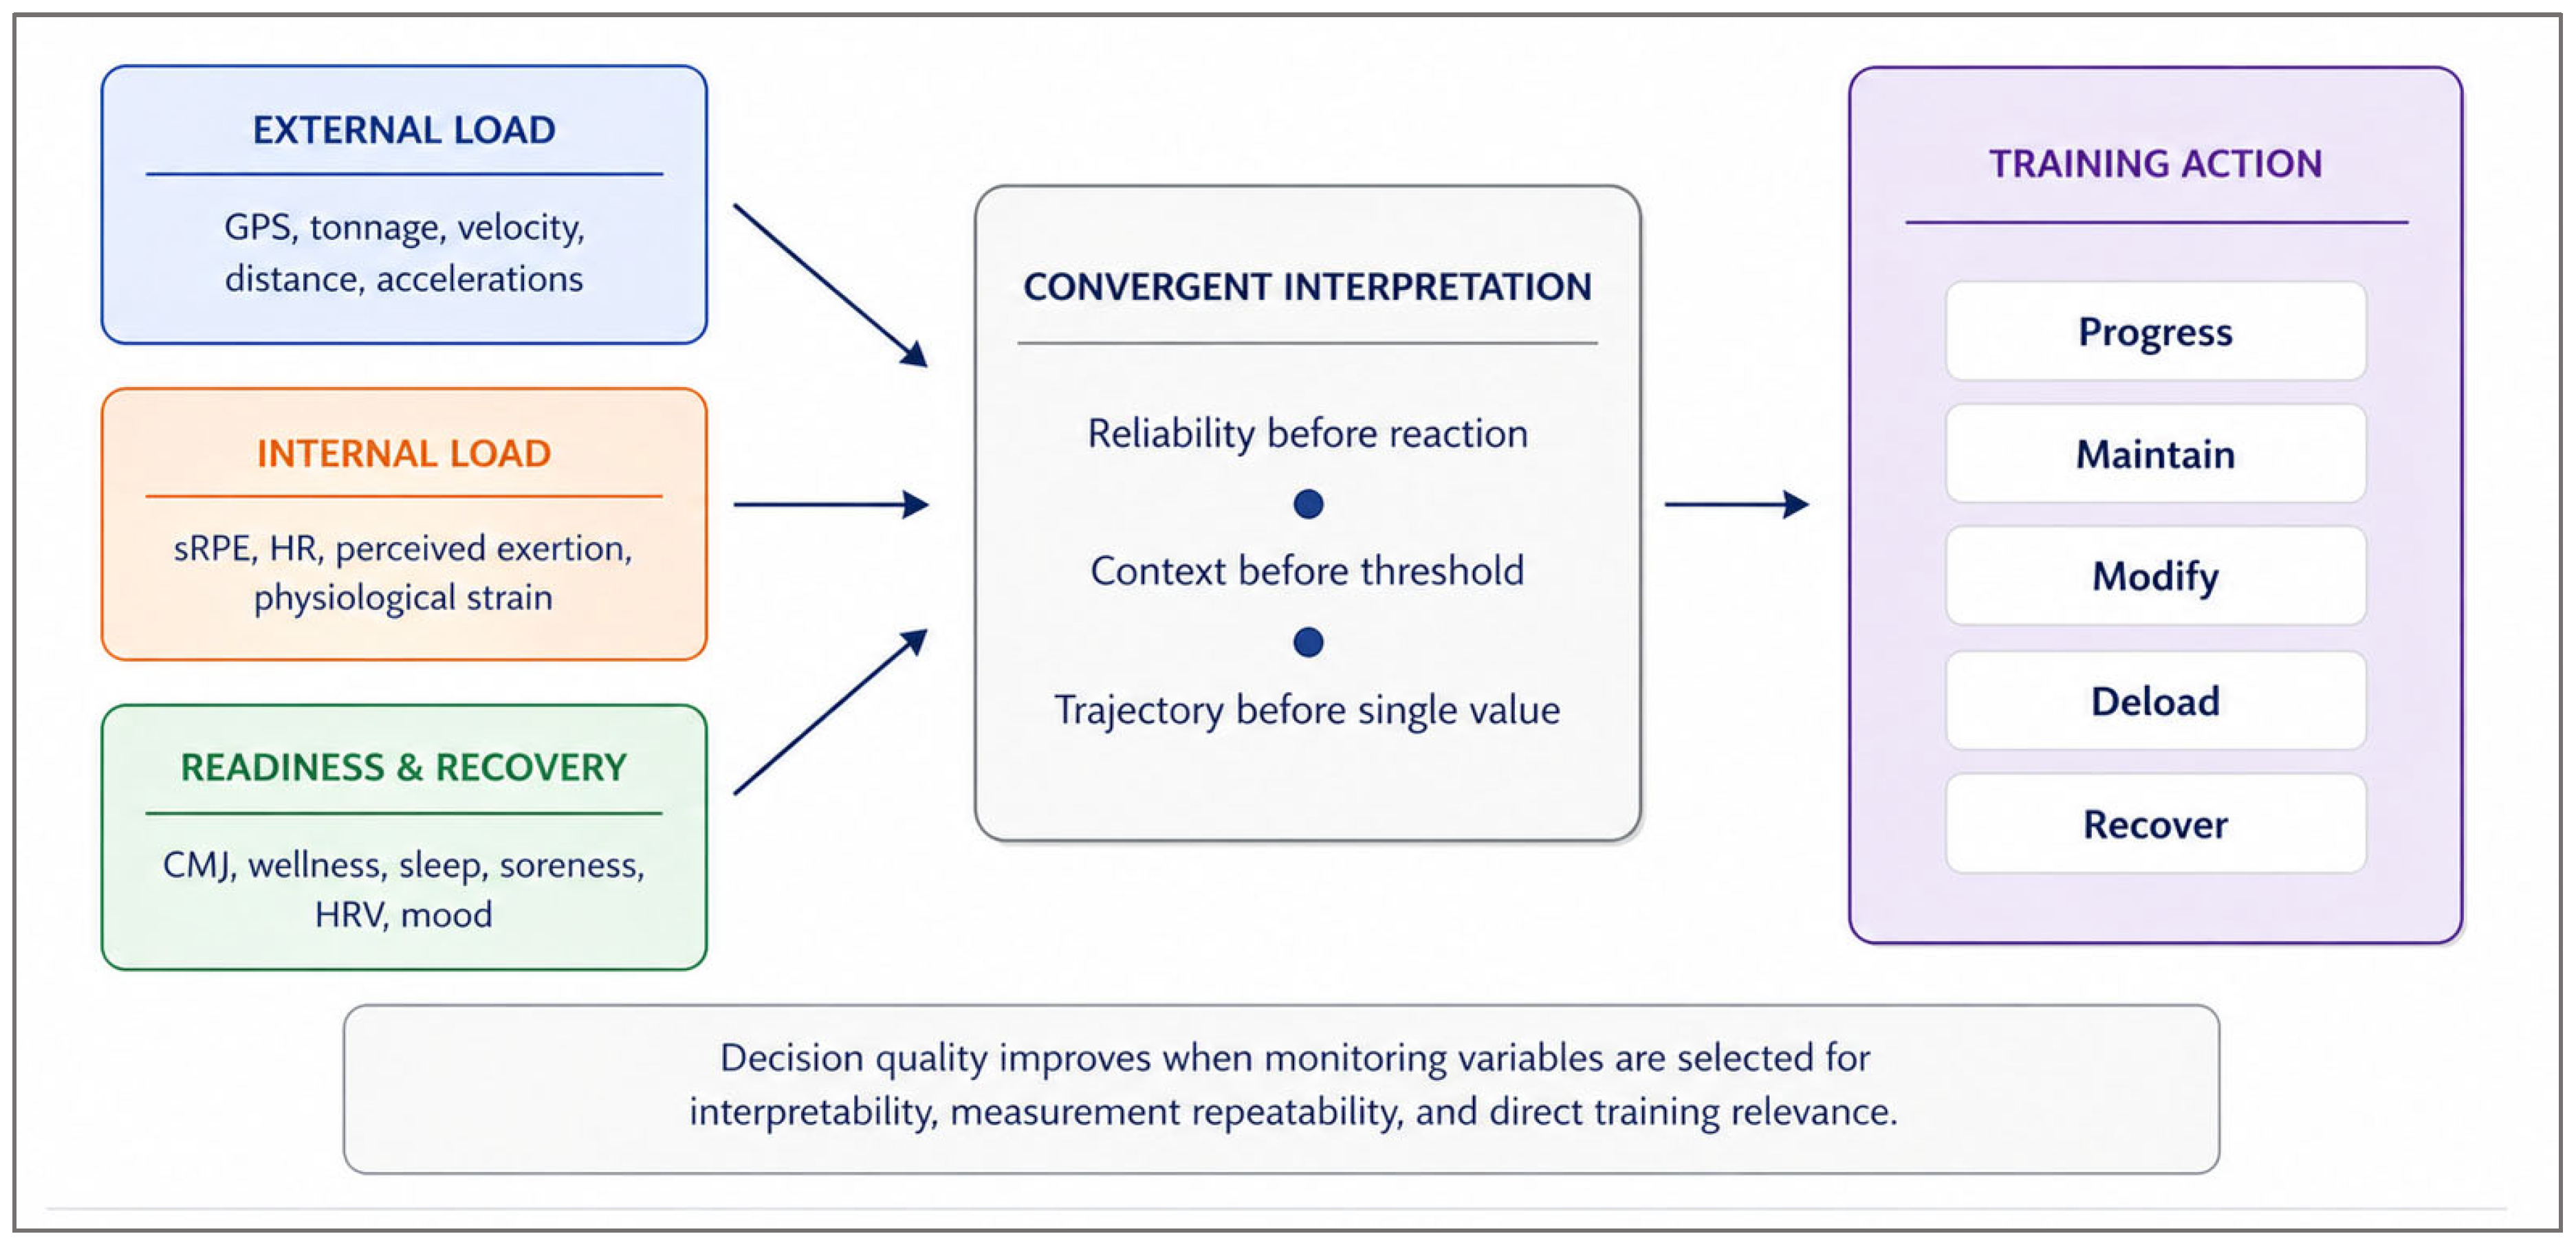
Dashboard inflation can further widen the monitoring–decision gap. When many variables are displayed as traffic-light alerts, practitioners may receive signals without hierarchy. A suppressed marker may reflect true fatigue, normal biological variability, poor testing conditions, or measurement noise. LOAD-R therefore prioritizes signal relevance, trajectory, measurement reliability, and actionability over data abundance; convergence is useful only when markers are reliable, sufficiently non-redundant, and aligned with the sport-specific question.

The Practical Meaning of Internal-External Load Mismatch

Internal-external mismatch is a high-value decision signal when interpreted cautiously. Normal external load with elevated internal strain may indicate hidden fatigue, stress, sleep debt, early illness, poor fueling, or environmental intolerance. High external load with stable internal strain and preserved output may indicate improved tolerance. High load plus high internal strain, suppressed readiness, and declining output suggest the need for protection and recovery [46,47,48,49,50,51,52,53,54,55,56,57,58].
This logic does not remove coaching judgment; it structures it. Practitioners still interpret signals in relation to the training goal, competitive phase, athlete history, and session priority, but the path from observation to action becomes explicit and auditable.
Because external exposure, internal strain, and readiness markers each capture only part of the training process, Figure 2 shows how evidence is filtered through reliability, convergence, and context before becoming a decision.
Following the evidence-to-decision pathway in Figure 2, Table 2 translates monitoring domains into field-applicable variables, interpretations, and minimum implementation requirements.
Terminology in Table 2 distinguishes raw perceived exertion from derived session-load indices. RPE or perceived exertion refers to the athlete’s rating of effort; session RPE describes the post-session RPE score; sRPE-load refers to session RPE multiplied by session duration; and session difficulty can capture a broader qualitative appraisal of how hard or complex the session felt.
This section establishes the interpretative layer required before any LOAD-R decision is made.

4. Monitoring Domains for Adaptive Training

External load: stimulus. External load represents the work performed by the athlete, including distance, high-speed running, accelerations, decelerations, sprint exposure, collisions, resistance-training tonnage, velocity loss, session duration, and training density. It is essential because adaptation requires exposure, but it should be interpreted as stimulus information rather than direct evidence of adaptation [36,37,38,39,40,41,42,43,44,45,59,60,61,62,63,64].
Internal load: the cost of the stimulus. Internal load is the athlete’s physiological and perceptual response to training. RPE-based monitoring remains valuable because it is inexpensive, scalable, and field-compatible, but RPE, session RPE, and sRPE-load should not be used interchangeably. RPE denotes perceived effort, session RPE is usually collected after the session, and sRPE-load is the product of session RPE and session duration. Heart-rate-derived methods add physiological resolution, especially in endurance and conditioning contexts, but may miss high-intensity neuromuscular or contact demands. Subjective measures should therefore be treated as athlete-response data rather than as weak substitutes for technology [46,47,48,49,50,51,52,53,54,65,66,67,68,69,70,71,72,73,74,75,76,77].
In non-professional or low-resource settings, subjective scales require athlete familiarization, clear anchoring, repeated instructions, and periodic checks against observable outputs. When athletes are inexperienced with RPE, the variable should be down-weighted and interpreted with coach observations, session duration, and simple performance markers rather than used as a standalone decision trigger.
Readiness and neuromuscular status. Neuromuscular readiness is especially relevant for speed, power, strength, and collision sports. CMJ-derived variables can detect fatigue or rebound when protocols are standardized and interpreted against individual baselines. In LOAD-R, convergence should be assessed through predefined within-athlete rules rather than impression alone: for example, two or more reliable markers moving beyond expected day-to-day variation in the same direction, supported by the session objective and context. Readiness should therefore not be reduced to a single jump score or to a simple majority vote; interpretation is strongest when complementary neuromuscular, perceptual, contextual, and performance indicators point toward the same practical action [78,79,80,81,82,83,84,85,86,87,88,89,90,91,92,93,94,95,96,97,98].
Recovery, sleep, and contextual load. Recovery determines whether a subsequent load is likely to be decoded as adaptation or overload. Sleep duration and quality, soreness, mood, appetite, psychological stress, travel, academic or occupational demands, and illness symptoms can all modify training tolerance. In dual-career athletes and university sport, these contextual loads may be decisive because training is only one component of total stress [55,56,57,58,59,60,61,62,63,64,65,66,67,68,69,70,71,72].

5. The LOAD-R Framework

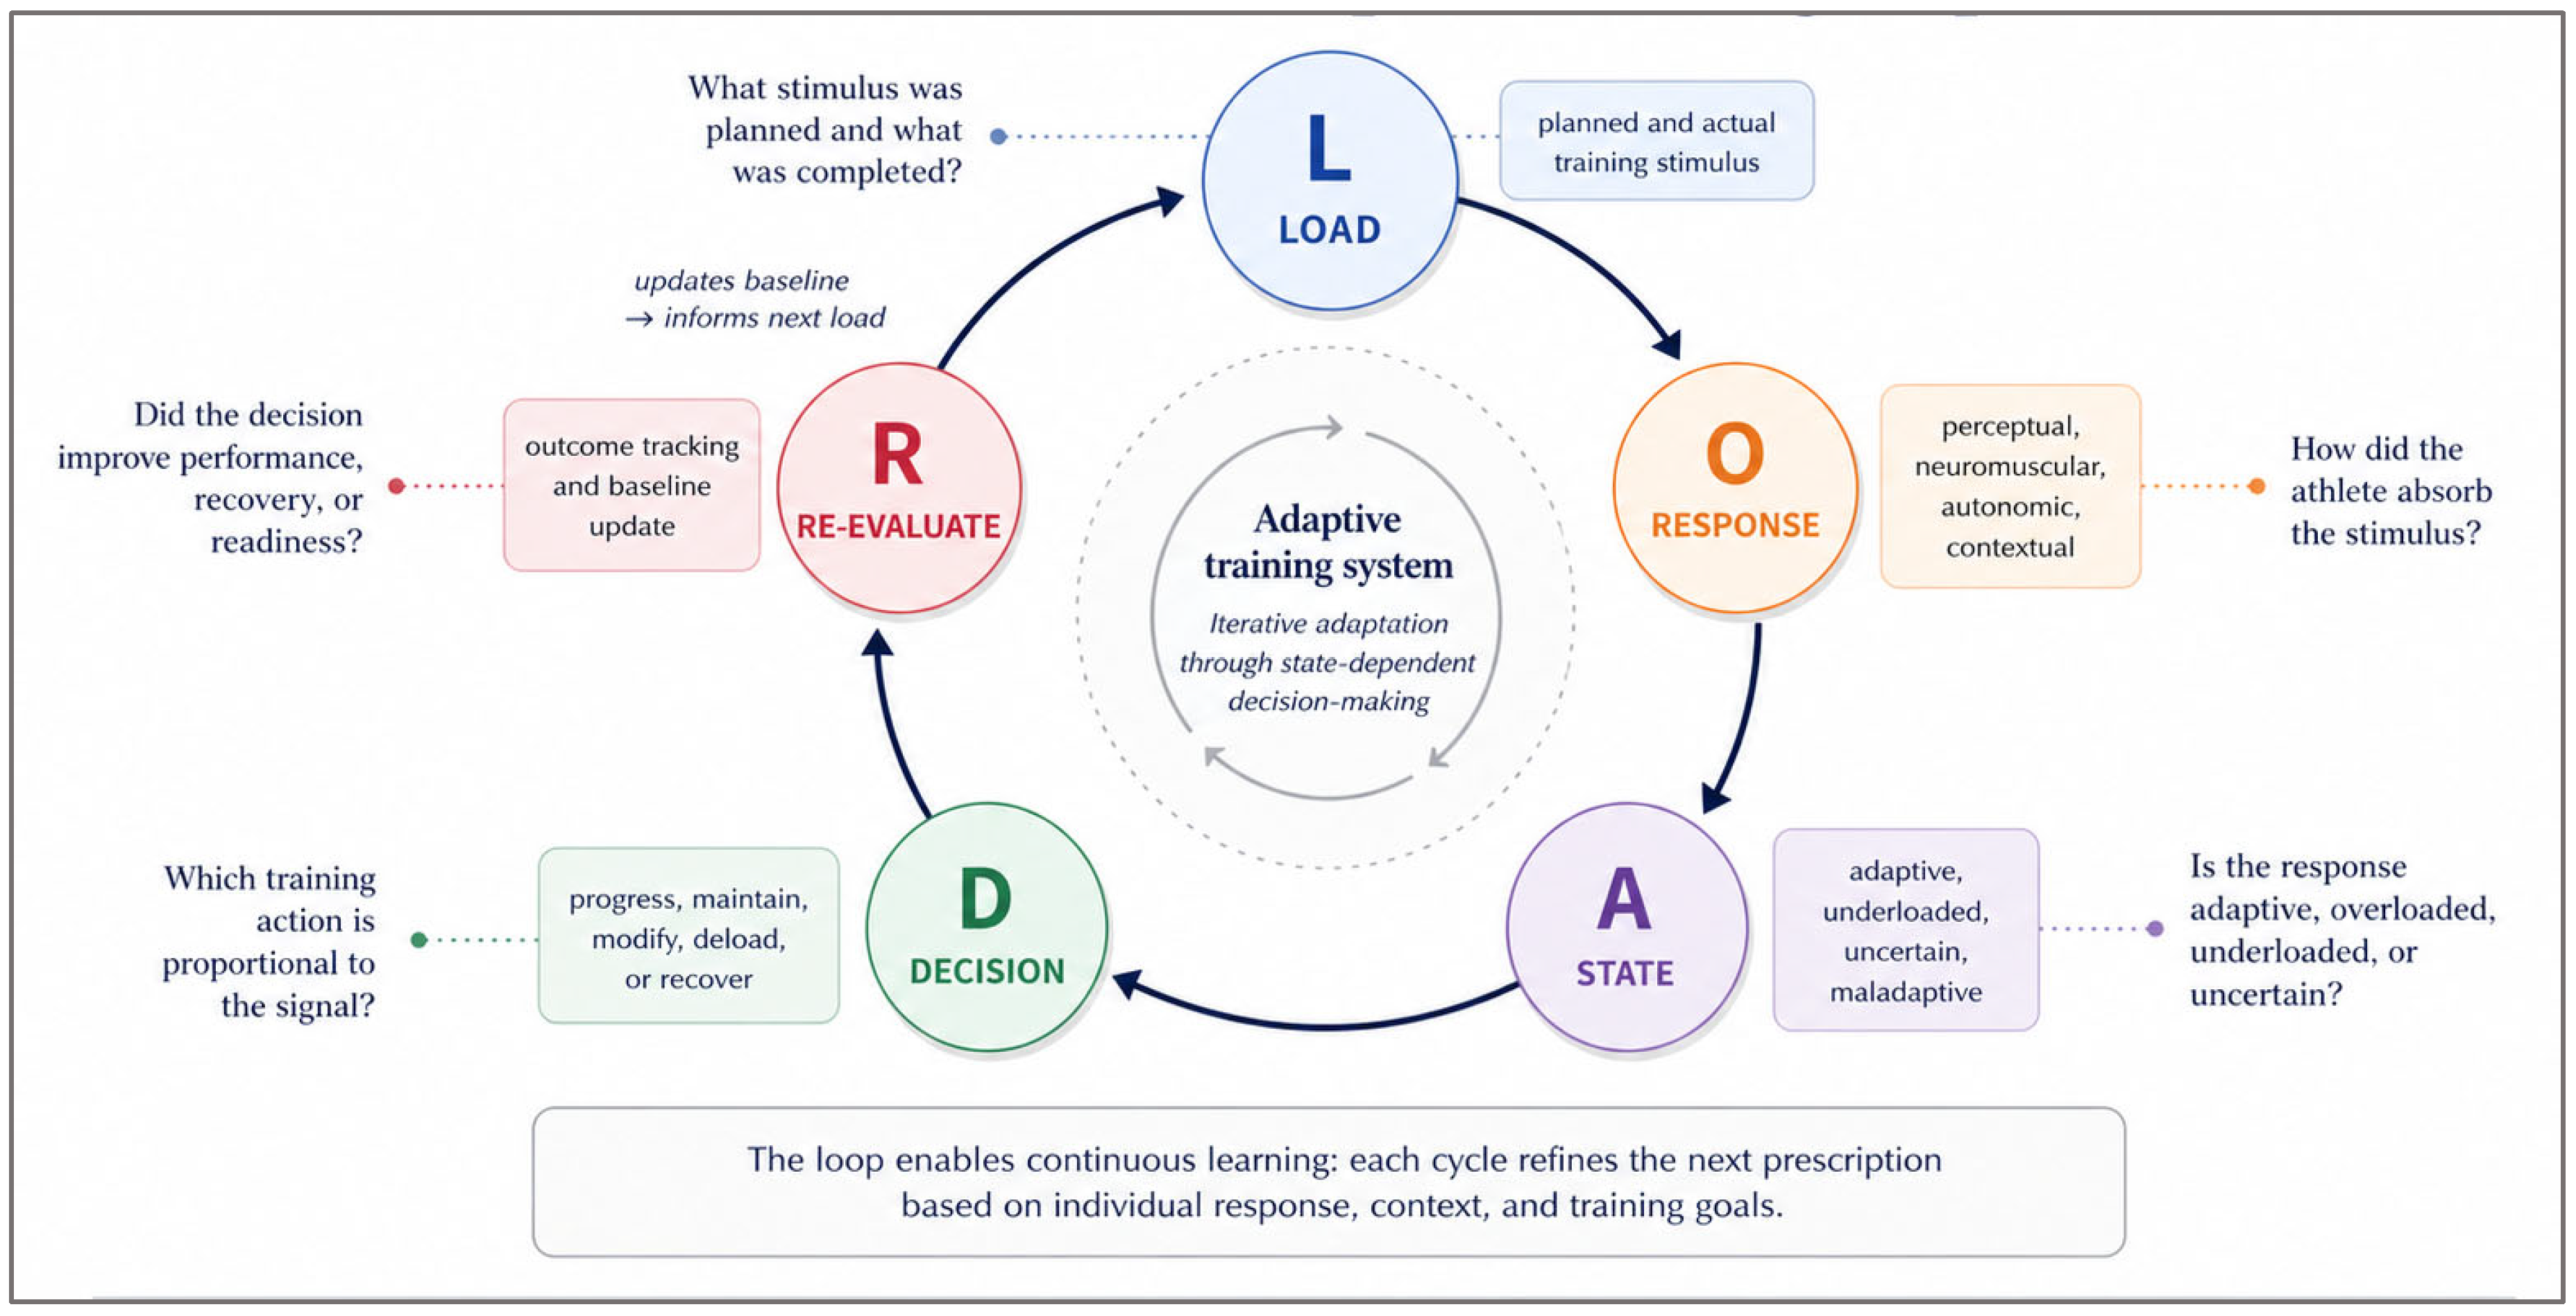
LOAD-R is organized around five linked components: Load, Organism response, Adaptive state, Decision, and Re-evaluation. The model begins by defining the intended and actual training stimulus, interprets athlete response across multiple channels, classifies the temporary adaptive state, selects a proportional training action, and checks the outcome against subsequent readiness and performance [16,17,18,19,20,21,22,73,74,75,76,77,78,79,80,81,82,83,84,85,86,87,88].
Building on load-response, periodization, readiness, and decision-support evidence, Figure 3 presents LOAD-R as a repeated adaptive loop rather than a static monitoring dashboard.

5.1. Load

The first step is to define what the athlete was exposed to: the intended session objective, the actual completed load, and the difference between planned and realized work. This prevents readiness from being interpreted without reference to the stimulus that preceded it [1,2,3,4,5,6,7,8,9,10,11,12,13,14,36,37,38,39,40,41,42,43,44,45].

5.2. Organism Response

The second step is to interpret how the athlete absorbed the stimulus. The term “organism response” is used because training tolerance is perceptual, autonomic, neuromuscular, cognitive, psychological, and contextual, not only muscular or cardiovascular [46,47,48,49,50,51,52,53,54,55,56,57,65,66,67,68,69,70,71,72,73,74,75,76,77].

5.3. Adaptive State

The third step is classification. The athlete should not be classified in a binary ready/not-ready manner. More useful temporary categories include adaptive tolerance, functional overload, maladaptive stress, underload, and uncertainty, interpreted relative to individual baselines, measurement error, and training objective [89,90,91,92,93,94,95,96,97,98].

5.4. Decision

The fourth step is the training action. LOAD-R uses five default decisions: progress, maintain, modify, deload, or recover. The decision should be proportional to the strength, reliability, independence, and practical relevance of the signal, rather than triggered automatically by a single marker or by a redundant set of markers [11,23,24,25,26,27,28,29,30,31,32,33,34,35,89,90,91,92,93,94,95,96,97,98].

5.5. Re-Evaluation

The final step is re-evaluation. If performance rebounds after a deload, accumulated fatigue was likely present. If suppression persists, practitioners should reassess illness, injury, sleep, nutrition, psychological load, or program design. Re-evaluation also updates the rolling baseline [94,95,96,97,98].

5.6. Handling Measurement Error in Daily Decisions

Because daily monitoring values contain noise, LOAD-R decisions should begin with measurement-error appraisal rather than raw change detection. A practical sequence is: (1) establish an individual baseline under stable testing conditions; (2) quantify typical error, coefficient of variation, SEM, or ICC for the selected marker; (3) define a minimum decision threshold; (4) grade the signal according to whether it exceeds expected error; and (5) re-check the outcome before updating the athlete baseline [91,92].
For low-resource field use, a simple minimum-detectable-change rule is preferable to reacting to every fluctuation: changes within typical error or SEM support maintain/retest decisions; one reliable marker exceeding error supports a cautious modify/check-context decision; repeated changes or two complementary markers exceeding error in the same practical direction support stronger progress, deload, or recover decisions. Where sufficient longitudinal data exist, Bayesian or probabilistic updating can refine these rules, but the conservative default is that no high-cost decision should be triggered by a single value that remains inside measurement error.
When SEM is available, the minimum detectable change can be expressed as MDC95 = 1.96 × sqrt(2) × SEM. In LOAD-R, values below this boundary are treated as uncertain unless supported by context, repeated testing, or a relevant performance outcome; values above this boundary are interpreted in relation to session goal, athlete history, and marker specificity rather than as automatic stop/go rules.
The operational questions, primary data sources, and default decision relevance for each LOAD-R component are summarized in Table 3.

6. Decision Zones and Training Actions

Decision-zone logic is the practical bridge between monitoring and action. Decisions should be based on the interaction between recent load, readiness, output, and context rather than on isolated variables. A high load with stable readiness and improving output differs from a high load with suppressed readiness and declining output; high readiness after low-load days may signal under-stimulation [23,24,25,26,27,28,29,30,31,32,33,34,35,89,90,91,92,93,94,95,96,97,98].
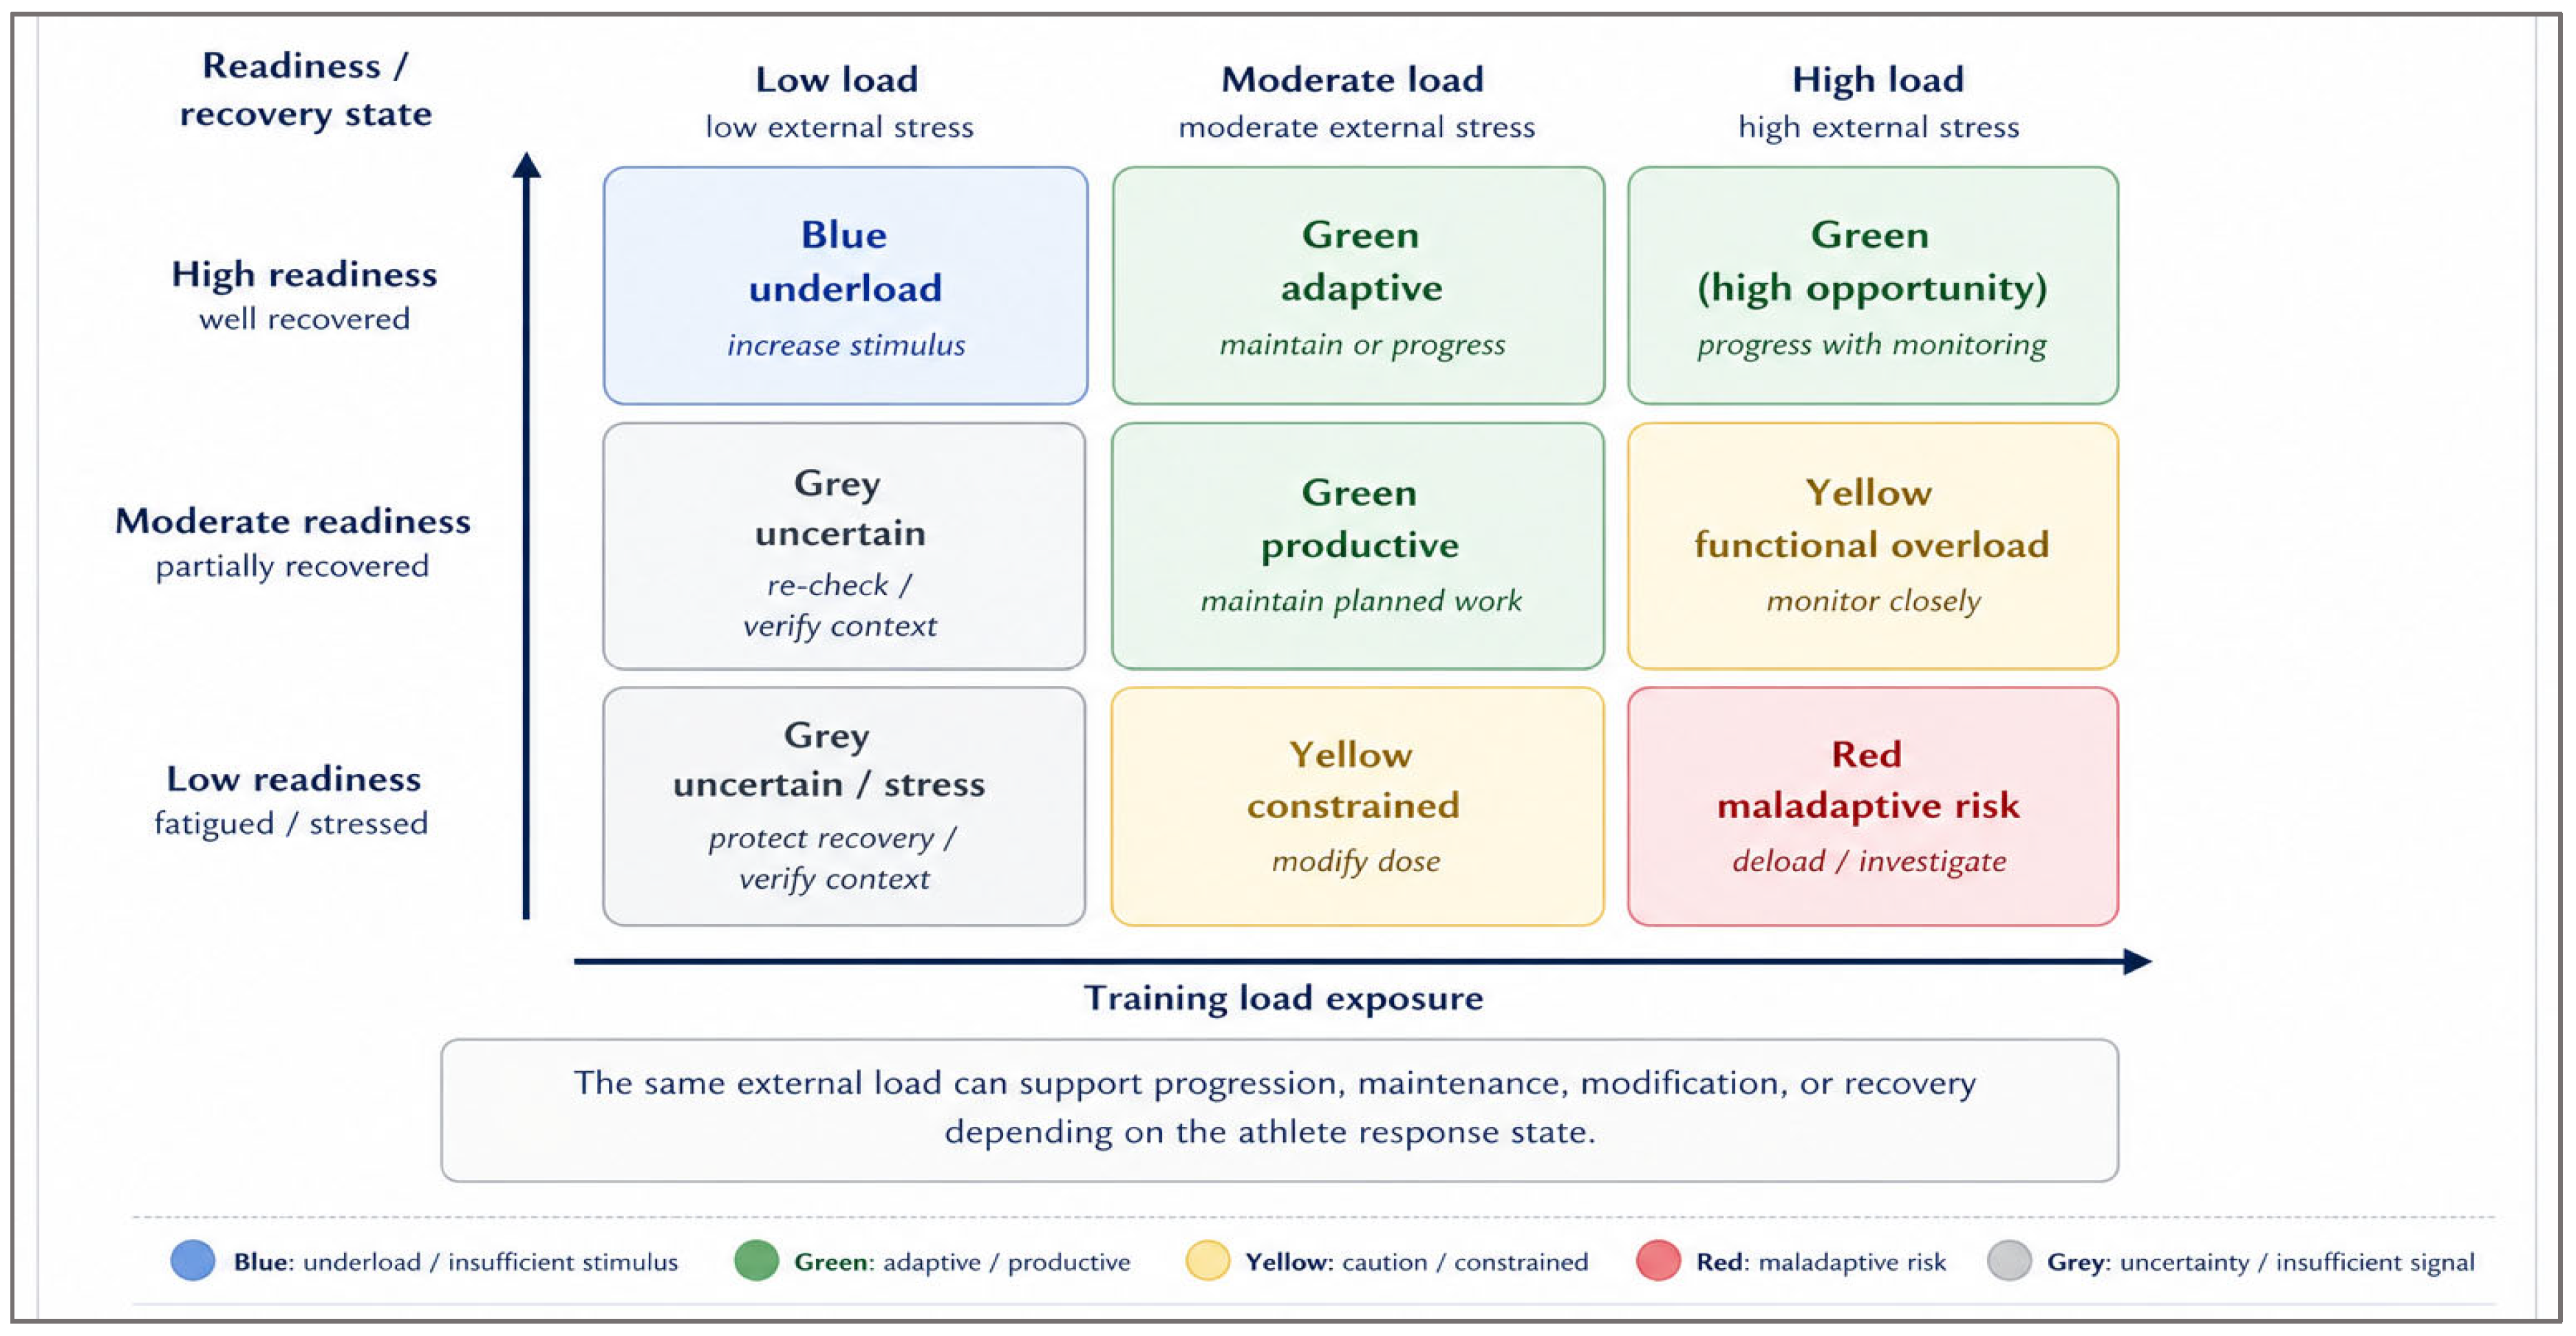
Drawing on workload-injury debates and decision-support principles, Figure 4 presents decision zones as a practical matrix rather than fixed universal thresholds.
These zones are heuristic labels for communication and audit, not universal diagnostic categories. Their thresholds, time windows, and marker combinations must be defined locally according to sport demands, measurement reliability, competitive calendar, and athlete history.
Because Figure 4 is intended to guide action rather than classification alone, Table 4 defines each zone, its typical interpretation, default action, and risk if misread.
To convert the same zone logic into coach-facing rules, Table 5 presents conditional if-then adjustments that preserve context and individual judgment.

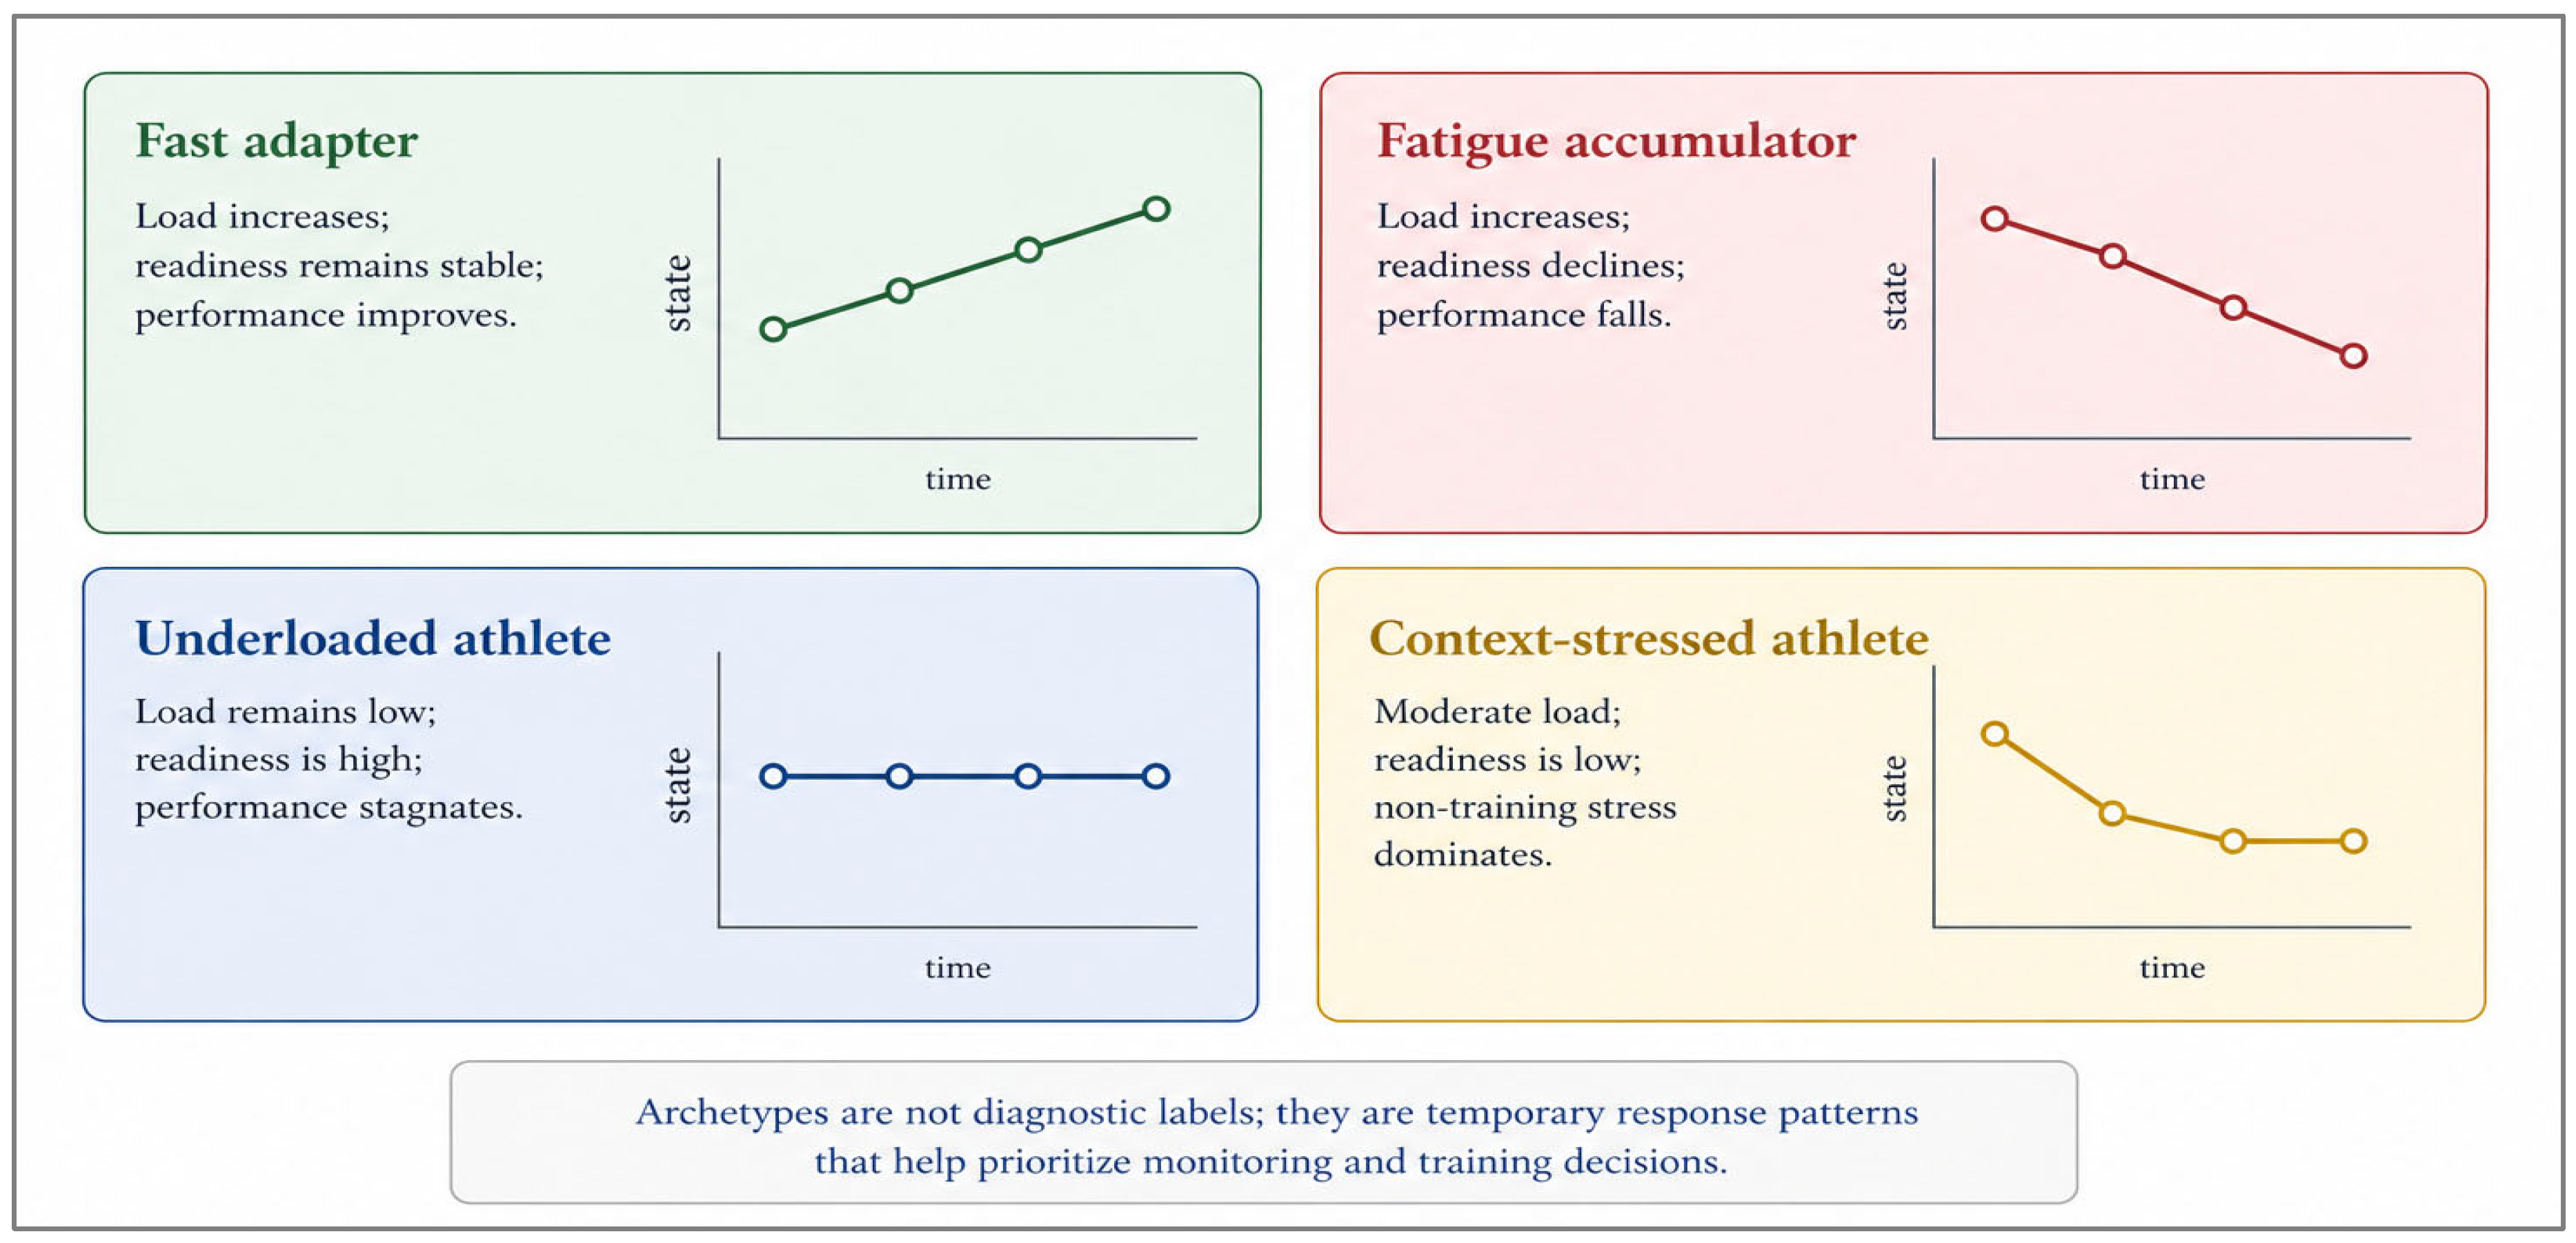
7. Athlete Response Archetypes and Individualization

Individualization is essential because athletes do not respond identically to comparable training. LOAD-R therefore interprets monitoring data through temporary response archetypes. These are not diagnostic labels or fixed traits; they are practical patterns that help staff identify whether an athlete is adapting, accumulating fatigue, receiving insufficient stimulus, or carrying contextual stress.
Given evidence that athletes respond heterogeneously to comparable loads, Figure 5 illustrates response archetypes that may occur under the same external stimulus.
Table 6 extends the archetype logic into monitoring priorities and coaching responses so that individualization remains observable and actionable.

8. Field Implementation Across Resource Levels

Implementation should scale to available resources. A university or amateur team can apply LOAD-R with a training diary, RPE, or sRPE-load, a short wellness questionnaire, and simple jump or sprint testing. A professional team can add GPS, force-plate CMJ, HRV, sleep monitoring, and integrated dashboards. Decision quality depends less on technology volume than on reliable measurement, consistent interpretation, and predefined actions.
Because implementation quality should not depend on expensive technology alone, Table 7 outlines scalable LOAD-R configurations across resource levels.
At low-cost and non-professional levels, implementation should begin with education and calibration of subjective scales. Staff should explain anchors, collect repeated values in stable conditions, and compare athlete reports with observable training quality before attaching high decision weight to self-report data.
To support practical adoption, Box 1 provides a one-week microcycle sequence that translates the framework into a routine coaching workflow [1,2,3,4,5,6,7,8,9,10,11,12,13,14,15,16,17,18,19,20,21,22,23,24,25,26,27,28,29,30,31,32,33,34,35,123,124,125,126,127,128,129,130,131,132].
Box 1. Applying LOAD-R in one weekly microcycle
Step 1. Define the training objective: adaptation, expression, technical quality, recovery, or competition preparation.
Step 2. Define the intended load and identify the key session that must be protected.
Step 3. Collect a minimal response set: RPE or sRPE-load, wellness/sleep, soreness, and one neuromuscular or performance marker when relevant.
Step 4. Classify the athlete or squad into a decision zone using convergent signals and individual baselines.
Step 5. Choose the action: progress, maintain, modify, deload, or recover.
Step 6. Re-evaluate after 24–72 h and update the baseline only when the measurement conditions are acceptable.
In practice, decision-making emerges from the dynamic interaction between load, organism response, and context.

Applied Microcycle Example: Operationalizing LOAD-R in Practice

To complement the procedural workflow presented in Box 1, the following example illustrates how LOAD-R can guide decision-making across a simplified weekly microcycle in a team-sport context with one competitive match. The example is intentionally simplified to illustrate decision logic rather than to prescribe a fixed training model.
This example should be read as a decision sequence rather than as a fixed-latency model. In practice, monitoring windows should be aligned with the expected time course of the stressed system: autonomic and perceptual indicators may be checked the next morning; neuromuscular responses after sprint, eccentric, resistance, or contact loads should usually be reviewed at 24 and 48 h; and delayed soreness, metabolic strain, or persistent performance suppression may require 72 h reassessment. Therefore, a modification is triggered not simply because it follows a high-load day, but because the relevant marker has exceeded measurement error, failed to rebound within the expected window, or converged with contextual risk.
Day 1 (Post-match recovery)
The athlete presents high soreness, elevated perceived fatigue, and reduced neuromuscular readiness (e.g., decreased CMJ output). The adaptive state is interpreted as transient fatigue or functional overload. The decision is to prioritize recovery through low-intensity aerobic work, mobility, and regeneration. Re-evaluation focuses on readiness rebound within 24–48 h.
Day 2 (Reintroduction)
Wellness improves, and internal load normalizes. The adaptive state transitions toward adaptive readiness. The decision is to reintroduce moderate load through technical and controlled physical work. Monitoring confirms whether recovery trends are consistent across markers.
Day 3 (High-load stimulus)
A key training session is performed. External load is high, while internal load and neuromuscular output remain stable. The adaptive state is classified as adaptive. The decision is to maintain the planned high-intensity exposure. Subsequent monitoring focuses on detecting delayed fatigue responses.
Day 4 (Fatigue monitoring and adjustment)
Slight reductions in neuromuscular readiness and increased soreness emerge. The adaptive state is interpreted as functional overload. The decision is to modify training (e.g., reduce volume or intensity) to prevent progression into maladaptive stress. Re-evaluation assesses recovery trajectory.
Day 5 (Pre-competition priming)
Readiness markers stabilize or improve. The adaptive state returns to adaptive readiness. The decision is to implement a low-volume, high-quality priming session. Monitoring confirms preparedness for competition.
Day 6 (Competition)
The match represents a high-load exposure. Performance outcome serves as the primary evaluation of preceding decisions. Post-match monitoring initiates the next LOAD-R cycle.
This example demonstrates how LOAD-R operates as a continuous adaptive loop, where training decisions emerge from the interaction between load, organism response, and adaptive-state classification, rather than from isolated variables or fixed thresholds.
Importantly, the same external load could lead to different decisions depending on athlete-specific response patterns, reinforcing the individualized and context-dependent nature of the LOAD-R framework.

9. Testable Predictions Emerging from the Framework

The preceding sections define the LOAD-R components, decision zones, response archetypes, and implementation levels. The predictions below, therefore, function as a validation agenda for the framework: each prediction specifies a way to test whether the proposed interpretation-to-action loop performs better than isolated metrics, fixed thresholds, or generic dashboards. A conceptual framework becomes stronger when it generates predictions that can be tested and potentially falsified.
P1. 
Integrated prediction—In longitudinal cohort models, combined external load, internal load, readiness, and recovery features should explain more variance in 24–72 h sprint, jump, strength, endurance, or sport-task performance than load-only models.
P2. 
Mismatch sensitivity—Lagged within-athlete analyses should show that normal external load with unusually high internal strain predicts later wellness suppression, illness flags, or performance decline earlier than either metric alone.
P3. 
Baseline superiority—Individual rolling baselines should produce fewer false alerts and better detection of meaningful fatigue than fixed group thresholds, using SEM, CV, or smallest worthwhile change as comparison criteria.
P4. 
Neuromuscular specificity—In strength- and power-dominant athletes, CMJ-derived markers should predict next-session sprint, jump, or maximal-intent output more strongly than generic wellness-only scores.
P5. 
Recovery moderation—Sleep quality, soreness, HRV, and perceived recovery should moderate the load-performance relationship, with high load producing better adaptation when recovery markers remain stable.
P6. 
State transitions—Changes between LOAD-R zones across days or microcycles should predict short-term training tolerance better than isolated single-day values.
P7. 
Underload detection—Athletes showing high readiness, low recent load, and stagnant performance should improve after targeted increases in volume, intensity, density, or task specificity.
P8. 
Rule-guided progression—Randomized or quasi-experimental studies should test whether LOAD-R-guided adjustment produces similar or superior performance gains with fewer maladaptive fatigue states than fixed progression.
P9. 
Sport specificity—Monitoring batteries selected around the target performance expression should outperform generic dashboards when evaluated against sport-specific outcomes.
P10. 
Staff communication—Decision-zone summaries should improve agreement among coaches, sport scientists, and medical staff, measured by faster action selection and higher inter-rater agreement.
Collectively, these predictions move the framework from conceptual organization toward empirical validation. The most informative studies will report measurement error, individual baselines, decision rules, state transitions, and both short-term readiness and block-level performance outcomes.

10. Methodological Limitations and Future Directions

This review has limitations. It is a structured narrative synthesis and does not claim exhaustive retrieval, PRISMA-level reproducibility, formal risk-of-bias scoring, or quantitative pooling. Study selection involved interpretative judgment, which may introduce selection and confirmation bias. LOAD-R also remains a conceptual framework requiring empirical validation across sports, sexes, age groups, training phases, and competitive levels. Finally, poorly selected variables could create false precision rather than better decisions, and there is also a risk that misinterpretation of multi-marker data or inconsistent measurement protocols may reduce decision accuracy.
Marker convergence is therefore a conditional principle, not a validity guarantee. Apparent agreement among variables may reflect correlated noise, redundant constructs, shared sensitivity to sleep or stress, or poor specificity for the target performance outcome. LOAD-R requires marker complementarity, reliability checks, and outcome re-evaluation before a convergent pattern is used to justify major training changes.
Future studies should test the framework rather than only apply it descriptively. Priority should be given to longitudinal designs combining external load, internal load, readiness, sleep, recovery, contextual stress, and repeated performance outcomes. Comparative studies should examine fixed progression versus LOAD-R-guided adjustment, quantify individual response, report measurement error, and predefine actions for each decision zone.
To make future validation studies auditable and comparable, Table 8 provides a reporting checklist centered on baselines, measurement error, decision rules, and outcomes.

11. Discussion

The present review addresses a central limitation in applied sport science: the persistent gap between athlete monitoring and actionable training decisions. Existing approaches have improved the quantification of external and internal load, but their practical value is limited when data are not converted into explicit, proportionate, and individualized actions [1,5,8,11,12,13,14].
LOAD-R builds on traditional approaches by placing adaptive-state classification between measurement and prescription. Fitness-fatigue models remain useful as conceptual foundations, but they are often difficult to operationalize in daily field settings. Workload metrics such as acute-to-chronic workload ratios can summarize exposure, but they should not be treated as universal risk thresholds. Dashboards improve visibility, but they can increase ambiguity when they do not specify action priorities [11,12,16,17,18,24,28,29,30,31,32,33,34,35].
A key contribution of the LOAD-R framework is its explicit differentiation from existing monitoring and decision-support approaches. Unlike acute-to-chronic workload ratio models, which primarily summarize load exposure and have been widely debated as risk predictors, LOAD-R does not rely on fixed ratios or universal thresholds. Instead, it interprets load in relation to organism response, individual baselines, and contextual constraints, thereby reducing the risk of misclassification based on isolated metrics [24,28,29,30,31,32,33,34,35,89,90,91,92,93,94,95].
Compared with traditional fitness-fatigue models, LOAD-R shifts the emphasis from retrospective performance modeling to real-time, field-based decision-making. While fitness-fatigue frameworks provide valuable theoretical insight into adaptation dynamics, their practical translation into daily coaching decisions is often limited. LOAD-R attempts to address this gap by introducing an intermediate adaptive-state classification that directly links observed signals to specific training actions [16,17,18,19,20].
In contrast to dashboard-based monitoring systems, which often present multiple indicators without a defined decision hierarchy, LOAD-R prioritizes signal relevance, marker complementarity, measurement reliability, and actionability. Rather than increasing informational density, the framework is intended to reduce complexity by structuring how data should be interpreted and converted into proportional training decisions [11,12,89,90,91,92,93,94,95,96,97].
Taken together, these distinctions position LOAD-R not as a competing metric or model, but as an integrative decision architecture that connects measurement, interpretation, and action within a unified adaptive loop. Its primary contribution is therefore not a new marker, formula, or technology. This shift is proposed to help reframe athlete monitoring from a descriptive process into a more operational, decision-driven system [1,2,3,4,5,6,7,8,9,10,11,12,13,14,89,90,91,92,93,94,95,96,97,98].
Its core contribution is a repeatable decision loop: define the stimulus, interpret the organism-level response, classify the adaptive state, choose a proportional action, and re-evaluate the outcome. This sequence makes the logic behind training modification visible to coaches, sport scientists, medical staff, and athletes [1,5,6,11,12,13,14,89,90,91,92,93,94,95,96,97,98].
This flexibility also creates trade-offs. The absence of rigid universal thresholds increases ecological validity and preserves coaching expertise, but it demands consistent data collection, transparent baselines, and discipline in interpreting measurement error, as well as sufficient practitioner expertise to ensure that interpretation remains consistent and contextually appropriate. A LOAD-R implementation is only as strong as the reliability of its inputs and the clarity of its predefined decisions. The present work is intended as a conceptual and translational framework, with empirical validation as a necessary next step [89,90,91,92,93,94,95,96,97,123,124,125,126,127,128,129,130,131,132].
The framework may be useful as a coach-facing scaffold and scientifically useful as a source of falsifiable predictions. Future validation should explicitly test whether LOAD-R-guided adjustment improves performance, reduces maladaptive fatigue states, improves staff agreement, or achieves similar adaptation with lower physiological and perceptual cost than fixed progression models. Its applicability may vary depending on sport-specific demands, monitoring capacity, and competitive context [23,24,25,26,27,28,29,30,31,32,33,34,35,78,79,80,81,82,83,84,85,86,87,88,110,111,112,113,114,115,116,117,118,119,120,121,122].
Accordingly, LOAD-R should be regarded as a testable decision scaffold rather than as a validated superiority claim; its practical value must be established against alternative monitoring and coaching workflows.
The added practical value of LOAD-R is therefore best understood as a communication and governance tool for training decisions. It makes explicit who collected the signal, how the signal was interpreted, which contextual constraints were considered, what action was selected, and how the decision was checked afterward. This may improve staff agreement and reduce arbitrary reactions to isolated alerts, but it cannot remove the need for sport-specific expertise, careful variable selection, or prospective validation against real performance and health outcomes.

Practical Applications

Practitioners should treat monitoring data as action cues rather than independent verdicts. The minimum sequence is: define the session objective; compare planned and actual load; interpret response against individual baseline and measurement error; classify adaptive state; select an action; and re-check the outcome after 24–72 h [1,5,8,11,12,13,14,89,90,91,92,93,94,95,96,97,98]. When possible, the 24–72 h re-check should be marker-specific: acute perceptual/autonomic indicators can be reviewed early, whereas neuromuscular and soreness responses may require repeated 24-, 48-, and 72 h checks before a strong decision is made.
Operationally, LOAD-R should favor small, reversible adjustments when signals are uncertain, protect key sessions when readiness and performance are stable, and prioritize recovery or medical/contextual review when suppressed readiness, high internal strain, and declining output converge. This ensures that monitoring remains actionable, scalable, and directly aligned with training effectiveness rather than data accumulation [55,56,57,61,62,63,64,65,78,79,80,81,82,83,84,85,86,87,88,110,111,112,113,114,115,116,117,118,119,120,121,122].

12. Conclusions

This review reframes athlete monitoring as an adaptive decision-support process rather than a passive data-collection exercise. The proposed LOAD-R framework integrates load exposure, organism response, adaptive-state classification, decision-making, and re-evaluation into a unified loop.
Its primary contribution is organizational: it does not require new variables, but it clarifies how existing monitoring information should be interpreted and converted into training actions. In doing so, it may help practice move beyond single indicators, fixed thresholds, and dashboard alerts.
From a practical perspective, LOAD-R supports scalable implementation across amateur, university, and high-performance settings by emphasizing decision clarity over data complexity. From a scientific perspective, it provides testable predictions for future longitudinal and intervention-based research.
The effectiveness of the framework will ultimately depend on empirical validation across sports, contexts, and populations. Its immediate value is proposed to lie in providing a clear, individualized, and context-aware architecture for adaptive training and load management.

Author Contributions

Conceptualization, D.C.M., C.F., C.I.N. and R.V.C.; methodology, D.C.M., C.F., C.I.N. and R.V.C.; validation, D.C.M., C.F., C.I.N. and R.V.C.; formal analysis, D.C.M., C.F., C.I.N. and R.V.C.; investigation, D.C.M., C.F., C.I.N. and R.V.C.; resources, D.C.M., C.F., C.I.N. and R.V.C.; data curation, D.C.M., C.F., C.I.N. and R.V.C.; writing—original draft preparation, D.C.M., C.F., C.I.N. and R.V.C.; writing—review and editing, D.C.M., C.F., C.I.N. and R.V.C.; visualization, D.C.M., C.F., C.I.N. and R.V.C.; supervision, D.C.M., C.F., C.I.N. and R.V.C.; project administration, D.C.M., C.F., C.I.N. and R.V.C. All authors have read and agreed to the published version of the manuscript.

Funding

This research received no external funding.

Institutional Review Board Statement

Not applicable.

Informed Consent Statement

Not applicable.

Data Availability Statement

No new data were created or analyzed in this study. Data sharing is not applicable to this article.

Conflicts of Interest

The authors declare no conflicts of interest.

Abbreviations

ACWRacute-to-chronic workload ratio
AMSathlete management system
CMJcountermovement jump
GPSglobal positioning system
HRheart rate
HRVheart rate variability
LOAD-RLoad, Organism response, Adaptive state, Decision, Re-evaluation
RPErating of perceived exertion
RSIreactive strength index
SEMstandard error of measurement
sRPEsession rating of perceived exertion; when multiplied by duration, reported here as sRPE-load
TRIMPtraining impulse

References

  1. Bourdon, P.C.; Cardinale, M.; Murray, A.; Gastin, P.; Kellmann, M.; Varley, M.C.; Gabbett, T.J.; Coutts, A.J.; Burgess, D.J.; Gregson, W.; et al. Monitoring athlete training loads: Consensus statement. Int. J. Sports Physiol. Perform. 2017, 12, S2-161–S2-170. [Google Scholar] [CrossRef] [Scilit] [PubMed]
  2. Rago, V.; Brito, J.; Figueiredo, P.; Costa, J.; Krustrup, P.; Rebelo, A. Relationship between external load and perceptual responses to training in professional football: Effects of quantification method. Sports 2019, 7, 68. [Google Scholar] [CrossRef] [Scilit] [PubMed]
  3. Bellinger, P.M. Functional overreaching in endurance athletes: A necessity or cause for concern? Sports Med. 2020, 50, 1059–1073. [Google Scholar] [CrossRef] [Scilit] [PubMed]
  4. Gabbett, T.J.; Nassis, G.P.; Oetter, E.; Pretorius, J.; Johnston, N.; Medina, D.; Rodas, G.; Myslinski, T.; Howells, D.; Beard, A.; et al. The athlete monitoring cycle: A practical guide to interpreting and applying training monitoring data. Br. J. Sports Med. 2017, 51, 1451–1452. [Google Scholar] [CrossRef] [Scilit] [PubMed]
  5. Halson, S.L. Monitoring training load to understand fatigue in athletes. Sports Med. 2014, 44, S139–S147. [Google Scholar] [CrossRef] [Scilit] [PubMed]
  6. Impellizzeri, F.M.; Shrier, I.; McLaren, S.J.; Coutts, A.J.; McCall, A.; Slattery, K.; Jeffries, A.C.; Kalkhoven, J.T. Understanding training load as exposure and dose. Sports Med. 2023, 53, 1667–1679. [Google Scholar] [CrossRef] [Scilit] [PubMed]
  7. Akenhead, R.; Nassis, G.P. Training load and player monitoring in high-level football: Current practice and perceptions. Int. J. Sports Physiol. Perform. 2016, 11, 587–593. [Google Scholar] [CrossRef] [Scilit] [PubMed]
  8. Saw, A.E.; Main, L.C.; Gastin, P.B. Monitoring the athlete training response: Subjective self-reported measures trump commonly used objective measures. Br. J. Sports Med. 2016, 50, 281–291. [Google Scholar] [CrossRef] [Scilit] [PubMed]
  9. Alba-Jimenez, C.; Moreno-Doutres, D.; Pena, J. Trends assessing neuromuscular fatigue in team sports: A narrative review. Sports 2022, 10, 33. [Google Scholar] [CrossRef] [Scilit] [PubMed]
  10. McGuigan, M.R. Monitoring Training and Performance in Athletes; Human Kinetics: Champaign, IL, USA, 2017. [Google Scholar] [CrossRef] [Scilit]
  11. Robertson, S.; Bartlett, J.D.; Gastin, P.B. Red, amber, or green? Athlete monitoring in team sport: The need for decision-support systems. Int. J. Sports Physiol. Perform. 2017, 12, S2-73–S2-79. [Google Scholar] [CrossRef] [Scilit] [PubMed]
  12. Bartlett, J.D.; O’Connor, F.; Pitchford, N.; Torres-Ronda, L.; Robertson, S.J. Relationships between internal and external training load in team-sport athletes: Evidence for an individualized approach. Int. J. Sports Physiol. Perform. 2017, 12, 230–234. [Google Scholar] [CrossRef] [Scilit] [PubMed]
  13. McLaren, S.J.; Macpherson, T.W.; Coutts, A.J.; Hurst, C.; Spears, I.R.; Weston, M. The relationships between internal and external measures of training load and intensity in team sports: A meta-analysis. Sports Med. 2018, 48, 641–658. [Google Scholar] [CrossRef] [Scilit] [PubMed]
  14. Vanrenterghem, J.; Nedergaard, N.J.; Robinson, M.A.; Drust, B. Training load monitoring in team sports: A novel framework separating physiological and biomechanical load-adaptation pathways. Sports Med. 2017, 47, 2135–2142. [Google Scholar] [CrossRef] [Scilit] [PubMed]
  15. Baethge, C.; Goldbeck-Wood, S.; Mertens, S. SANRA-a scale for the quality assessment of narrative review articles. Res. Integr. Peer Rev. 2019, 4, 5. [Google Scholar] [CrossRef] [Scilit] [PubMed]
  16. Imbach, F.; Sutton-Charani, N.; Montmain, J.; Candau, R.; Perrey, S. The use of fitness-fatigue models for sport performance modelling: Conceptual issues and contributions from machine-learning. Sports Med. Open 2022, 8, 29. [Google Scholar] [CrossRef] [Scilit] [PubMed]
  17. Turner, J.D.; Mazzoleni, M.J.; Little, J.A.; Sequeira, D.; Mann, B.P. A nonlinear model for the characterization and optimization of athletic training and performance. Biomed. Hum. Kinet. 2017, 9, 82–93. [Google Scholar] [CrossRef] [Scilit]
  18. Imbach, F.; Perrey, S.; Chailan, R.; Meline, T.; Candau, R. Training load responses modelling and model generalisation in elite sports. Sci. Rep. 2022, 12, 1586. [Google Scholar] [CrossRef] [Scilit] [PubMed]
  19. Mujika, I.; Halson, S.; Burke, L.M.; Balague, G.; Farrow, D. An integrated, multifactorial approach to periodization for optimal performance in individual and team sports. Int. J. Sports Physiol. Perform. 2018, 13, 538–561. [Google Scholar] [CrossRef] [Scilit] [PubMed]
  20. Kiely, J. Periodization paradigms in the 21st century: Evidence-led or tradition-driven? Int. J. Sports Physiol. Perform. 2012, 7, 242–250. [Google Scholar] [CrossRef] [Scilit] [PubMed]
  21. Mănescu, D.C. Training Load Oscillation and Epigenetic Plasticity: Molecular Pathways Connecting Energy Metabolism and Athletic Personality. Int. J. Mol. Sci. 2026, 27, 792. [Google Scholar] [CrossRef] [Scilit] [PubMed]
  22. Bompa, T.O.; Buzzichelli, C. Periodization: Theory and Methodology of Training, 6th ed.; Human Kinetics: Champaign, IL, USA, 2019. [Google Scholar] [CrossRef] [Scilit]
  23. Jones, C.M.; Griffiths, P.C.; Mellalieu, S.D. Training load and fatigue marker associations with injury and illness: A systematic review of longitudinal studies. Sports Med. 2017, 47, 943–974. [Google Scholar] [CrossRef] [Scilit] [PubMed]
  24. Soligard, T.; Schwellnus, M.; Alonso, J.M.; Bahr, R.; Clarsen, B.; Dijkstra, H.P.; Gabbett, T.; Gleeson, M.; Hagglund, M.; Hutchinson, M.R.; et al. How much is too much? IOC consensus statement on load in sport and risk of injury. Br. J. Sports Med. 2016, 50, 1030–1041. [Google Scholar] [CrossRef] [Scilit] [PubMed]
  25. Gabbett, T.J. The training-injury prevention paradox: Should athletes be training smarter and harder? Br. J. Sports Med. 2016, 50, 273–280. [Google Scholar] [CrossRef] [Scilit] [PubMed]
  26. Drew, M.K.; Finch, C.F. The relationship between training load and injury, illness and soreness: A systematic review. Sports Med. 2016, 46, 861–883. [Google Scholar] [CrossRef] [Scilit] [PubMed]
  27. Windt, J.; Gabbett, T.J. How do training and competition workloads relate to injury? The workload-injury aetiology model. Br. J. Sports Med. 2017, 51, 428–435. [Google Scholar] [CrossRef] [Scilit] [PubMed]
  28. Hulin, B.T.; Gabbett, T.J.; Lawson, D.W.; Caputi, P.; Sampson, J.A. The acute:chronic workload ratio predicts injury: High chronic workload may decrease injury risk in elite rugby league players. Br. J. Sports Med. 2016, 50, 231–236. [Google Scholar] [CrossRef] [Scilit] [PubMed]
  29. Blanch, P.; Gabbett, T.J. Has the athlete trained enough to return to play safely? The acute:chronic workload ratio permits clinicians to quantify a player’s risk of subsequent injury. Br. J. Sports Med. 2016, 50, 471–475. [Google Scholar] [CrossRef] [Scilit] [PubMed]
  30. Impellizzeri, F.M.; Tenan, M.S.; Kempton, T.; Novak, A.; Coutts, A.J. Acute:chronic workload ratio: Conceptual issues and fundamental flaws. Int. J. Sports Physiol. Perform. 2020, 15, 907–913. [Google Scholar] [CrossRef] [Scilit] [PubMed]
  31. Wang, C.; Vargas, J.T.; Stokes, T.; Steele, R.; Shrier, I. Analyzing activity and injury: Lessons learned from the acute:chronic workload ratio. Sports Med. 2020, 50, 1243–1254. [Google Scholar] [CrossRef] [Scilit] [PubMed]
  32. Menaspa, P. Are rolling averages a good way to assess training load for injury prevention? Br. J. Sports Med. 2017, 51, 618–619. [Google Scholar] [CrossRef] [Scilit] [PubMed]
  33. Carey, D.L.; Blanch, P.; Ong, K.L.; Crossley, K.M.; Crow, J.; Morris, M.E. Training loads and injury risk in Australian football-differing acute:chronic workload ratios influence match injury risk. Br. J. Sports Med. 2017, 51, 1215–1220. [Google Scholar] [CrossRef] [Scilit] [PubMed]
  34. Esmaeili, A.; Hopkins, W.G.; Stewart, A.M.; Elias, G.P.; Lazarus, B.H.; Aughey, R.J. The individual and combined effects of multiple factors on the risk of soft tissue non-contact injuries in elite team sport athletes. Front. Physiol. 2018, 9, 1280. [Google Scholar] [CrossRef] [Scilit] [PubMed]
  35. Williams, S.; West, S.; Cross, M.J.; Stokes, K.A. Better way to determine the acute:chronic workload ratio? Br. J. Sports Med. 2017, 51, 209–210. [Google Scholar] [CrossRef] [Scilit] [PubMed]
  36. Cummins, C.; Orr, R.; O’Connor, H.; West, C. Global positioning systems (GPS) and microtechnology sensors in team sports: A systematic review. Sports Med. 2013, 43, 1025–1042. [Google Scholar] [CrossRef] [Scilit] [PubMed]
  37. Malone, J.J.; Lovell, R.; Varley, M.C.; Coutts, A.J. Unpacking the black box: Applications and considerations for using GPS devices in sport. Int. J. Sports Physiol. Perform. 2017, 12, S2-18–S2-26. [Google Scholar] [CrossRef] [Scilit] [PubMed]
  38. Buchheit, M.; Simpson, B.M. Player-tracking technology: Half-full or half-empty glass? Int. J. Sports Physiol. Perform. 2017, 12, S2-35–S2-41. [Google Scholar] [CrossRef] [Scilit] [PubMed]
  39. Aughey, R.J. Applications of GPS technologies to field sports. Int. J. Sports Physiol. Perform. 2011, 6, 295–310. [Google Scholar] [CrossRef] [Scilit] [PubMed]
  40. Varley, M.C.; Fairweather, I.H.; Aughey, R.J. Validity and reliability of GPS for measuring instantaneous velocity during acceleration, deceleration, and constant motion. J. Sports Sci. 2012, 30, 121–127. [Google Scholar] [CrossRef] [Scilit] [PubMed]
  41. Johnston, R.J.; Watsford, M.L.; Kelly, S.J.; Pine, M.J.; Spurrs, R.W. Validity and interunit reliability of 10 Hz and 15 Hz GPS units for assessing athlete movement demands. J. Strength Cond. Res. 2014, 28, 1649–1655. [Google Scholar] [CrossRef] [Scilit] [PubMed]
  42. Jennings, D.; Cormack, S.; Coutts, A.J.; Boyd, L.; Aughey, R.J. Variability of GPS units for measuring distance in team sport movements. Int. J. Sports Physiol. Perform. 2010, 5, 565–569. [Google Scholar] [CrossRef] [Scilit] [PubMed]
  43. Boyd, L.J.; Ball, K.; Aughey, R.J. The reliability of MinimaxX accelerometers for measuring physical activity in Australian football. Int. J. Sports Physiol. Perform. 2011, 6, 311–321. [Google Scholar] [CrossRef] [Scilit] [PubMed]
  44. Nicolella, D.P.; Torres-Ronda, L.; Saylor, K.J.; Schelling, X. Validity and reliability of an accelerometer-based player tracking device. PLoS ONE 2018, 13, e0191823. [Google Scholar] [CrossRef] [Scilit] [PubMed]
  45. Scott, B.R.; Lockie, R.G.; Knight, T.J.; Clark, A.C.; de Jonge, X.A.K.J. A comparison of methods to quantify the in-season training load of professional soccer players. Int. J. Sports Physiol. Perform. 2013, 8, 195–202. [Google Scholar] [CrossRef] [Scilit] [PubMed]
  46. Brink, M.S.; Nederhof, E.; Visscher, C.; Schmikli, S.L.; Lemmink, K.A.P.M. Monitoring load, recovery, and performance in young elite soccer players. J. Strength Cond. Res. 2010, 24, 597–603. [Google Scholar] [CrossRef] [Scilit] [PubMed]
  47. Marynowicz, J.; Kikut, K.; Lango, M.; Horna, D.; Andrzejewski, M. Relationship between the session-RPE and external measures of training load in youth soccer training. J. Strength Cond. Res. 2020, 34, 2800–2804. [Google Scholar] [CrossRef] [Scilit] [PubMed]
  48. Askow, A.T.; Lobato, A.L.; Arndts, D.J.; Jennings, W.; Kreutzer, A.; Erickson, J.L.; Jagim, A.R.; Camic, C.L. Session rating of perceived exertion load and training impulse are strongly correlated to GPS-derived measures of external load in NCAA Division I women’s soccer athletes. J. Funct. Morphol. Kinesiol. 2021, 6, 90. [Google Scholar] [CrossRef] [Scilit] [PubMed]
  49. Tibana, R.A.; de Sousa, N.M.F.; Cunha, G.V.; Prestes, J.; Fett, C.; Gabbett, T.J.; Voltarelli, F.A. Validity of session rating perceived exertion method for quantifying internal training load during high-intensity functional training. Sports 2018, 6, 68. [Google Scholar] [CrossRef] [Scilit] [PubMed]
  50. Helms, E.R.; Cronin, J.; Storey, A.; Zourdos, M.C. Application of the repetitions in reserve-based rating of perceived exertion scale for resistance training. Strength Cond. J. 2016, 38, 42–49. [Google Scholar] [CrossRef] [Scilit] [PubMed]
  51. Haddad, M.; Stylianides, G.; Djaoui, L.; Dellal, A.; Chamari, K. Session-RPE method for training load monitoring: Validity, ecological usefulness, and influencing factors. Front. Neurosci. 2017, 11, 612. [Google Scholar] [CrossRef] [Scilit] [PubMed]
  52. Manzi, V.; D’Ottavio, S.; Impellizzeri, F.M.; Chaouachi, A.; Chamari, K.; Castagna, C. Profile of weekly training load in elite male professional basketball players. J. Strength Cond. Res. 2010, 24, 1399–1406. [Google Scholar] [CrossRef] [Scilit] [PubMed]
  53. Gallo, T.F.; Cormack, S.J.; Gabbett, T.J.; Lorenzen, C.H. Self-reported wellness profiles of professional Australian football players during the competition phase of the season. J. Strength Cond. Res. 2017, 31, 495–502. [Google Scholar] [CrossRef] [Scilit] [PubMed]
  54. Lambert, M.I.; Borresen, J. Measuring training load in sports. Int. J. Sports Physiol. Perform. 2010, 5, 406–411. [Google Scholar] [CrossRef] [Scilit] [PubMed]
  55. Meeusen, R.; Duclos, M.; Foster, C.; Fry, A.; Gleeson, M.; Nieman, D.; Raglin, J.; Rietjens, G.; Steinacker, J.; Urhausen, A. Prevention, diagnosis and treatment of the overtraining syndrome: Joint consensus statement. Med. Sci. Sports Exerc. 2013, 45, 186–205. [Google Scholar] [CrossRef] [Scilit] [PubMed]
  56. Kellmann, M. Preventing overtraining in athletes in high-intensity sports and stress/recovery monitoring. Scand. J. Med. Sci. Sports 2010, 20, 95–102. [Google Scholar] [CrossRef] [Scilit] [PubMed]
  57. Kellmann, M.; Bertollo, M.; Bosquet, L.; Brink, M.; Coutts, A.J.; Duffield, R.; Erlacher, D.; Halson, S.L.; Hecksteden, A.; Heidari, J.; et al. Recovery and performance in sport: Consensus statement. Int. J. Sports Physiol. Perform. 2018, 13, 240–245. [Google Scholar] [CrossRef] [Scilit] [PubMed]
  58. Brauers, J.J.; den Hartigh, R.J.R.; Jakowski, S.; Kellmann, M.; Wylleman, P.; Lemmink, K.A.P.M.; Brink, M.S. Monitoring the recovery-stress states of athletes: Psychometric properties of the acute recovery and stress scale and short recovery stress scale among Dutch and Flemish athletes. J. Sports Sci. 2024, 42, 189–199. [Google Scholar] [CrossRef] [Scilit] [PubMed]
  59. Kreher, J.B.; Schwartz, J.B. Overtraining syndrome: A practical guide. Sports Health 2012, 4, 128–138. [Google Scholar] [CrossRef] [Scilit] [PubMed]
  60. Cadegiani, F.A.; Kater, C.E. Hormonal aspects of overtraining syndrome: A systematic review. BMC Sports Sci. Med. Rehabil. 2017, 9, 14. [Google Scholar] [CrossRef] [Scilit] [PubMed]
  61. Nedelec, M.; McCall, A.; Carling, C.; Legall, F.; Berthoin, S.; Dupont, G. Recovery in soccer: Part I-post-match fatigue and time course of recovery. Sports Med. 2012, 42, 997–1015. [Google Scholar] [CrossRef] [Scilit] [PubMed]
  62. Nedelec, M.; McCall, A.; Carling, C.; Legall, F.; Berthoin, S.; Dupont, G. Recovery in soccer: Part II-recovery strategies. Sports Med. 2013, 43, 9–22. [Google Scholar] [CrossRef] [Scilit] [PubMed]
  63. Mănescu, D.C.; Tudor, A.; Mănescu, A.M.; Mărgărit, I.R.; Mănescu, C.O.; Prisăcaru, C.; Păun, L.; Tudor, V. Antioxidants and Exercise: A Redox-Informed Framework for Training Adaptation, Performance, and Recovery. Antioxidants 2026, 15, 456. [Google Scholar] [CrossRef] [Scilit] [PubMed]
  64. Li, S.; Kempe, M.; Brink, M.; Lemmink, K. Effectiveness of recovery strategies after training and competition in endurance athletes: An umbrella review. Sports Med. Open 2024, 10, 55. [Google Scholar] [CrossRef] [Scilit] [PubMed]
  65. Fullagar, H.H.K.; Skorski, S.; Duffield, R.; Hammes, D.; Coutts, A.J.; Meyer, T. Sleep and athletic performance: The effects of sleep loss, sleep extension, and sleep interventions. Sports Med. 2015, 45, 161–186. [Google Scholar] [CrossRef] [Scilit] [PubMed]
  66. Stoian, M.; Mănescu, D.C. Training–Fuel Coupling (TFC): A Molecular Sports Nutrition Framework for Energy Availability, Chrono-Nutrition, and Performance Optimization. Nutrients 2026, 18, 693. [Google Scholar] [CrossRef] [Scilit] [PubMed]
  67. Lastella, M.; Roach, G.D.; Halson, S.L.; Sargent, C. Sleep/wake behaviours of elite athletes from individual and team sports. Eur. J. Sport Sci. 2015, 15, 94–100. [Google Scholar] [CrossRef] [Scilit] [PubMed]
  68. Walsh, N.P.; Halson, S.L.; Sargent, C.; Roach, G.D.; Nedelec, M.; Gupta, L.; Leeder, J.; Fullagar, H.H.K.; Coutts, A.J.; Edwards, B.J.; et al. Sleep and the athlete: Narrative review and 2021 expert consensus recommendations. Br. J. Sports Med. 2021, 55, 356–368. [Google Scholar] [CrossRef] [Scilit] [PubMed]
  69. Mănescu, D.C.; Stoian, M.; Rădulescu, M.L.; Dinciu, C.C.; Mărgărit, I.R.; Năstase, M.; Mănescu, C.O. Exercise Timing in Sport: Molecular and Physiological Mechanisms Linking Performance, Recovery, and Biological Cost. Int. J. Mol. Sci. 2026, 27, 4415. [Google Scholar] [CrossRef] [Scilit] [PubMed]
  70. Daanen, H.A.M.; Lamberts, R.P.; Kallen, V.L.; Jin, A.; Van Meeteren, N.L.U. A systematic review on heart-rate recovery to monitor changes in training status in athletes. Int. J. Sports Physiol. Perform. 2012, 7, 251–260. [Google Scholar] [CrossRef] [Scilit] [PubMed]
  71. Bellenger, C.R.; Fuller, J.T.; Thomson, R.L.; Davison, K.; Robertson, E.Y.; Buckley, J.D. Monitoring athletic training status through autonomic heart rate regulation: A systematic review and meta-analysis. Sports Med. 2016, 46, 1461–1486. [Google Scholar] [CrossRef] [Scilit] [PubMed]
  72. Stanley, J.; Peake, J.M.; Buchheit, M. Cardiac parasympathetic reactivation following exercise: Implications for training prescription. Sports Med. 2013, 43, 1259–1277. [Google Scholar] [CrossRef] [Scilit] [PubMed]
  73. Buchheit, M. Monitoring training status with HR measures: Do all roads lead to Rome? Front. Physiol. 2014, 5, 73. [Google Scholar] [CrossRef] [Scilit] [PubMed]
  74. Plews, D.J.; Laursen, P.B.; Stanley, J.; Kilding, A.E.; Buchheit, M. Training adaptation and heart rate variability in elite endurance athletes: Opening the door to effective monitoring. Sports Med. 2013, 43, 773–781. [Google Scholar] [CrossRef] [Scilit] [PubMed]
  75. Flatt, A.A.; Esco, M.R. Evaluating individual training adaptation with smartphone-derived heart rate variability in a collegiate female soccer team. J. Strength Cond. Res. 2016, 30, 378–385. [Google Scholar] [CrossRef] [Scilit] [PubMed]
  76. Javaloyes, A.; Sarabia, J.M.; Lamberts, R.P.; Plews, D.; Moya-Ramon, M. Training prescription guided by heart-rate variability in cycling. Int. J. Sports Physiol. Perform. 2019, 14, 23–32. [Google Scholar] [CrossRef] [Scilit] [PubMed]
  77. Vesterinen, V.; Nummela, A.; Heikura, I.; Laine, T.; Hynynen, E.; Botella, J.; Häkkinen, K. Individual endurance training prescription with heart rate variability. Med. Sci. Sports Exerc. 2016, 48, 1347–1354. [Google Scholar] [CrossRef] [Scilit] [PubMed]
  78. Warr, D.M.; Pablos, C.; Sanchez-Alarcos, J.V.; Torres, V.; Izquierdo, J.M.; Redondo, J.C. Reliability of measurements during countermovement jump assessments: Analysis of performance across subphases. Cogent Soc. Sci. 2020, 6, 1843835. [Google Scholar] [CrossRef] [Scilit]
  79. Thorpe, R.T.; Atkinson, G.; Drust, B.; Gregson, W. Monitoring fatigue status in elite team-sport athletes: Implications for practice. Int. J. Sports Physiol. Perform. 2017, 12, S2-27–S2-34. [Google Scholar] [CrossRef] [Scilit] [PubMed]
  80. Gathercole, R.J.; Sporer, B.C.; Stellingwerff, T.; Sleivert, G.G. Alternative countermovement-jump analysis to quantify acute neuromuscular fatigue. Int. J. Sports Physiol. Perform. 2015, 10, 84–92. [Google Scholar] [CrossRef] [Scilit] [PubMed]
  81. Gathercole, R.J.; Sporer, B.C.; Stellingwerff, T.; Sleivert, G.G. Comparison of the capacity of different jump and sprint field tests to detect neuromuscular fatigue. J. Strength Cond. Res. 2015, 29, 2522–2531. [Google Scholar] [CrossRef] [Scilit] [PubMed]
  82. Claudino, J.G.; Cronin, J.; Mezencio, B.; McMaster, D.T.; McGuigan, M.; Tricoli, V.; Amadio, A.C.; Serrao, J.C. The countermovement jump to monitor neuromuscular status: A meta-analysis. J. Sci. Med. Sport 2017, 20, 397–402. [Google Scholar] [CrossRef] [Scilit] [PubMed]
  83. McLean, B.D.; Coutts, A.J.; Kelly, V.; McGuigan, M.R.; Cormack, S.J. Neuromuscular, endocrine, and perceptual fatigue responses during different length between-match microcycles in professional rugby league players. Int. J. Sports Physiol. Perform. 2010, 5, 367–383. [Google Scholar] [CrossRef] [Scilit] [PubMed]
  84. Twist, C.; Highton, J. Monitoring fatigue and recovery in rugby league players. Int. J. Sports Physiol. Perform. 2013, 8, 467–474. [Google Scholar] [CrossRef] [Scilit] [PubMed]
  85. Twist, C.; Waldron, M.; Highton, J.; Burt, D.; Daniels, M. Neuromuscular, biochemical and perceptual post-match fatigue in professional rugby league forwards and backs. J. Sports Sci. 2012, 30, 359–367. [Google Scholar] [CrossRef] [Scilit] [PubMed]
  86. Watkins, C.M.; Barillas, S.R.; Wong, M.A.; Archer, D.C.; Dobbs, I.J.; Lockie, R.G.; Coburn, J.W.; Tran, T.T.; Brown, L.E. Determination of vertical jump as a measure of neuromuscular readiness and fatigue. J. Strength Cond. Res. 2017, 31, 3305–3310. [Google Scholar] [CrossRef] [Scilit] [PubMed]
  87. Bishop, C.; Turner, A.; Read, P. Effects of inter-limb asymmetries on physical and sports performance: A systematic review. J. Sports Sci. 2018, 36, 1135–1144. [Google Scholar] [CrossRef] [Scilit] [PubMed]
  88. Fort-Vanmeerhaeghe, A.; Gual, G.; Romero-Rodriguez, D.; Unnitha, V. Lower limb neuromuscular asymmetry in volleyball and basketball players. J. Hum. Kinet. 2016, 50, 135–143. [Google Scholar] [CrossRef] [Scilit] [PubMed]
  89. Atkinson, G.; Batterham, A.M. True and false interindividual differences in the physiological response to an intervention. Exp. Physiol. 2015, 100, 577–588. [Google Scholar] [CrossRef] [Scilit] [PubMed]
  90. Hecksteden, A.; Kraushaar, J.; Scharhag-Rosenberger, F.; Theisen, D.; Senn, S.; Meyer, T. Individual response to exercise training: A statistical perspective. J. Appl. Physiol. 2015, 118, 1450–1459. [Google Scholar] [CrossRef] [Scilit] [PubMed]
  91. Koo, T.K.; Li, M.Y. A guideline of selecting and reporting intraclass correlation coefficients for reliability research. J. Chiropr. Med. 2016, 15, 155–163. [Google Scholar] [CrossRef] [Scilit] [PubMed]
  92. Liljequist, D.; Elfving, B.; Skavberg Roaldsen, K. Intraclass correlation: A discussion and demonstration of basic features. PLoS ONE 2019, 14, e0219854. [Google Scholar] [CrossRef] [Scilit] [PubMed]
  93. Curran-Everett, D. Explorations in statistics: The analysis of ratios and normalized data. Adv. Physiol. Educ. 2013, 37, 213–219. [Google Scholar] [CrossRef] [Scilit] [PubMed]
  94. Swinton, P.A.; Hemingway, B.S.; Saunders, B.; Gualano, B.; Dolan, E. A statistical framework to interpret individual response to intervention: Paving the way for personalised nutrition and exercise prescription. Front. Nutr. 2018, 5, 41. [Google Scholar] [CrossRef] [Scilit] [PubMed]
  95. Hecksteden, A.; Pitsch, W.; Rosenberger, F.; Meyer, T. Repeated testing for the assessment of individual response to exercise training. J. Appl. Physiol. 2018, 124, 1567–1579. [Google Scholar] [CrossRef] [Scilit] [PubMed]
  96. Mann, T.N.; Lamberts, R.P.; Lambert, M.I. Methods of prescribing relative exercise intensity: Physiological and practical considerations. Sports Med. 2013, 43, 613–625. [Google Scholar] [CrossRef] [Scilit] [PubMed]
  97. Buchheit, M. The numbers will love you back in return-I promise. Int. J. Sports Physiol. Perform. 2016, 11, 551–554. [Google Scholar] [CrossRef] [Scilit] [PubMed]
  98. Cormie, P.; McGuigan, M.R.; Newton, R.U. Developing maximal neuromuscular power: Part 2-training considerations for improving maximal power production. Sports Med. 2011, 41, 125–146. [Google Scholar] [CrossRef] [Scilit] [PubMed]
  99. Cormie, P.; McGuigan, M.R.; Newton, R.U. Developing maximal neuromuscular power: Part 1-biological basis of maximal power production. Sports Med. 2011, 41, 17–38. [Google Scholar] [CrossRef] [Scilit] [PubMed]
  100. Suchomel, T.J.; Nimphius, S.; Stone, M.H. The importance of muscular strength in athletic performance. Sports Med. 2016, 46, 1419–1449. [Google Scholar] [CrossRef] [Scilit] [PubMed]
  101. Suchomel, T.J.; Nimphius, S.; Bellon, C.R.; Stone, M.H. The importance of muscular strength: Training considerations. Sports Med. 2018, 48, 765–785. [Google Scholar] [CrossRef] [Scilit] [PubMed]
  102. Mănescu, A.M.; Hangu, S.Ș.; Mănescu, D.C. Nutritional Supplements for Muscle Hypertrophy: Mechanisms and Morphology—Focused Evidence. Nutrients 2025, 17, 3603. [Google Scholar] [CrossRef] [Scilit] [PubMed]
  103. Schoenfeld, B.J.; Grgic, J.; Van Every, D.W.; Plotkin, D.L. Loading recommendations for muscle strength, hypertrophy, and local endurance: A re-examination of the repetition continuum. Sports 2021, 9, 32. [Google Scholar] [CrossRef] [Scilit] [PubMed]
  104. Weakley, J.J.S.; Mann, B.; Banyard, H.G.; McLaren, S.; Scott, T.; Garcia-Ramos, A. Velocity-based training: From theory to application. Strength Cond. J. 2021, 43, 31–49. [Google Scholar] [CrossRef] [Scilit]
  105. Banyard, H.G.; Nosaka, K.; Haff, G.G. Reliability and validity of the load-velocity relationship to predict the one-repetition maximum back squat. J. Strength Cond. Res. 2017, 31, 1897–1904. [Google Scholar] [CrossRef] [Scilit] [PubMed]
  106. Gonzalez-Badillo, J.J.; Sanchez-Medina, L. Movement velocity as a measure of loading intensity in resistance training. Int. J. Sports Med. 2010, 31, 347–352. [Google Scholar] [CrossRef] [Scilit] [PubMed]
  107. Sanchez-Medina, L.; Gonzalez-Badillo, J.J. Velocity loss as an indicator of neuromuscular fatigue during resistance training. Med. Sci. Sports Exerc. 2011, 43, 1725–1734. [Google Scholar] [CrossRef] [Scilit] [PubMed]
  108. Pareja-Blanco, F.; Rodriguez-Rosell, D.; Sanchez-Medina, L.; Gorostiaga, E.M.; Gonzalez-Badillo, J.J. Effect of movement velocity during resistance training on neuromuscular performance. Int. J. Sports Med. 2014, 35, 916–924. [Google Scholar] [CrossRef] [Scilit] [PubMed]
  109. Mann, J.B.; Ivey, P.A.; Sayers, S.P. Velocity-based training in football. Strength Cond. J. 2015, 37, 52–57. [Google Scholar] [CrossRef] [Scilit]
  110. Scott, B.R.; Duthie, G.M.; Thornton, H.R.; Dascombe, B.J. Training monitoring for resistance exercise: Theory and applications. Sports Med. 2016, 46, 687–698. [Google Scholar] [CrossRef] [Scilit] [PubMed]
  111. Schmitt, L.; Regnard, J.; Desmarets, M.; Mauny, F.; Mourot, L.; Fouillot, J.P.; Coulmy, N.; Millet, G.P. Fatigue shifts and scatters heart rate variability in elite endurance athletes. PLoS ONE 2013, 8, e71588. [Google Scholar] [CrossRef] [Scilit] [PubMed]
  112. Buchheit, M.; Racinais, S.; Bilsborough, J.C.; Bourdon, P.C.; Voss, S.C.; Hocking, J.; Cordy, J.; Mendez-Villanueva, A.; Coutts, A.J. Monitoring fitness, fatigue and running performance during a pre-season training camp in elite football players. J. Sci. Med. Sport 2013, 16, 550–555. [Google Scholar] [CrossRef] [Scilit] [PubMed]
  113. Brink, M.S.; Visscher, C.; Coutts, A.J.; Lemmink, K.A.P.M. Changes in perceived stress and recovery in overreached young elite soccer players. Scand. J. Med. Sci. Sports 2012, 22, 285–292. [Google Scholar] [CrossRef] [Scilit] [PubMed]
  114. Grandou, C.; Wallace, L.; Impellizzeri, F.M.; Allen, N.G.; Coutts, A.J. Overtraining in resistance exercise: An exploratory systematic review and methodological appraisal of the literature. Sports Med. 2020, 50, 815–828. [Google Scholar] [CrossRef] [Scilit] [PubMed]
  115. Mănescu, D.C.; Voinea, A.; Plastoi, C.D.; Iacobini, A.R.; Vulpe, A.A.; Pîrvan, A.; Dinciu, C.C.; Vulpe, B.I.; Băltărețu, C.; Iacobini, A. Molecular Biomarkers of Training Responses: A Systems Framework for Exercise Adaptation and Athlete Monitoring. Int. J. Mol. Sci. 2026, 27, 3601. [Google Scholar] [CrossRef] [Scilit] [PubMed]
  116. Le Meur, Y.; Pichon, A.; Schaal, K.; Schmitt, L.; Louis, J.; Gueneron, J.; Vidal, P.P.; Hausswirth, C. Evidence of parasympathetic hyperactivity in functionally overreached athletes. Med. Sci. Sports Exerc. 2013, 45, 2061–2071. [Google Scholar] [CrossRef] [Scilit] [PubMed]
  117. Mănescu, D.C.; Plăstoi, C.D.; Petre, R.L.; Mărgărit, I.R.; Mănescu, A.M.; Pîrvan, A. Metabolic Overdrive in Elite Sport: A Systems Model of AMPK–mTOR Oscillation, NAD+ Economy, and Epigenetic Drift. Int. J. Mol. Sci. 2026, 27, 1817. [Google Scholar] [CrossRef] [Scilit] [PubMed]
  118. Bellinger, P.; Desbrow, B.; Derave, W.; Lievens, E.; Irwin, C.; Sabapathy, S.; Kennedy, B.; Craven, J.; Pennell, E.; Rice, H.; et al. Muscle fiber typology is associated with the incidence of overreaching in response to overload training. J. Appl. Physiol. 2020, 129, 823–836. [Google Scholar] [CrossRef] [Scilit] [PubMed]
  119. Taylor, J.L.; Amann, M.; Duchateau, J.; Meeusen, R.; Rice, C.L. Neural contributions to muscle fatigue: From the brain to the muscle and back again. Med. Sci. Sports Exerc. 2016, 48, 2294–2306. [Google Scholar] [CrossRef] [Scilit] [PubMed]
  120. Pageaux, B. Perception of effort in exercise science: Definition, measurement and perspectives. Eur. J. Sport Sci. 2016, 16, 885–894. [Google Scholar] [CrossRef] [Scilit] [PubMed]
  121. Noakes, T.D. Fatigue is a brain-derived emotion that regulates the exercise behavior to ensure the protection of whole body homeostasis. Front. Physiol. 2012, 3, 82. [Google Scholar] [CrossRef] [Scilit] [PubMed]
  122. Enoka, R.M.; Duchateau, J. Translating fatigue to human performance. Med. Sci. Sports Exerc. 2016, 48, 2228–2238. [Google Scholar] [CrossRef] [Scilit] [PubMed]
  123. Seiler, S. What is best practice for training intensity and duration distribution in endurance athletes? Int. J. Sports Physiol. Perform. 2010, 5, 276–291. [Google Scholar] [CrossRef] [Scilit] [PubMed]
  124. Stoggl, T.L.; Sperlich, B. Polarized training has greater impact on key endurance variables than threshold, high intensity, or high volume training. Front. Physiol. 2014, 5, 33. [Google Scholar] [CrossRef] [Scilit] [PubMed]
  125. Rosenblat, M.A.; Perrotta, A.S.; Vicenzino, B. Polarized vs. threshold training intensity distribution on endurance sport performance: A systematic review and meta-analysis of randomized controlled trials. J. Strength Cond. Res. 2019, 33, 3491–3500. [Google Scholar] [CrossRef] [Scilit] [PubMed]
  126. Stoggl, T.L.; Sperlich, B. The training intensity distribution among well-trained and elite endurance athletes. Front. Physiol. 2015, 6, 295. [Google Scholar] [CrossRef] [Scilit] [PubMed]
  127. Tonnessen, E.; Sylta, O.; Haugen, T.A.; Hem, E.; Svendsen, I.S.; Seiler, S. The road to gold: Training and peaking characteristics in the year prior to a gold medal endurance performance. PLoS ONE 2014, 9, e101796. [Google Scholar] [CrossRef] [Scilit] [PubMed]
  128. Kiely, J. Periodization theory: Confronting an inconvenient truth. Sports Med. 2018, 48, 753–764. [Google Scholar] [CrossRef] [Scilit] [PubMed]
  129. Duking, P.; Fuss, F.K.; Holmberg, H.C.; Sperlich, B. Recommendations for assessment of the reliability, sensitivity, and validity of data from wearable sensors designed for monitoring physical activity. JMIR Mhealth Uhealth 2018, 6, e102. [Google Scholar] [CrossRef] [Scilit] [PubMed]
  130. Camomilla, V.; Bergamini, E.; Fantozzi, S.; Vannozzi, G. Trends supporting the in-field use of wearable inertial sensors for sport performance evaluation: A systematic review. Sensors 2018, 18, 873. [Google Scholar] [CrossRef] [Scilit] [PubMed]
  131. Li, R.T.; Kling, S.R.; Salata, M.J.; Cupp, S.A.; Sheehan, J.; Voos, J.E. Wearable performance devices in sports medicine. Sports Health 2016, 8, 74–78. [Google Scholar] [CrossRef] [Scilit] [PubMed]
  132. Seshadri, D.R.; Li, R.T.; Voos, J.E.; Rowbottom, J.R.; Alfes, C.M.; Zorman, C.A.; Drummond, C.K. Wearable sensors for monitoring the internal and external workload of the athlete. npj Digit. Med. 2019, 2, 71. [Google Scholar] [CrossRef] [Scilit] [PubMed]
  133. Banister, E.W.; Calvert, T.W.; Savage, M.V.; Bach, T. A systems model of training for athletic performance. Aust. J. Sports Med. 1975, 7, 57–61. [Google Scholar]
  134. Borg, G.A.V. Psychophysical bases of perceived exertion. Med. Sci. Sports Exerc. 1982, 14, 377–381. [Google Scholar] [CrossRef] [Scilit]
  135. Foster, C. Monitoring training in athletes with reference to overtraining syndrome. Med. Sci. Sports Exerc. 1998, 30, 1164–1168. [Google Scholar] [CrossRef] [Scilit] [PubMed]
  136. Morton, R.H.; Fitz-Clarke, J.R.; Banister, E.W. Modeling human performance in running. J. Appl. Physiol. 1990, 69, 1171–1177. [Google Scholar] [CrossRef] [Scilit] [PubMed]
  137. Impellizzeri, F.M.; Rampinini, E.; Coutts, A.J.; Sassi, A.; Marcora, S.M. Use of RPE-based training load in soccer. Med. Sci. Sports Exerc. 2004, 36, 1042–1047. [Google Scholar] [CrossRef] [Scilit] [PubMed]
  138. Hopkins, W.G. Measures of reliability in sports medicine and science. Sports Med. 2000, 30, 1–15. [Google Scholar] [CrossRef] [Scilit] [PubMed]
  139. Weir, J.P. Quantifying test-retest reliability using the intraclass correlation coefficient and the SEM. J. Strength Cond. Res. 2005, 19, 231–240. [Google Scholar] [CrossRef] [Scilit]
Figure 1. The monitoring–decision gap in athletic performance. Modern monitoring expands measurement capacity, but without an explicit interpretation and decision layer, information density can increase uncertainty rather than improve training action [1,2,3,4,5,6,7,8,9,10,11,12,13,14,15].
Jfmk 11 00245 g001
Figure 2. Evidence-to-decision architecture. External load, internal load, and readiness markers should be interpreted through convergent logic before they are converted into training actions. The figure emphasizes reliability, noise, and multi-marker agreement as intermediate steps [36,37,38,39,40,41,42,43,44,45,46,47,48,49,50,51,52,53,54,55,56,57,58].
Jfmk 11 00245 g002
Figure 3. The LOAD-R adaptive training framework. Athletic performance optimization is conceptualized as a repeated loop in which training load is interpreted through athlete response, converted into an adaptive-state classification, translated into action, and re-evaluated over time [1,2,3,4,5,6,7,8,9,10,11,12,13,14,15,16,17,18,19,20,21,22,73,74,75,76,77,78,79,80,81,82,83,84,85,86,87,88]. The figure extends the evidence-to-decision pathway by embedding it within a repeated adaptive loop. The arrows indicate the sequential progression through the LOAD-R cycle, whereas the dotted central circle represents the continuous adaptive feedback process linking all framework components.
Jfmk 11 00245 g003
Figure 4. Decision-zone matrix for adaptive training. The same load can imply progression, maintenance, protection, recovery, or contextual reassessment depending on the athlete-readiness state and recent trajectory. Color coding reflects decision zones ranging from underload (blue) to maladaptive risk (red), with gray indicating uncertainty requiring reassessment [23,24,25,26,27,28,29,30,31,32,33,34,35,89,90,91,92,93,94,95,96,97,98].
Jfmk 11 00245 g004
Figure 5. Athlete response archetypes under comparable training load. Similar external stimuli can produce different response trajectories depending on recovery capacity, contextual stress, neuromuscular state, and recent adaptation history [99,100,101,102,103,104,105,106,107,108,109,110,111,112,113,114,115,116,117,118,119,120,121,122].
Jfmk 11 00245 g005
Table 1. Evidence domains and decision value in adaptive training.
Evidence
Domain
Primary
Contribution
Common Failure
When Isolated
Function in
LOAD-R
External loadDescribes the mechanical or task stimulus applied to the athlete.High values may be over-interpreted as inherently dangerous or inherently productive.Defines the L component: what the athlete was asked to absorb.
Internal loadCaptures the perceived or physiological cost of completing the session.May be inflated by non-training stress, sleep loss, or illness if the context is ignored.Begins the O component: how the athlete experienced the stimulus.
Readiness
and fatigue
Indicates whether neuromuscular, perceptual, or autonomic status is stable, elevated, or suppressed.Single markers can be noisy, insensitive, or sport-specific.Supports A: classification of adaptive state.
Recovery
and context
Places performance output in the broader 24- to 72-h recovery architecture.Recovery signals can be mistaken for weakness rather than capacity constraints.Constrains D: the magnitude of progression or reduction.
Performance outcomeTests whether the decision improved task quality or adaptation.The outcome is often checked too late or detached from the preceding state.Completes R: re-evaluation and baseline updating.
Notes: This table summarizes the logic used to organize the narrative synthesis. Evidence domains were not treated as competing tools but as complementary layers in a decision system [1,2,3,4,5,6,7,8,9,10,11,12,13,14,15,16,17,18,19,20,21,22,23,24,25,26,27,28,29,30,31,32,33,34,35].
Table 2. Monitoring variables and their applied interpretation.
DomainRepresentative
Variables
Practical
Interpretation
Minimum
Field Implementation
External loadDistance, high-speed running, accelerations, decelerations, sprint volume, tonnage, sets, reps, velocity loss.Defines the imposed stimulus and allows comparison between planned and actual exposure.Training diary plus sport-relevant load metric.
Internal loadRPE score, session RPE, sRPE-load (RPE × duration), heart rate, TRIMP, perceived session difficulty.Describes the athlete-specific cost of the same external stimulus.Session RPE collected 15–30 min post-session; compute sRPE-load only when duration is multiplied explicitly.
Neuromuscular readinessCMJ height, flight time:contraction time, RSI-modified, jump power, force-time variables.Identifies acute changes in power, stiffness, or neuromuscular function.Standardized CMJ protocol 2–3 times weekly.
Recovery
and wellness
Sleep, soreness, fatigue, stress, mood, perceived recovery, HRV.Places training tolerance inside broader recovery capacity.Short wellness form plus sleep duration/quality.
Performance
outcome
Sprint, jump, strength, endurance, and sport-specific task quality.Determines whether the monitoring-guided decision improved the target.Weekly or block-level performance check.
Notes: Representative variables are examples, not a mandatory battery. RPE, session RPE, and sRPE-load are related but not interchangeable. Selection should be sport-specific, reliable, repeatable, and linked to decisions [36,37,38,39,40,41,42,43,44,45,46,47,48,49,50,51,52,53,54,55,56,57,58].
Table 3. LOAD-R components and operational questions.
ComponentOperational QuestionPrimary Data SourcesDefault Decision
Relevance
L—LoadWhat stimulus was planned and what was actually completed?Session plan, GPS, training diary, tonnage, velocity, duration, sRPE-load.Defines whether progression, maintenance, or reduction is even plausible.
O—Organism responseHow did the athlete absorb the stimulus?RPE, HR/HRV, CMJ, wellness, soreness, sleep, mood, and technical quality.Identifies tolerance, strain, or mismatch.
A—Adaptive stateWhat state best explains the current response pattern?Individual baseline, marker convergence, trend, context, measurement error.Classifies adaptive, functional overload, underload, uncertainty, or maladaptation.
D—DecisionWhat should be changed today or this week?Training objective, priority session, competitive calendar, and athlete state.Progress, maintain, modify, deload, recover.
R—Re-evaluationDid the decision improve performance or reduce cost?Next-day readiness, weekly performance, repeated tests, injury/illness flags.Updates baselines and improves future decisions.
Notes: LOAD-R is intended as a flexible architecture rather than a universal algorithm. Each component should be populated with variables appropriate to the sport, competitive level, and resources available [1,2,3,4,5,6,7,8,9,10,11,12,13,14,15,16,17,18,19,20,21,22,73,74,75,76,77,78,79,80,81,82,83,84,85,86,87,88].
Table 4. Decision-zone interpretation for adaptive load management.
ZoneLoad/Readiness
Pattern
InterpretationDefault
Action
Risk
If Misread
Green—AdaptiveModerate/high load with stable or high readiness.The athlete is tolerating the stimulus.Maintain or progress according to plan.Underloading a prepared athlete.
Yellow—Functional overloadHigh load with mild, expected readiness suppression.Short-term stress may be productive if planned.Maintain briefly; monitor closely.Extending overload beyond tolerance.
Red—Maladaptive stressHigh load with persistent readiness suppression and performance decline.Fatigue accumulation or unresolved stress is likely.Reduce intensity/volume; prioritize recovery.Ignoring early warning signs.
Blue—UnderloadLow load with high readiness and flat performance.Stimulus may be insufficient.Increase load, density, or specificity.Mistaking freshness for optimal adaptation.
Gray—UncertainVariable or conflicting signals.Measurement noise, context, or poor protocol may dominate.Repeat measure; check sleep, stress, illness, technique.Acting aggressively on unreliable data.
Notes: Zone categories are decision aids. They should be interpreted relative to individual rolling baselines, known measurement error, sport context, session priority, and athlete history rather than as universal thresholds, and should not be exported directly across sports without local validation [23,24,25,26,27,28,29,30,31,32,33,34,35,89,90,91,92,93,94,95,96,97,98].
Table 5. If-then rules for coach-facing training adjustment.
ConditionLikely InterpretationTraining DecisionFollow-Up Question
High external load + stable readiness + stable outputProductive loading and adequate tolerance.Maintain planned progression.Is the next key session protected?
High load + reduced CMJ
+high soreness
Neuromuscular fatigue after high mechanical stress.Reduce sprint/power exposure or convert to technical work.Does readiness rebound within 24–72 h?
Normal external load
+unusually high sRPE
Internal strain mismatch.Check sleep, stress, illness, nutrition, and heat exposure.Is this athlete usually honest and consistent with RPE?
Low load + high readiness
+flat performance
Insufficient stimulus or poor specificity.Increase load, intensity, or task specificity.Is the athlete protected too much?
Low load + low readinessNon-training stress or recovery debt.Prioritize recovery and contextual assessment.What happened outside training?
Stable load + rising RPE across the weekAccumulating fatigue or reduced tolerance.Reduce density or insert recovery.Is performance also declining?
Suppressed readiness before the low-priority sessionRecovery opportunity.Convert to a regenerative or technical session.Can the high-value session be protected?
Suppressed readiness before the key sessionRisk of low-quality output.Modify objective or extend warm-up; avoid maximal exposure if convergent signals are poor.Is the competition calendar forcing risk?
Performance improves after deloadAccumulated fatigue confirmed.Adjust future overload duration.Was the previous block too long or too dense?
Performance does not improve after deloadA deeper issue may be present.Assess injury, illness, sleep, nutrition, and psychological load.Is referral or medical review needed?
Notes: Rules are deliberately conditional. They translate common monitoring patterns into actions while preserving coaching judgment and contextual interpretation [1,2,3,4,5,6,7,8,9,10,11,12,13,14,15,16,17,18,19,20,21,22,23,24,25,26,27,28,29,30,31,32,33,34,35,89,90,91,92,93,94,95,96,97,98].
Table 6. Response archetypes and monitoring priorities.
ArchetypeTypical PatternPrimary RiskMonitoring PriorityCoaching Response
Fast adapterReadiness stable; performance improves during progressive load.Under-challenging the athlete.Track progression without excessive testing burden.Progress cautiously and protect recovery.
Fatigue
accumulator
Readiness declines; RPE rises; output falls after repeated loading.Continuing overload beyond useful adaptation.CMJ, soreness, sleep, RPE trend, next-day performance.Deload, redistribute intensity, or reduce density.
Underloaded
athlete
Readiness high; load low; performance stagnates.Comfortable non-adaptation.Performance trend and stimulus specificity.Increase stimulus or change training content.
Context-stressed athleteLoad moderate; wellness poor; readiness variable.Misattributing life stress to poor motivation.Sleep, stress, mood, academic/workload, and illness flags.Modify load and address context.
Unstable
responder
Large day-to-day variability across markers.Overreacting to noisy signals.Protocol consistency and repeated measurements.Stabilize the schedule and measurement conditions.
Notes: Archetypes are interpretative aids, not diagnostic labels. Athletes may move between archetypes across phases, sports, and competitive demands [99,100,101,102,103,104,105,106,107,108,109,110,111,112,113,114,115,116,117,118,119,120,121,122].
Table 7. Implementation levels for LOAD-R in applied sport settings.
LevelToolsBest Suited forDecision StrengthMain Constraint
Low-costRPE/sRPE-load, wellness, sleep log, training diary, periodic CMJ or jump app.Amateur clubs, university teams, small performance programs.Strong if the collection is consistent and actions are explicit.Limited precision and possible self-report bias.
ModerateJump mat, HR monitor, structured dashboard, simple field tests.Academies, semi-professional teams, and developing high-performance programs.Allows weekly state tracking and more reliable trends.Requires staff time and protocol discipline.
High-performanceGPS/LPS, force plate, HRV, sleep wearable, integrated AMS.Elite team sports and professional programs.Supports individual response modeling and staff communication.Data overload and false precision.
Research-gradeLongitudinal modeling, biomarker sampling, advanced statistics, and validation design.Applied research and framework testing.Can test predictions and refine thresholds.Higher cost and complexity.
Notes: Tool level does not determine decision quality. The most important requirement is that variables are reliable, context-specific, and tied to predefined actions; in lower-resource settings, subjective scales also require familiarization and calibration before they are used for high-stakes decisions [123,124,125,126,127,128,129,130,131,132,133,134,135,136,137,138,139].
Table 8. Reporting and validation checklist for future LOAD-R studies.
Design ElementRationaleRecommended Minimum Practice
Individual baselineGroup thresholds can hide meaningful within-athlete change.Report baseline window, reliability, and decision threshold.
Measurement errorSmall changes may be noise.Report ICC, CV, SEM, or the smallest worthwhile change where possible.
Training objectiveThe same marker has a different meaning across session goals.State whether the goal is adaptation, expression, recovery, or competition specificity.
Contextual stressSleep, soreness, illness, travel, or academic load can change tolerance.Collect a concise context/wellness measure.
Decision ruleMonitoring without action is incomplete.State what action was taken when thresholds or zones were reached.
Outcome checkThe decision must be evaluated.Report next-day readiness and block-level performance outcomes.
Sport specificityGeneric dashboards may miss target performance.Justify variable selection based on sport and training phase.
Notes: The checklist is intended to improve interpretability, not to impose a rigid reporting standard. It aligns monitoring design with the requirements of decision support and future validation [89,90,91,92,93,94,95,96,97,98,99,100,101,102,103,104,105,106,107,108,109,110,111,112,113,114,115,116,117,118,119,120,121,122,123,124,125,126,127,128,129,130,131,132].
Disclaimer/Publisher’s Note: The statements, opinions and data contained in all publications are solely those of the individual author(s) and contributor(s) and not of MDPI and/or the editor(s). MDPI and/or the editor(s) disclaim responsibility for any injury to people or property resulting from any ideas, methods, instructions or products referred to in the content.