2. Materials and Methods
2.1. Study Design
The present study followed the Declaration of Helsinki regulations [
113]. The protocol was approved by the Ethical Committee of the Faculty of Medicine and Pharmacy, University of Oradea, Romania (No. 21/25 February 2021), and the Gym Committee (No 7/3 October 2022).
This cross-sectional study was conducted as face-to-face interviews at two popular gymnasiums in Oradea, Romania, from 15 January to 15 December 2024. Participants were regular gym goers in these 2 gyms, males and females aged 18–60 years old, Romanian language speakers, and residents of the Oradea Metropolitan Area [
114]. The inclusion and exclusion criteria are displayed in
Table 1.
Two qualified coaches conducted a rigorous check and selection process for potential participants at both gym locations. Only 165 fulfilled the inclusion criteria, 55 females and 110 males. They revealed their preference for protein, creatine, and L-carnitine supplements; they had regular training sessions at least twice a week at one of the gym locations. All participants were differentiated by supplement type: 42/165 were protein supplement users (PSU), 38/35 were creatine supplement users (CSU), 37/165 were L-carnitine supplement users (37/165), and 48/165 preferred to consume them in combination—protein, creatine, and L-carnitine supplement users (PCLcSUs, 48/165).
2.2. Method
Participants received brief instructions about the purpose and nature of the present research. Written informed consent was obtained from each participant who voluntarily participated in the present study. The data collection tool was a face-to-face interview based on a complex questionnaire (available in the
Supplementary Material) adapted from previous works [
6,
82,
116,
117]. The participants were assured that the researchers would maintain their privacy and keep the data collected private. Measurements of body weight and height were made for all individuals before the interview, and the body mass index (BMI) was calculated under WHO guidelines using the Quetelet equation: body weight (kg)/height
2 (m
2) [
118].
The questionnaire’s first section focused on demographic and socio-economic information. Age, gender, education level, occupation, and monthly income were included in the socio-demographic data-related inquiries. The participants were asked about their type and degree of activity at work, classifying them as follows: completely sedentary in office jobs, physically active jobs, and a combination of both.
The second section of the questionnaire investigated the participants’ lifestyles and healthcare levels (body weight, unhealthy habits, diet type, daily calorie consumption, daily protein consumption, and frequency of daily meals).
The third section contained data about gym workout routines. It included detailed information about how long it had been since the participants started working out at the gym, how many days a week they work out there, how many hours/minutes they spend in the gym, what kinds of exercises they do there—such as cardio exercises, strength training, and a mix of both exercises—and the scope of gym training.
The fourth section of the questionnaire examined the participants’ awareness of NSs, their motivation for using them, administration details, benefits, and any claimed side effects after using them in conjunction with gym practice.
2.3. Statistical Analysis
The reliability analysis of the internal model of XLSTAT Premium v.2024.4.2.1426 by Lumivero (Denver, CO, USA) investigated the questionnaire, examining the intercorrelation between all questions. Cronbach’s alpha index and Guttman L1–L6 coefficients were calculated [
119].
Descriptive statistics were computed to summarize and analyze the dataset’s central tendency, dispersion, and distribution, providing essential insights into the study variables. This analysis was conducted using XLSTAT Premium 2024 v. 2024.4.2.1426 and followed methodologies outlined in previous research studies [
120,
121]. Data are expressed as frequency (number) and relative frequency (percentage).
Furthermore, principal component analysis (PCA) was performed using Pearson’s correlation to detect the relationships among variables [
122]. The modifiable factor was NS consumption, while the influential ones were all aspects investigated in the face-to-face questionnaire.
Finally, the chi-square independence test assessed the significance of each variable parameter’s influence on the risk of potential side effects, calculating p-values.
The statistical significance was set at p-value < 0.05, indicating that results below this threshold were considered statistically significant, aligning with standard health and nutrition research practices.
All statistical tools used ensured robust and reliable data analysis, facilitating the accurate interpretation of relationships between variables.
3. Results
3.1. Reliability Analysis
The Cronbach’s alpha index value was 0.947, and the Guttman L1–L6 coefficients were 0.910–1.000. The correlation matrix, covariance matrix, and high coefficients revealed that all questions were significantly intercorrelated. The data obtained confirmed the questionnaire’s substantial reliability and appreciable internal consistency, thus confirming its high quality. More details are available in the
Supplementary Material.
3.2. Socio-Demographic Data of Participants
The present study enrolled 165 recreational gym goers who preferred various NSs. Of the participants, 33.33% (55/165) were women and 66.67% (110/165) were men (p < 0.05). Over 50% (87/165, 52.73%) were 18–30 years old, and 2.42% (4/165) were 50–60 years old (p < 0.05). Similar percentages (23.64% and 21.21%, respectively) belonged to the 30–40 and 41–50 age groups.
Most participants (135/165) had a substantial educational level: university studies (105/165, 63.64%) and master’s/doctorate (30/165, 18.18%), while only 18.18% (30/165) had a high school education (
p < 0.05). Monthly income varied from <2000 RON (3/165, 1.82%) to >6000 RON (43/165, 26.06%) (
p < 0.05). Most respondents had 2000–4000 RON (75/165, 45.45%), followed by those with 4001–6000 RON (44/165, 26.67%) (
p < 0.05) (
Table 2).
The daily work (DW) regimen involved >8 h for most of them (91/165, 55.15%), followed, in decreasing order, by those with 4–8 h (69/165, 41.82%) and 1–4 h (5/165, 3.03%) (
p < 0.05). Their daily work consisted of physical activity (44/165, 26.67%) and office work (54/165, 32.73%); 40.61% of participants (67/165) had combined work (physical activity and office work) (
p < 0.05) (
Table 2).
3.3. Lifestyle Patterns and Self-Care Awareness
The following questions investigated the participants’ lifestyles: unhealthy habits, diet type, daily meal frequency and nutritional content, body weight type, and illness history. All data are displayed in
Table 3.
Most gym goer participants were non-smokers (116/165, 70.3%), while only 29.70% (
p < 0.05) declared that they were smokers (daily and occasionally, in similar percentages: 15.15% vs. 14.55%,
p > 0.05). Only 19.39% of respondents stated they were not alcohol consumers (32/165), while most of them consumed alcohol (80.61%,
p < 0.05). Over 60% of respondents (107/165, 64.85%) had a balanced diet (
Table 2). Extreme diets (hyperprotein, vegetarian, and low-carb) had significantly lower incidences (19.39% vs. 9.7% vs. 6.06%,
p < 0.05). Most respondents had 3 meals/day (49.49%, 81/165) or 3 meals + 2 snacks (31.52%, 52/165) (
p < 0.05). Several gym goers had 2 meals/daily (18/165, 10.91%), while 8.48% (14/165) preferred intermittent fasting (
Table 2). The daily calorie (DC) rate ranged between 1000–1500 Cal and >3500 Cal. Over 50% (88/175, 53.33%) consumed 1501–2500 Cal/day (
Table 2). Around 5/165 (3.03%) participants did not know their DC consumption; most were men (4/165) vs. women (1/154) (
p < 0.05).
Daily protein (DP) intake varied between <50 g (1/165, 0.61%) and >250 g (7/165, 4.24%) (p < 0.05). Most respondents consumed 50–150 g of protein daily (79/165, 47.88%) and had a normal weight (83/165, 50.30%) or were overweight (76/165, 46.06%). Substantial differences were recorded between women and men in the overweight category (14.55% vs. 61.82%, p < 0.05). Only 2 participants (men) were obese (2/165, 1.21%), and only 4 were underweight (3 females and 1 male).
Principal component analysis of the baseline data showed that normal weight (NW) moderately correlated with the 18–30 and 31–40 age groups (r = 0.689, r = 0.760, p > 0.05), DW > 8 h (r = 0.740, p > 0.05), and physical work (r = 0.749, p > 0.05). Both age groups were substantially correlated with DW > 8 h and physical work (r = 0.996–0.999, p < 0.05). On the other hand, OW was strongly associated with the >50 age group and moderately correlates with the 41–50 age group (r = 0.762, p > 0.05) and DW = 1–4 h and 4–8 h (r = 0.778, 0.662, p > 0.05). Both DW periods highly correlated with the 41–50 (r =0.999–0.986, p < 0.05) and >50 (r = 0.943–0.873, p > 0.05) age groups. A remarkable correlation existed between OW and DC > 3500 (r = 0.999, p < 0.05) and a moderate one between OW and DC = 1000–1500, DC = 3001–3500, and intermittent fasting (r = 0.770–0.667, p > 0.05). Contrarily, NW correlated well with DC = 2501–3000 (r = 0.816, p > 0.05) and was moderately associated with DC = 2501–3000 and DC = 2001–2500 (r = 0.762, r = 0.703, p > 0.05) and with all daily meal frequencies (r = 0.697–0.623, p > 0.05).
Normal weight was substantially associated with females (r = 0.987, p < 0.05), while OW displayed a strong correlation with DP <50 g (r = 0.999, p < 0.05). NW had a good correlation with high school education (r = 0.863, p > 0.05), while OW correlated with males (r = 0.837, p > 0.05). NW moderately correlated with DP = 151–200 g, DP = 201–250 g, and master’s/doc (r = 0.789–0.709, p > 0.05), while OW correlated with DP = 101–150 g, DP > 250 g, and university (r = 0.728–0.633, p > 0.05).
3.4. Nutritional Supplements and Training Data
Of 165 gym goers, 38 (23.03%) were CSUs, 37 (22.42%) were LcSUs, 42 (25.45%) were PSUs, and 48 (29.09%) were PCLcSUs (
Table 4).
The gym goers’ period of regular practices varied between <1 month (47/165) and >1 year (89/165), while the gym goers’ weekly training frequencies were <3 (57/165) times and ≥5 times (38/165) (
p < 0.05); the training time ranged from <1 h (36/165) and >2 h (3/165) (
p < 0.05) (
Table 3).
Three types of exercises were available, cardio (15/165), force (89/165), and cardio + force (61/165), and the main reasons for training were muscle mass growth (MMG, 82/165), muscle mass tonus (55/165), weight loss (19/165), and competition (9/165) (
p < 0.05) (
Table 4).
Numerous NSU participants had been practicing recreationally at the gym for over one year: 18/38 CSUs, 18/27 LcSUs, 22/42 PCLcSUs, and 31/48 PSUs. A significant percentage of them started going to the gym very recently, for less than 1 month: 41.57% of PCLcSUs, 31.58% of CSUs, and 29.73% of LcSUs (
Table 3).
Most PSUs went to the gym 3–4 times/week (26/42, 61.9%), followed by 18/38 CSUs (47.37%). The other 41.67% of PCLcSUs and 40.54% of LcSUs had less than 3 training sessions/week.
The gym training session duration was 1–2 h for most participants (70.27—83.33%) vs. others: <1 h (20.83–29.73%, p < 0.05) and >2 h (0–6.25%, p < 0.05).
Creatine and L-carnitine were consumed in similar percentages for force training (65.79 and 62.16%, respectively, p > 0.05), while PCLcS and PS were used in cardio + force and force training in the same measure (42.86–47.92%, p > 0.05).
Muscle mass growth was the principal training scope for all NSUs (40.54–57.89%), followed by muscular tonus (27.08–40.54%) (
p > 0.05) (
Table 3). For weight loss, LcS and PS were used in equal measure (almost 16%), while PCLcS was also most consumed for competition (10.42%).
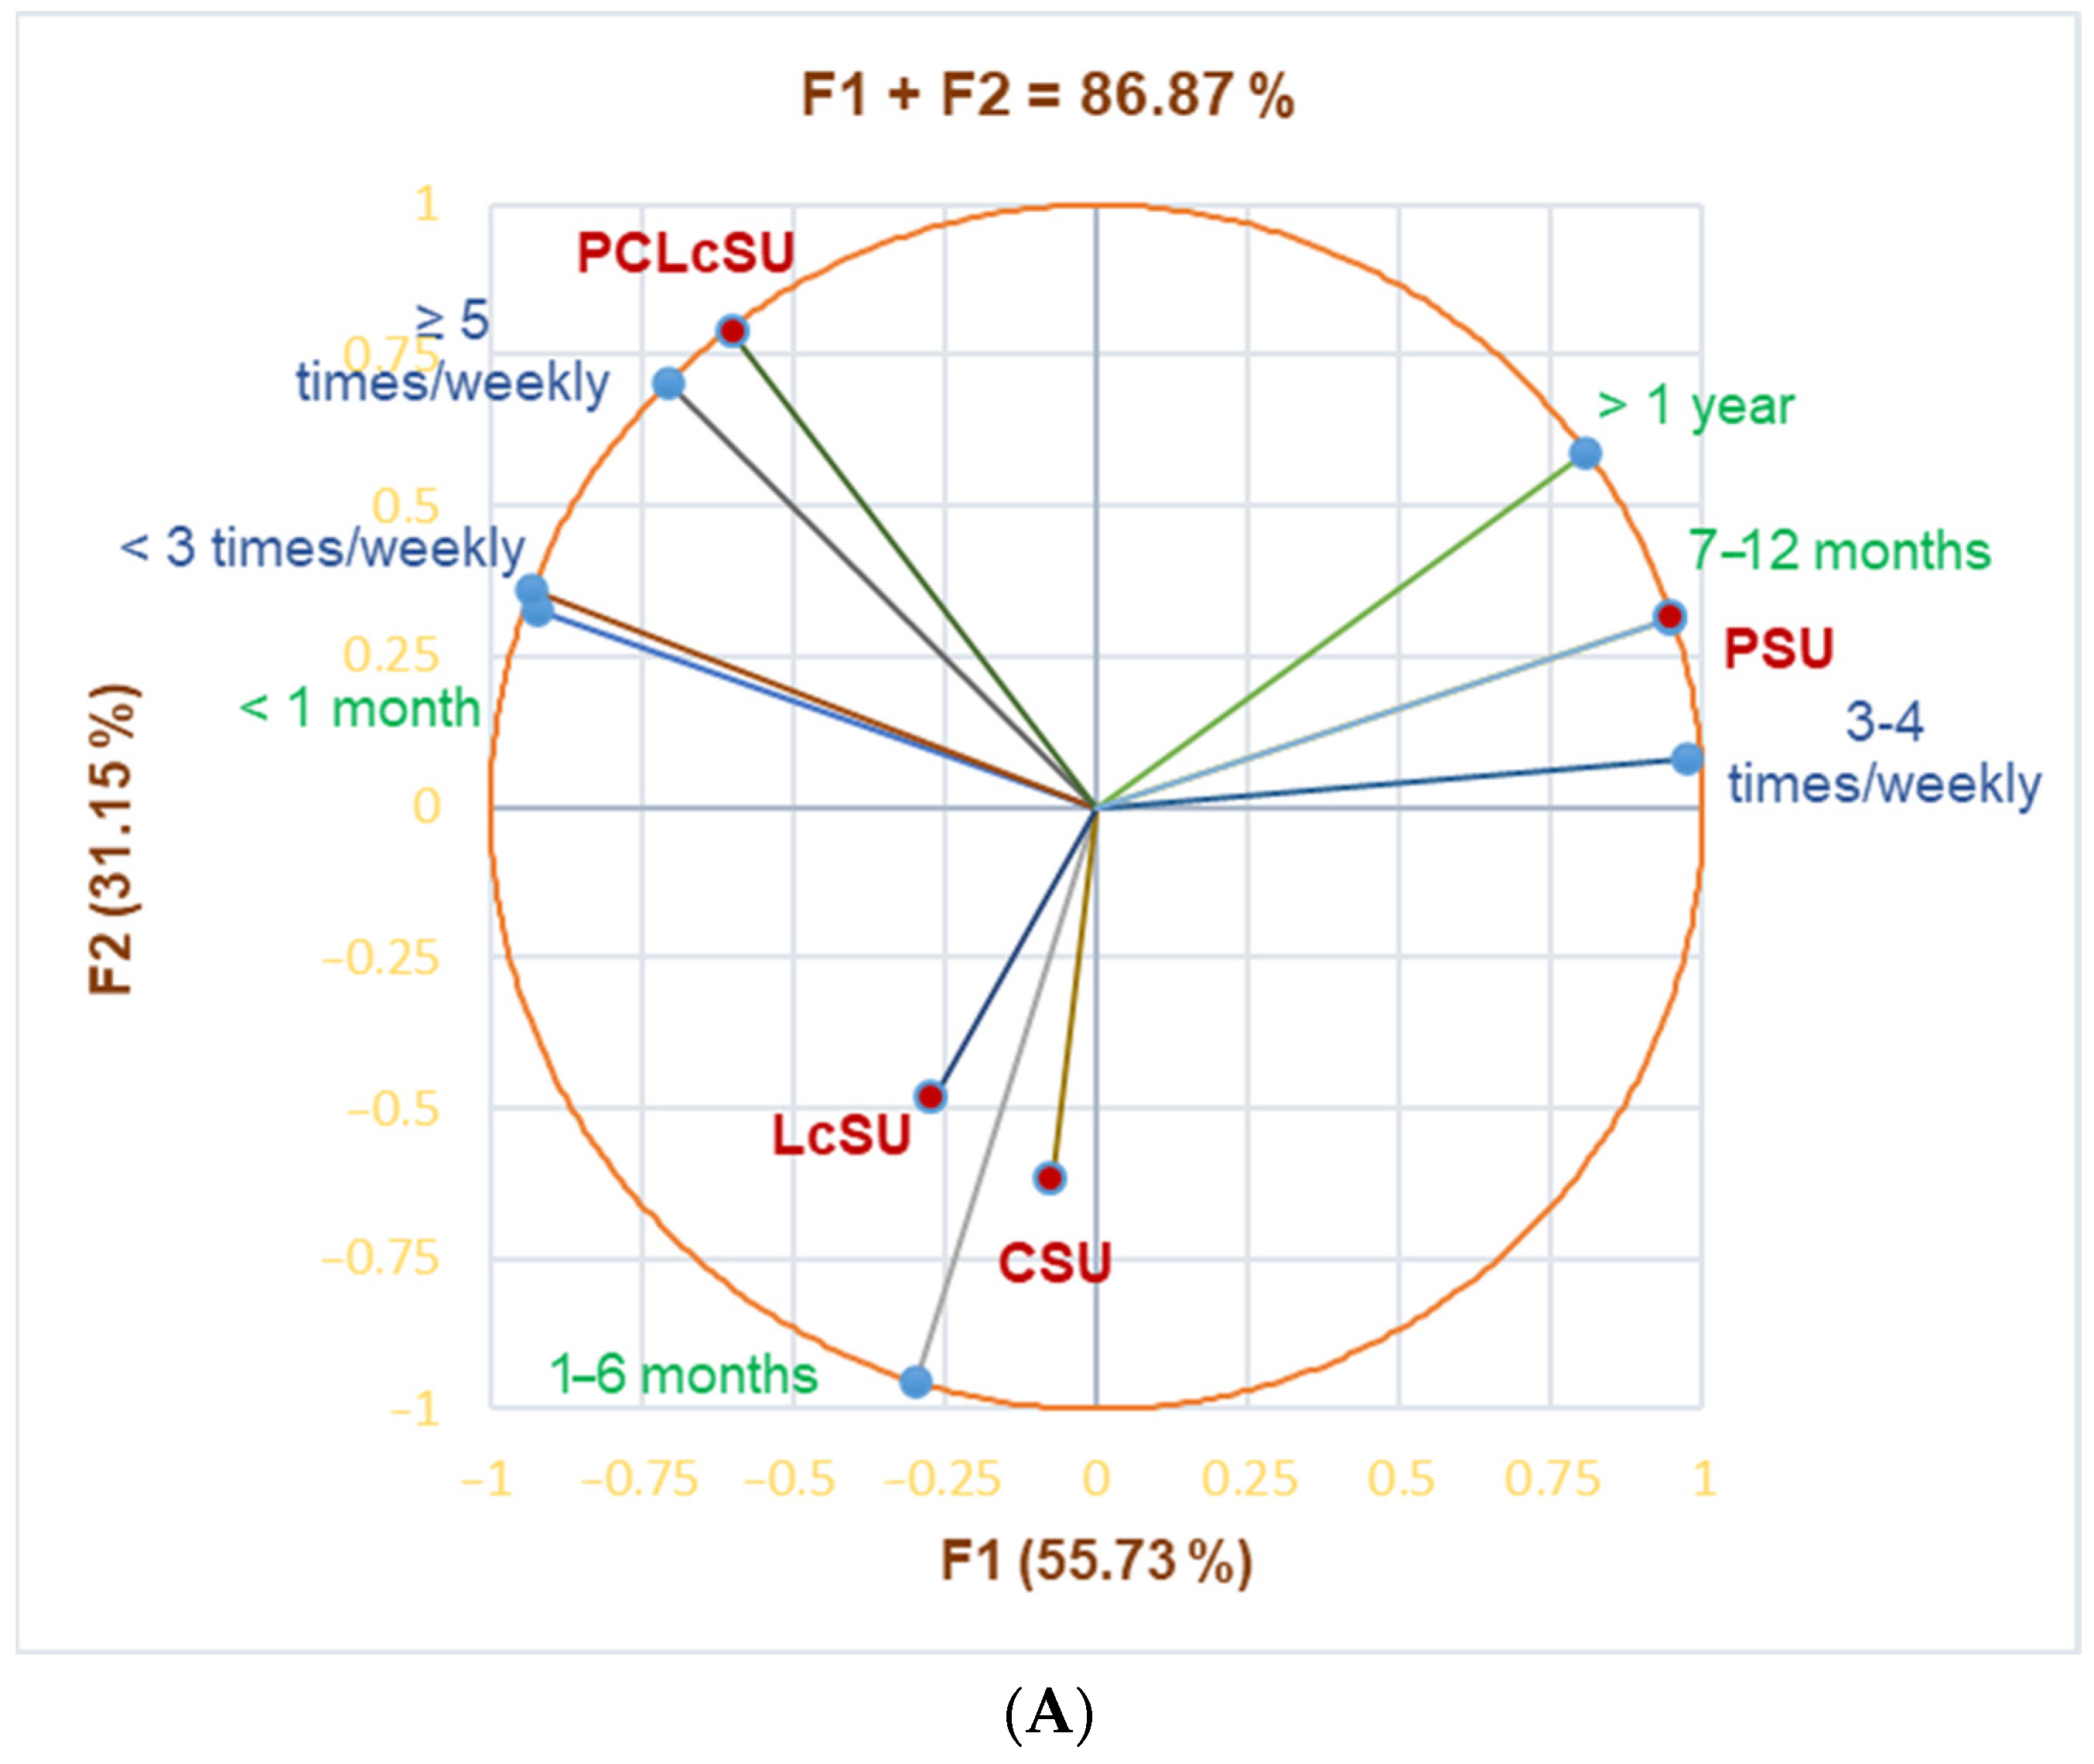
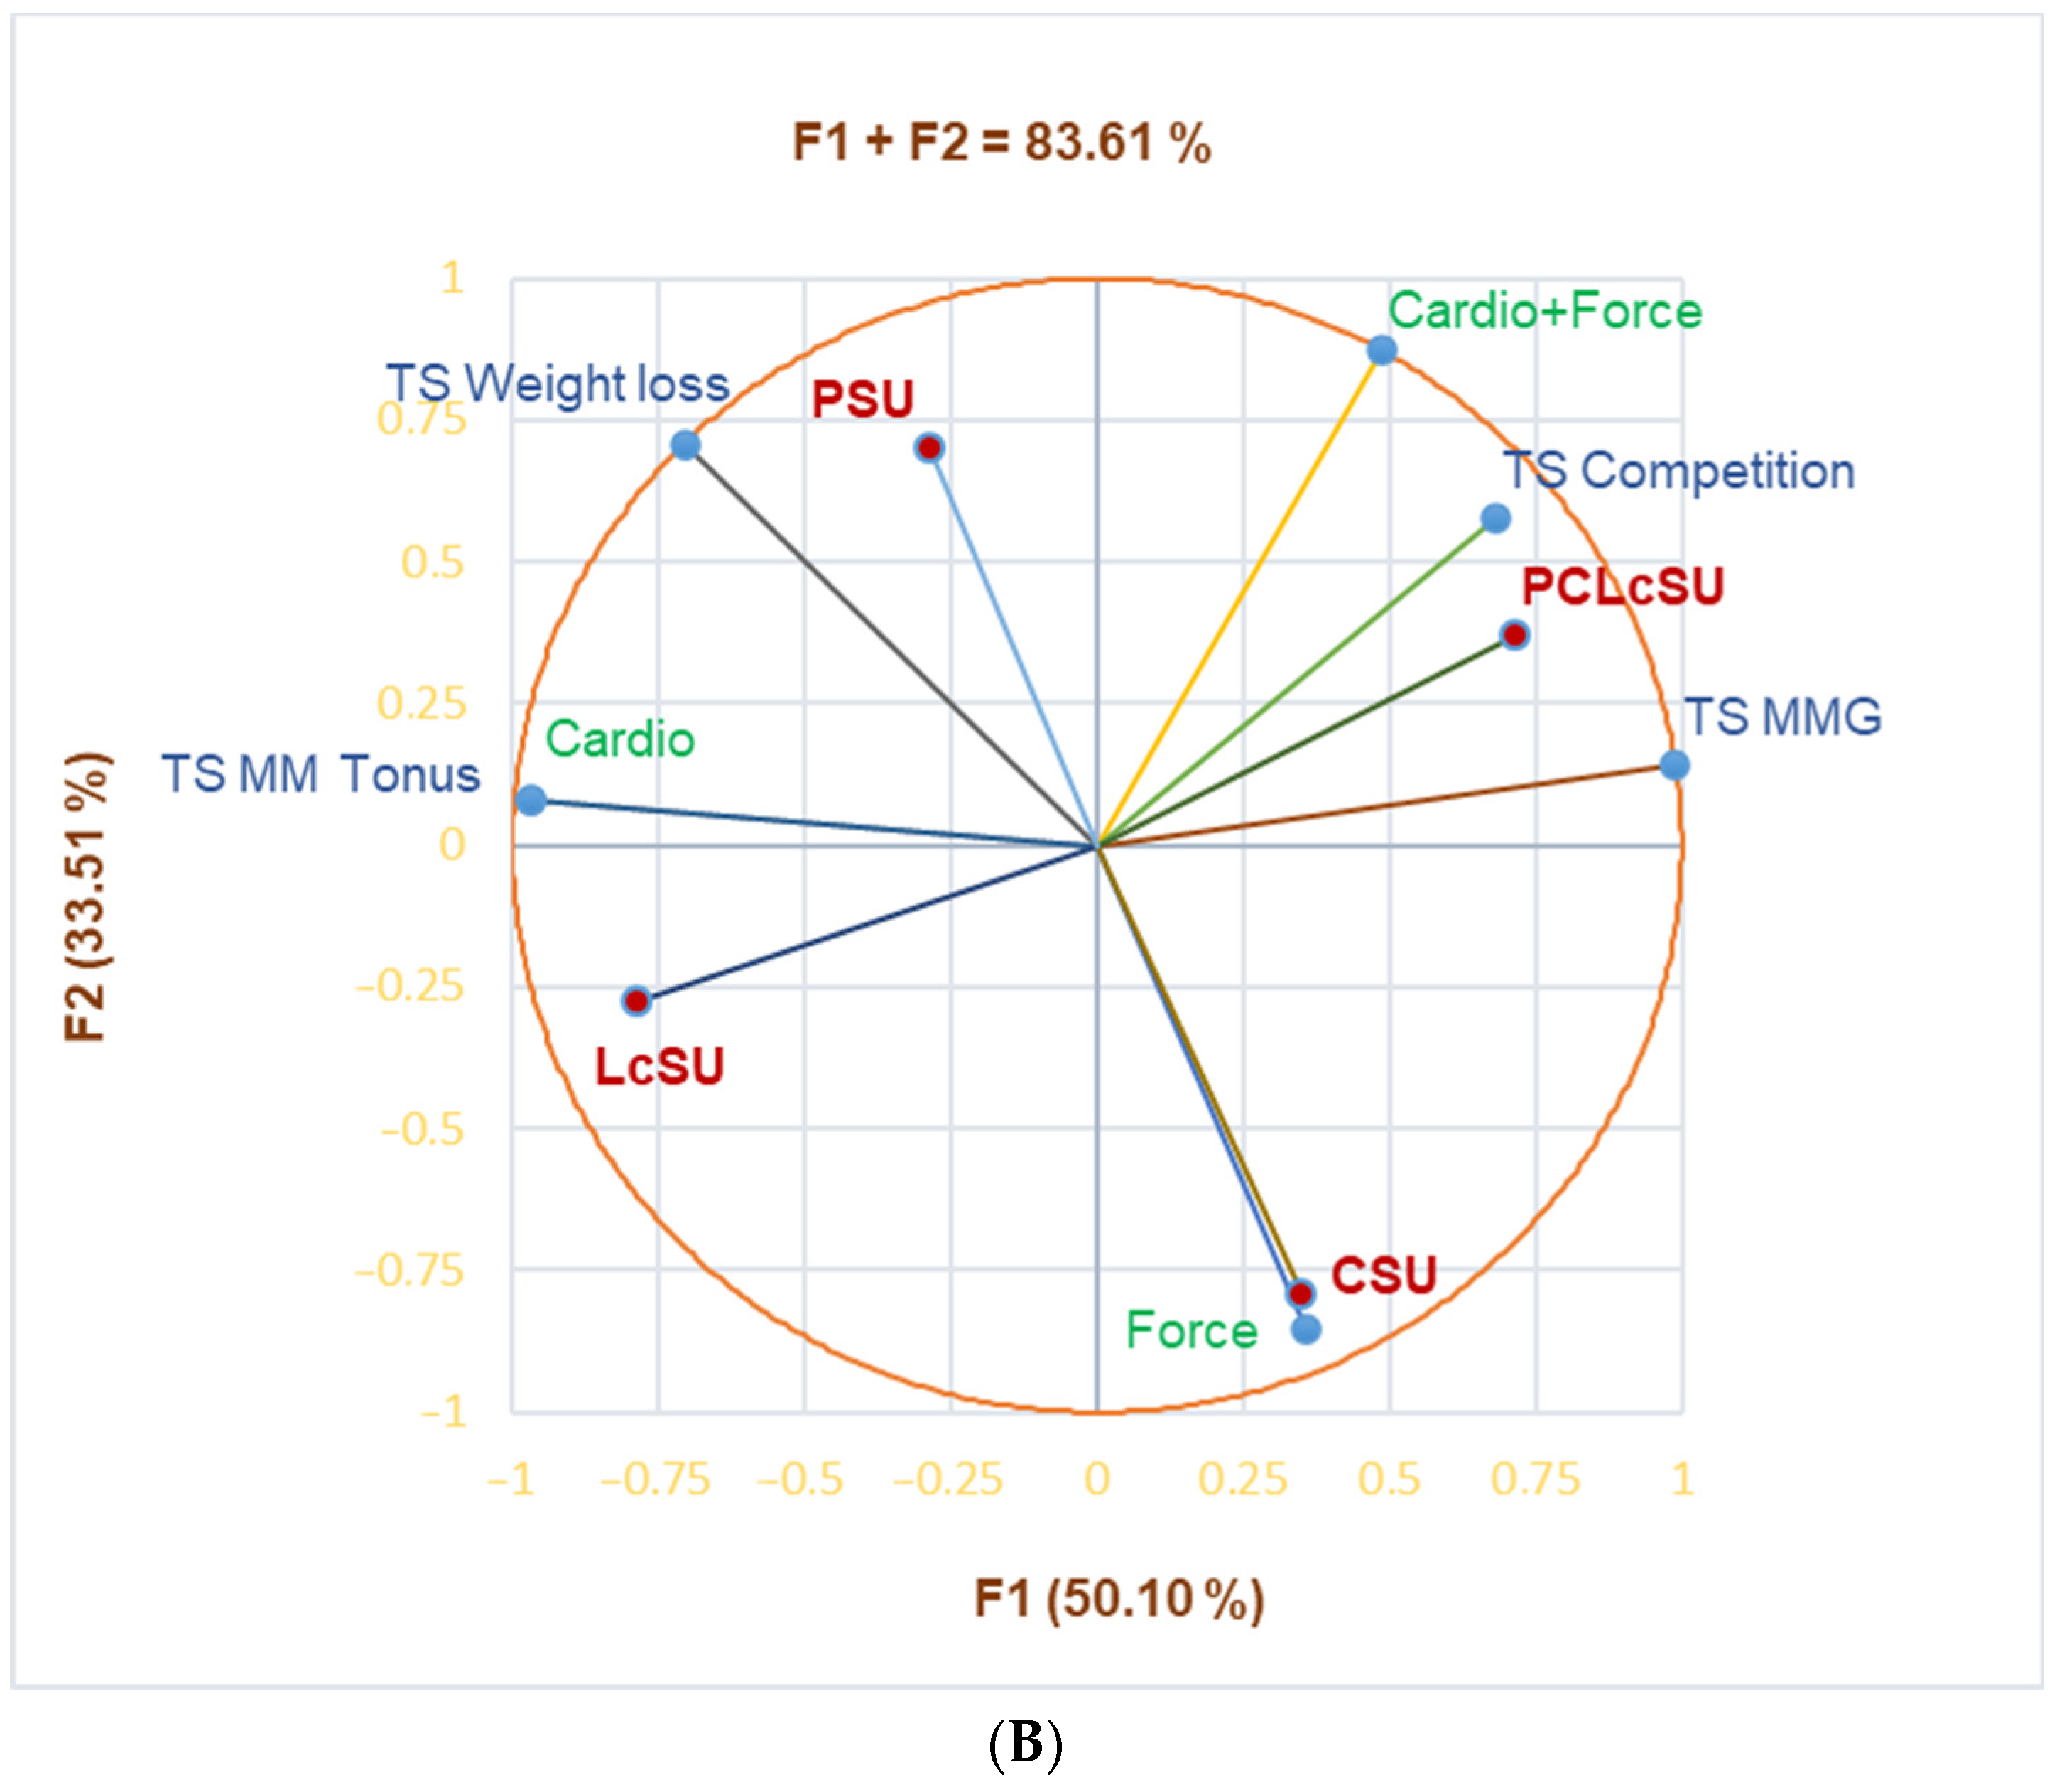
The principal component analysis supported our results (
Figure 1).
Figure 1A shows that PSUs substantially correlated with gym periods of 7–12 months and >1 year (r = 0.999, r = 0.952,
p < 0.05), and gym frequency of 3–4 times/week (r = 0.923,
p > 0.05). PCLcSUs considerably correlated with ≥5 times/week (r = 0.968,
p < 0.05) and showed a good correlation with a gym period <1 month and frequency <3 times/week (r = 0.840, r = 0.838,
p > 0.05). LcSUs and CSUs were moderately correlated with a gym period of 1–6 months (r = 0.577,
p > 0.05).
Figure 1B highlights the substantial correlation between PCLcSUs and competition as a training scope (r = 0.968,
p < 0.05) and cardio exercises and TS-MM tonus (r = 0.999,
p < 0.05). Cardio exercises and TS-MM tonus strongly correlated with LcSUs (r = 0.870,
p > 0.05), while cardio + force correlated with TS competition (r = 0.834,
p > 0.05). CSUs moderately correlated with force exercises, PCLcSUs with cardio + force exercises and TS-MMG, while PSUs and cardio exercises correlated with TS-weight loss and cardio + force exercises with TS-MMG (r = 0.604–0.788,
p > 0.05).
3.5. Specific Aspects of Protein and Amino Acid Supplement Consumption
3.5.1. One-Only Supplement Consumers
Table 4 registers our findings exclusively correlated with NS consumption (period, time, frequency, dose, main reason for consumption, and side effects) for one-only NS users (117 gym goers).
Over 50% of CSUs consumed it always (22/38), while other NSs were consumed in MMG time (18/37 LcSUs and 29/37 PSUs) (
p < 0.05). Most CSUs (22/37) and LcSUs (18/38) consumed those NSs for <1 year, while PCUs (19/42) reported 1–3 years. CS and PS were mainly consumed daily (26/38 vs. 23/42,
Table 4), while LcS was principally consumed on training days (20/38). CSUs used 1–5 g (23/38) and 6–10 g (15/38) (
p < 0.05). Most LcSUs (17/38) used 2 g LcS, while 14/38 used 1 g; only 6/38 used 6 g/daily. Mainly, PS doses were 40 g (19/42), 20 g (18/42), and 60 g (5/42). LcS was used exclusively for fat burning (37/37), PS was used for MMG (29/42) and weight loss (12/42), while CS was used for MMG (18/38) and physical effort capacity (18/38) (
p < 0.05).
Most NS users (77/117) declared no side effects (
Table 5). However, 40/117 participants declared adverse effects: 8/42 PSUs declared liver damage, 6/42 revealed muscle cramps, and 1/42 had kidney damage. In LcUs, 9/38 mentioned nausea and 5/38 had stomach cramps. CSUs claimed liver damage (6/37) and weight gain (3/37) (
p < 0.05) (
Table 5).
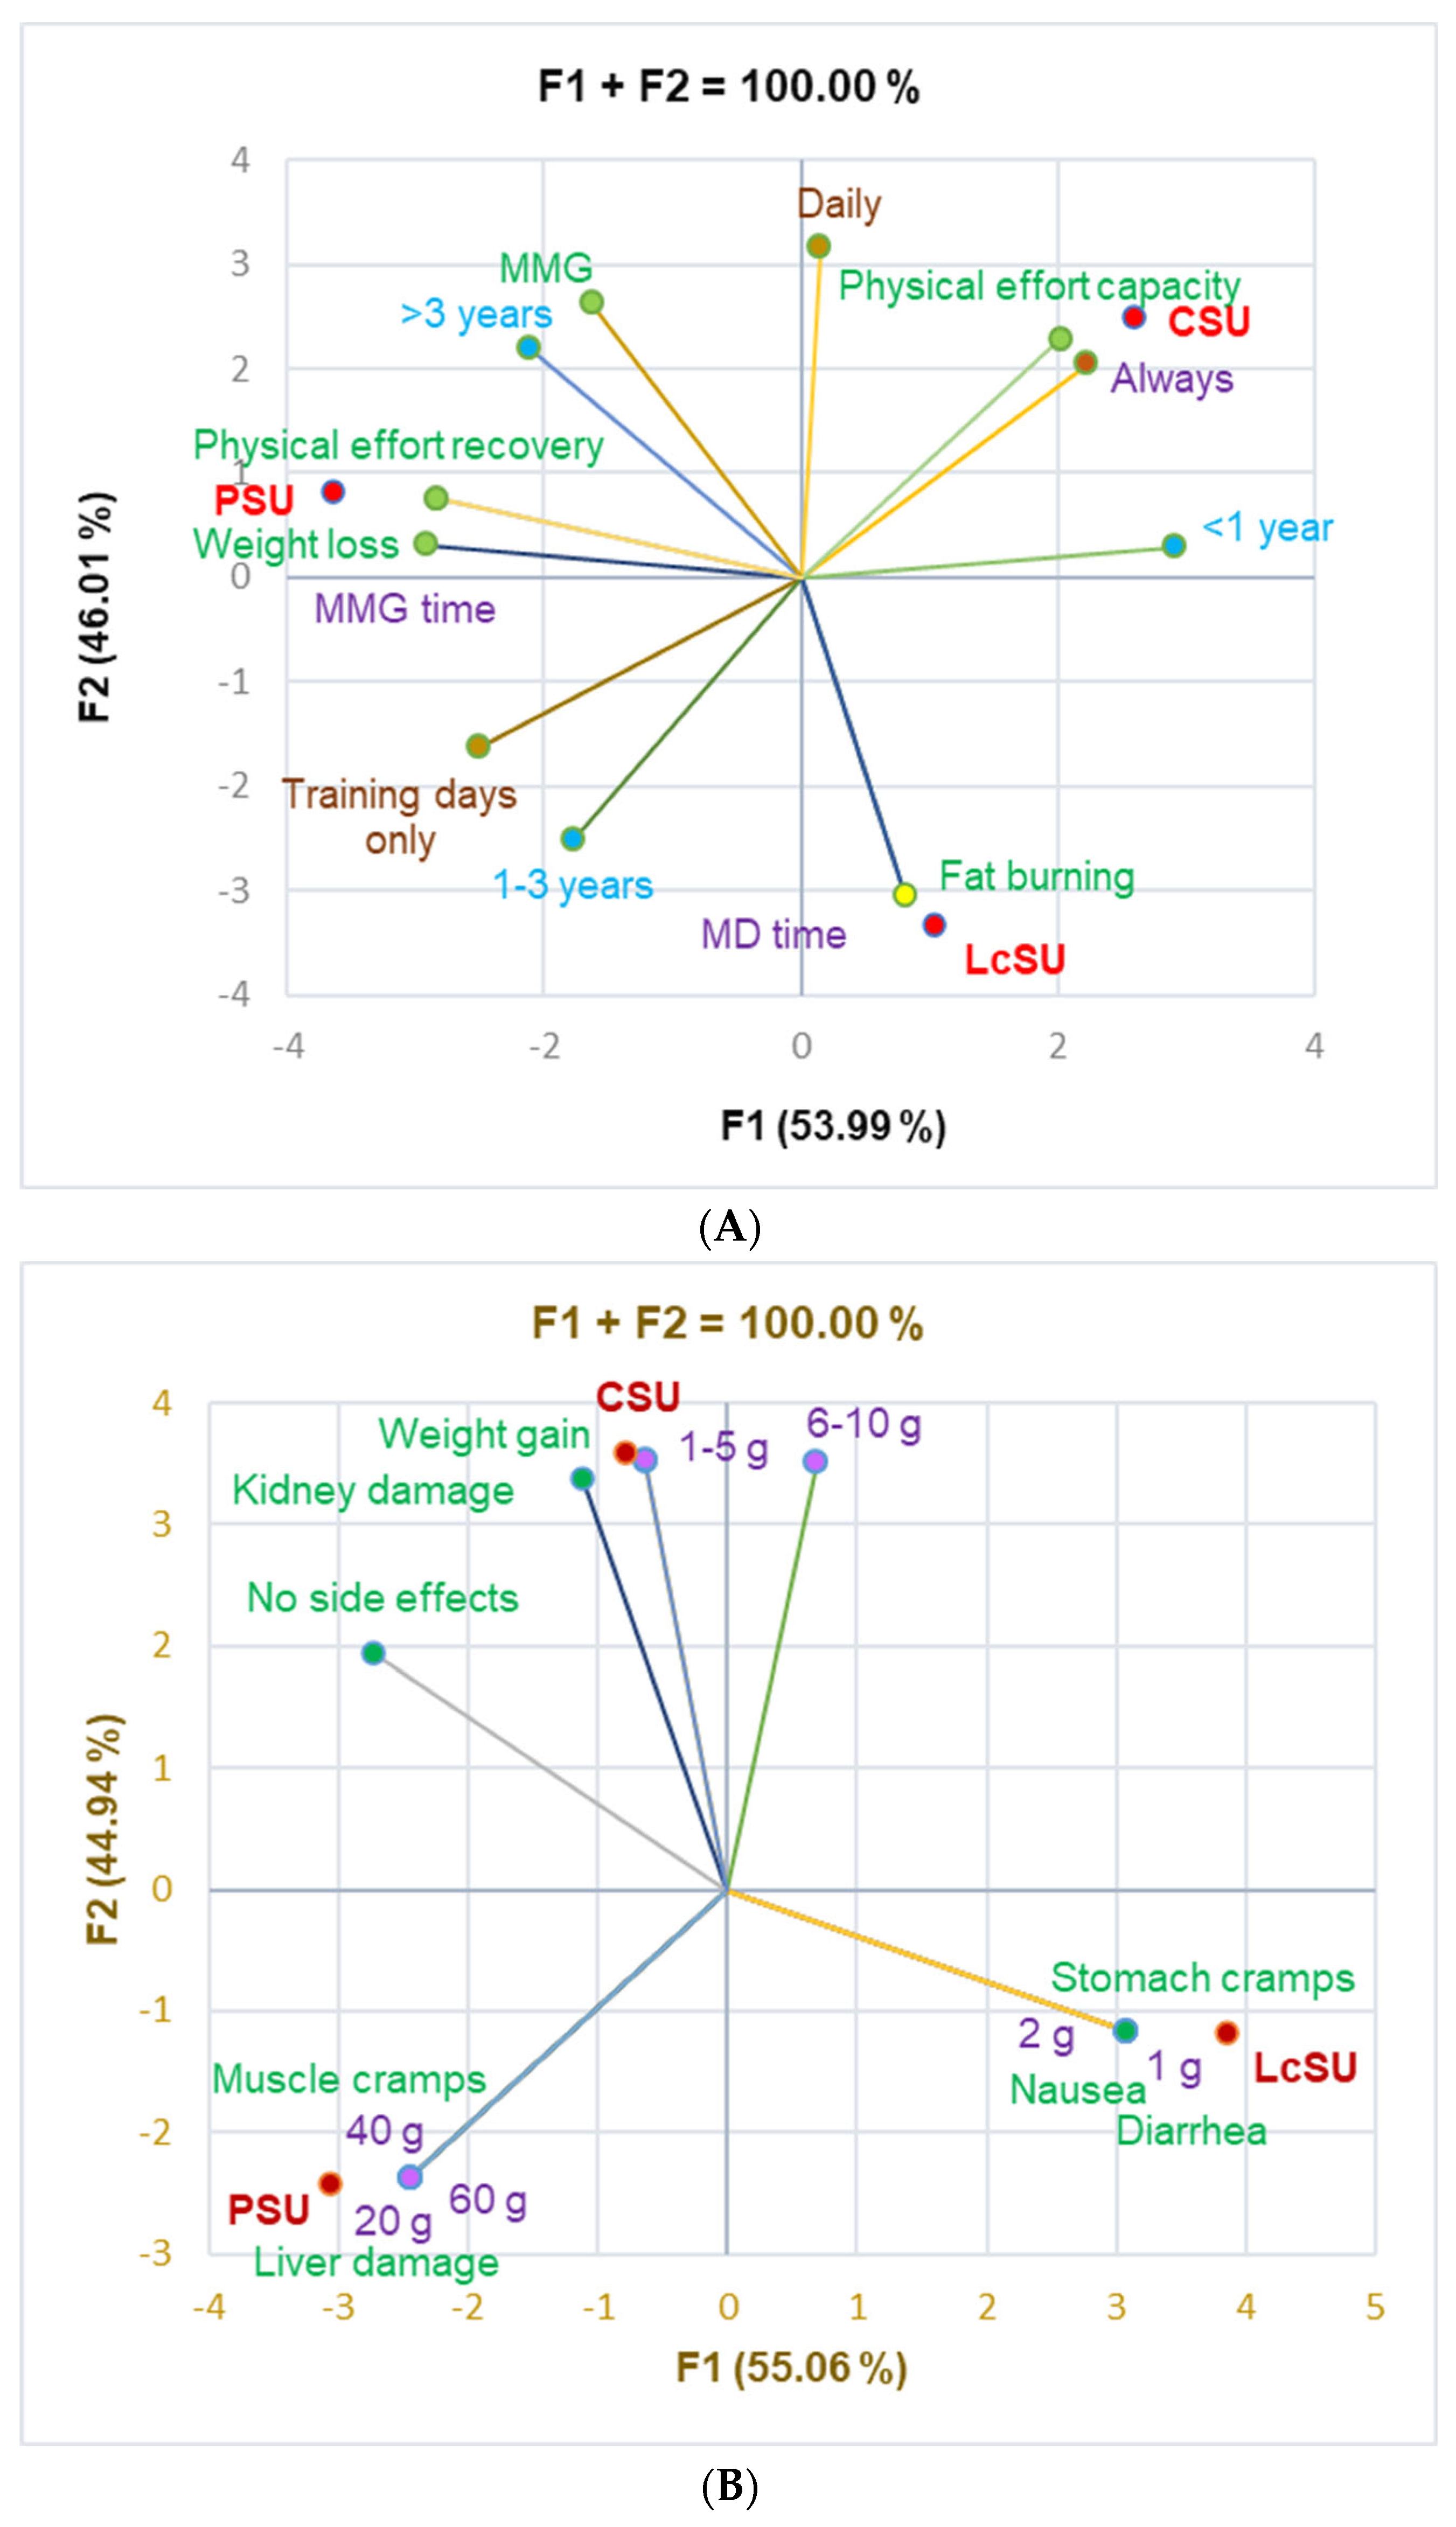
The principal component analysis supported the data from
Table 4, which evidences the correlations between variable parameters (
Figure 2).
Figure 2A shows a significant correlation between CSUs and physical effort capacity (r = 0.999,
p < 0.05), PSUs and physical effort recovery and weight loss (r = 0.999,
p < 0.05), and LcSUs and fat-burning and consumption in MD time (r = 0.999,
p < 0.05).
Figure 2B shows that diarrhea, nausea, and stomach cramps were substantially associated with LcS at 1–2 g/dose (r = 0.999,
p < 0.05). PS at 20, 40, and 60 g/dose significantly correlated with muscle cramps and liver damage (r = 0.999,
p < 0.05), while CS at 1–5 g strongly correlated with weight gain (r = 0.999,
p < 0.05). CS also correlated with 6–10 g/dose and kidney damage (r = 0.918–0.988,
p > 0.05).
The chi-square independence test assessed the significance of each variable parameter’s influence on the risk of potential side effects; all
p-values are reported in
Table 6.
Therefore, NS type and NS dose were the primary influencing factors of the potential risk of harmful effects (p < 0.0001), followed by body weight status (p = 0.001).
3.5.2. Combination (PCLcS) Consumers
All 48 participants consumed all 3 NSs daily to obtain maximal benefits (
Table 7).
They mainly consumed PS always (28/48), LcS in MD time (36/48), and CS in MMG (36/48). They used all NSs for almost <1 year (PS, 22/48; LcS, 18/48, and CS, 27/48,
p < 0.05). CS and PS were used daily (35/48 and 25/48,
p < 0.05), while LcS was only used on training days (47/48) in almost the same doses as the one-only NSUs (recorded in
Table 4). PS and CS were primarily used for MMG (31/48 and 34/48) and LcS for fat burning (45/48). All NSs were also used for physical effort recovery (3/48 used PS and LcS, while 6/48 used CS), 14/48 was used PS for weight loss, and 8/48 used CS for physical effort capacity (
p < 0.05,
Table 7).
All PCLcSUs reported side effects of each component: muscle cramps and liver damage were evidenced by 15/48 after PS consumption, while 10/48 claimed kidney damage and weight gain caused by CS use (
p < 0.05). LcS administration’s side effects were diarrhea, nausea, stomach cramps, and vomiting, which were experienced by 23/48 gym goers (
p < 0.05,
Table 7).
3.6. Protein and Amino Acid Supplement Consumption—Significant Correlations with Baseline Data
3.6.1. NS Consumption and Socio-Demographic Data
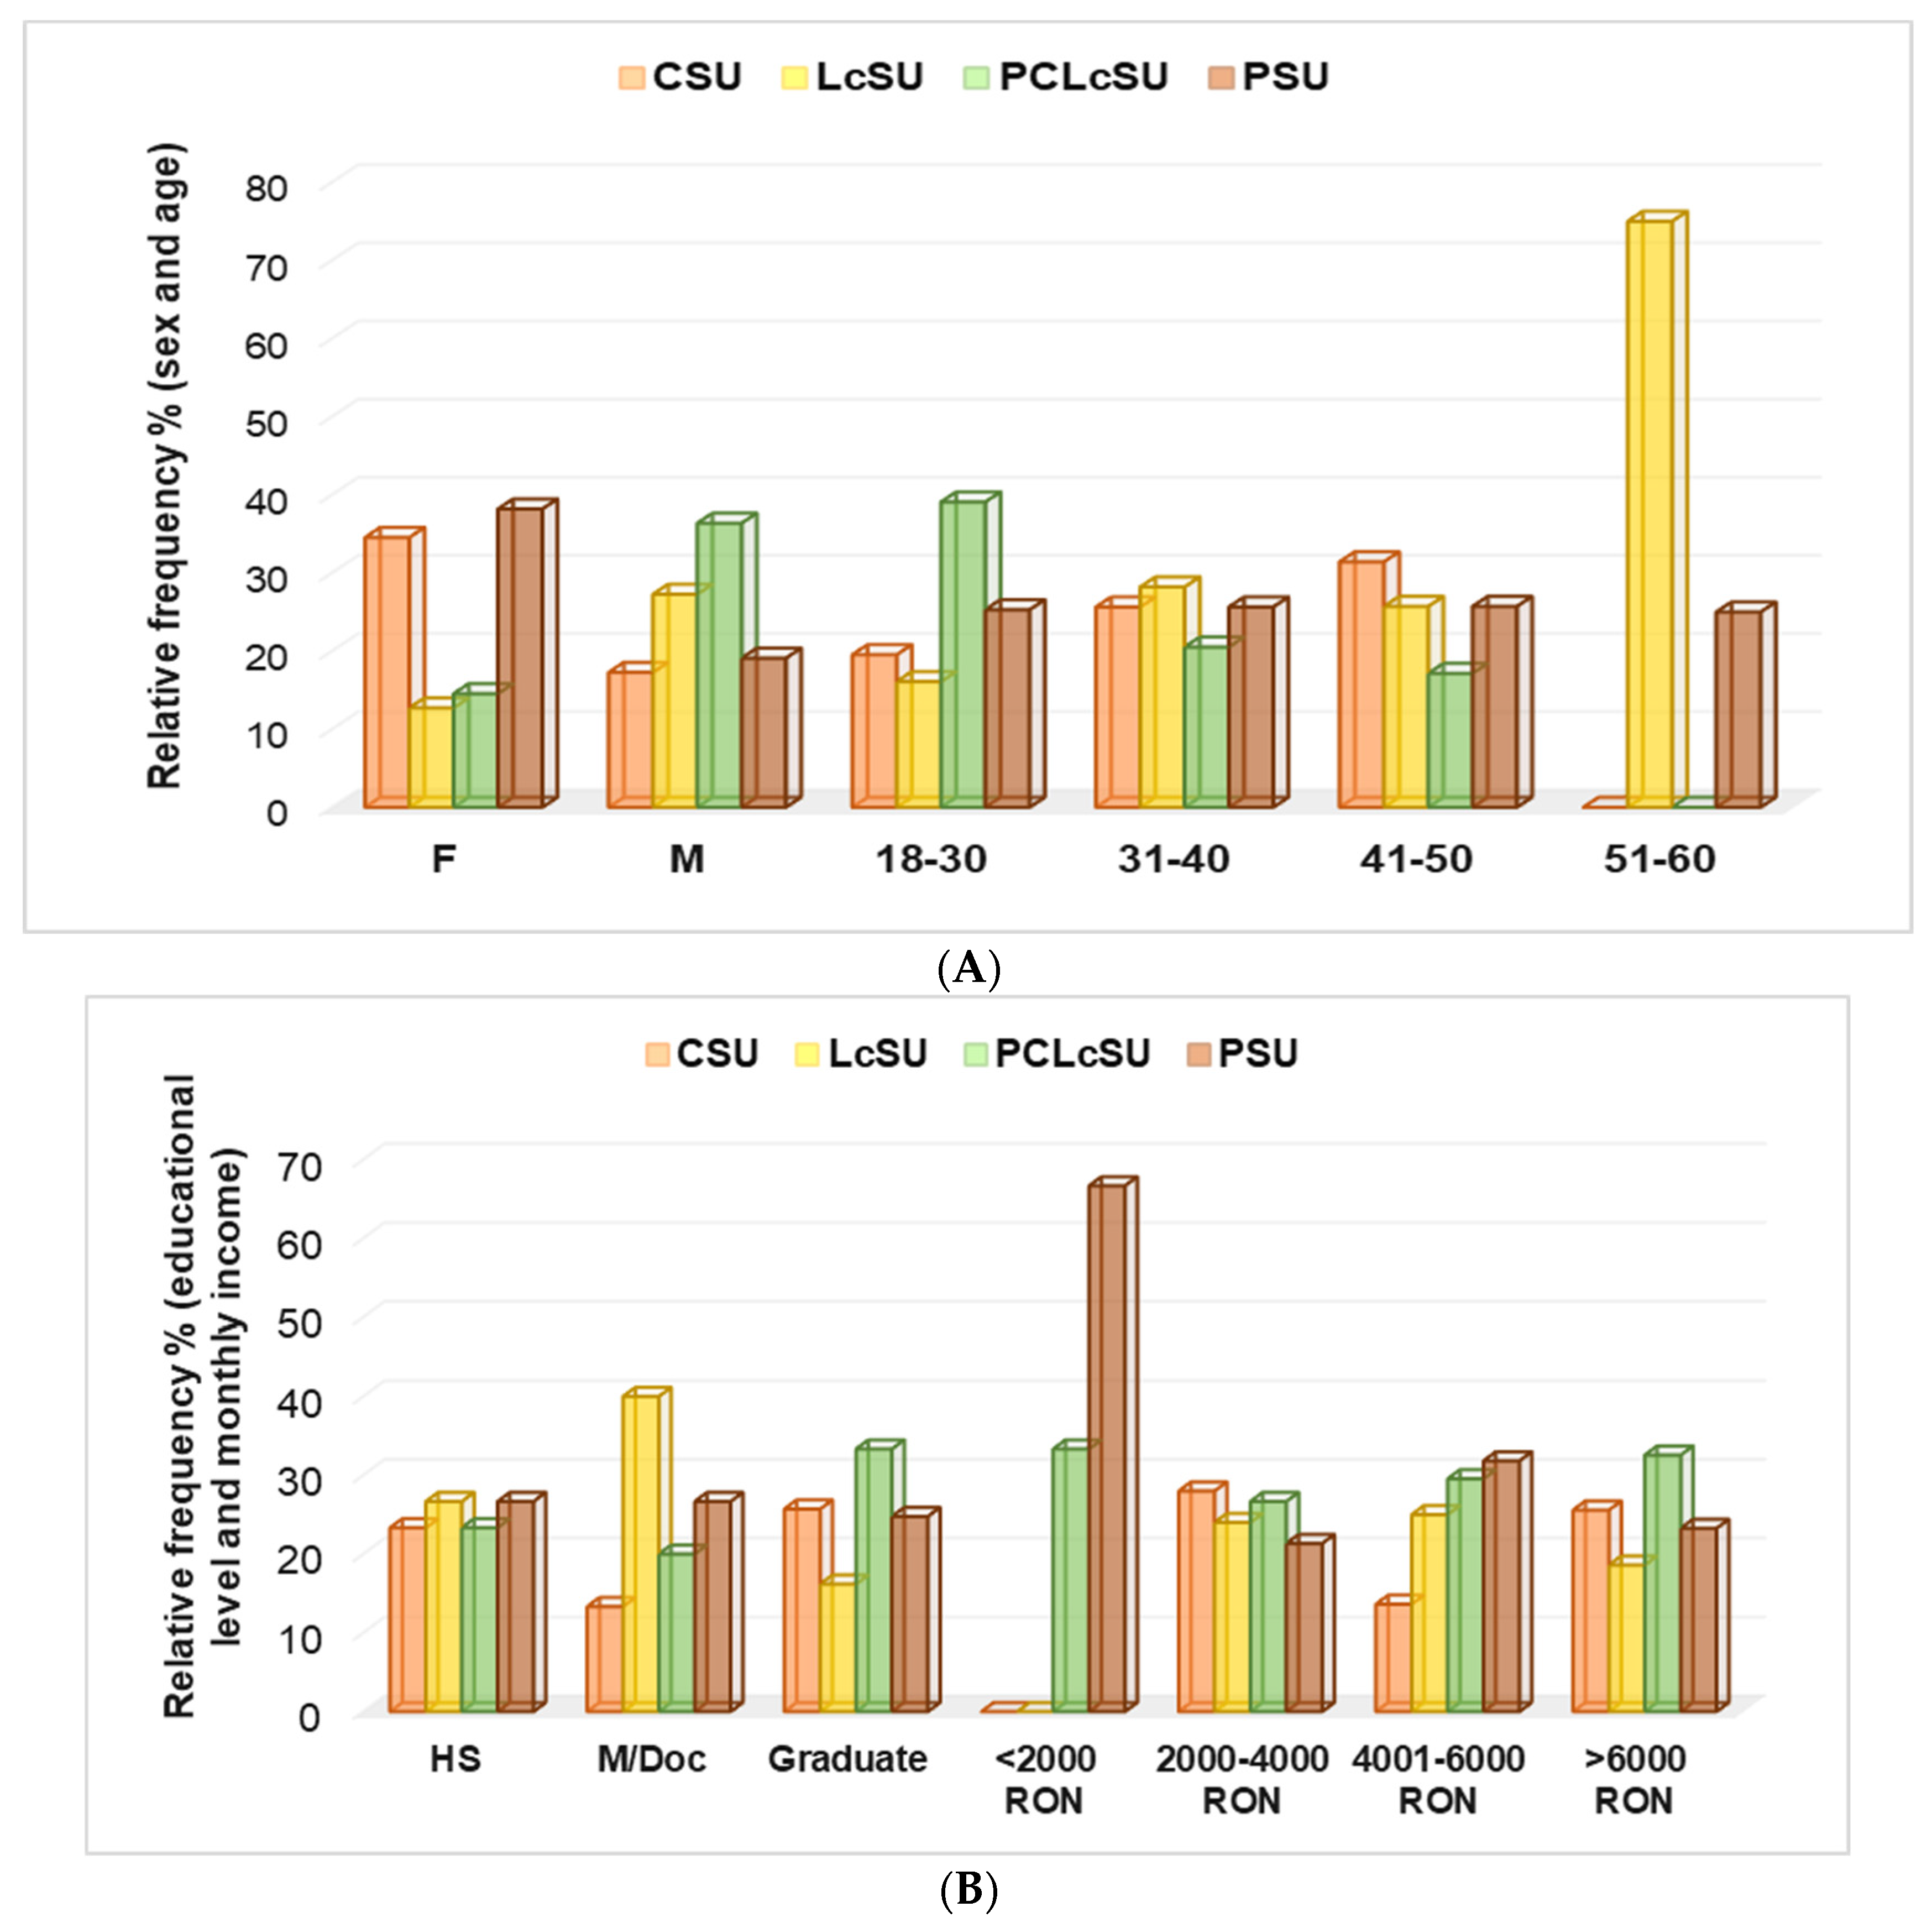
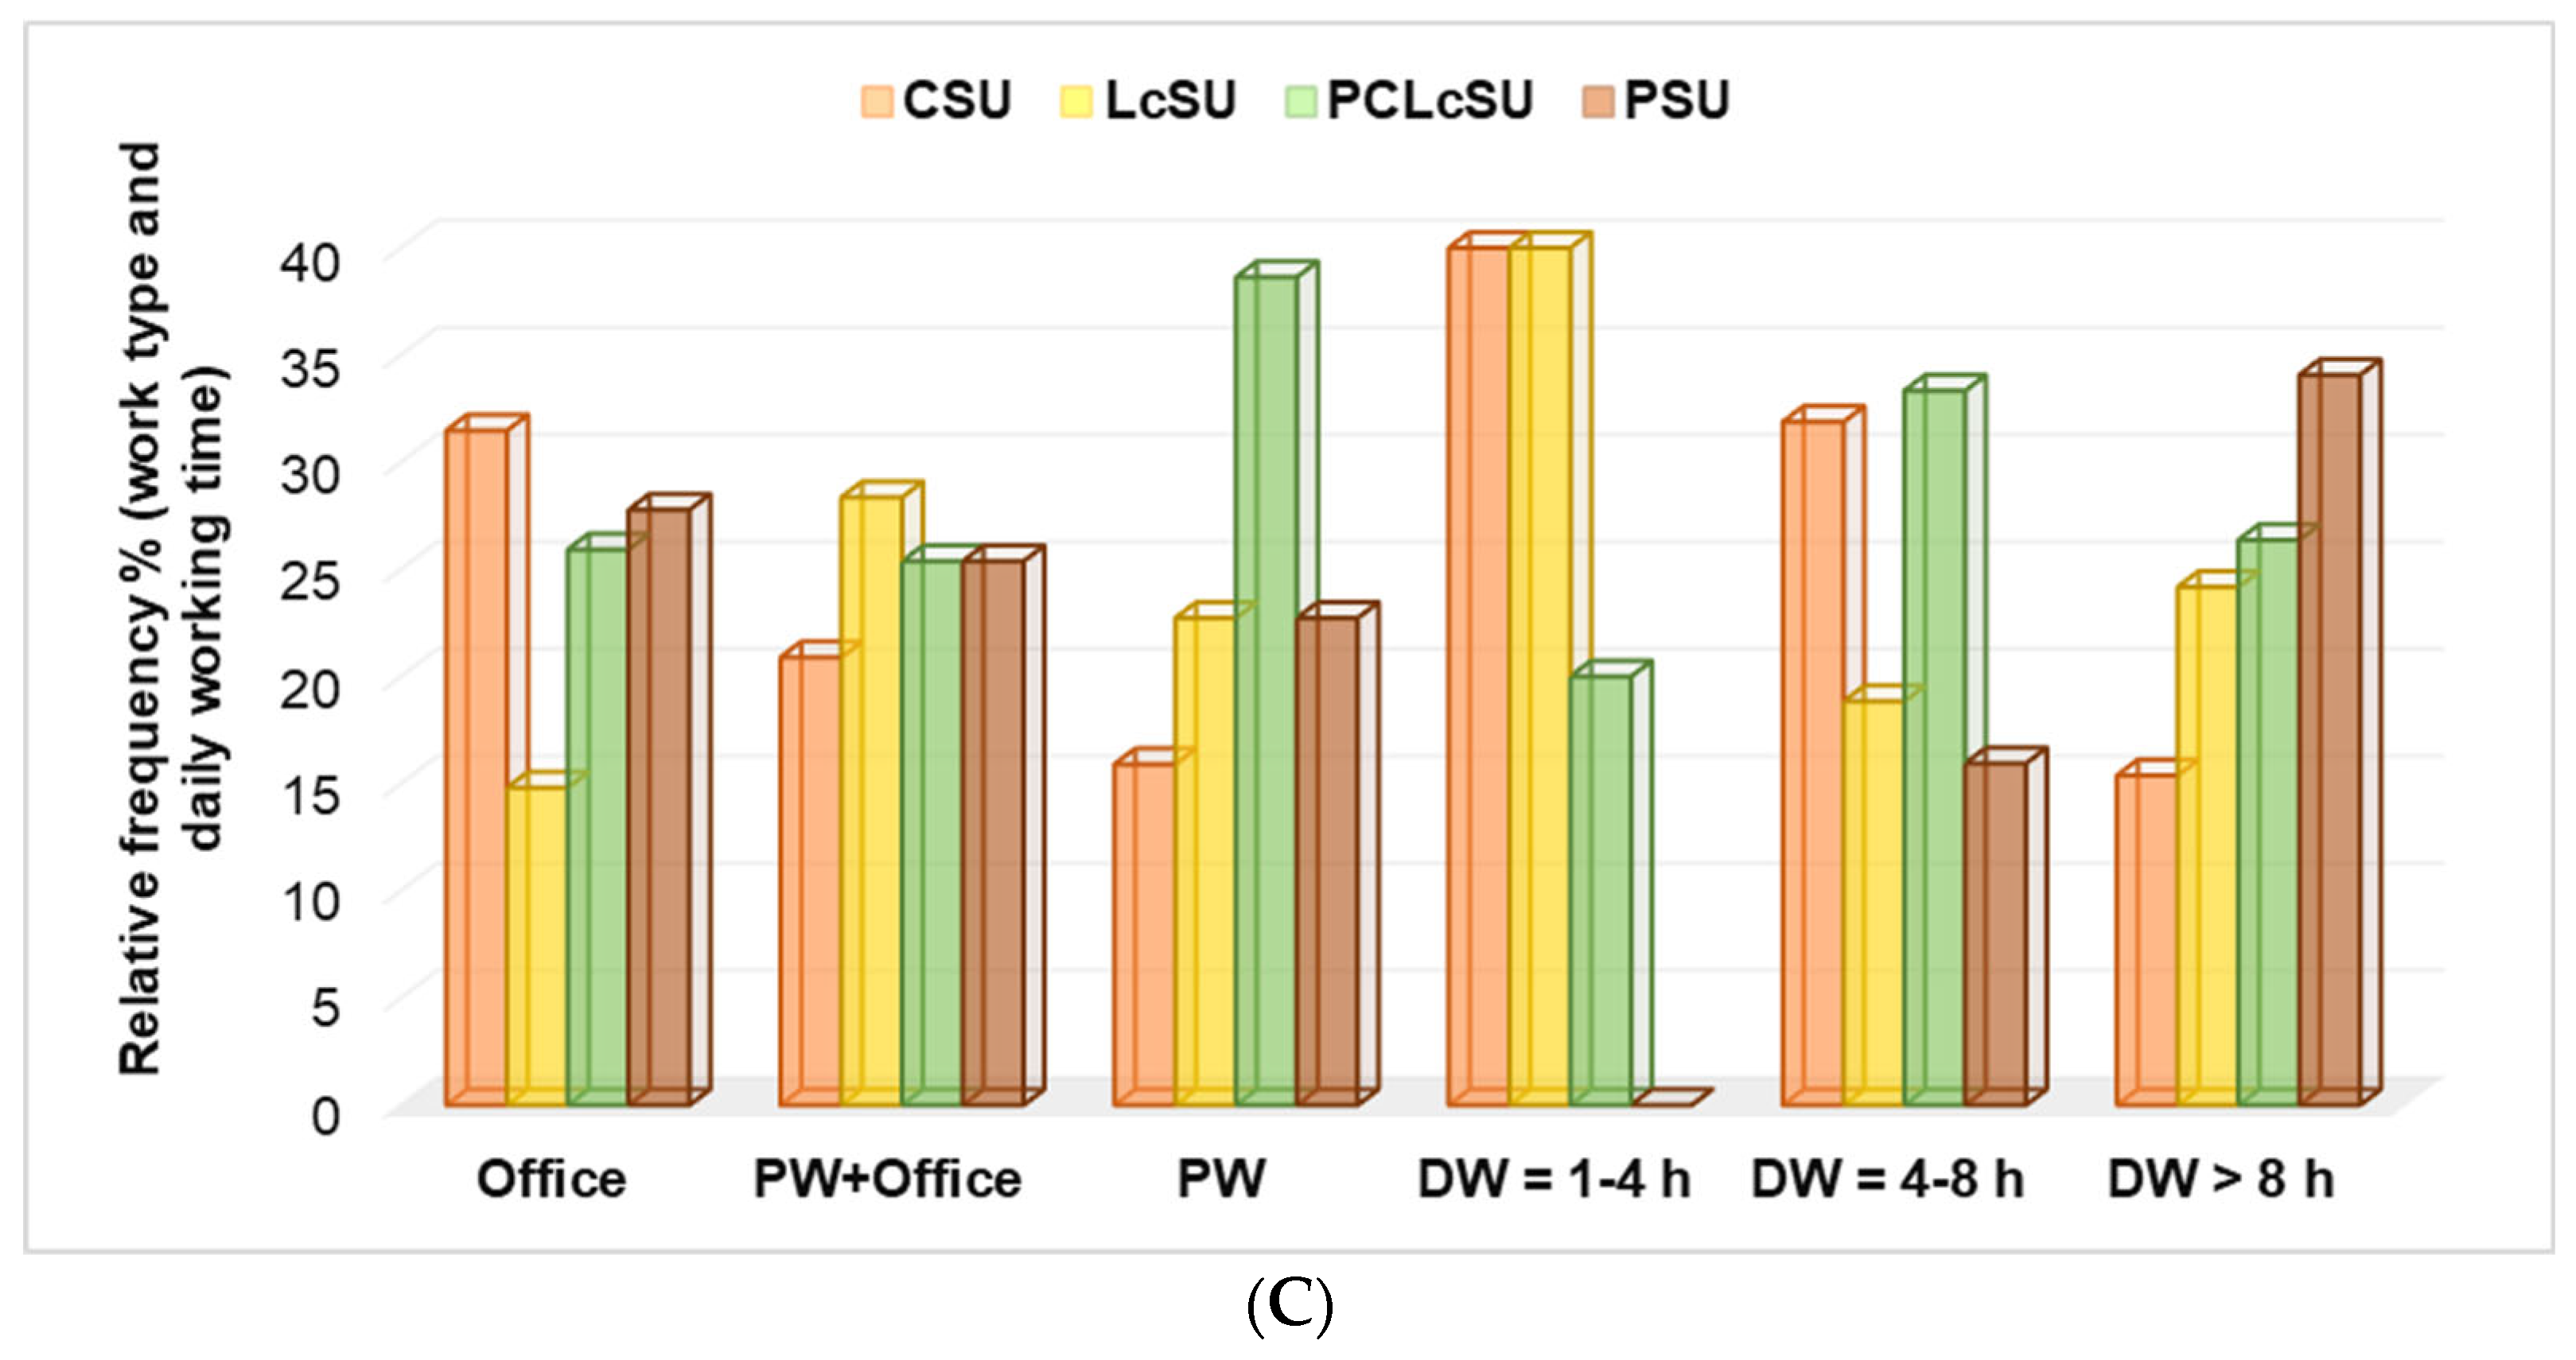
Protein and amino acid supplementation were influenced by socio-demographic factors (sex, age group, educational level, monthly income, daily working time, and work type;
Figure 3A–C). Females preferred PS and CS to PCLcS and LcS (38.2% and 34.5% vs. 14.5% and 12.7%,
p < 0.05,
Figure 3A). The most-used NSs by males were PCLcS (36.4%) and LcS (27.3%). Their preference for PS and CS was significantly diminished (19.1% and 17.3%,
p < 0.05,
Figure 3A). Recreational gym goers aged 18–30 mostly preferred PCLcS (39.1%). The use of this combination significantly decreased with age progression (31–40 and 41–50: 20.5% and 17.1%, respectively,
p < 0.05); the NS combination was not used by recreational gym goers aged 51–60 (
Figure 3A). CSU’s percentage of use increased proportionally with age: 18–30 vs. 31–40 vs. 41–50 = 19.5 vs. 25.6 vs. 31.4 (
p < 0.05); however, the 50–60 age group did not use CS (
Figure 3A). Protein consumption was similar across all age groups (25–25.7%), while L-carnitine use varied significantly, ranging from 19.5% in the 18–29 age group to 75% in the 50–60 age group of participants (
p < 0.05,
Figure 3A).
The NS preferences of high school gym goers and those with a monthly income of 2000–4000 RON were not significantly different (
p > 0.05,
Figure 3B). The PCLcS, CS, and LcS consumption significantly differed between graduate and postgraduate participants: 33.3%, 25.7%, and 16.2% vs. 20%, 13.3%, and 40%, respectively,
p < 0.05,
Figure 3B). The preference for PCLcS slightly increased with monthly income, from 2000–3000 RON to over 6000 RON, while LcS use remained similar (
p > 0.05,
Figure 3B).
Creatine (
p < 0.05) and protein consumption (
p > 0.05) decreased with work type, from office to physical work. Protein consumption increased with DW hours, while creatine consumption diminished with them (
p < 0.05,
Figure 3C).
The Pearson’s correlations supported our findings. The correlation coefficient (r) showed that CSU significantly correlated with office work, while LcSU showed a substantial association with master’s/doctorate (r = 0.992–0.997, p < 0.05). PCLcSU highly correlated with males and university educational level, DW = 4–8 h and >8 h (r = 0.967–0.999, p < 0.05). Moreover, PS consumption was strongly associated with office work (r = 0.992, p < 0.05), while PCLcS was related to physical work (r = 0.988, p < 0.05). CS consumption substantially correlated with the monthly income (MI) of 4000–6000 RON. PS and PCLcS were significantly associated with MI >6000 RON (r = 0.970–0.996, p < 0.05), while PCLcS also strongly correlated with MI <2000 RON (r =0.974, p < 0.05).
3.6.2. NS Consumption, Daily Meal Frequency, and Unhealthy Habits
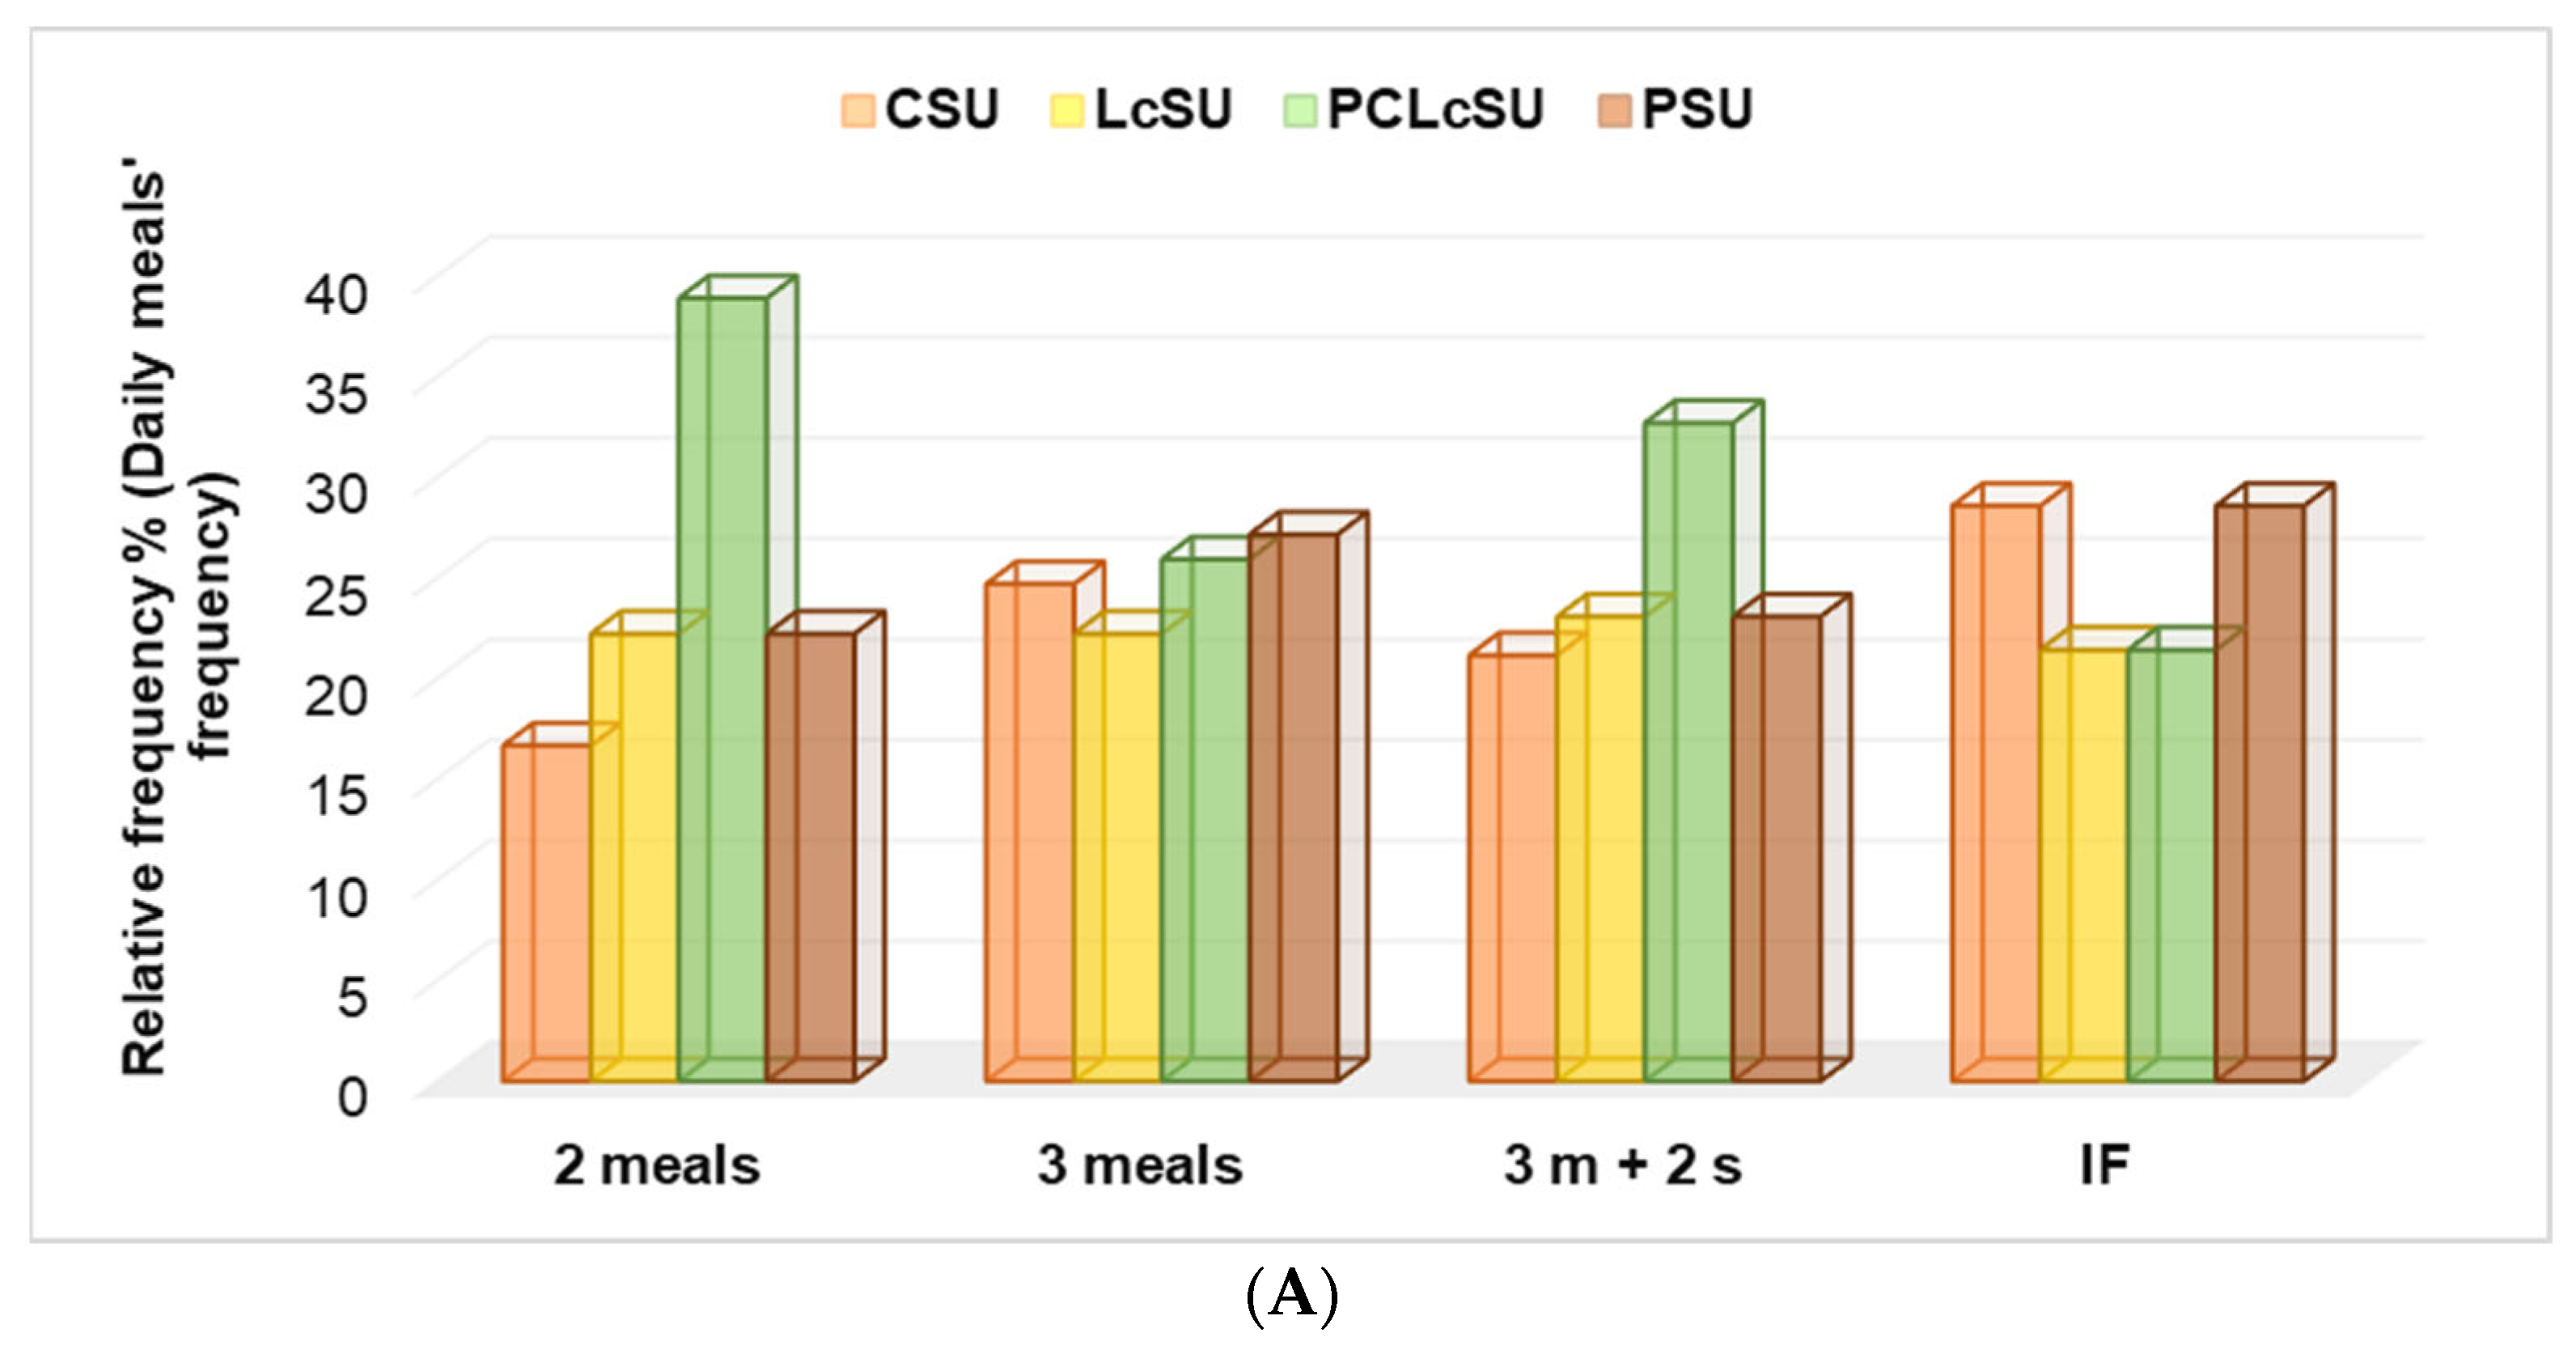
PCLcS was consumed by gym goers with 2 meals and those with 3 meals and 2 snacks, higher than another NS (
p < 0.05), while PS and CS were the leading choices for those with IF and 3 meals (
p > 0.05,
Figure 4A). No significant differences were recorded in LcS preferences (
p > 0.05,
Figure 4A).
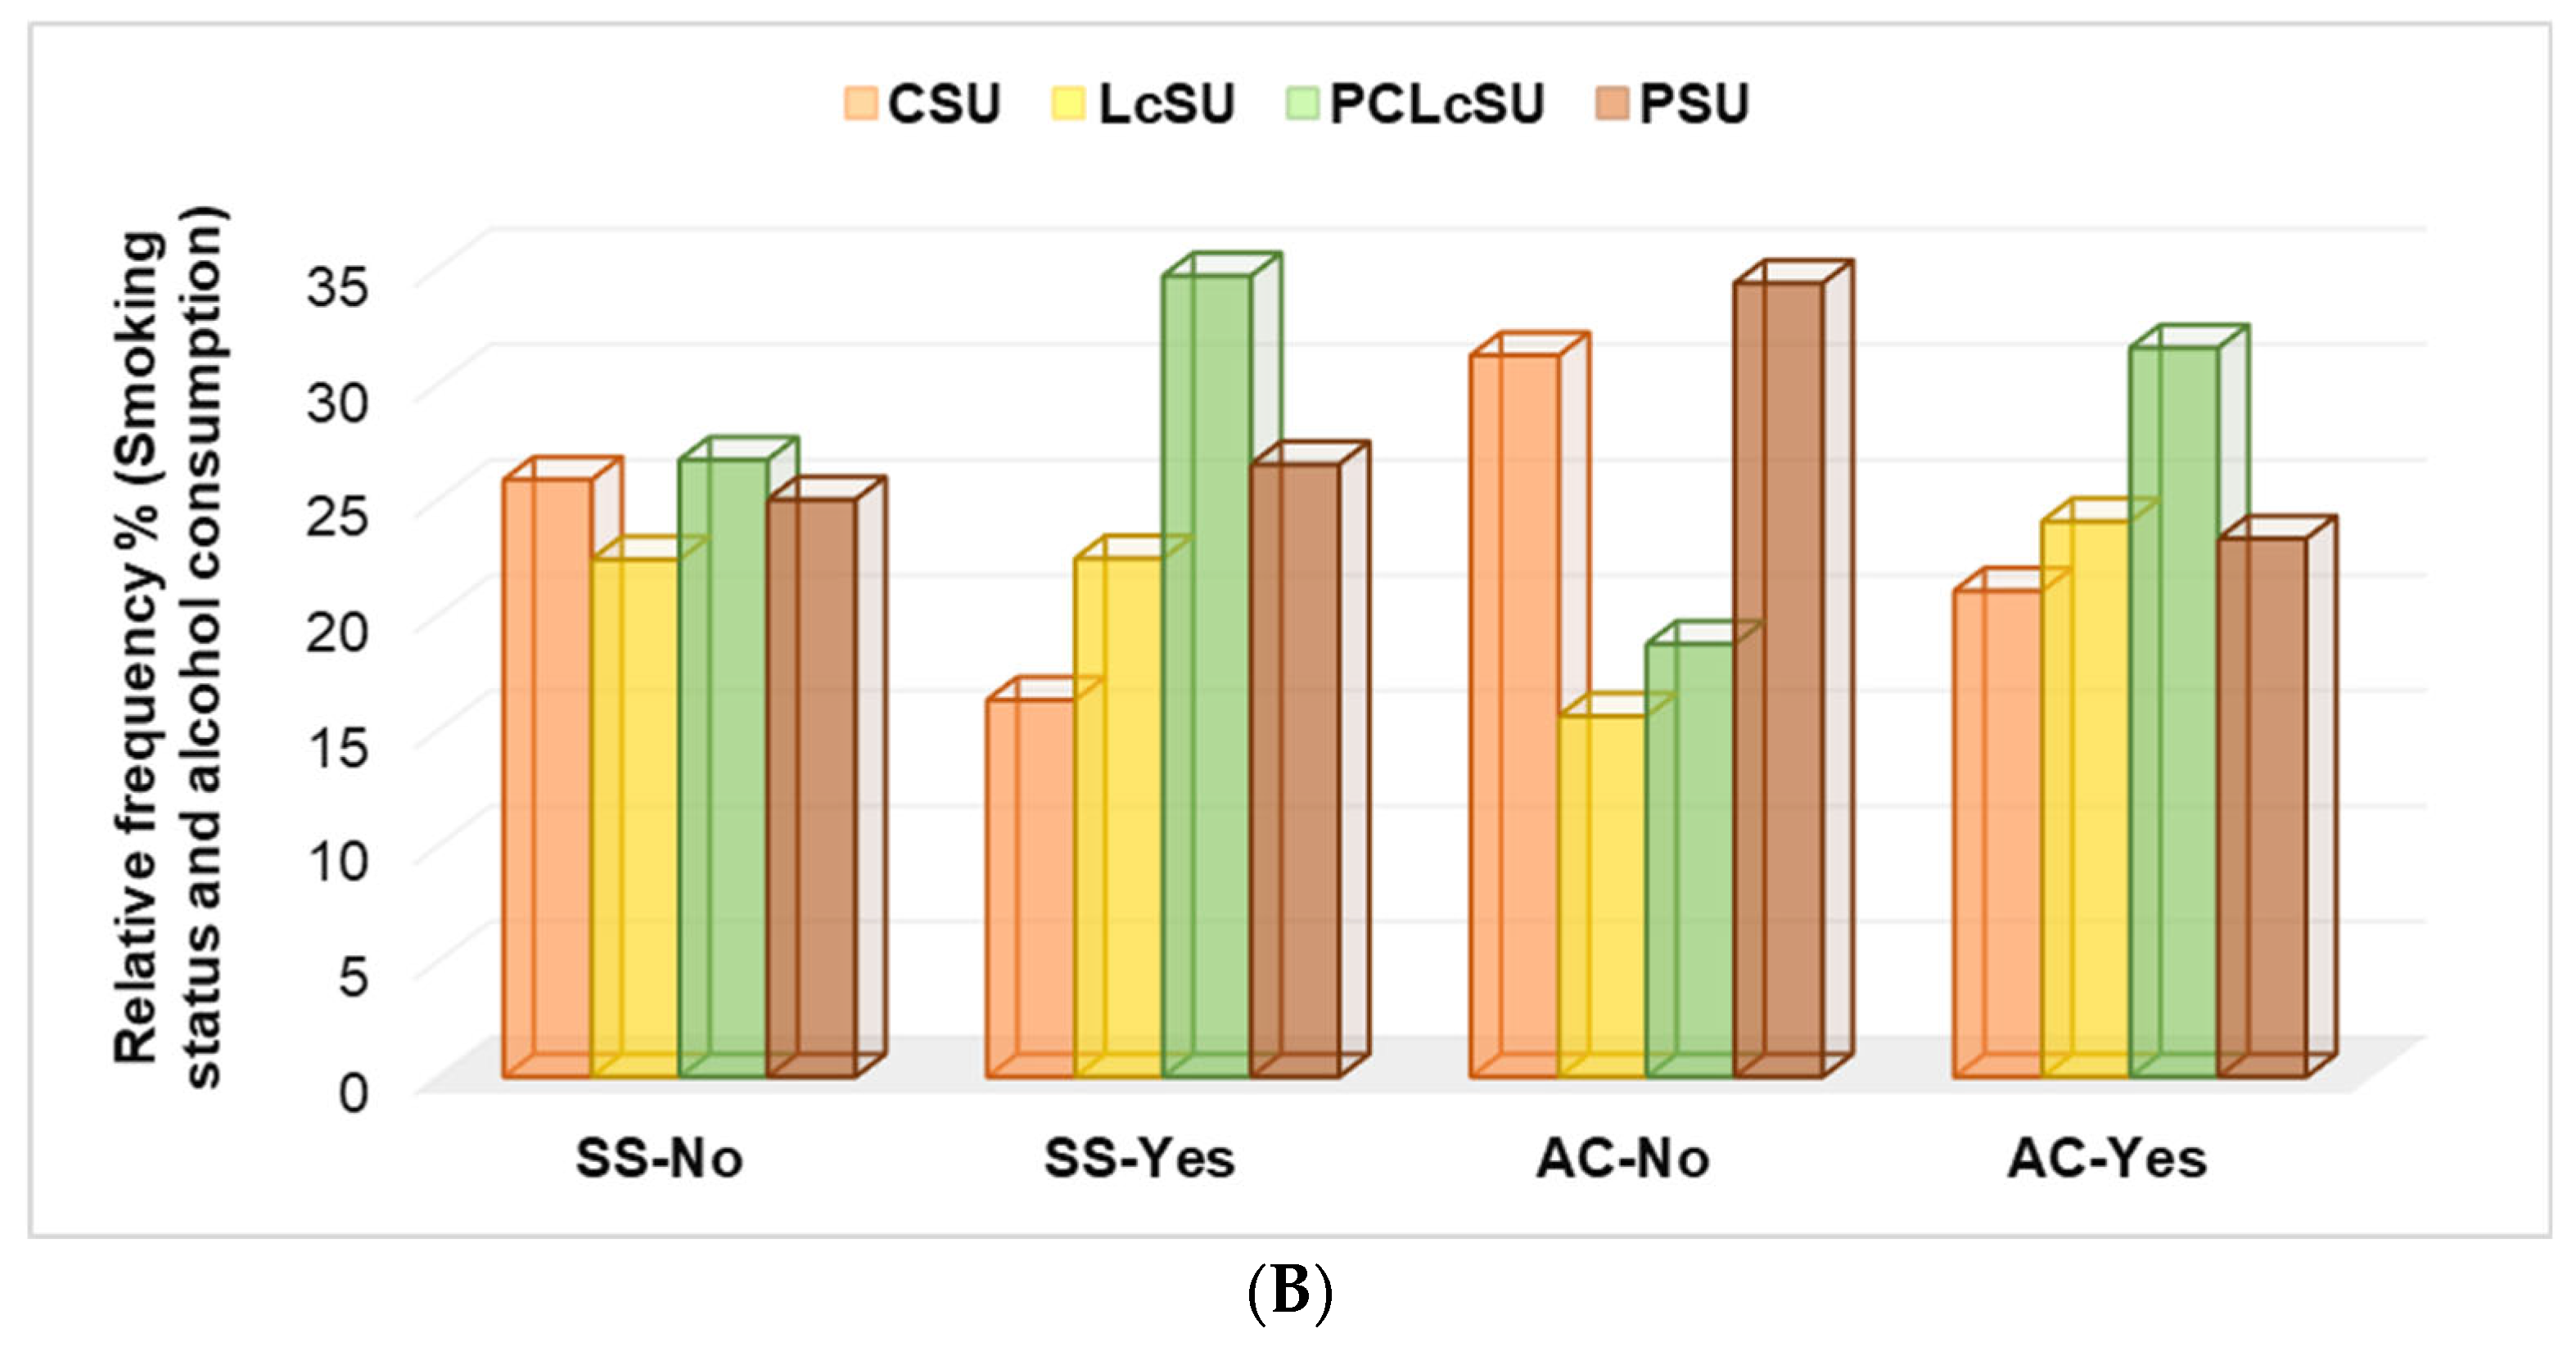
No significant differences were found between non-smoker gym goers and NS consumption (22.4–26.7%,
p > 0.05). PCLcS was mainly preferred by smokers (34.7%), while all others were less preferred (
p < 0.05,
Figure 4B). The same preferences were shown by gym goers who consumed alcohol; PCLcS was the first choice (
p > 0.05,
Figure 4B). Non-alcohol consumers most frequently chose protein and creatine (
Figure 4B).
3.6.3. NS Consumption, Body Weight Status, and Daily Diet Properties
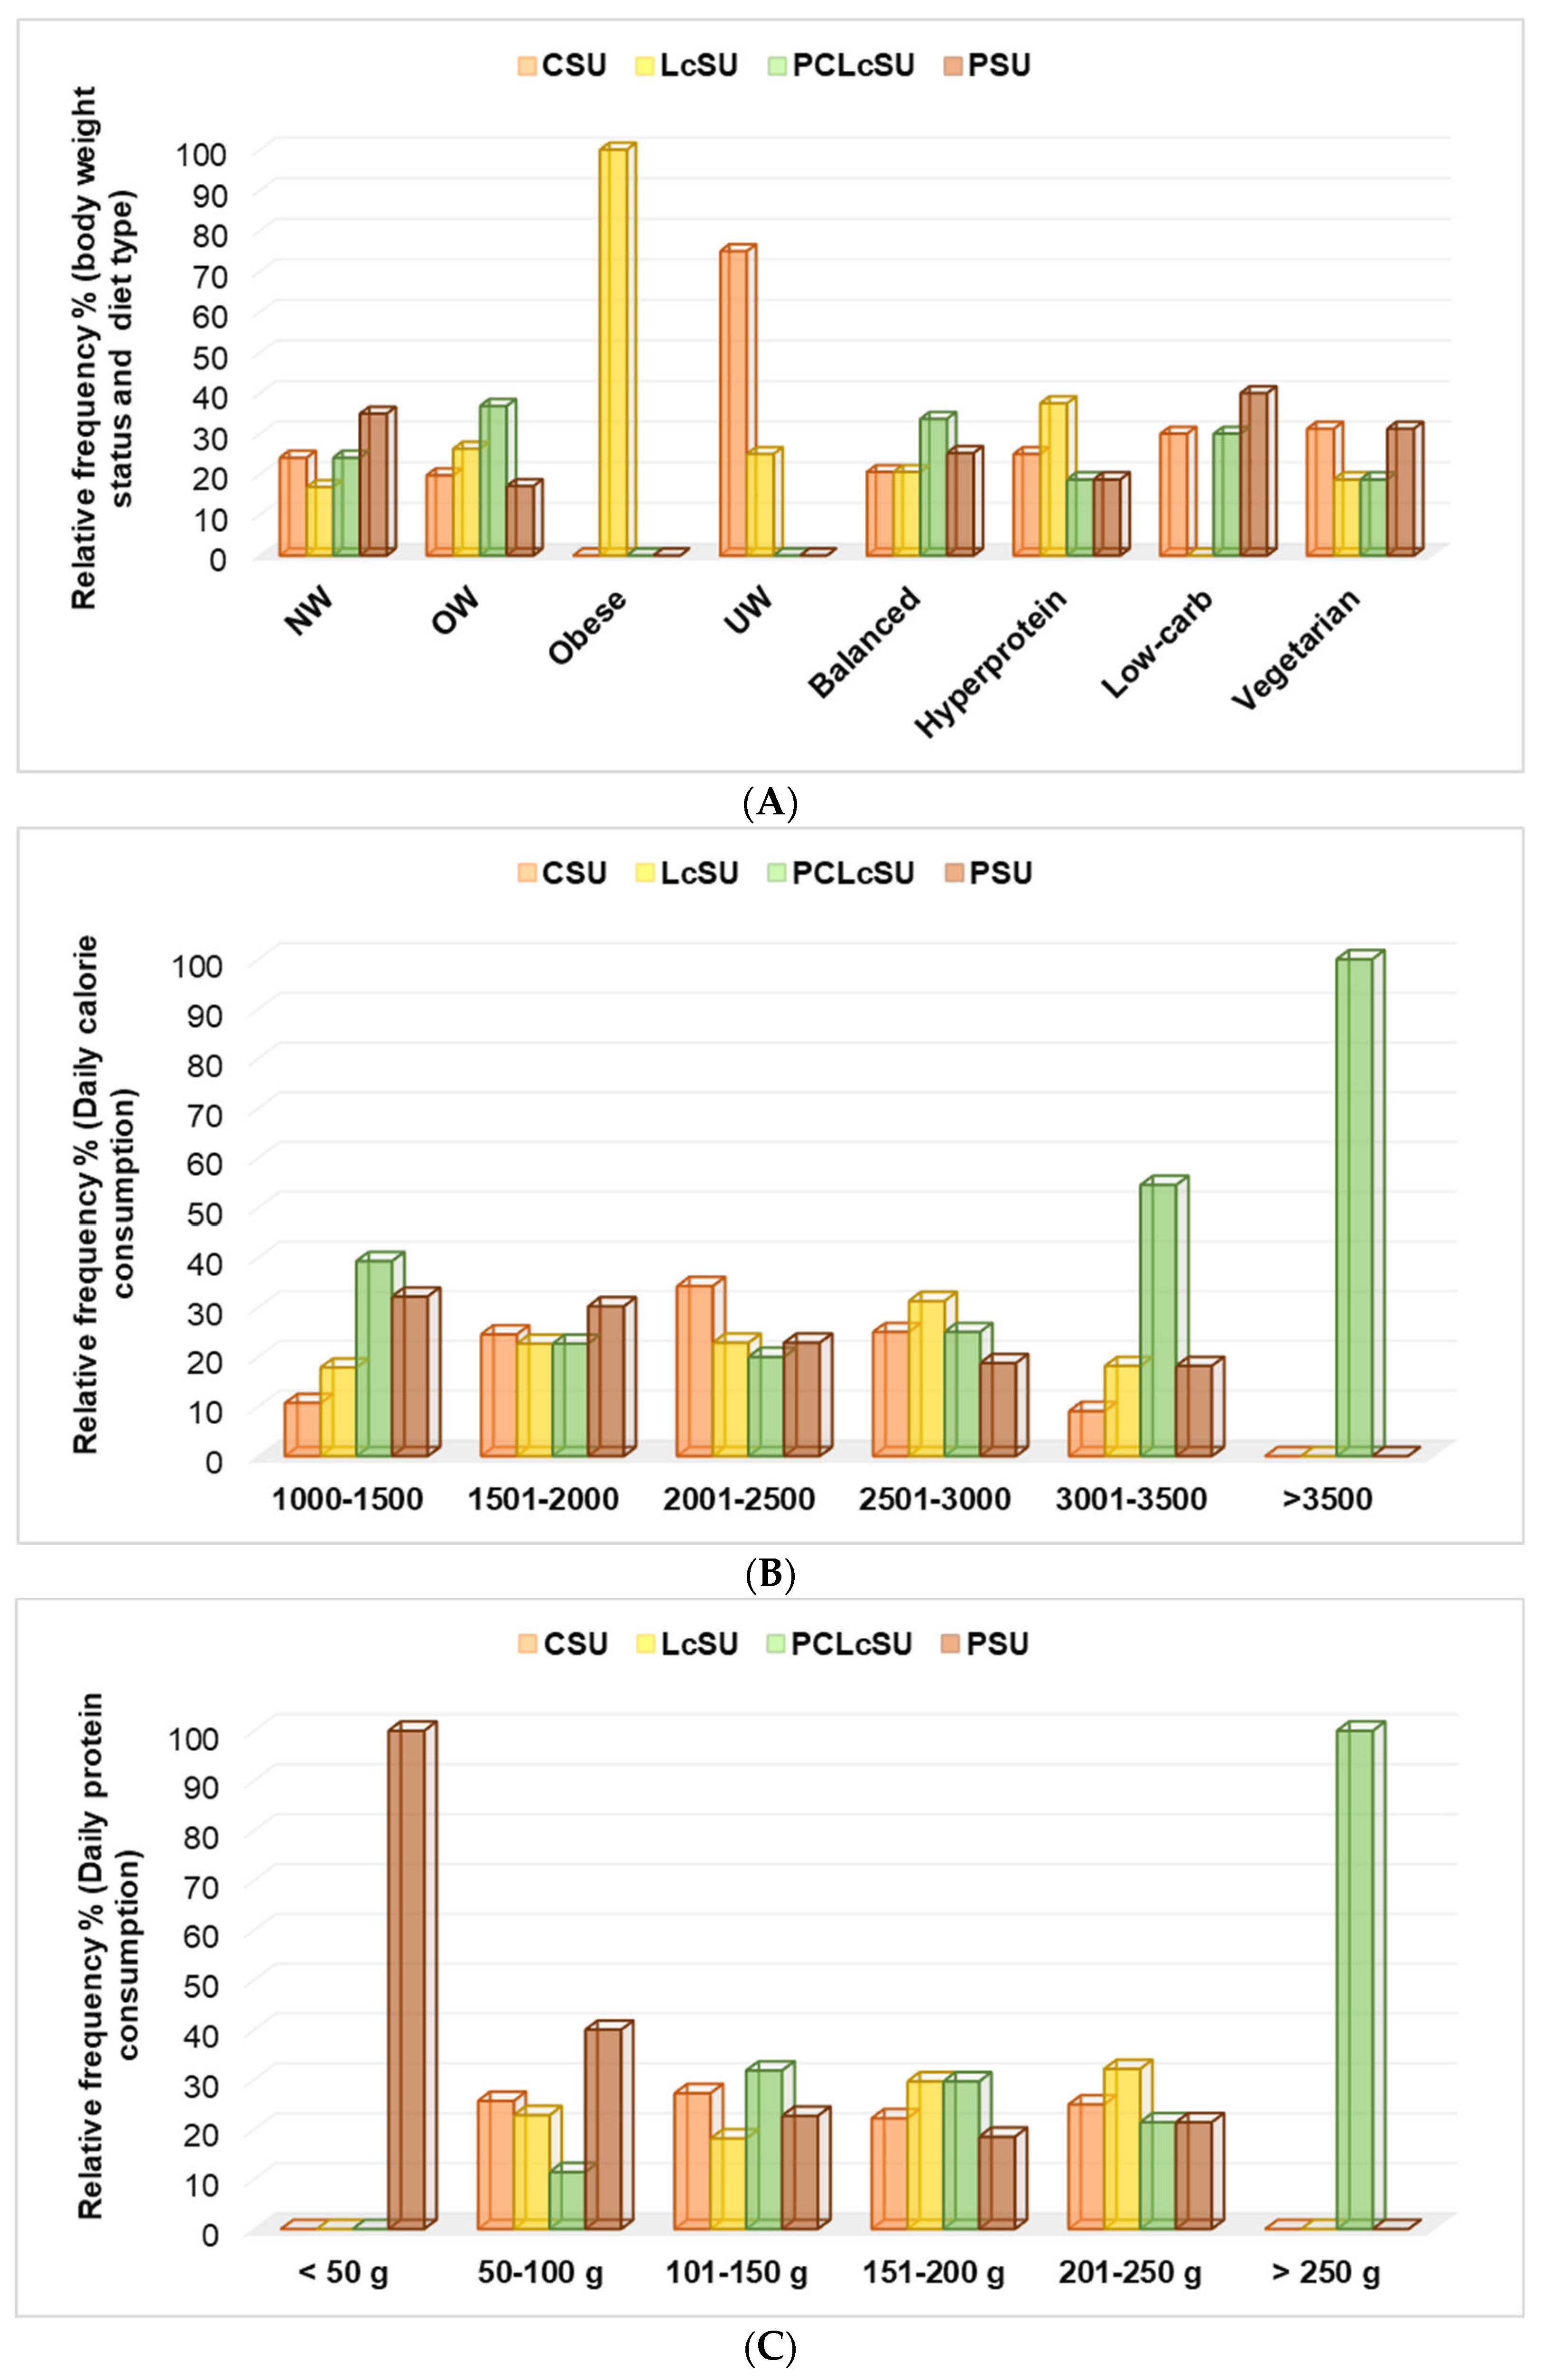
Obese gym goers consumed only L-carnitine (100%), while underweight ones chose creatine (75%) and L-carnitine (25%) (
p < 0.05,
Figure 5A). Overweight and normal-weight participants mainly preferred PCLcS and protein (
Figure 5A). Both supplements were primarily chosen for participants with balanced and low-carb diets. Those with a hyperprotein diet preferred L-carnitine, while vegetarians used creatine and protein supplements (
Figure 5A).
The principal component analysis showed that LcS consumption substantially correlated with obese gym goers (r = 0.999, p < 0.05). By contrast, CS administration strongly correlated with UW (r = 0.943, p > 0.05), PS with NW (r = 0.889, p > 0.05), and PCLcS with OW (r = 0.898, p > 0.05).
PCLcS and PS consumption showed a considerable association with the low-carb daily diet (DD), LcS and PCS highly correlated with a balanced DD, and PCLcS use was also strongly associated with a vegetarian diet (r = 0.960–0.986, p < 0.05).
Participants with >3500 calories and >250 g proteins used PCLcS exclusively, while those with <50 g proteins completed their diet with protein supplementation (
Figure 5B,C). These supplements were the leading choice for gym goers with 3001–3500 calories and 1000–1500 calories (PCLcS,
p < 0.05) and 50–100 g protein (PS,
p < 0.05).
4. Discussion
The consumption of nutritional supplements among exercising individuals has increased unnecessarily. Adequate research is essential to clarify the various facts regarding the necessity, efficacy, and appropriate use of dietary supplements. In a survey of 1120 gym goers in Brazil, 36.8% reported regularly taking supplements such as protein and creatine to build muscle and strength. Products high in protein and amino acids were consumed nearly every day by almost 60% of the participants, followed by isotonic beverages and carbohydrates, with percentages of 32% and 23%, respectively. Supplements high in protein were taken by those under 30 years old, mostly men [
123]. This observation also fits our findings. The present study enrolled 165 participants (men to women ratio = 2:1) who were recreational gym practitioners. Their daily diet included an NS (protein, creatine, L-carnitine) or a combination of these as a routine part of their lifestyle. The cohort was analyzed according to the type of NS intake. The PSU group accounted for almost 23%, while the CSU and LcSU groups comprised 22% and 25%, respectively, and the PCLcSU group was 29%. The socio-demographic data for the entire cohort revealed that most participants were male (66%), compared to approximately 33% female. Over 52% were aged 18–30; thus, our findings confirm the young gym goer profile [
124]. The outcomes for professional activity demonstrated that the cohort was balanced among individuals with office work, physical activity, and mixed activity that combined office work and physical effort. According to their BMI, nearly 50% were of normal weight, 46% were overweight, 1% were obese, and 2% were underweight. These low percentages for extreme BMI values suggest that our gym goers prioritized their health and physical appearance. Our study revealed significant associations between occupational activity, age, gender, and body weight categories. Obese participants had office work, suggesting that sedentary lifestyles in office-based occupations significantly contribute to excessive weight gain. The findings align with the existing literature indicating that reduced physical activity in workplace settings is a significant factor contributing to the rising prevalence of obesity [
125].
In the present study, dietary patterns showed substantial correlations with body weight and gender (
p < 0.05). Almost 65% of gym goers had a balanced diet, while 19% opted for a hyperprotein diet (
p < 0.05). Vegetarian and low-carb diets were rare (9% and 6%,
p < 0.05). Sedentary participants were predominantly oriented toward a vegetarian diet (14.5%), while obese individuals preferred a balanced diet. Participants with a vegetarian diet, with high-calorie (DC >3500) and low protein (DP <50 g), were highly associated with overweight status (
p < 0.05). Many gym goers used protein supplements to reach this daily amount. However, 17% of participants were unable to provide their daily protein intake (14%) and daily calorie intake (3%) due to a lack of nutritional knowledge, as previously reported [
126]. Moreover, balanced and vegetarian diets were the most affordable, with 50% and 62.5% of participants, respectively, having a monthly income of 2000–4000 RON.
Our findings reported that a balanced diet consisted of 1501–2500 calories per day (68%) and 50–150 g of protein (54%). In this context, almost 59% of recreational gym goers were PCLcSUs and PSUs, even if the extra supplementation was unnecessary; our findings fit the literature data [
77]. The hyperprotein diet involved a daily protein intake of 151–250 g (87.5%) and a daily calorie consumption of 2501–3000 kcal (90.6%), while the most used nutrient supplement was L-carnitine (37.5%,
p < 0.05). Office workers preferred a low-carb diet (60%); they consumed 1000–2000 calories/daily (80%) and 151–250 g of protein (75%). A vegetarian diet also involved 1000–2000 calories per day (93%) but less proteins (50–150 g/day, 62.5%). LcS and PS highly correlated with a balanced diet, while PCLcS use was strongly associated with a vegetarian diet (r = 0.960–0.986,
p < 0.05). Hyperprotein and low-carb diets required higher incomes: 4001–6000 RON (43.75%) and over 6000 RON (40%), respectively. Moreover, bad habits (alcohol consumption and smoking) increased with monthly expenses (monthly income >4000 RON: 55.54% and 67.35%, respectively), while most consumers (>50%) were young (18–30 years old) and preferred the triple combination (PCLcS). Associating protein, creatine, and L-carnitine (29%) and consuming them on the same day has synergistic benefits in muscle growth, strength, and recovery [
44,
127,
128].
The claims of increased muscle mass, higher fat loss, improved performance, and quick recovery lead to the consumption of protein and amino acid supplements. The present study’s results showed that the single choice of obese gym-goers was L-carnitine, known as a fat-burner [
129], while underweight individuals chose creatine and L-carnitine (
p < 0.05). Creatine induces weight gain [
130], while L-carnitine may improve energy and physical activity, which could indirectly support weight gain if combined with a proper diet and strength training [
131].
Correlating the training period (in months), frequency (times per week), duration (in hours), and NS consumption, the outcomes highlighted the complex interplay between occupational activity, dietary habits, supplementation, training patterns, and body weight, emphasizing the need for targeted interventions to promote healthier behavioral choices. The study revealed strong associations between NS use and training duration: the PCLcS combination was nearly perfectly associated with training sessions exceeding 2 h and a frequency of more than 5 times per week (
p < 0.05), while PS substantially correlated with a gym period of more than 1 year (
p < 0.05). These findings confirm previous data regarding their benefits in RT [
132,
133].
Our gym goers similarly used CS and LcS to ensure performance in force training (65.79% vs. 62.16%). Only CS use benefits are confirmed by literature data [
23,
134,
135,
136]. Moreover, they did not optimally valorize the strong and verified effects of PS or the synergistic combination of PCLcS (42.86% and 47.92%, respectively). These findings suggest that the participants selected NSs themselves and consumed protein supplements without the recommendation of a qualified practitioner, as previous studies claimed [
126,
137]. Only PCLcS was correctly associated with competitive scope (
p < 0.05), demonstrating the correct supplementation that is professionally supervised for potential elite athletes.
Moreover, in one-only supplement consumption, there were significant correlations between CSUs and physical effort capacity, PSUs and physical effort recovery and weight loss, and LcSUs and fat-burning and consumption in MD time (p < 0.05).
In addition, the high incidence of harmful effects claimed by NS users (30% in one-only NS use and 100% in triple combination) supports the previous warnings regarding progressively increased and unnecessary sports supplement consumption [
77,
138,
139]. Diarrhea, nausea, and stomach cramps were substantially associated with LcS at 1–2 g/dose (
p < 0.05). Whey protein at 40 and 60 g/doses significantly correlated with muscle cramps and liver damage (
p < 0.05), while CS at 1–5 g strongly correlated with weight gain (
p < 0.05). NS type and daily dose were the primary factors associated with the risk of potential side effects reported by participants (
p < 0.0001).
Strengths and Limitations of the Present Study
The present study offers complex data regarding protein and amino acid supplements consumed by recreational gym goers, considering various influential factors. Two qualified coaches selected the participants based on direct discussions with regular gym members they had met during their training sessions. Moreover, data collected through face-to-face interviews were more accurate than those obtained through an online questionnaire.
The results of the present study confirmed all hypotheses. Most recreational gym goers were young (18–30 years old) and had completed academic studies. The men’s percentage was twice that of women’s; of the total group, 25% consumed all NSs in combination. Our findings indicate that supplement consumption is influenced by sex, age, body weight, diet, gym duration, and the type and scope of training. The present study also revealed that all components act synergistically in the triple combination, stimulating muscle growth and strength. Furthermore, the risk for potential side effects is significantly influenced by the NS type and dose.
Even if our study contains valuable insights, several limitations should be acknowledged, as follows:
The cohort selection process, which included only the regular members of 2 gym centers from the same Romanian city, did not ensure an optimal representation of all age groups;
All data were obtained from the participants, guaranteed by self-responsibility;
The cross-sectional design limits the possibility of establishing relationships between cause and effect;
The absence of measurements of biological parameters restricts the accurate evaluation of the risk for potential harmful effects of protein and amino acid supplements on health.
