1. Introduction
Travelling by plane is an essential form of transportation given the number of individual and organizational demands related to business, education, medical treatment, tourism, sports, and others [
1,
2,
3]. Unfortunately, people are negatively affected by intercontinental travel in several ways including jet lag [
1]. “Jet lag is a syndrome caused by disruption of the ‘body clock’ and affects most air travelers crossing five or more time zones; it is worse on eastward than on westward flights” [
4]. This body clock, or circadian clock, provides the body with information pertaining to sunlight or darkness and can cause physiological disruption if it does not reset quickly when crossing different time zones [
5].
Jet lag is a syndrome that can affect human beings in many ways including physical performance [
6,
7]. The amount of time required to recover from the effects of jet lag is inconsistently reported in the literature. Weingarten and Collop reported that travelers require enough sleep, usually 7.5 to 8.5 h, before they return to normal [
1,
8]. Waterhouse
et al. reported that travelers need a specific number of days to recover, determined by calculating two-thirds of the number of time zones crossed [
9]. For example, if a person crosses nine time zones, 6 days will be required to recover fully. Conversely, Youngstedt and O’Connor reported whether flying westward or eastward, a day is recommended for each time zone crossed [
10].
Researchers have investigated the effect of altered sleep cycles due to travel resulting in jet lag and correlations to decreased physical performance. According to Lemmer
et al., after an eastward flight with six time zones crossed, swimmers reported that their swimming skills and their reactions were decreased [
11]. They reported that these effects lasted 3 days for athletes travelling westward and 7 days for eastward flights. Other studies looked at the effect of jet lag on physical performance. Wright
et al. reported that jet lag affected swimmers physical performance after an eastward flight as they lost strength in their arm and elbow flexion and other movements [
12]. Reilly
et al. stated that leg and back strength of British Olympic athletes was affected after a westward flight [
13]. However, O’Connor
et al. who reported no change in college swimmers after crossing four time zones [
14]. Also, a study by Lagarde
et al. of 27 American volunteers crossing seven time zones in an eastward direction looked at the effect of 300 mg caffeine and 5 mg melatonin and compared it with a placebo. Each participant was exposed to a static performance test (hand grip strength), maximal height test (squat jump test), and power and endurance test (multiple jump test). They reported decreased ability in the morning (during the static performance) in the first three sessions in the placebo group, increased ability (among the caffeine group while performing the static performance), and no change in physical performance in different occasions (all afternoon sessions for the static performance and in the non-dominant hands mornings and afternoons) [
15].
Many Saudi Arabians travel to the United States for a variety of reasons. In 2012, 90,000 visas were given to Saudi Arabians visiting the United States by the United States Embassy in Saudi Arabia, also, approximately 82,500 Saudi Arabian students are enrolled in King Abdullah scholarship program [
16]. There are approximately 111,000 Saudi Arabian students living in the United States [
17]. There are twelve time zones between Riyadh, Saudi Arabia and Los Angeles, United States. Therefore, the objectives of this study were: (
1) to assess changes in postural stability using the Stability Evaluation Test (SET) and Modified Clinical Test of Sensory Interaction on Balance (mCTSIB) in healthy young adult males after trans-meridian air travel between Saudi Arabia and the United States over time (within 24, 48 and 72 h); (
2) to compare the effect of jet lag on postural stability between participants who did not get any sleep after arrival and those who slept prior to their 1st post-flight assessment over the three time intervals.
2. Materials and Methods
Twenty-two male participants, between 23 and 36 years of age, were recruited for the study. All participants were planning to travel to Saudi Arabia and return to the United States during school breaks. Inclusion criteria required having no balance impairments for any reason. Pre-flight assessment was performed prior to the individual participants’ flight to Saudi Arabia and post-flight assessments were taken on three consecutive days after their return to the United States (within 24, 48, and 72 h). All participants were assessed for their 1st post-flight visit during the first 24 h upon arriving back in the United States. Participants self-selected their groups. Eleven participants were assessed after post-flight sleep prior to their 1st post-flight assessment (Group 1) while eleven participants had their 1st post-flight assessments before getting any post-flight sleep (Group 2).
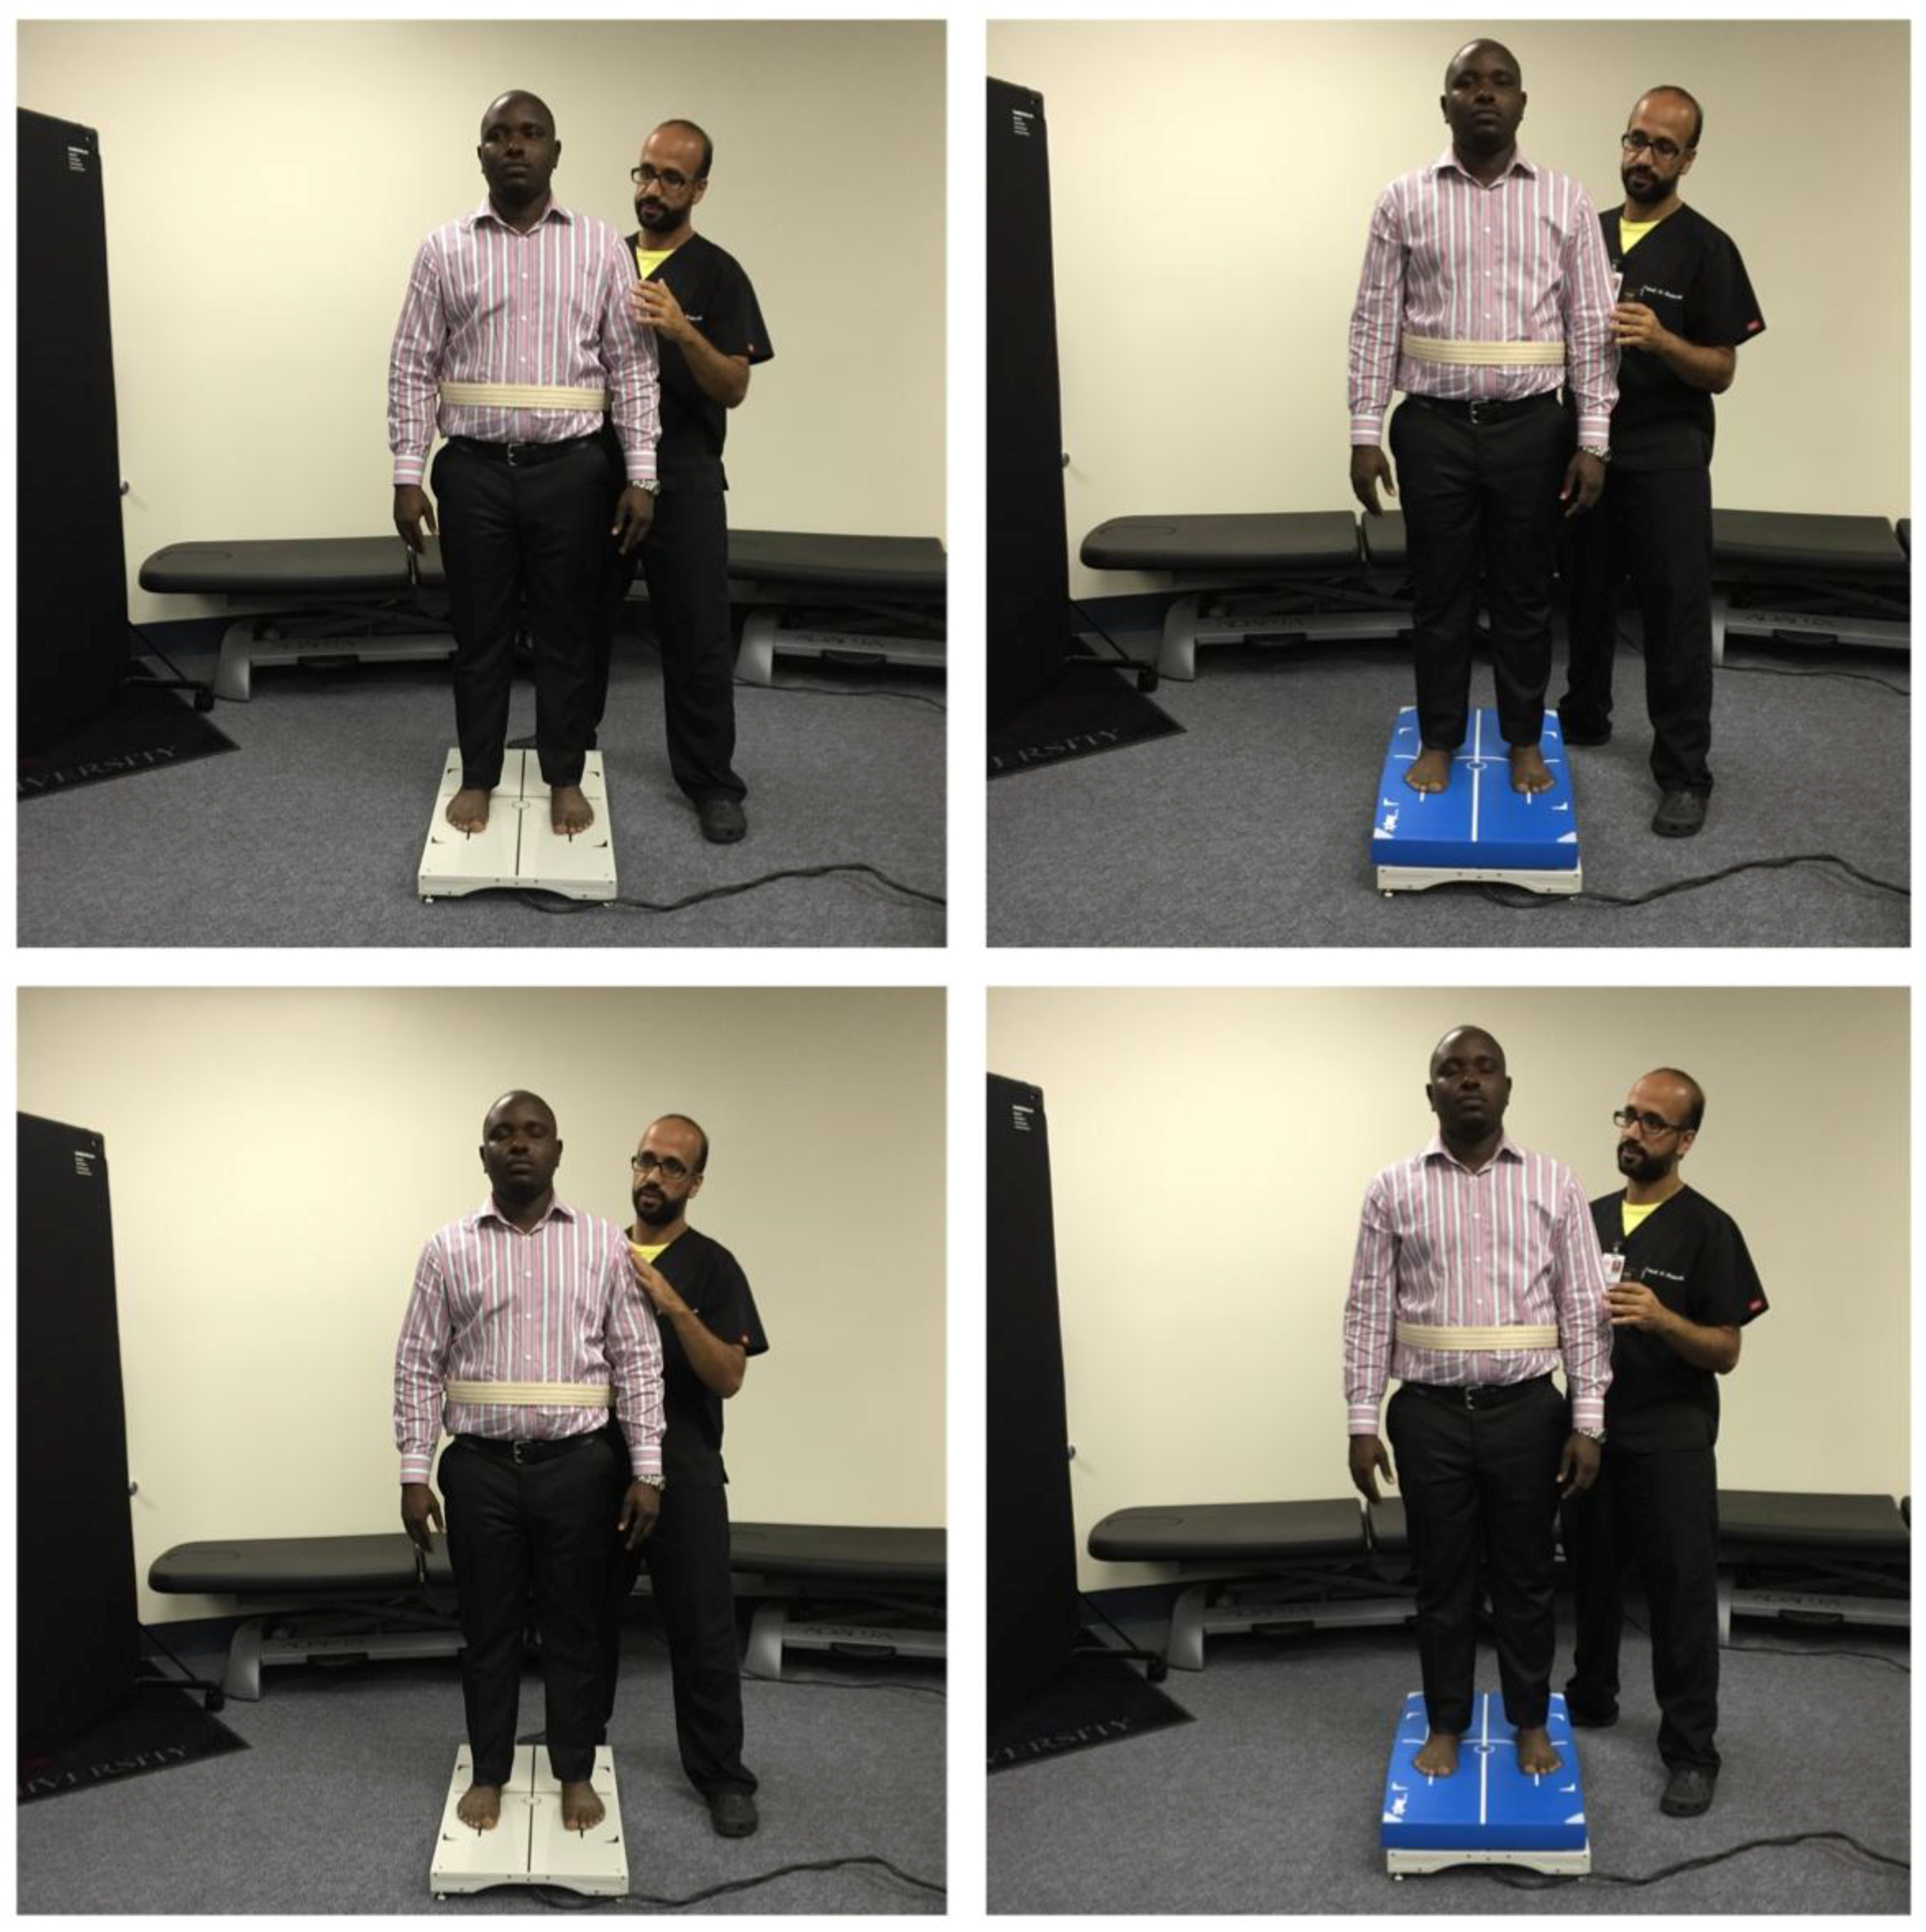
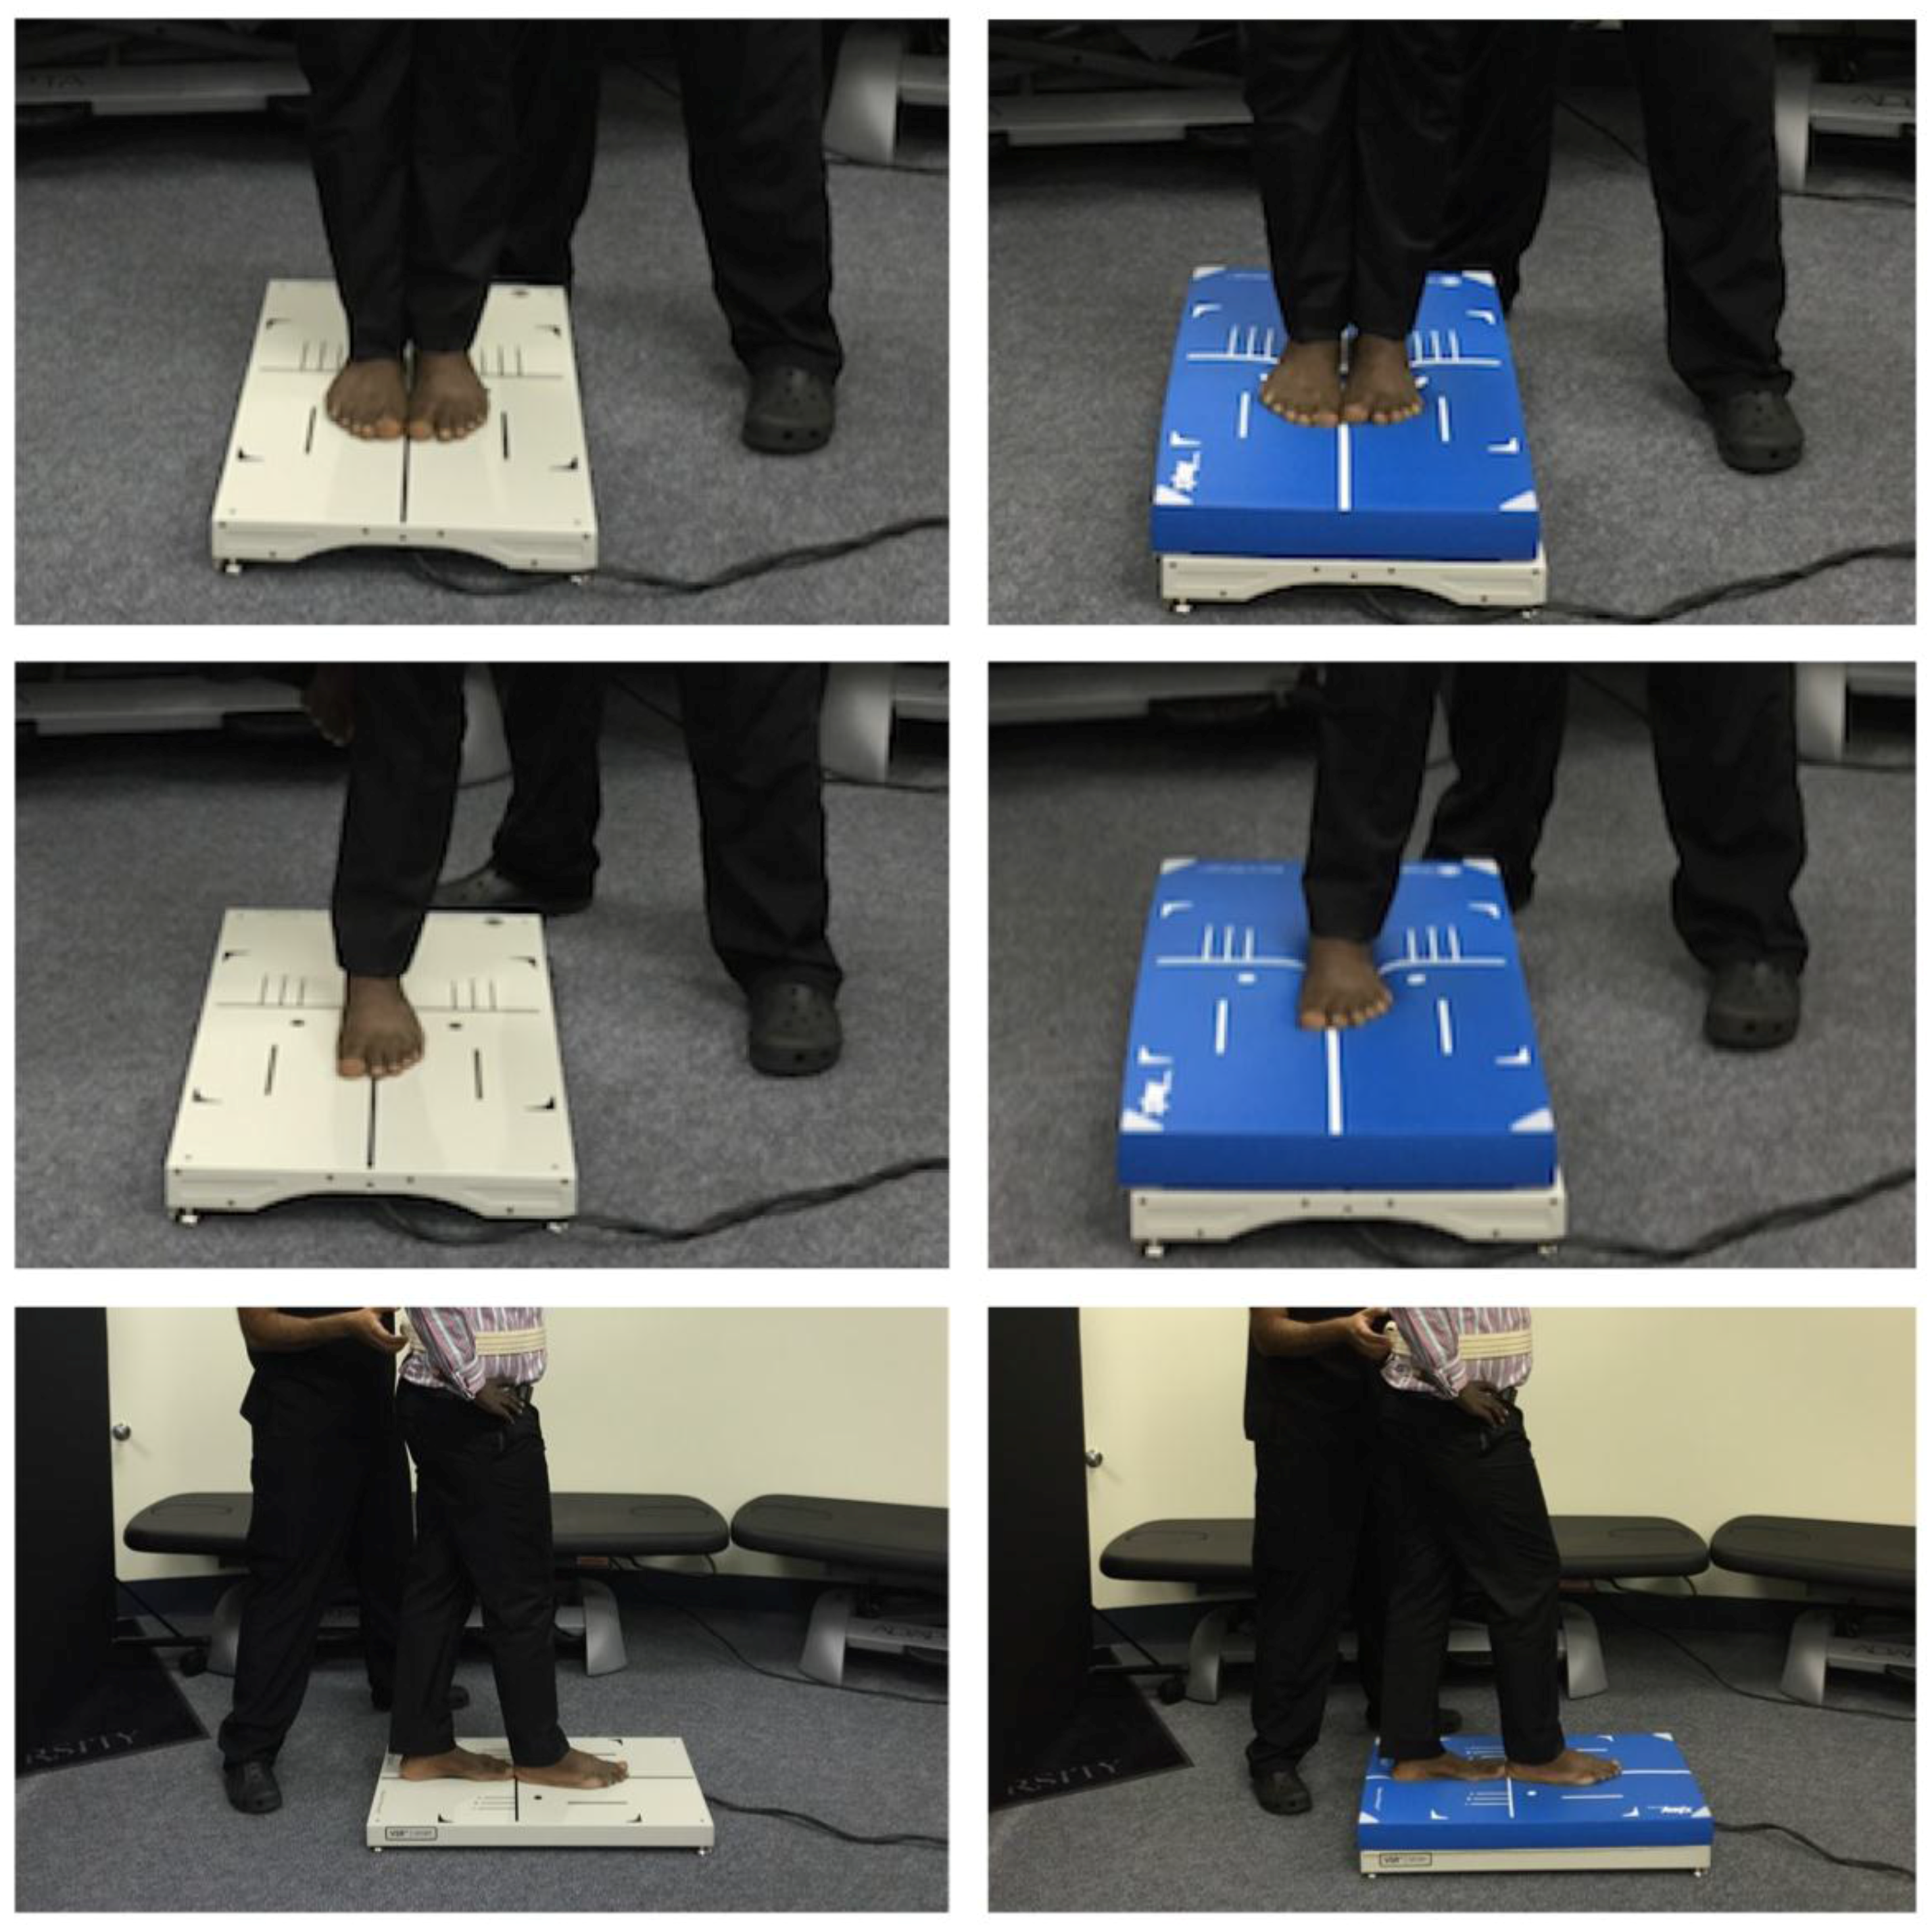
The Loma Linda University Institutional Review Board approved the study and participants signed a written informed consent prior to participation in the study. The NeuroCom
® VSR™ SPORT CDP was used to measure participant’s postural stability. Two testing protocols were used, the mCTSIB and the SET (
Figure 1 and
Figure 2, respectively). Both protocols had been shown to be valid and reliable. A comparison study by El-Kashlan
et al. between the CTSIB and the dynamic posturography (r ranged 0.41 and 0.89), which indicates that both tests are useful to work together to determine participants’ postural stability [
18]. On the other hand, a study by Corvo
et al. found the SET to be very helpful in measuring balance [
19]. Also, Hanline and Olson found that the test-retest reliability for composite SET scores was greater than 0.80 in a pediatric population [
20]. Both testing protocols measured postural stability as sway velocity in degrees per second across several different testing conditions. Participants were asked to stand still on the force plate. Testing conditions for the mCTSIB included eyes open on a stable surface for 30 s for three trials and then was repeated with eyes closed for 30 s for three trials. The same two conditions were then repeated on a foam surface with eyes open and with eyes closed. Testing conditions for the SET included eyes closed and hands on waist on a stable surface in double limb stance, followed by single limb stance, and finally tandem stance. Each test condition was performed once for 20 s. The same three conditions were then repeated on a foam surface. Authors were looking at the composite scores for these tests. Finally, participants were interviewed by the investigator and were asked various questions regarding their quality of travel during the flight (
Table 1). Participants attended a total of four assessment sessions each lasting approximately 45 min.
Sample size was calculated using a medium effect size of .50 between participants in Group 1 and Group 2, a power of .80 and α = 0.05. The sample size needed was 50 participants. We were able to recruit 40 participants of whom 18 dropped throughout the study. Data analysis was completed on the remaining 22 participants with a power of 72 and an effect size of 45. Data was analyzed using SPSS version 22.0 for Windows. The characteristics of the participants were summarized using means and standard deviations for quantitative variables and frequency (%) for categorical variables. The normality of the variables was examined using the Kolmogorov-Smirnov test. Baseline characteristics of the two groups were compared using independent t-test or Mann-Whitney U test for quantitative variables and Fisher’s Chi-square test for qualitative variables. One way repeated measures analysis of variance (ANOVA) was used to assess changes in postural stability using SET and mCTSIB tests over time. To examine the effect of jet lag by group over time, a 2 × 4 mixed factorial analysis of variance (ANOVA) was conducted, after controlling for the duration of sleep on board. Pairwise comparisons were done using Bonferroni test. The level of significance was set at p ≤ 0.05.
3. Results
After excluding 18 participants for not returning for follow-up visits, twenty-two males with a mean age of 27.68 ± 3.59 years completed the study. Their mean height was 1.72 ± 0.06 meters and the average time they slept on board was 5.66 ± 3.31 h. At baseline, there was no significant difference between the two groups in terms of all the characteristics (
p > 0.05, see
Table 1). However, participants who slept prior to their first post-flight assessment (Group 1) had less sleep duration during their flight as compared to those who chose to have their first post-flight assessments conducted immediately after arrival (Group 2) (4.40 ± 3.61 h
vs. 6.91 ± 2.55 h,
p = 0.06; see
Table 1).
For the SET, there was a significant difference in mean postural stability of all participants over time (F
3, 63, 0.05 = 4.0, η
2 = 0.20,
p = 0.01). Pairwise comparisons using Bonferroni test showed that there was a significant difference in mean SET between the 1st post-flight assessment and 2nd post-flight assessment (η
2 = 0.71,
p = 0.02) and between the 1st post-flight assessment and the 3rd post-flight assessment (η
2 = 0.70,
p = 0.03). For the mCTSIB test, however, there was no significant difference in mean postural stability over time (F
3, 63, 0.05 = 0.3,
p = 0.75, see
Table 2).
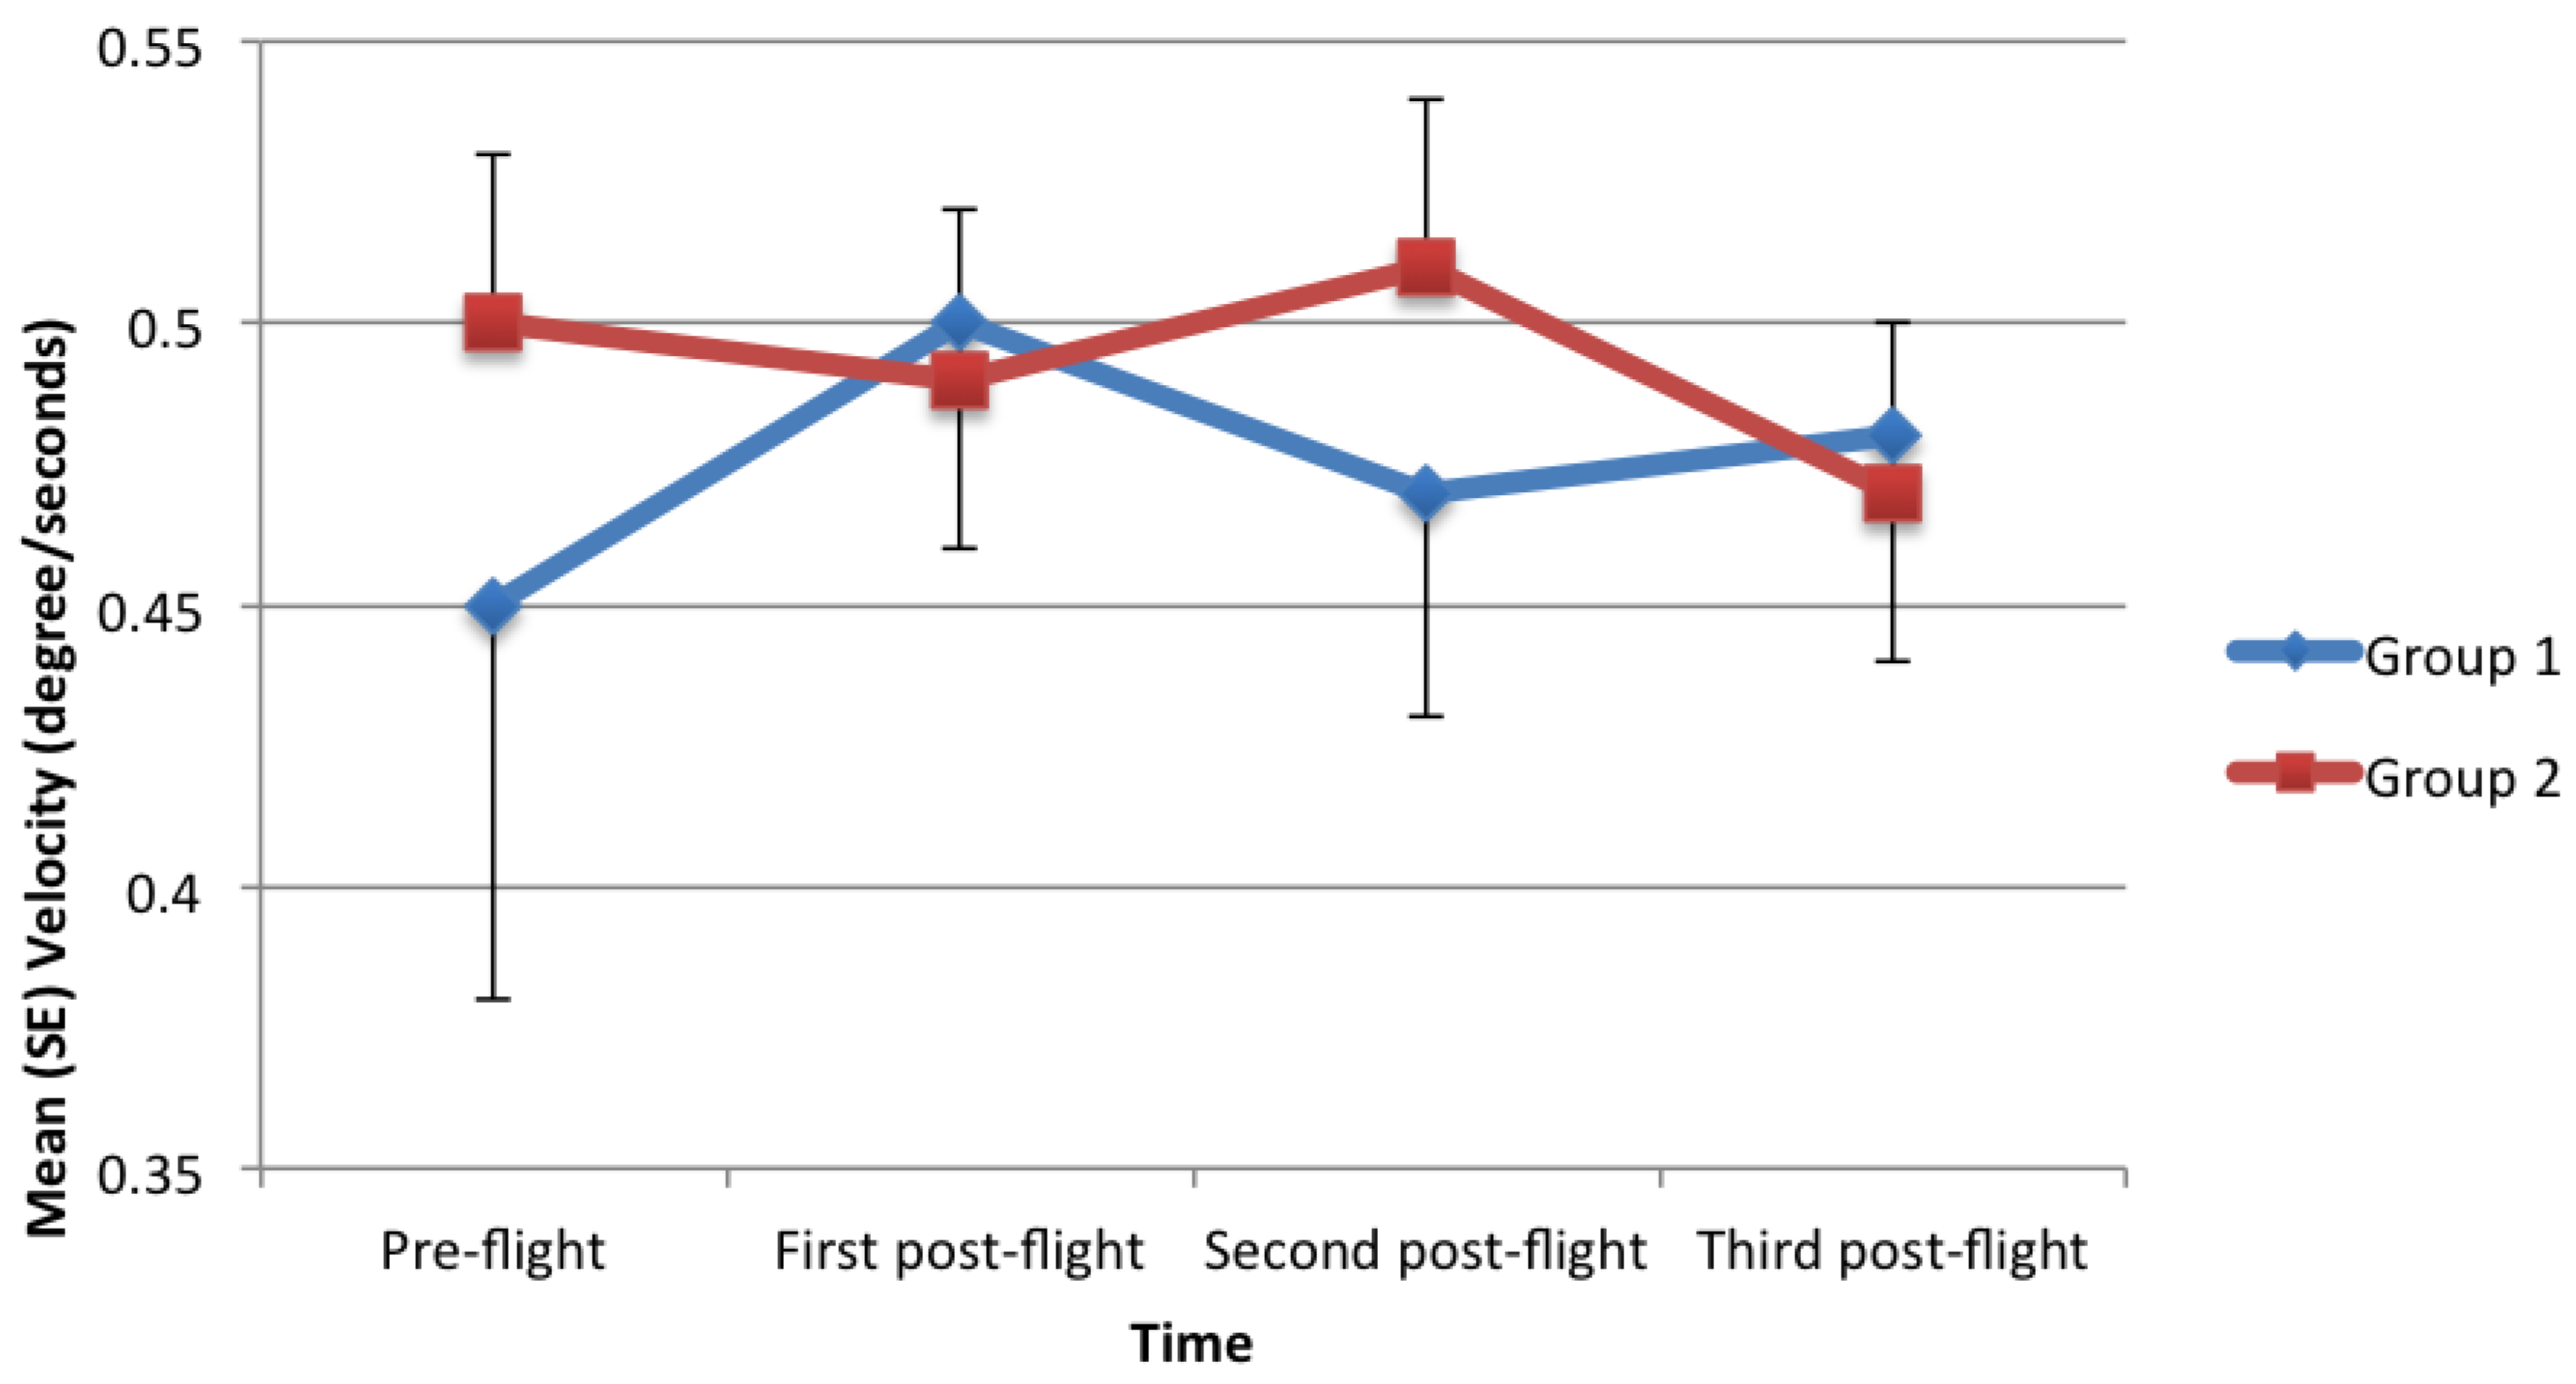
Using the mCTSIB test, there was no significant change in postural stability in participants in both groups over time after controlling for the duration of sleep on board (
p = 0.62 and
p = 0.60, respectively; see
Figure 3). Also, when using mCTSIB and SET there was no significant interaction between postural stability and whether or not the participants slept (
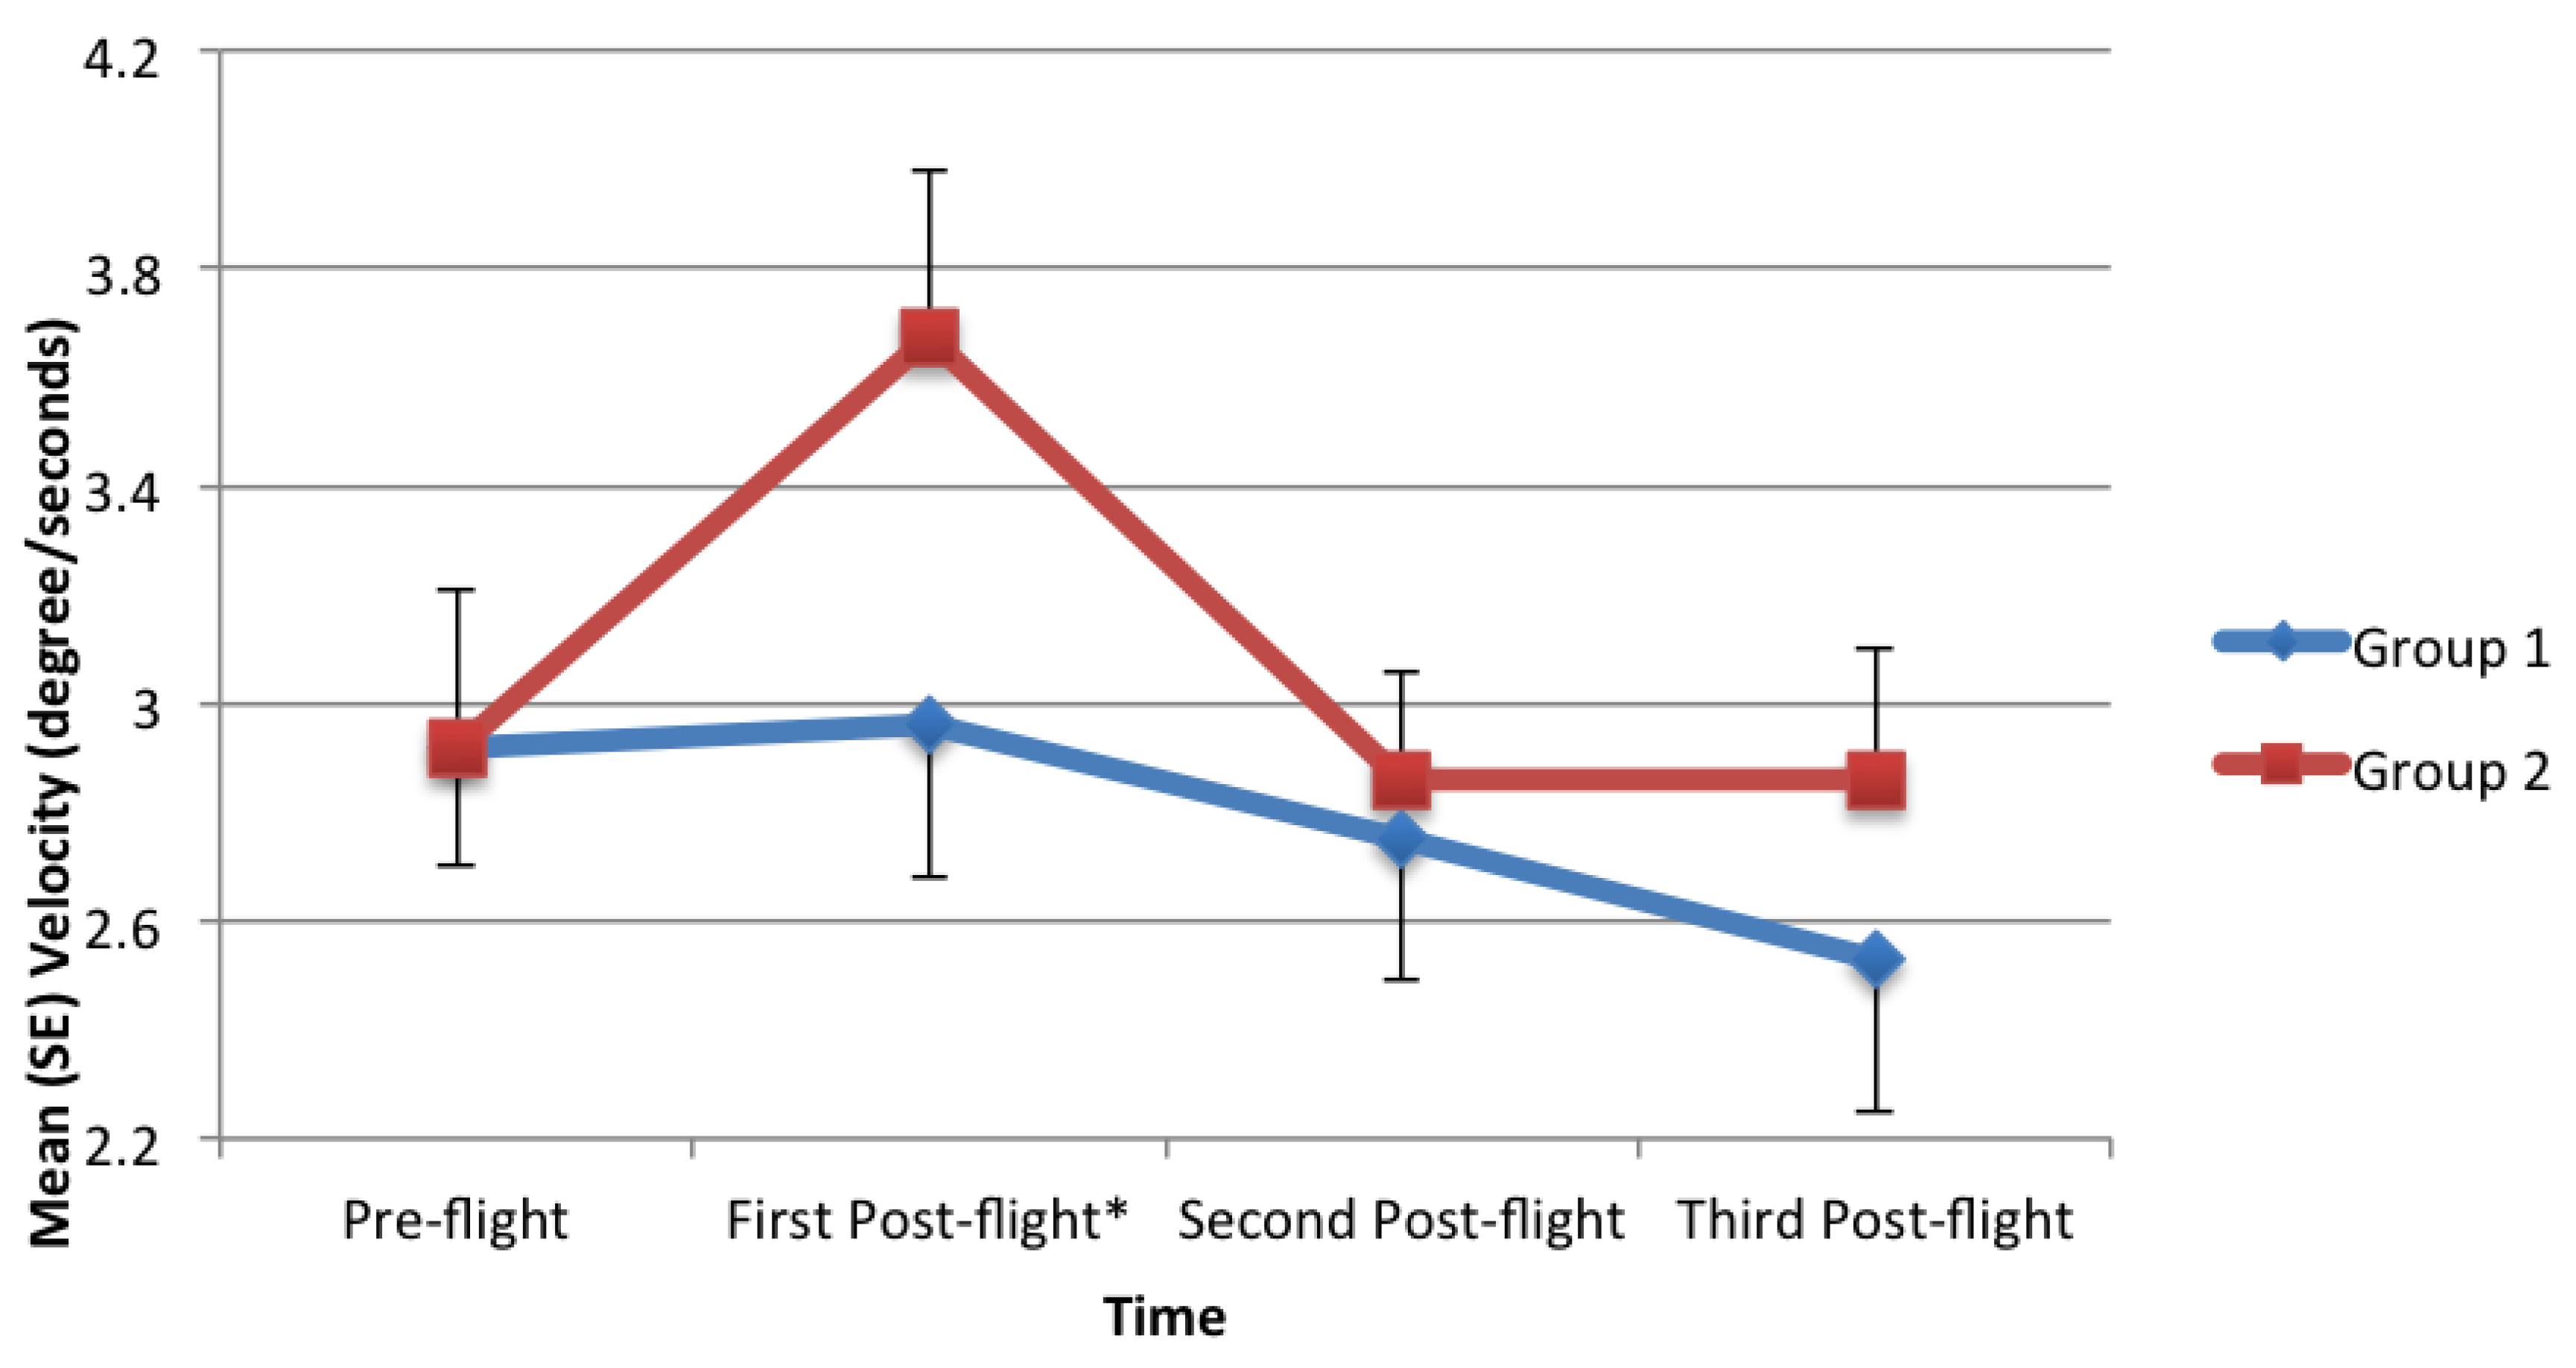
p > 0.05). However when using SET, there was a significant difference in postural stability in Group 2 over time (η
2 = 0.30,
p = 0.04). This difference was significant between the 1st post-flight assessment and the 2nd post-flight assessment (η
2= 1.11,
p = 0.03; see
Table 3 and
Figure 4).
4. Discussion
The SET and mCTSIB protocols were used to measure the effect of jet lag on postural stability. When compared to the mCTSIB, the SET was more sensitive in detecting differences in sway velocity (degrees/seconds) over time. There was no significant impact of jet lag on postural stability in all participants. However, there was a significant difference in postural stability between 1st post-flight assessment and 2nd post-flight assessment and between 1st post-flight assessment and 3rd post-flight assessment in postural stability. The authors explain this as a learning effect.
Although there was no significant impact of jet lag on postural stability among all participants, or when looking at each group separately, the authors observed a potential learning effect. An increase in postural stability was observed in all participants during their 1st post-flight assessment compared to the pre-flight assessment when using SET (
Table 2). The mean value in the pre-flight assessment was 2.92 and it increased to 3.32 in the 1st post-flight assessment. When looking at each group separately, the increase was observed in Group 2 where the mean value of postural stability during the pre-flight assessment was 2.92 and it increased to 3.67 during the 1st post-flight assessment which was a 25.7% increase.
As mentioned earlier in the introduction, physical performance can be affected by jet lag. Postural stability is a component of physical performance and ankle strategy is one of the factors supporting human posture. In the present study with its small sample size, no significant impact was observed. Larger sample size is needed as sway velocity increases were observed.
In this study, the direction of the flight was westward. According to Herxheimer, it is assumed that people will be more affected by jet lag if they fly eastward [
4]. Also, in the westward flight, swimmers recovered and regained their normal functioning in 3 days while it took them 7 days to recover in the eastward flight. In this study, postural stability was not significantly affected on the westward flight. Additionally, the postural stability of the participants increased on the second day after arrival and this may be explained by their ability to learn and start being familiar with the mCTSIB and SET assessment protocol. It can also be assumed that postural stability of travelers in the eastward flights may take more time to be restored and improved.
Different studies have reported that people recover from jet lag symptoms after enough sleep, or after two thirds of the number of time zones crossed, or after a day for each time zone they crossed [
1,
9,
10]. However, in this study, results showed that both groups were not significantly impacted by jet lag but the authors observed a 25.7% increase in sway velocity in Group 2 between the pre-flight assessment and the 1st post-flight assessment. Another factor that may have affected the findings of this current study was the high dropout rate of 45%.
A limitation of this study was recruiting male participants only and allowing them to choose their group (sleep versus no sleep group) instead of randomly assigning them to either of the two groups. Other limitations include small sample size and lack of different age groups.
Aging is a factor that affects postural stability [
21]. Monk reported that older adults had more challenges than younger adults when recovering after being exposed to jet lag [
22]. The effect on postural stability was not significantly observed in this study population with a mean age of 27.68 years. Based on the studies mentioned earlier, older populations may be at higher risk of being affected by jet lag, start to develop more sway movements leading them to lose postural stability, and put them at higher risk of falling. Future studies examining the effect of jet lag on postural stability in older adults in both genders are recommended. Also, repeating this study using eastward travel direction with a larger sample size to determine if postural stability worsens.


