Article

Gait Cycle Monitoring System Based on Flexiforce Sensors

1
Department of Mechatronics Engineering, University of Jordan, Amman 11942, Jordan
2
Department of Mechanical Engineering, AlHussein Technical University, Amman 11942, Jordan
*
Author to whom correspondence should be addressed.
Inventions 2022, 7(3), 51; https://doi.org/10.3390/inventions7030051
Submission received: 30 April 2022 / Revised: 13 June 2022 / Accepted: 20 June 2022 / Published: 28 June 2022
(This article belongs to the Section Inventions and Innovation in Biotechnology and Materials)

Abstract

:
Medical technology companies have focused on gait analysis and monitoring for several years due to their importance in the diagnosis of various movement abnormalities. Studying pressure distribution on the foot is very important for the detection of abnormalities, unwanted symptoms, and consequences. This paper aims to design a wearable, low-cost, and real-time gait cycle monitoring system, based on a Flexiforce sensor. In the proposed design, eight force sensors were attached to the insole to estimate the pressure distribution on the foot. Pressure distribution monitoring helps in the estimation of foot disorders and assists in the design of medical shoes for manipulating pressure into the right positions. Sensors were connected to an appropriate microcontroller for real-time monitoring. MATLAB was used to visualize and simulate the real-time plantar pressure variation through static and dynamic states. The obtained experimental results show that the system was stable in both static and dynamic measurements, which could be used to estimate the pressure distribution on the foot.

1. Introduction

In recent years, several studies have shown the significant role of wearable electronics in improving human life [1,2,3,4]. Han et al. developed a flexible pressure sensor with outstanding performance through an extremely simple and cost-effective manufacturing process [5]. Another portable, thermoelectric generator with a novel double-chain configuration to simultaneously realize sustainable energy generation and multifunctional sensing was developed and tested in [6]. In addition, several studies have explored the use of wearable electronics in medical fields, especially for measuring pressure distribution on the foot. Pressure is defined as force per unit area, where there is a direct and deep relationship between force and surface pressure applied on the human foot. When a person is standing or walking, a force is exerted on their feet because of the surface pressure due to the weight of the body. From a medical point of view, there are many injuries and diseases related to pressure exerted on the foot. Lower extremity deterioration usually happens due to extreme, repeated, and harmful movements during locomotion [7]. Therefore, it is very important to understand the natural distribution of pressure on different locations in the foot while standing, walking, and performing different exercises; this allows an instant comparison with gait values and an evaluation of whether they are normal or abnormal pressure values.
A lot of research has been conducted in order to measure the pressure between the foot and the shoe during different activities. As an example, a system was developed by Hausdorff et al. [8] to measure the pressure between the foot and the shoe during walking. The proposed system consisted of seven force-sensitive resistor sensors on the surface of each insole, and a graphic display on an IBM PC to collect and display data in real-time measurements. In this system, the load cell was used as a reference to calibrate the sensors; the output was sampled and formed into a several linear piecewise function to store it in a lookup table to compensate for the sensor non-linearity. The system provided two program options on the PC’s graphics display, including analog pressure versus time or foot pressures as real-time graphs. Another simple footswitch system was developed to provide accurate measures of the beginning and end of footfall times for sequential steps [8]. In this system, two force-sensitive resistors were fitted in the insole, where one sensor was taped under the toes, and the other sensor was located under the heel. This system was used as a means of distinguishing normal and pathologic gait. A wireless, in-shoe force system was used to measure the number of times footfall occurrence, the weight distribution, and the relative position of the center of pressure (COP) on each foot [9]. The data were obtained through four thick-film force sensors mounted in insoles transmitted to a receiver using a transmitter powered by a small battery fitted on the shoe.
During the past few years, there has been a growing interest in developing plantar pressure measurement systems for different applications. In 2010, an in-shoe plantar pressure measurement system was developed to calculate parameters such as mean pressure, peak pressure, COP, and shift speed of COP with real-time display and analysis software. The system consisted of a fabric pressure sensing array, the Bluetooth module, and microcontroller PIC18F452. The system communicated with the insole wirelessly through a Bluetooth path in three incorporated configuration modes to communicate with a desktop, laptop, or smartphone [10]. Lmaizumi et al. [11] evaluated the foot arch type by foot plantar pressure distribution data, which is another model that includes the concept of energy harvesting as a result from walking or running activities, introduced in 2014. This was an in-shoe plantar pressure measurement system without the need for an external power supply. The insole consisted of piezoelectric transducers and six force pressure sensors [12].
The research trend in biomedical monitoring is to design systems for continued, daily measurement of real-life parameters, which is important for understanding the effect of daily activities—including running, walking, standing, and jumping—on the foot. The proposed system for such an application needs to be portable, compatible (i.e., easy to be placed in the shoe), and able to be measured effectively under different weather conditions. Recently, in medical application research, an Internet of Things (IoT)-based monitoring of foot pressure was designed to monitor pressure wirelessly using a force sensing resistor (FSR), then the output signal was manipulated by a microcontroller and sent via Bluetooth to a mobile phone with the help of IoT. When the output signal deviated from its normal value, a notification was be sent to a doctor for an immediate and appropriate action [13]. As an example, diabetic foot is associated with the neuropathy caused by diabetes; it causes ulceration of the foot and decreased sensation. Ulceration usually affects areas of high pressure under the foot. Therefore, researchers have been working on a continuous measurement system to diagnose and prevent diabetic foot. In 2018, an insole for diabetic foot prevention was developed. The developed system consisted of temperature and humidity sensors, pressure sensors, and a mobile application that allowed a diabetic patient to monitor foot pressure distribution in static and dynamic activities, so that a patient could be notified in the case of danger. In this system, all sensors communicated wirelessly and in real time using the mobile application via Bluetooth [14,15].
Therefore, due to the limitations in all previously mentioned methods for quantitative gait analysis, the proposed system in this paper is portable, compatible, and capable of taking measurements accurately in a variety of conditions.

2. Materials and Methods

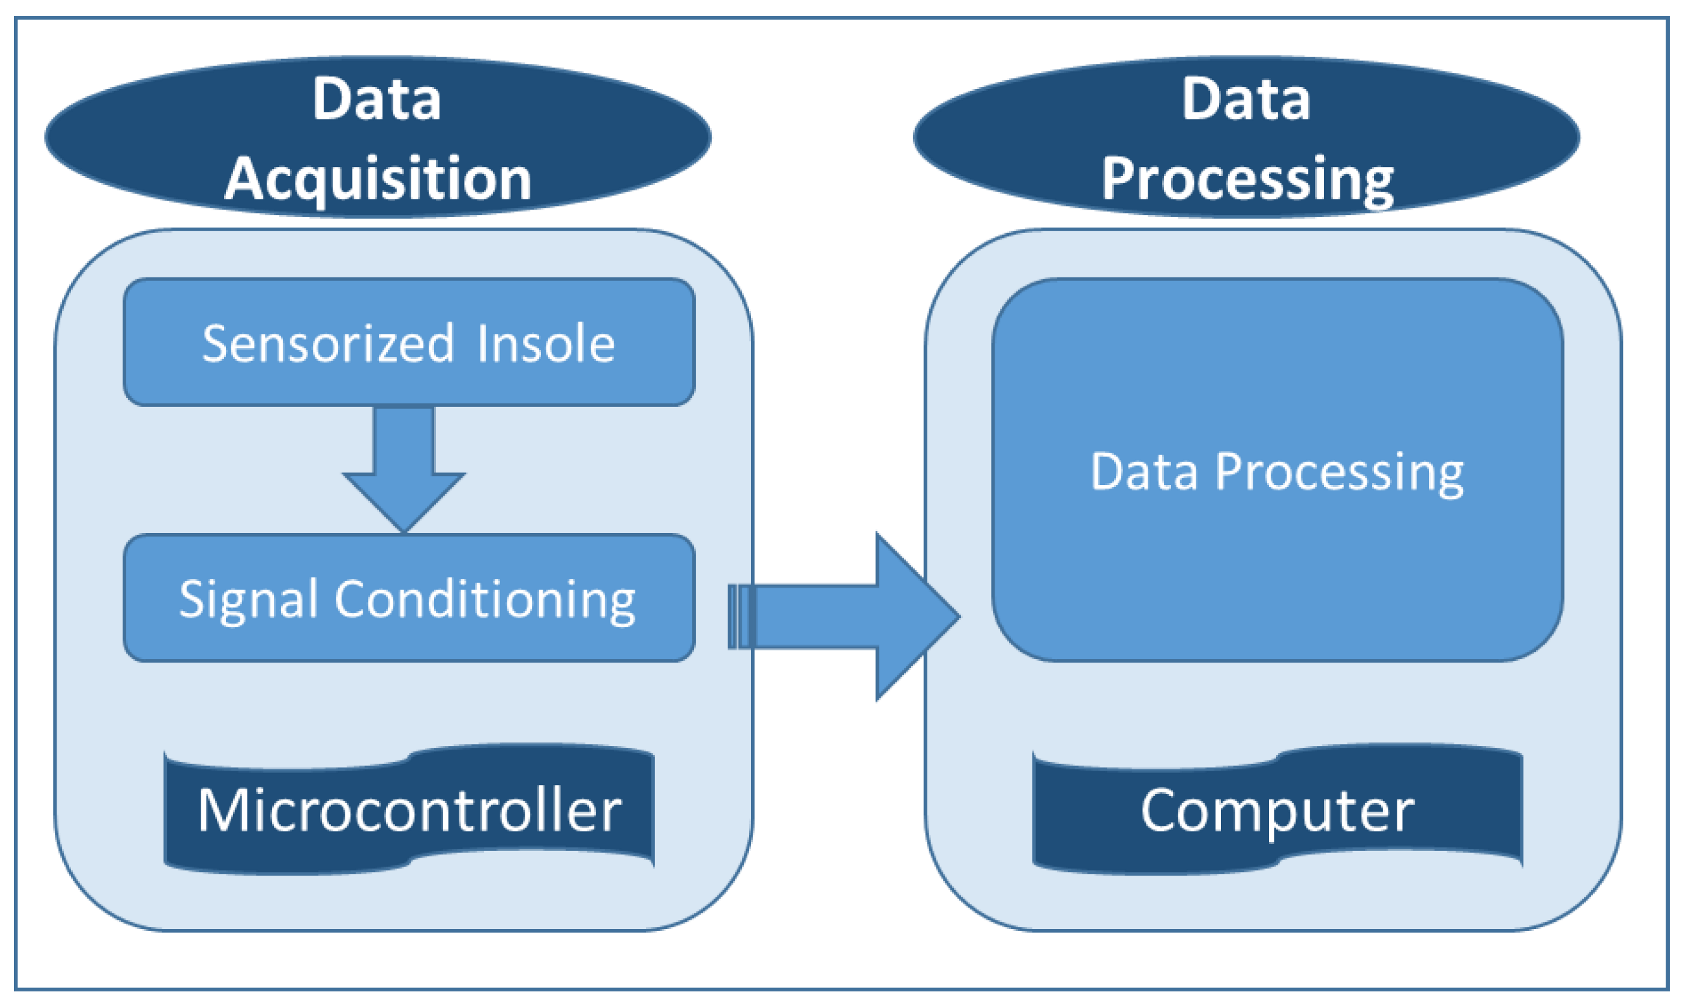
2.1. System Overview

The proposed system in this paper consists of two parts: data acquisition and data processing parts. The data acquisition included building a sensorized insole that was thin, flexible, and wearable inside the shoe with a tiny and portable electrical circuit circuit connected to Arduino Nano operated by Arduino IDE version 1.8.12, to obtain the data from the walking activity. On the other hand, in the data processing part, MATLAB 9.0 (R2016a) was used to visualize and simulate the collected data.
The gait cycle monitor system acquisition part was conducted using a microcontroller, which was divided into: the sensorized insole and signal conditioning, and the data processing part was done in the computer. The block diagram of the proposed system is presented in Figure 1.

2.2. Data Acquisition

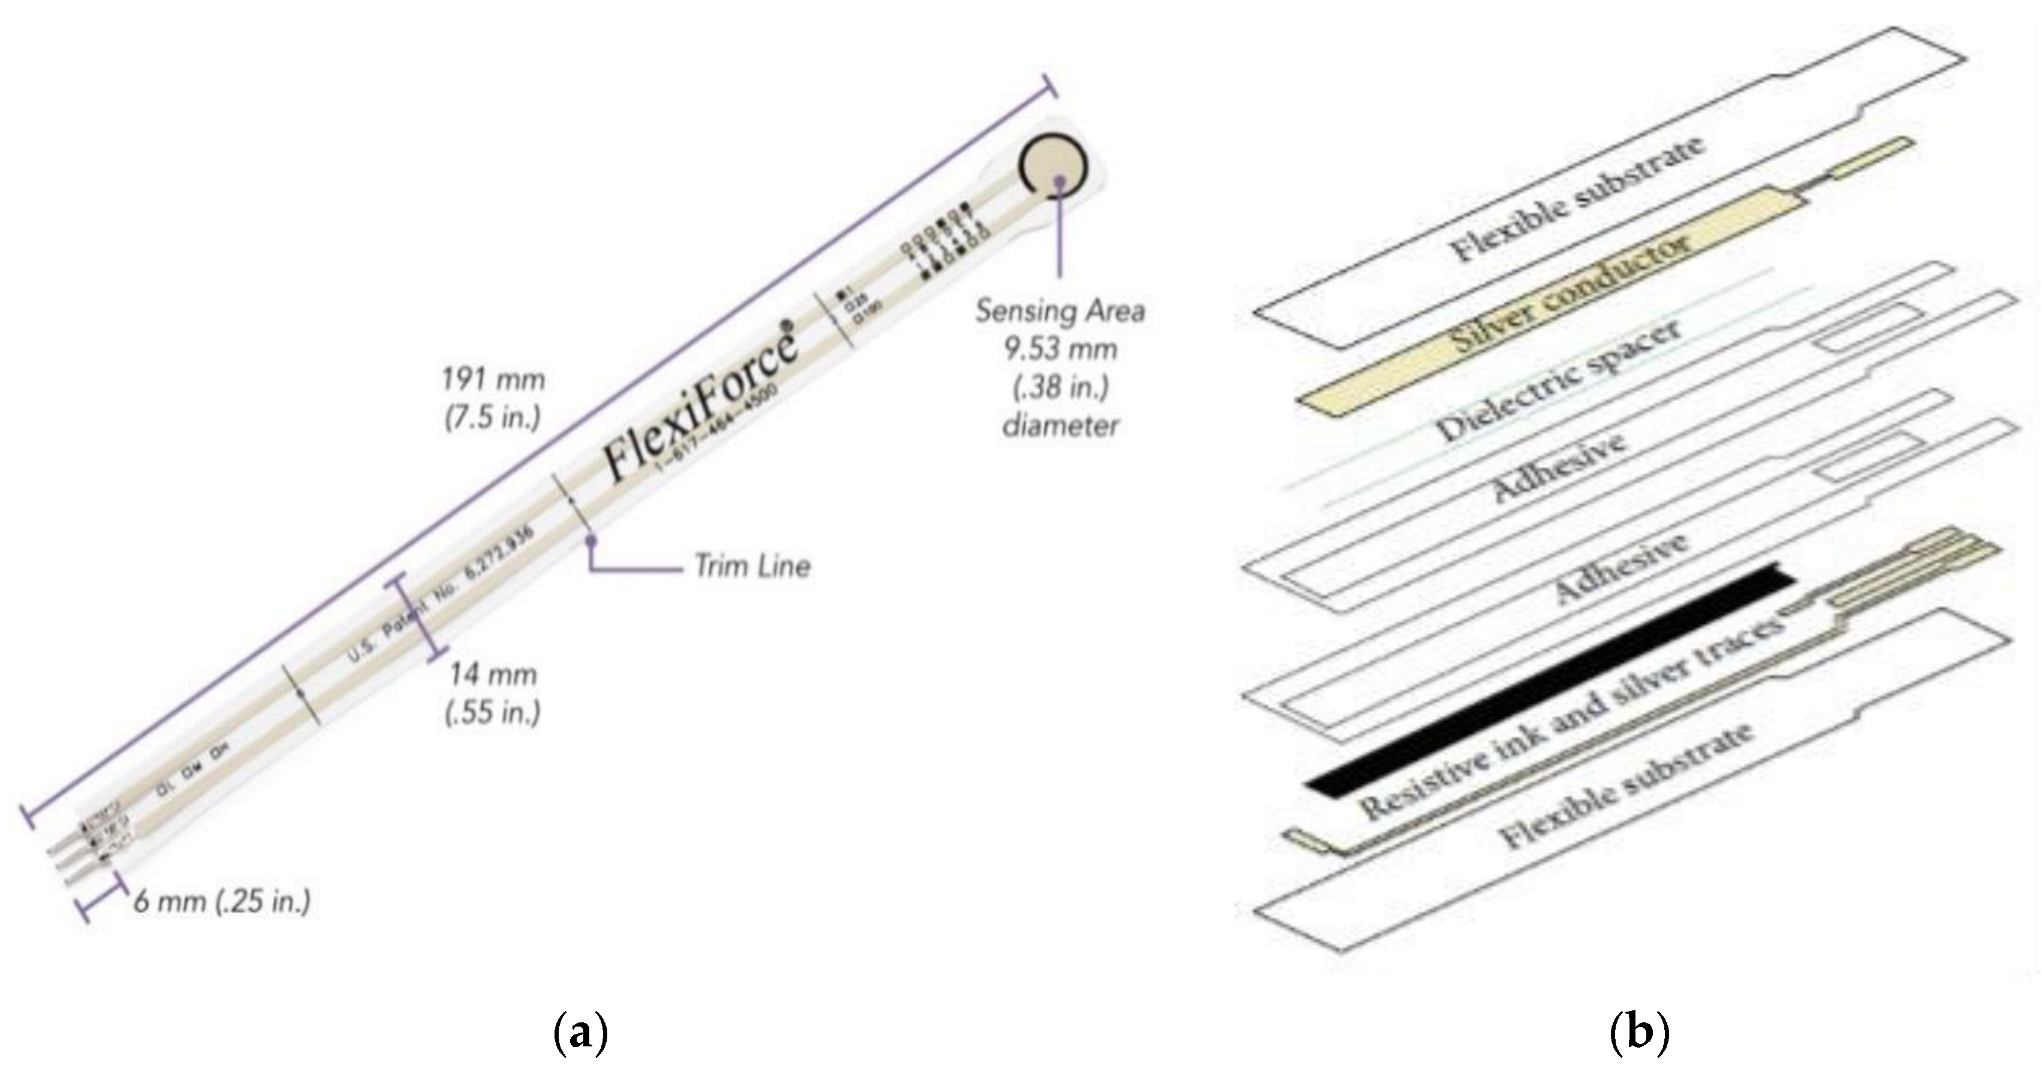
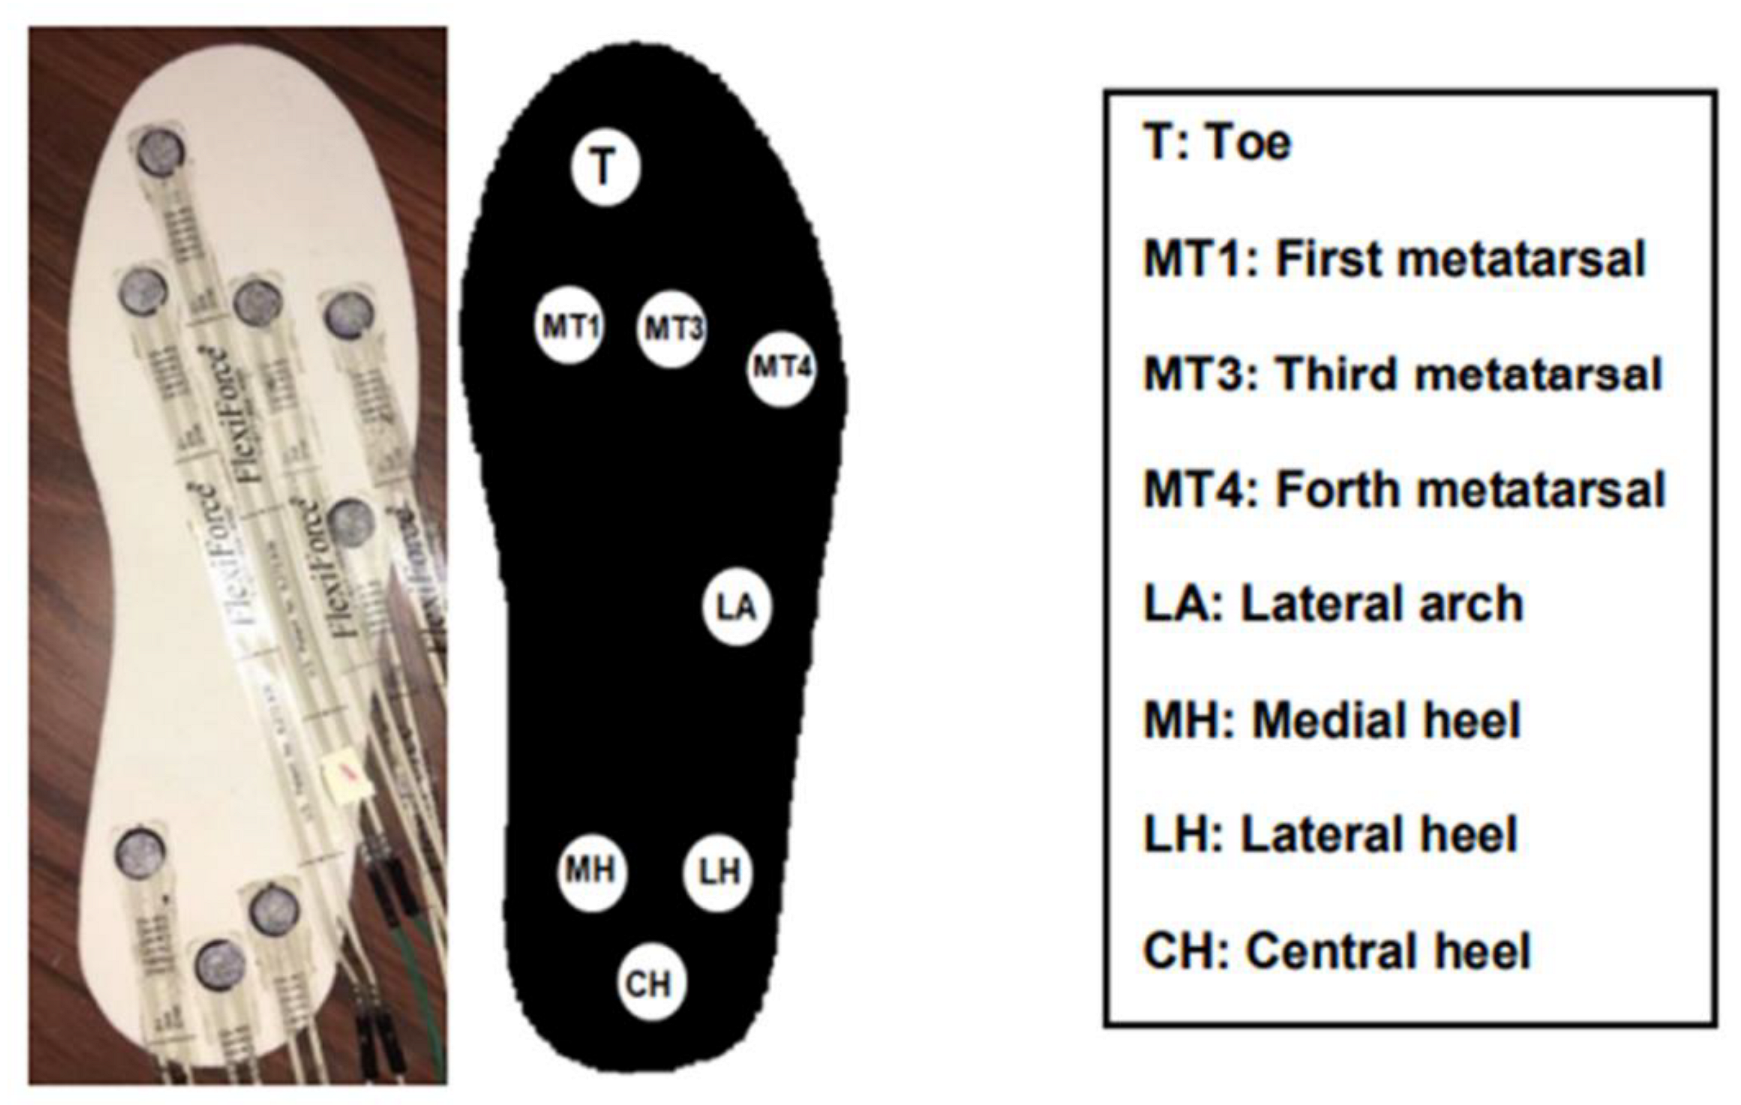
2.2.1. Sensorized Insole

The following design specifications were required in the selected sensor:
  • The sensitivity range of the applied force had to be suitable. During normal walking activity for most people, the plantars’ maximum bearing force would be around 100 kg and the contact area would be 2 cm × 1 cm [15]. The maximum bearing force should be greater while conducting heavy exercises or working with high-heeled shoes.
  • The selected sensor should be small in size, flexible and have very small thickness, to ensure the comfort of the insole wearer.
  • Finally, the sensor should be able to withstand high temperatures and humidity due to its location inside the shoe.
One of the most common sensors that meets the mentioned requirements is the FlexiForce sensor made by Tekscan. The sensor shown in Figure 2 has an excellent performance, a good response time, and low cost. A FlexiForce A201 is a thin and flexible piezo-resistive force sensor that can be used in various medical and engineering applications. The internal resistance of the sensor changes in a reverse manner with the applied force, as it decreases with the increase in the external applied force/pressure. In addition, it has a proper force sensitivity range and a thickness of 0.203 mm [16]. Typically, a FlexiForce device consists of two layers of a substrate made of polyester film, and a conductive material with silver added to each layer. Then, a pressure-sensitive layer of ink is used, followed by an adhesive material to attach the sensor layers together [17], as shown in Figure 2b.
One of the limitations for this sensor is its reliability; it relies on a pre-calibration method to deal with the force values. Due to the inherent part-to-part variation in FlexiForce sensors, the eight sensors were calibrated individually to achieve accurate results [16]. During the calibration, different known loads ranging from 0.5 kg to 20 kg were applied and the corresponding voltage values were recorded, as presented in Figure 3a. The steps were repeated several times; then, the average of the voltage values was taken in order to reduce the error. The relationship between applied force and output voltage was investigated. In addition, the FlexiForce resistance which was calculated from the voltage divider equation for the eight sensors was investigated and presented in Figure 3b.
After completing the calibration process, the eight sensors were attached to the insole using double-sided tape on eight different locations (as shown in Figure 4) that cover the largest area of the insole. This was done to provide the pressure distribution points with the best accuracy and results.

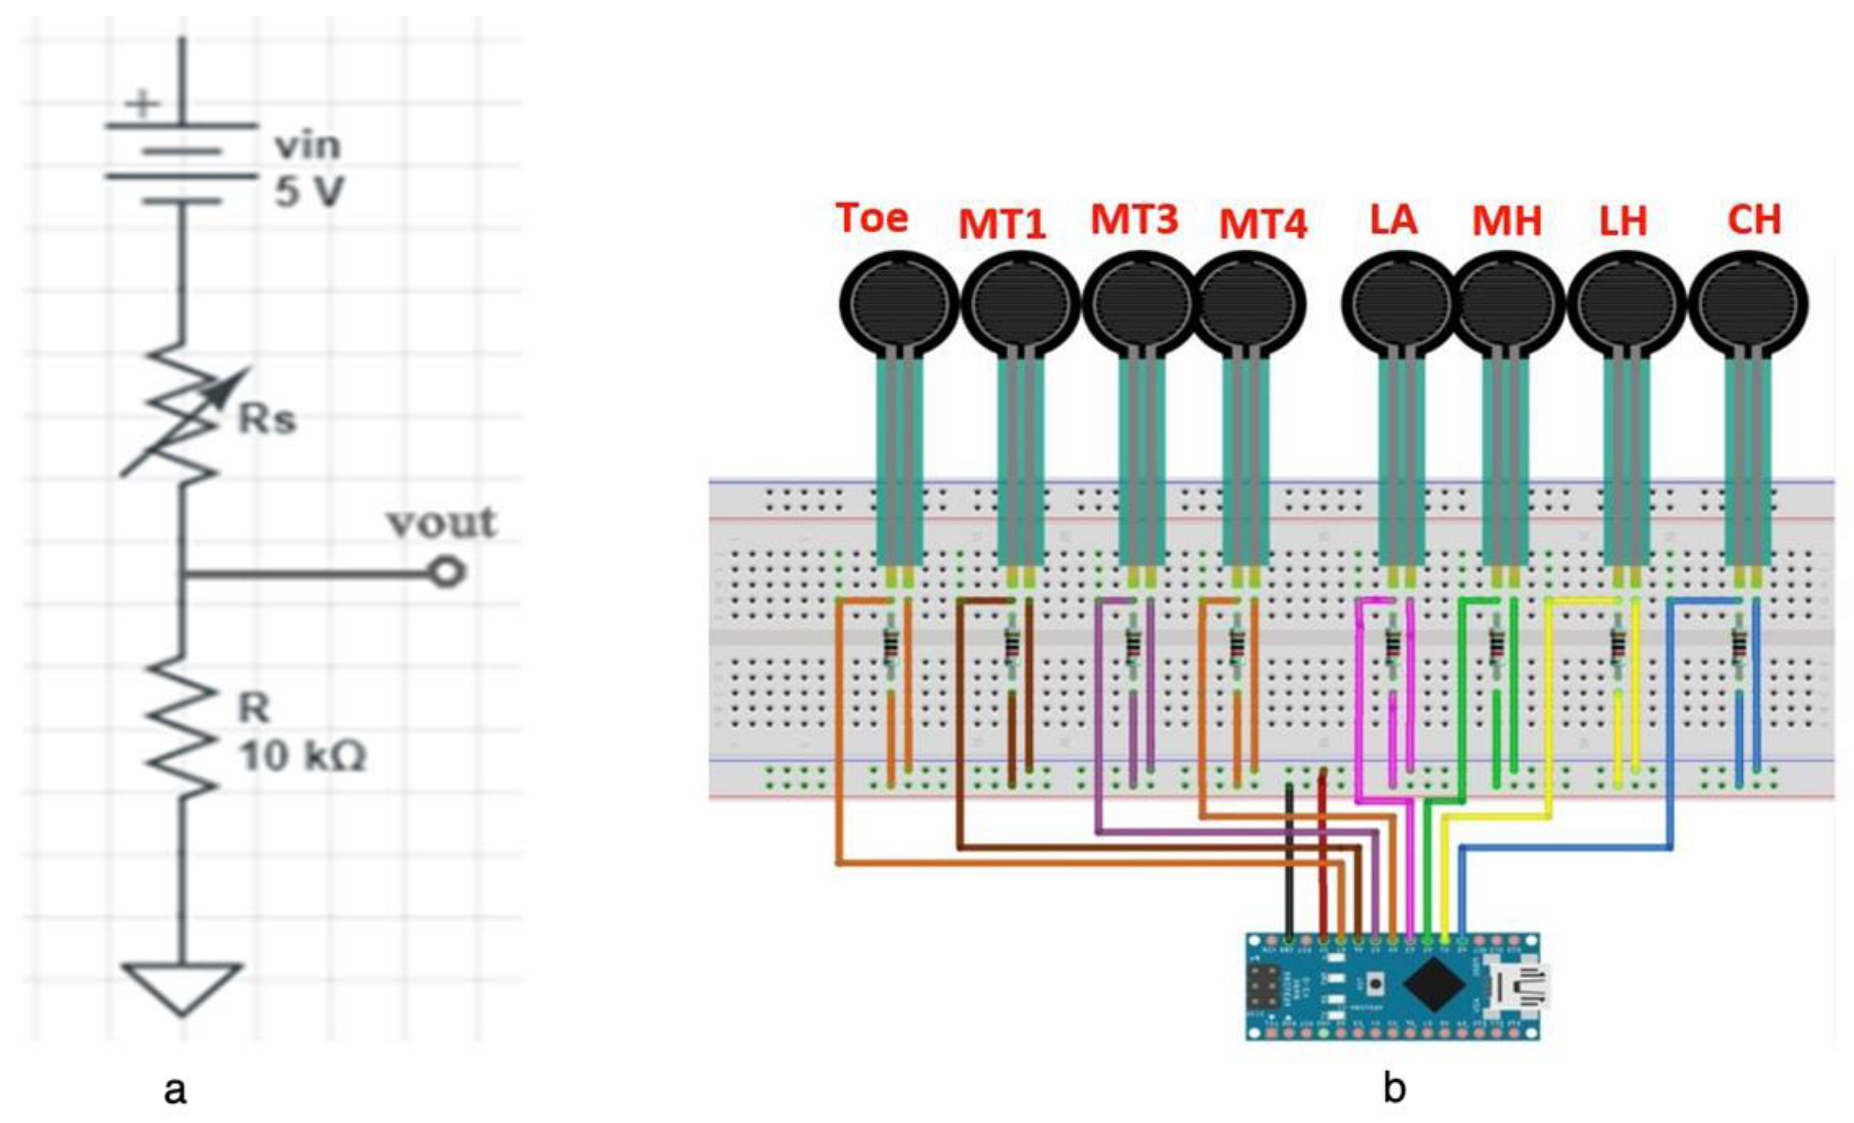
2.2.2. Signal Conditioning

For the signal conditioning process, the change in resistance in the Force Sensing Resistor FSR was converted via a signal condition voltage divider into a change in voltage that could be used as analog feedback signal into the microcontroller. The voltage divider configuration was used to measure the change in resistance according to the load change. Figure 5a illustrates the implemented circuit.
As presented in Figure 5, the output voltage increases with increasing force. If the Rs and R are swapped, the output voltage will decrease with increasing the applied force. The value of R was chosen to limit the current through the sensor, where the maximum rated current is up to 2.5 mA [18], and to maximize the required force sensitivity range. Figure 5b shows the diagram that illustrates the wiring connection of the sensors with an Arduino using the breadboard. The microcontroller which was chosen for the proposed system was the Arduino Nano based on Atmega328p, developed by Arduino.cc in Italy [19]. Arduino Nano is a tiny, flexible and compatible breadboard. It has the same functionality of Arduino UNO but in a more compatible, smaller size.

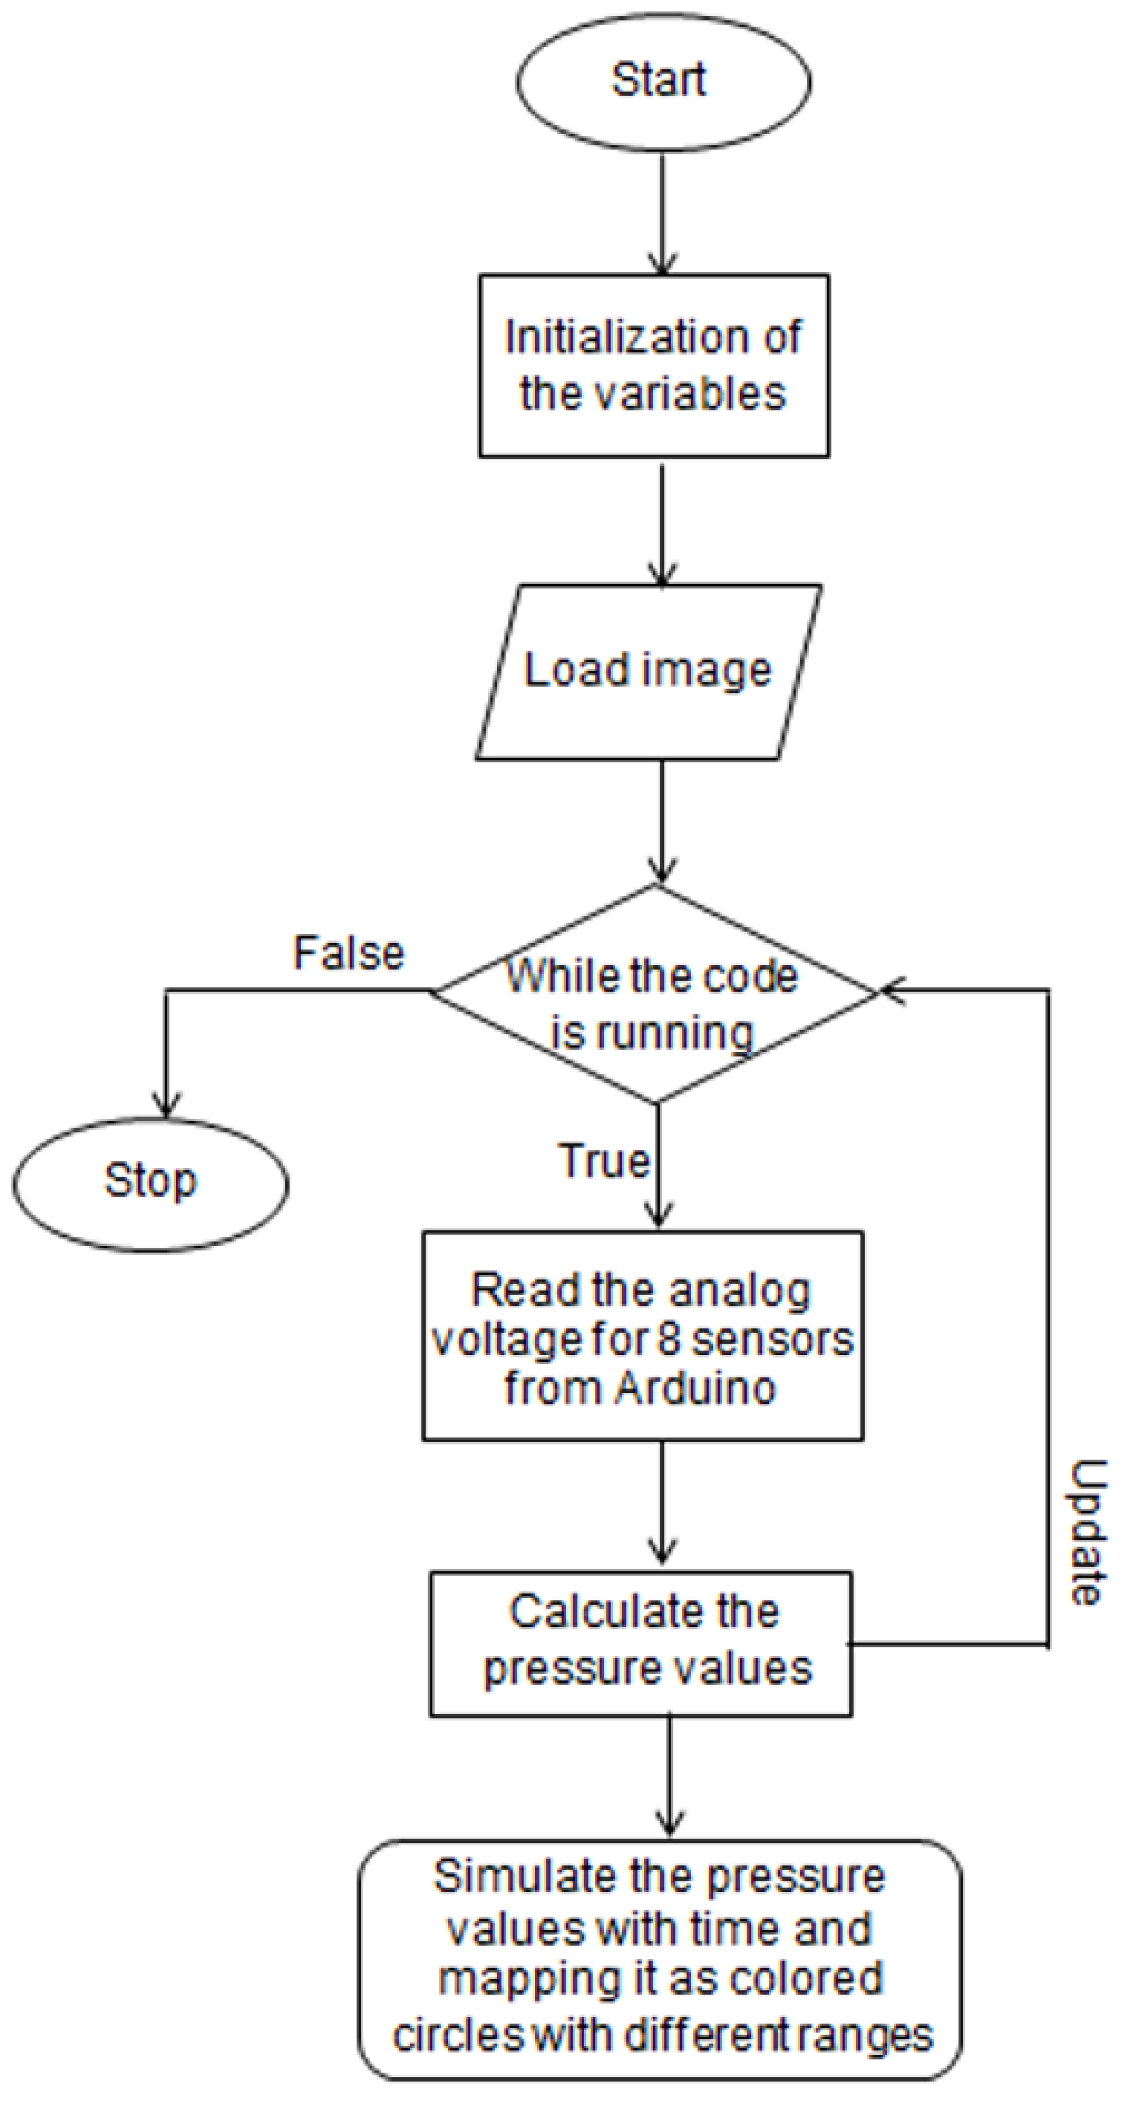
2.3. Data Processing

For the data processing, the transmitted analog voltage signals were converted to equivalent pressure signals by reading and processing the data. The Arduino Support package from the MATLAB Hardware Support online website was used to read data from the sensors. Thus, MATLAB was responsible for processing the data and storing it in a database; then, pressure values were calculated according to the following equation:
P   ( P a ) = F ( N ) A ( m 2 )
Subsequently, a color-based representation was used to visualize the real-time plantar pressure signals. A foot picture with eight circles representing the eight main pressure points in the foot was implemented, where the color of each circle varied from blue to red due to exposed pressure on that point. Also, the transition of pressure across the foot within the points of interest for different gait types was illustrated. The flowchart of MATLAB code that was used for data processing data is shown in Figure 6.

3. Results

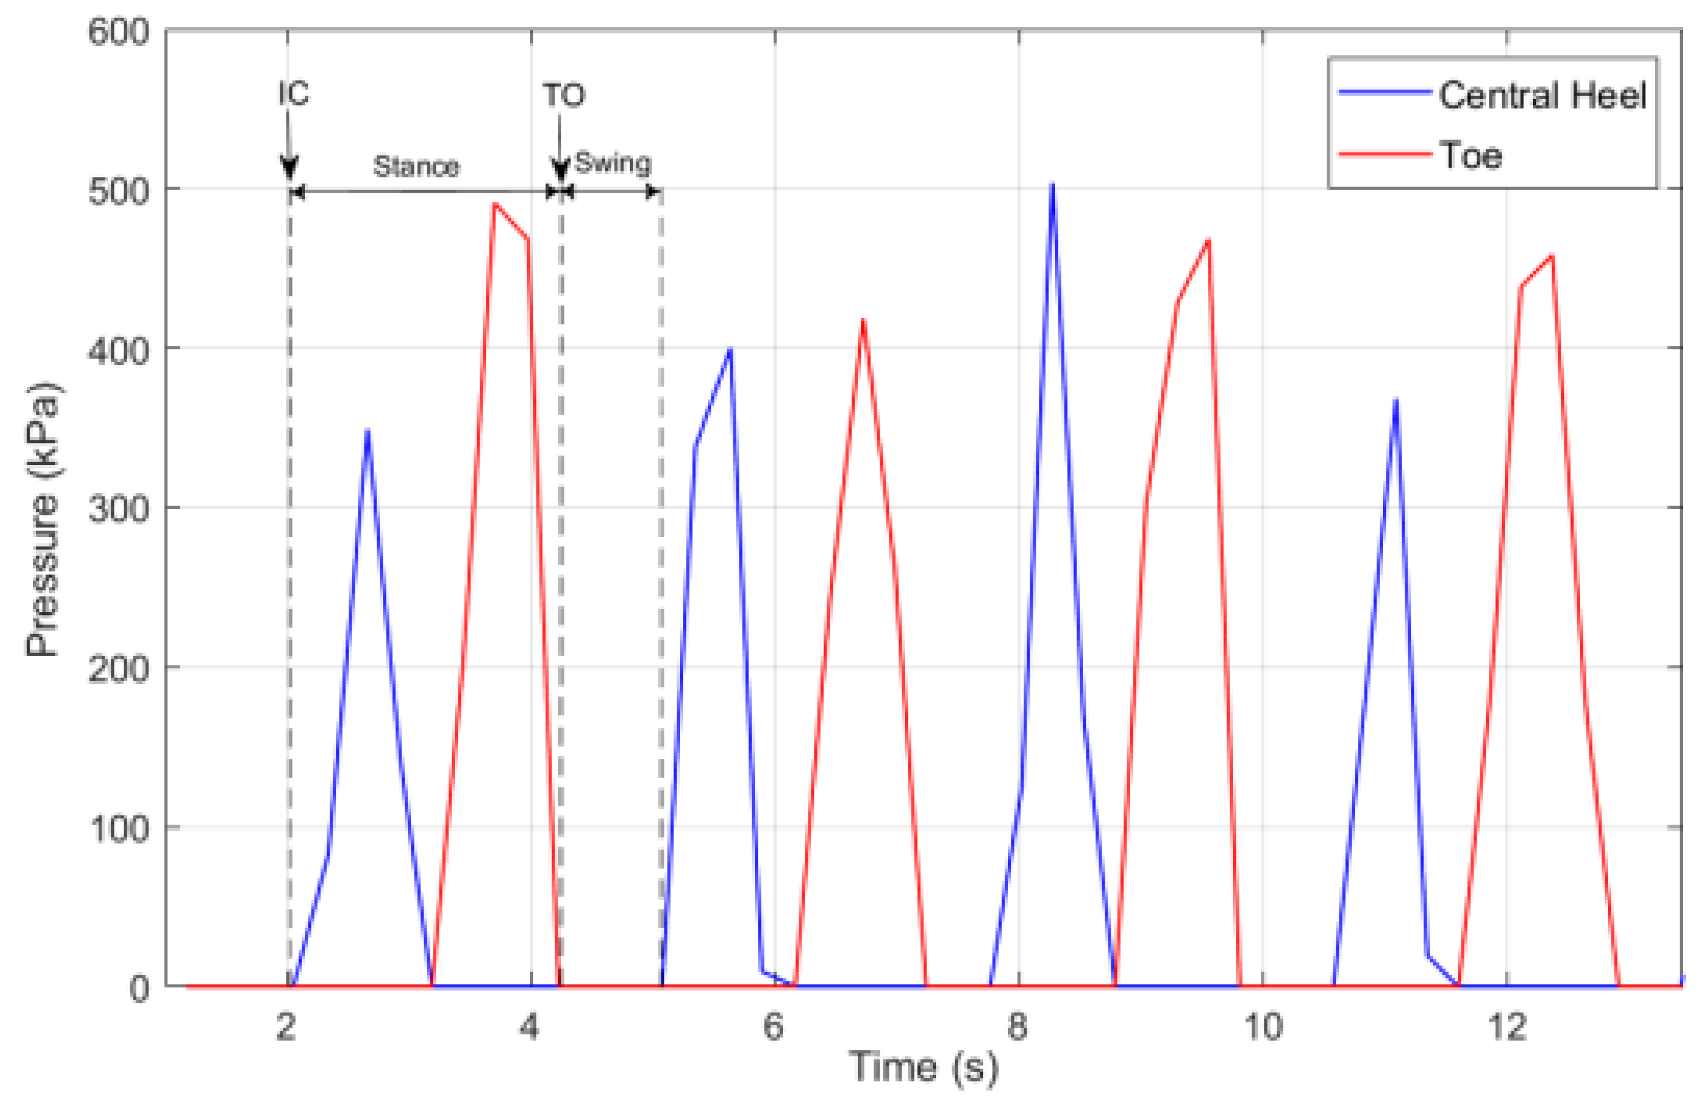
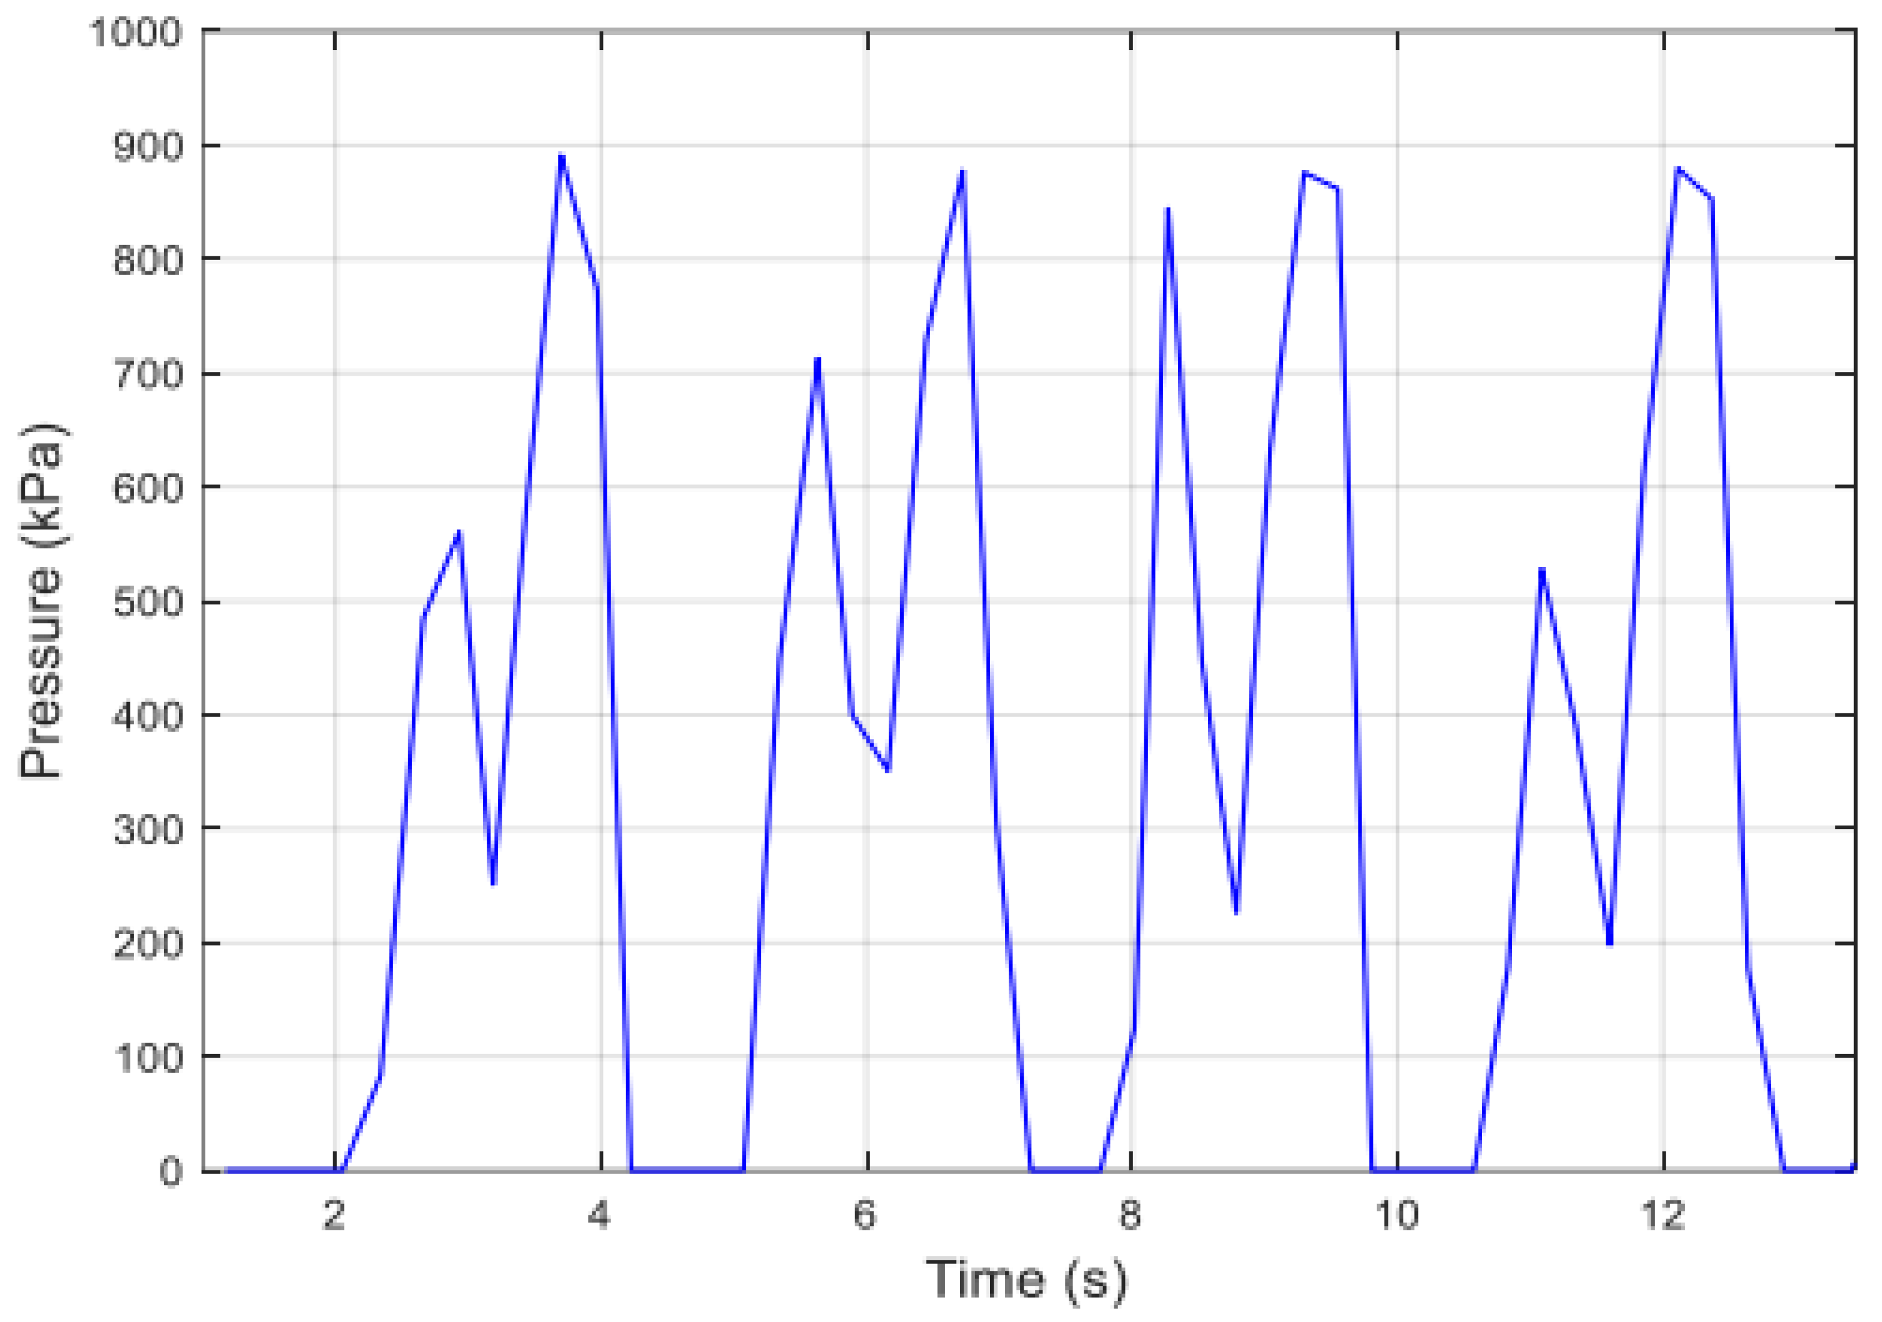
3.1. Gait Analysis Parameter Calculation

Very useful information could be extracted from the gait cycle measurement system. The experimental data obtained from clarifying plantar pressure distribution during the main events of the major phase (the stance phase) of the gait cycle are shown in Figure 7.
Figure 7a–e are the images obtained from a commercial pressure measurement device (Matscan system from Tekscan, Boston, MA, USA) [20]. Figure 7f–k are the images obtained using the proposed design. The pressure distribution maps displayed on the insole utilize the color range to represent fluctuations of pressure. The selected color range was between dark blue (lowest pressure) to dark red (highest pressure). In general, the bodyweight for individuals divided into two halves that spread evenly over two feet. In the standing position, the body weight will be evenly distributed over the foot and covered most areas of it, as shown in Figure 7f.
At the moment that the movement starts, the heel bone will strike the ground, which means that the weight will be anchored on the heel. The heel sensors will reach the highest value of pressure, around 500 KPa, which can be noted from Figure 7g. Subsequently, in the loading response (foot flat event), the whole bodyweight will be transferred to the reference foot, on which more force will be exerted. The heel still maintains a high pressure, so forefoot sensors will expose the increases in pressure. The pressure values were between [100–200] KPa, as shown in Figure 7h. The next event was the midstance, where the reference foot was in complete contact with the ground, so all the sensors were exposed to force. As can be noticed in Figure 7j, the range of rear foot differed from [150–300] KPa; on the other hand, the thumb toe reached around 400 KPa and the bone just below it a range of [100–250] KPa. At the event where the heel lifted off, all of the body weight was based on the toes, particularly the thumb toe, so it reached the maximum pressure 500 KPa, and the pressure of the region below it varied around 270 KPa and under, as shown in Figure 7k. This phase occurred in 30–50% of the total gait cycle, but does not indicate the end of the stance phase; the end of the stance phase is the toe-off event in which the reference foot toes rises and leaves the ground. It is worth mentioning that the sensor on the lateral arch did not experience any major pressure during the whole phases (stance phase), since the forefoot and heel are exposed to a much higher pressure than the mid-foot [21].
The two most important events to determine the switching between the stance and swing phases are the heel strike and toe-off events. The beginning of the stance phase and the end of the swing phase is determined by a heel strike at the end of the stance phase, and a toe-off at the beginning of the swing phase. A simple gait pattern is implemented by detecting these events, as shown in Figure 8. The time of the gait cycle is determined and defined as the time between two consecutive heel contacts of the same foot.
The percentage of gait stage is defined as the stage time over the total time of the gait cycle. The percentages of both the stance and swing stages are calculated by Equation (2).
S t a n c e   % = S t a n c e   t i m e   C y c l e   t i m e
S w i n g   % = S w i n g   t i m e   C y c l e   t i m e
To determine the phase’s ratios of the gait cycle, the average time of each stage was taken from several gait cycles. Through the equations, it was calculated that the stance stage accounted for 60.44% of the total gait cycle, while the swing phase accounted for the remaining 39.56% of the gait cycle.
The final gait pattern curve is known as the sum of the pressure at each point in one time and is shown in Figure 9. It shows the total pressure behavior on the foot during the stance phase.

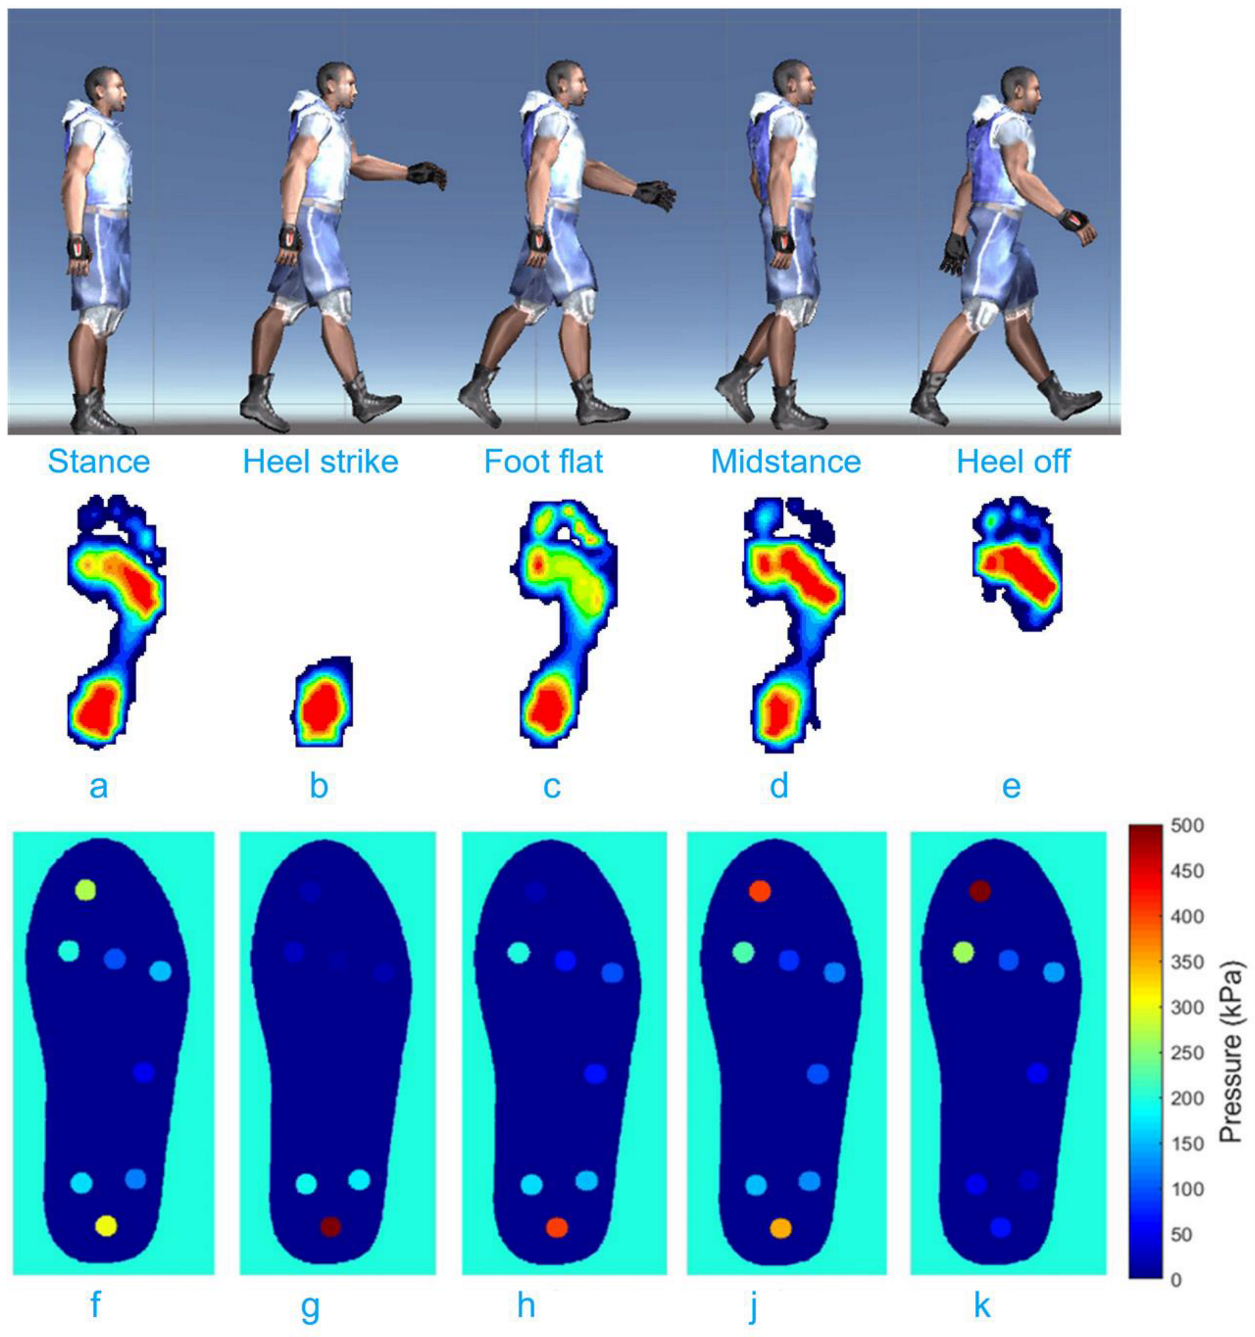
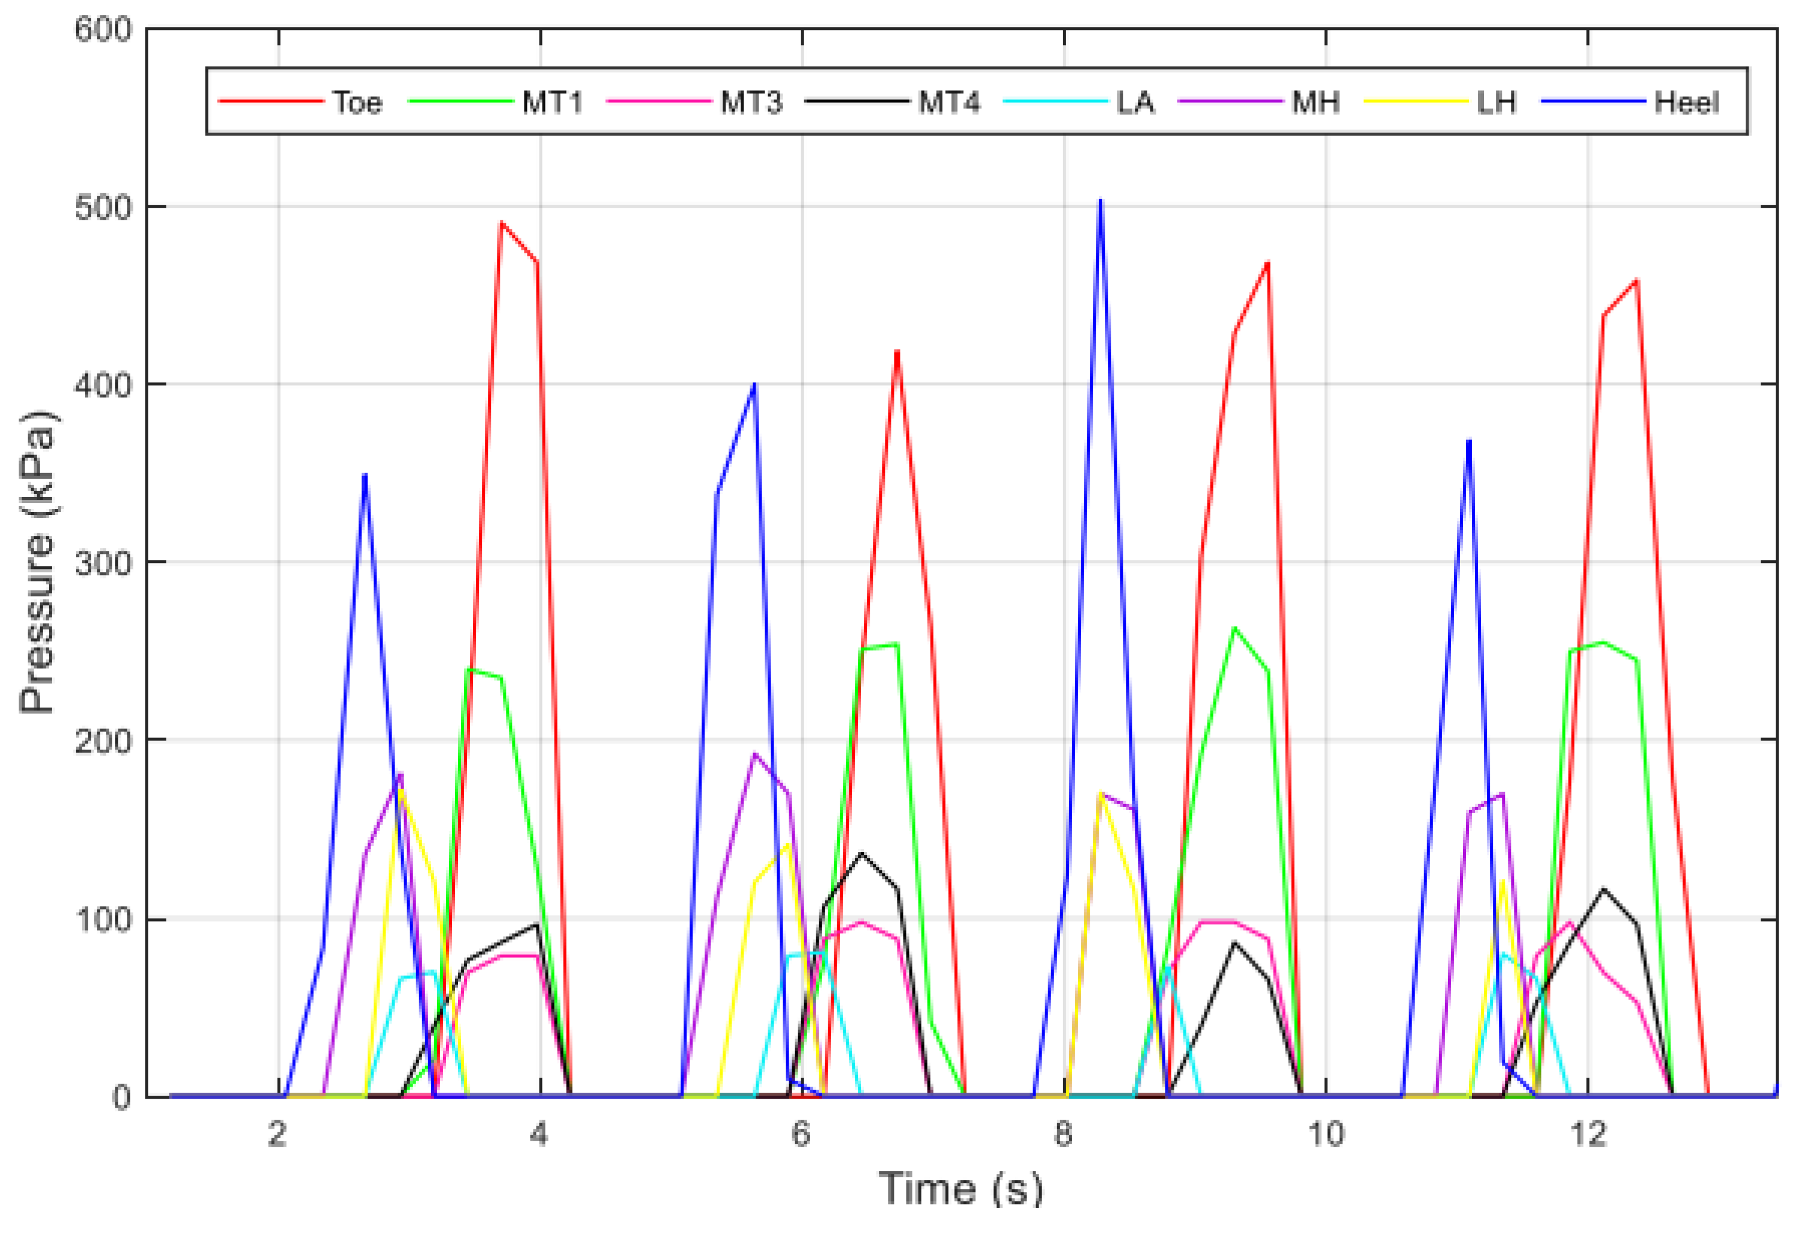
3.2. The Plantar Pressure Distribution Pattern

The plantar pressure pattern for the gait movement was obtained by the eight points, and the resulting plantar pressure curve was computed, as shown in Figure 10.
Foot plantar pressures were successfully detected while walking for four steps, and they were serialized as follows: the first sensor that was activated was located on heel when the heel began initial contact with the ground, thereby starting the standing phase of the gait walking cycle. The sensors located on the lateral heel and central heel were next to be activated. As the cycle evolved, the sensors located on lateral arch and first metatarsal were activated at the start of the foot-flat stage. Following the gait movement, sensors located on third metatarsal and fourth metatarsal had a stronger response at the mid-stance stage. Finally, the final sensor that was activated was located on the toe area at the toe-off moment, this is an indication that the stance phase has ended, and the swing phase of the gait cycle has begun.
Figure 11 shows the maximum pressure at each point for several cycles; as shown, the maximum values of pressure were at the toe and heel, and the minimum values of pressure were in the middle of the foot. This parameter is important for detecting any abnormalities of pressure distribution.

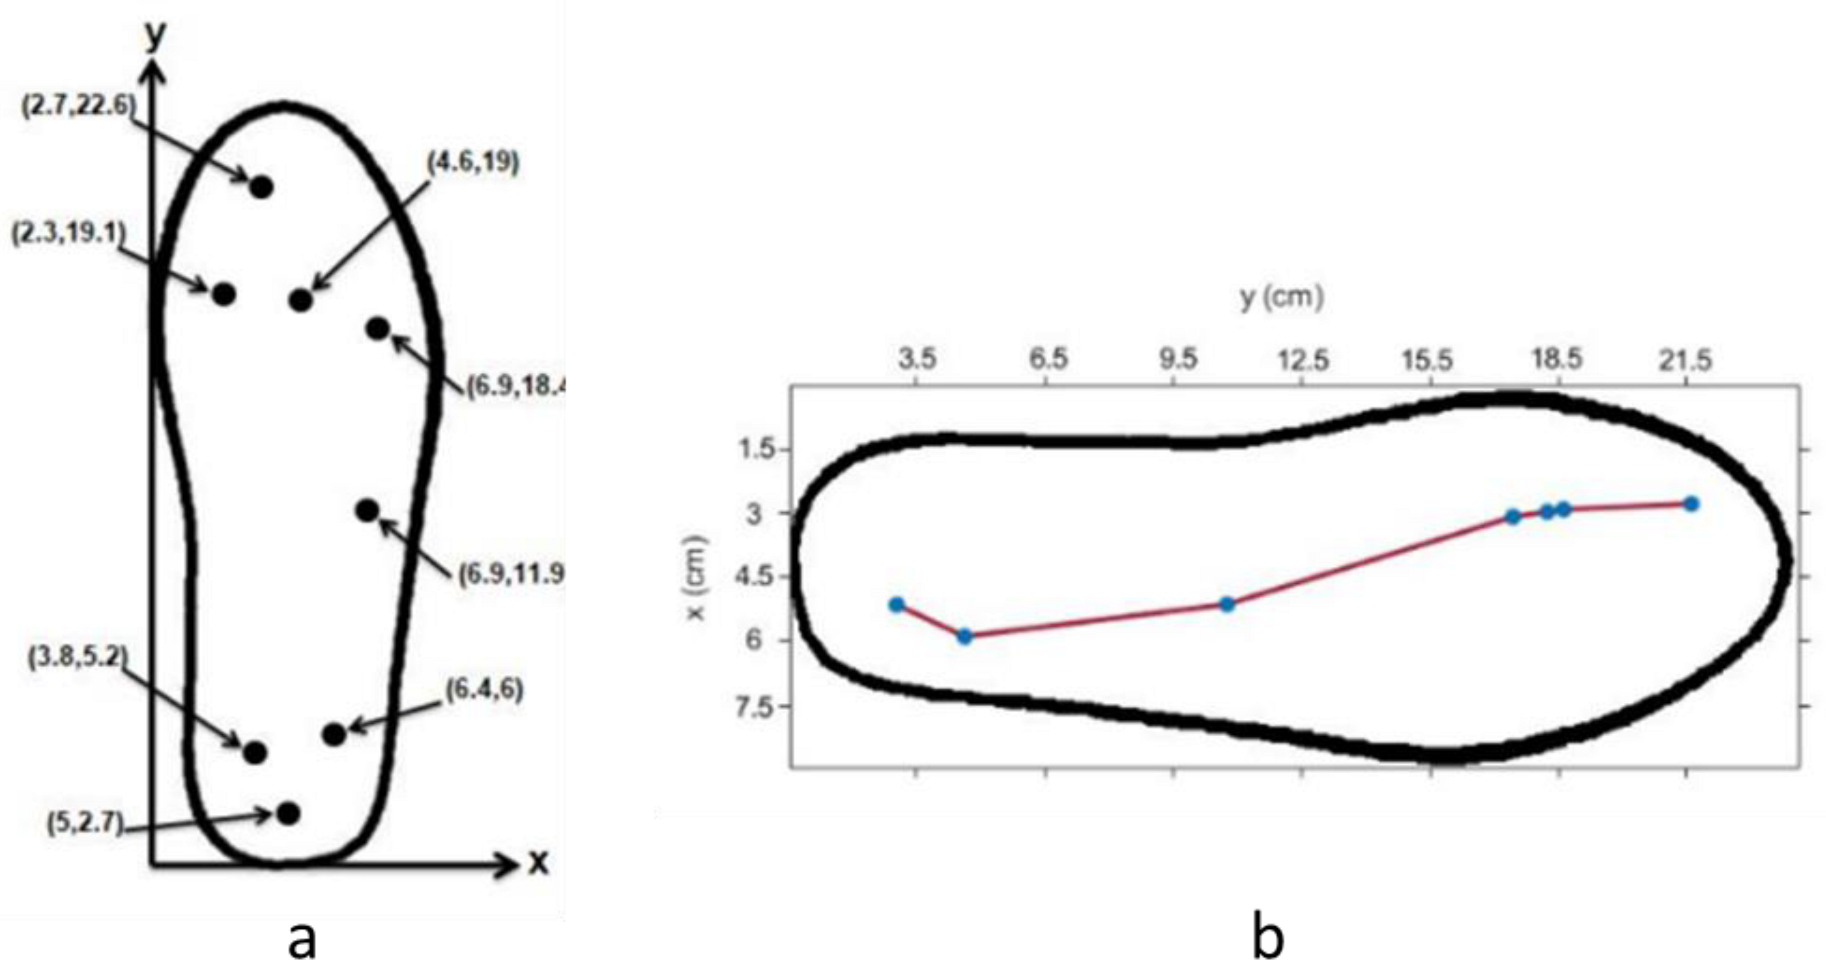
3.3. COP Trajectory Calculation

The general formula of the instantaneous position of COP is to take the measured pressure values for each sensor as a weighted average at each sample interval, as in Equation (3).
C O P X = i = 1 n P i X i i = 1 n P i
C O P Y = i = 1 n P i Y i i = 1 n P i
where (COPX, COPY) is the instantaneous position of the COP, Pi is the pressure measured by sensor I, (Xi, Yi) is the position of the center of sensor I, and n is the number of sensors.
To calculate COP, the positions of eight FlexiForce sensors were formatted to the Cartesian coordinate system, as shown in Figure 12a. These locations were strategically selected so that each location would give unique information about the gait cycle.
After applying Equation (3), we obtained the curve shown in Figure 12b, which illustrates the instantaneous displacement of the center of plantar pressure during the stance phase in the x-y coordinate plane.

4. Discussion

The overall system weight was 300 g. It was a flexible system due to the type of sensor used, which was thin and could be added easily to any shoe. In addition, it costs nearly 200 USD, which is much more affordable than other commercial devices. Using the proposed system, the plantar pressure values may be recorded and stored for several days, unlike other commercial systems. From the medical point of view, a patient could easily book an appointment to visit the doctor to review this medical data history and diagnosis, and then will be able to treat it.
One of the limitations for the proposed design is that the increase in the number of sensors has led to a low sampling rate. This means that fewer data are recorded per second, due to the transmission between MATLAB and the Arduino during the receipt of data through a serial port. However, this could be solved by using a higher baud rate.
If we increased the baud rate, we could increase the number of sensors used. The ideal number of sensors that could cover most of the human body and extract physiological, structural, and functional information for the whole body, based on human anatomy, is 15 [22]. However, we decided to use eight sensors that covered most of the foot area and the areas that are subjected to higher pressure during the normal activities of children and adults, such as walking and running. At the same time, the system is more user-friendly and less complicated. Therefore, our system attempted to strike a balance between the two points above.

5. Conclusions

The main objective of this research was to design a low-cost gait cycle monitoring system to capture changes in foot pressure at specific locations during different activities, such as walking. The system was built using discrete FlexiForce sensors, where eight sensors were fixed on the insole to acquire data that was stored and analyzed in a way that simulated reality.
As potential application for this research, the proposed system would reduce the need for almost daily patient visits to medical clinics, and would also enable a doctor to monitor and analyze patient data in cases of their absence from the medical center.

Author Contributions

Conceptualization, All; methodology, All; software, R.A., R.F. and L.S.; validation, R.A., R.F. and L.S.; formal analysis, M.A.M., M.A. and H.A.; investigation, All; resources, M.A.M., M.A. and H.A.; data curation, M.A.M., M.A. and H.A.; writing—original draft preparation, M.A.M., M.A. and H.A.; writing—review and editing, M.A.M.; visualization, All; supervision, M.A.M.; project administration, M.A.M., M.A. and H.A. All authors have read and agreed to the published version of the manuscript.

Funding

This Research received no external funding.

Institutional Review Board Statement

Not applicable.

Informed Consent Statement

Not applicable.

Data Availability Statement

Not applicable.

Conflicts of Interest

The authors declare no conflict of interest.

References

  1. Deng, H.-T.; Zhang, X.-R.; Wang, Z.-Y.; Wen, D.-L.; Ba, Y.-Y.; Kim, B.; Han, M.-D.; Zhang, H.-X.; Zhang, X.-S. Super-Stretchable Multi-Sensing Triboelectric Nanogenerator Based on Liquid Conductive Composite. Nano Energy 2021, 83, 105823. [Google Scholar] [CrossRef]
  2. Ba, Y.-Y.; Bao, J.-F.; Wang, Z.-Y.; Deng, H.-T.; Wen, D.-L.; Zhang, X.-R.; Tu, C.; Zhang, X.-S. Self-Powered Trajectory-Tracking Microsystem Based on Electrode-Miniaturized Triboelectric Nanogenerator. Nano Energy 2021, 82, 105730. [Google Scholar] [CrossRef]
  3. Liu, Y.; Khanbareh, H.; Halim, M.A.; Feeney, A.; Zhang, X.; Heidari, H.; Ghannam, R. Piezoelectric Energy Harvesting for Self-Powered Wearable Upper Limb Applications. Nano Sel. 2021, 2, 1459–1479. [Google Scholar] [CrossRef]
  4. Wen, D.-L.; Sun, D.-H.; Huang, P.; Huang, W.; Su, M.; Wang, Y.; Han, M.-D.; Kim, B.; Brugger, J.; Zhang, H.-X.; et al. Recent Progress in Silk Fibroin-Based Flexible Electronics. Microsyst. Nanoeng. 2021, 7, 35. [Google Scholar] [CrossRef] [PubMed]
  5. Han, Z.; Li, H.; Xiao, J.; Song, H.; Li, B.; Cai, S.; Chen, Y.; Ma, Y.; Feng, X. Ultralow-Cost, Highly Sensitive, and Flexible Pressure Sensors Based on Carbon Black and Airlaid Paper for Wearable Electronics. ACS Appl. Mater. Interfaces 2019, 11, 33370–33379. [Google Scholar] [CrossRef] [PubMed]
  6. Wen, D.-L.; Deng, H.-T.; Liu, X.; Li, G.-K.; Zhang, X.-R.; Zhang, X.-S. Wearable Multi-Sensing Double-Chain Thermoelectric Generator. Microsyst. Nanoeng. 2020, 6, 68. [Google Scholar] [CrossRef] [PubMed]
  7. Albensi, R.J.; Nyland, J.; Caborn, D.N. The Relationship of Body Weight and Clinical Foot and Ankle Measurements to the Heel Forces of Forward and Backward Walking. J. Athl. Train. 1999, 34, 328–333. [Google Scholar] [PubMed]
  8. Hausdorff, J.M.; Ladin, Z.; Wei, J.Y. Footswitch System for Measurement of the Temporal Parameters of Gait. J. Biomech. 1995, 28, 347–351. [Google Scholar] [CrossRef]
  9. Lawrence, T.L.; Schmidt, R.N. Wireless In-Shoe Force System [for Motor Prosthesis]. In Proceedings of the 19th Annual International Conference of the IEEE Engineering in Medicine and Biology Society. “Magnificent Milestones and Emerging Opportunities in Medical Engineering” (Cat. No.97CH36136), Chicago, IL, USA, 30 October–2 November 1997; IEEE: Piscataway, NJ, USA, 2002; Volume 5, pp. 2238–2241. [Google Scholar]
  10. Shu, L.; Hua, T.; Wang, Y.; Li, Q.; Feng, D.D.; Tao, X. In-Shoe Plantar Pressure Measurement and Analysis System Based on Fabric Pressure Sensing Array. IEEE Trans. Inf. Technol. Biomed. 2010, 14, 767–775. [Google Scholar] [CrossRef] [PubMed] [Green Version]
  11. Imaizumi, K.; Iwakami, Y.; Yamashita, K. Analysis of Foot Pressure Distribution Data for the Evaluation of Foot Arch Type. In Proceedings of the 2011 Annual International Conference of the IEE Engineering in Medicine and Biology Society, Boston, MA, USA, 30 August–3 September 2011; Volume 2011, pp. 7388–7392. [Google Scholar] [CrossRef]
  12. Meier, R.; Kelly, N.; Almog, O.; Chiang, P. A Piezoelectric Energy-Harvesting Shoe System for Podiatric Sensing. In Proceedings of the 2014 36th Annual International Conference of the IEEE Engineering in Medicine and Biology Society, Chicago, IL, USA, 26–30 August 2014; Volume 2014, pp. 622–625. [Google Scholar] [CrossRef]
  13. Malvade, P.S.; Joshi, A.K.; Madhe, S.P. IoT Based Monitoring of Foot Pressure Using FSR Sensor. In Proceedings of the 2017 International Conference on Communication and Signal Processing (ICCSP), Melmaruvathur, India, 6–8 April 2017; IEEE: Piscataway, NJ, USA, 2017; pp. 0635–0639. [Google Scholar]
  14. Bencheikh, M.A.; Boukhenous, S. A Low Cost Smart Insole for Diabetic Foot Prevention. In Proceedings of the 2018 International Conference on Applied Smart Systems (ICASS), Médéa, Algeria, 24–25 November 2018; IEEE: Piscataway, NJ, USA, 2018; pp. 1–4. [Google Scholar]
  15. Qihang, W.; Wenlian, L.; Zuyun, F. A new system for foot pressure measurement and gait analysis. Chin. J. Biomed. Eng. 2000, 19, 32–40. [Google Scholar]
  16. FlexiForce A201 Sensor. Tekscan. Available online: https://www.tekscan.com/products-solutions/force-sensors/a201 (accessed on 12 June 2022).
  17. Almassri, A.M.; Wan Hasan, W.Z.; Ahmad, S.A.; Ishak, A.J.; Ghazali, A.M.; Talib, D.N.; Wada, C. Pressure Sensor: State of the Art, Design, and Application for Robotic Hand. J. Sens. 2015, 2015, 846487. [Google Scholar] [CrossRef] [Green Version]
  18. Tiberio, D. Pathomechanics of Structural Foot Deformities. Phys. Ther. 1988, 68, 1840–1849. [Google Scholar] [CrossRef] [PubMed] [Green Version]
  19. Arduino Nano. Arduino Online Shop. Available online: https://store-usa.arduino.cc/products/arduino-nano?selectedStore=us (accessed on 12 June 2022).
  20. Lou, C.; Wang, S.; Liang, T.; Pang, C.; Huang, L.; Run, M.; Liu, X. A Graphene-Based Flexible Pressure Sensor with Applications to Plantar Pressure Measurement and Gait Analysis. Materials 2017, 10, 1068. [Google Scholar] [CrossRef] [PubMed]
  21. Van Deursen, R. Mechanical Loading and Off-Loading of the Plantar Surface of the Diabetic Foot. Clin. Infect. Dis. 2004, 39 (Suppl. 2), S87–S91. [Google Scholar] [CrossRef] [PubMed]
  22. Razak, A.H.A.; Zayegh, A.; Begg, R.K.; Wahab, Y. Foot Plantar Pressure Measurement System: A Review. Sensors 2012, 12, 9884–9912. [Google Scholar] [CrossRef] [PubMed] [Green Version]
Figure 1. The block diagram of the Gait Cycle Monitoring System.
Inventions 07 00051 g001
Figure 2. The FlexiForce (a) A201 unit (b) Components of the FlexiForce sensor [16].
Inventions 07 00051 g002
Figure 3. The calibration process (a) FlexiForce with weights for calibration (b) The relationship between the force values with the output voltage values and FlexiForce resistance values.
Inventions 07 00051 g003
Figure 4. The exact locations of the sensors on the insole.
Inventions 07 00051 g004
Figure 5. The signal conditioning (a) the electrical circuit for the sensor (b) the wiring diagram.
Inventions 07 00051 g005
Figure 6. The flowchart of the MATLAB code that was used for data processing.
Inventions 07 00051 g006
Figure 7. Plantar pressure distribution of the right foot during the main phase of one complete gait cycle. (ae) reference images by a commercial pressure measurement device. (fk) images obtained by the proposed design.
Inventions 07 00051 g007
Figure 8. IC and TO were detected to separate the stance and swing phases.
Inventions 07 00051 g008
Figure 9. The final gait pattern curve.
Inventions 07 00051 g009
Figure 10. Real-time monitoring of the foot plantar pressure distribution during walking.
Inventions 07 00051 g010
Figure 11. Peak planter pressure for each point.
Inventions 07 00051 g011
Figure 12. COP calculations (a) The positions of eight sensors in the Cartesian coordinate system (b) The instantaneous displacement of the center of plantar pressure during the stance phase.
Inventions 07 00051 g012
Publisher’s Note: MDPI stays neutral with regard to jurisdictional claims in published maps and institutional affiliations.

