
Estimation of the Tower Shape Effect on the Stress–Strain Behavior of Wind Turbines Operating under Offshore Boundary Conditions


Abstract
:1. Introduction
2. Materials and Methods
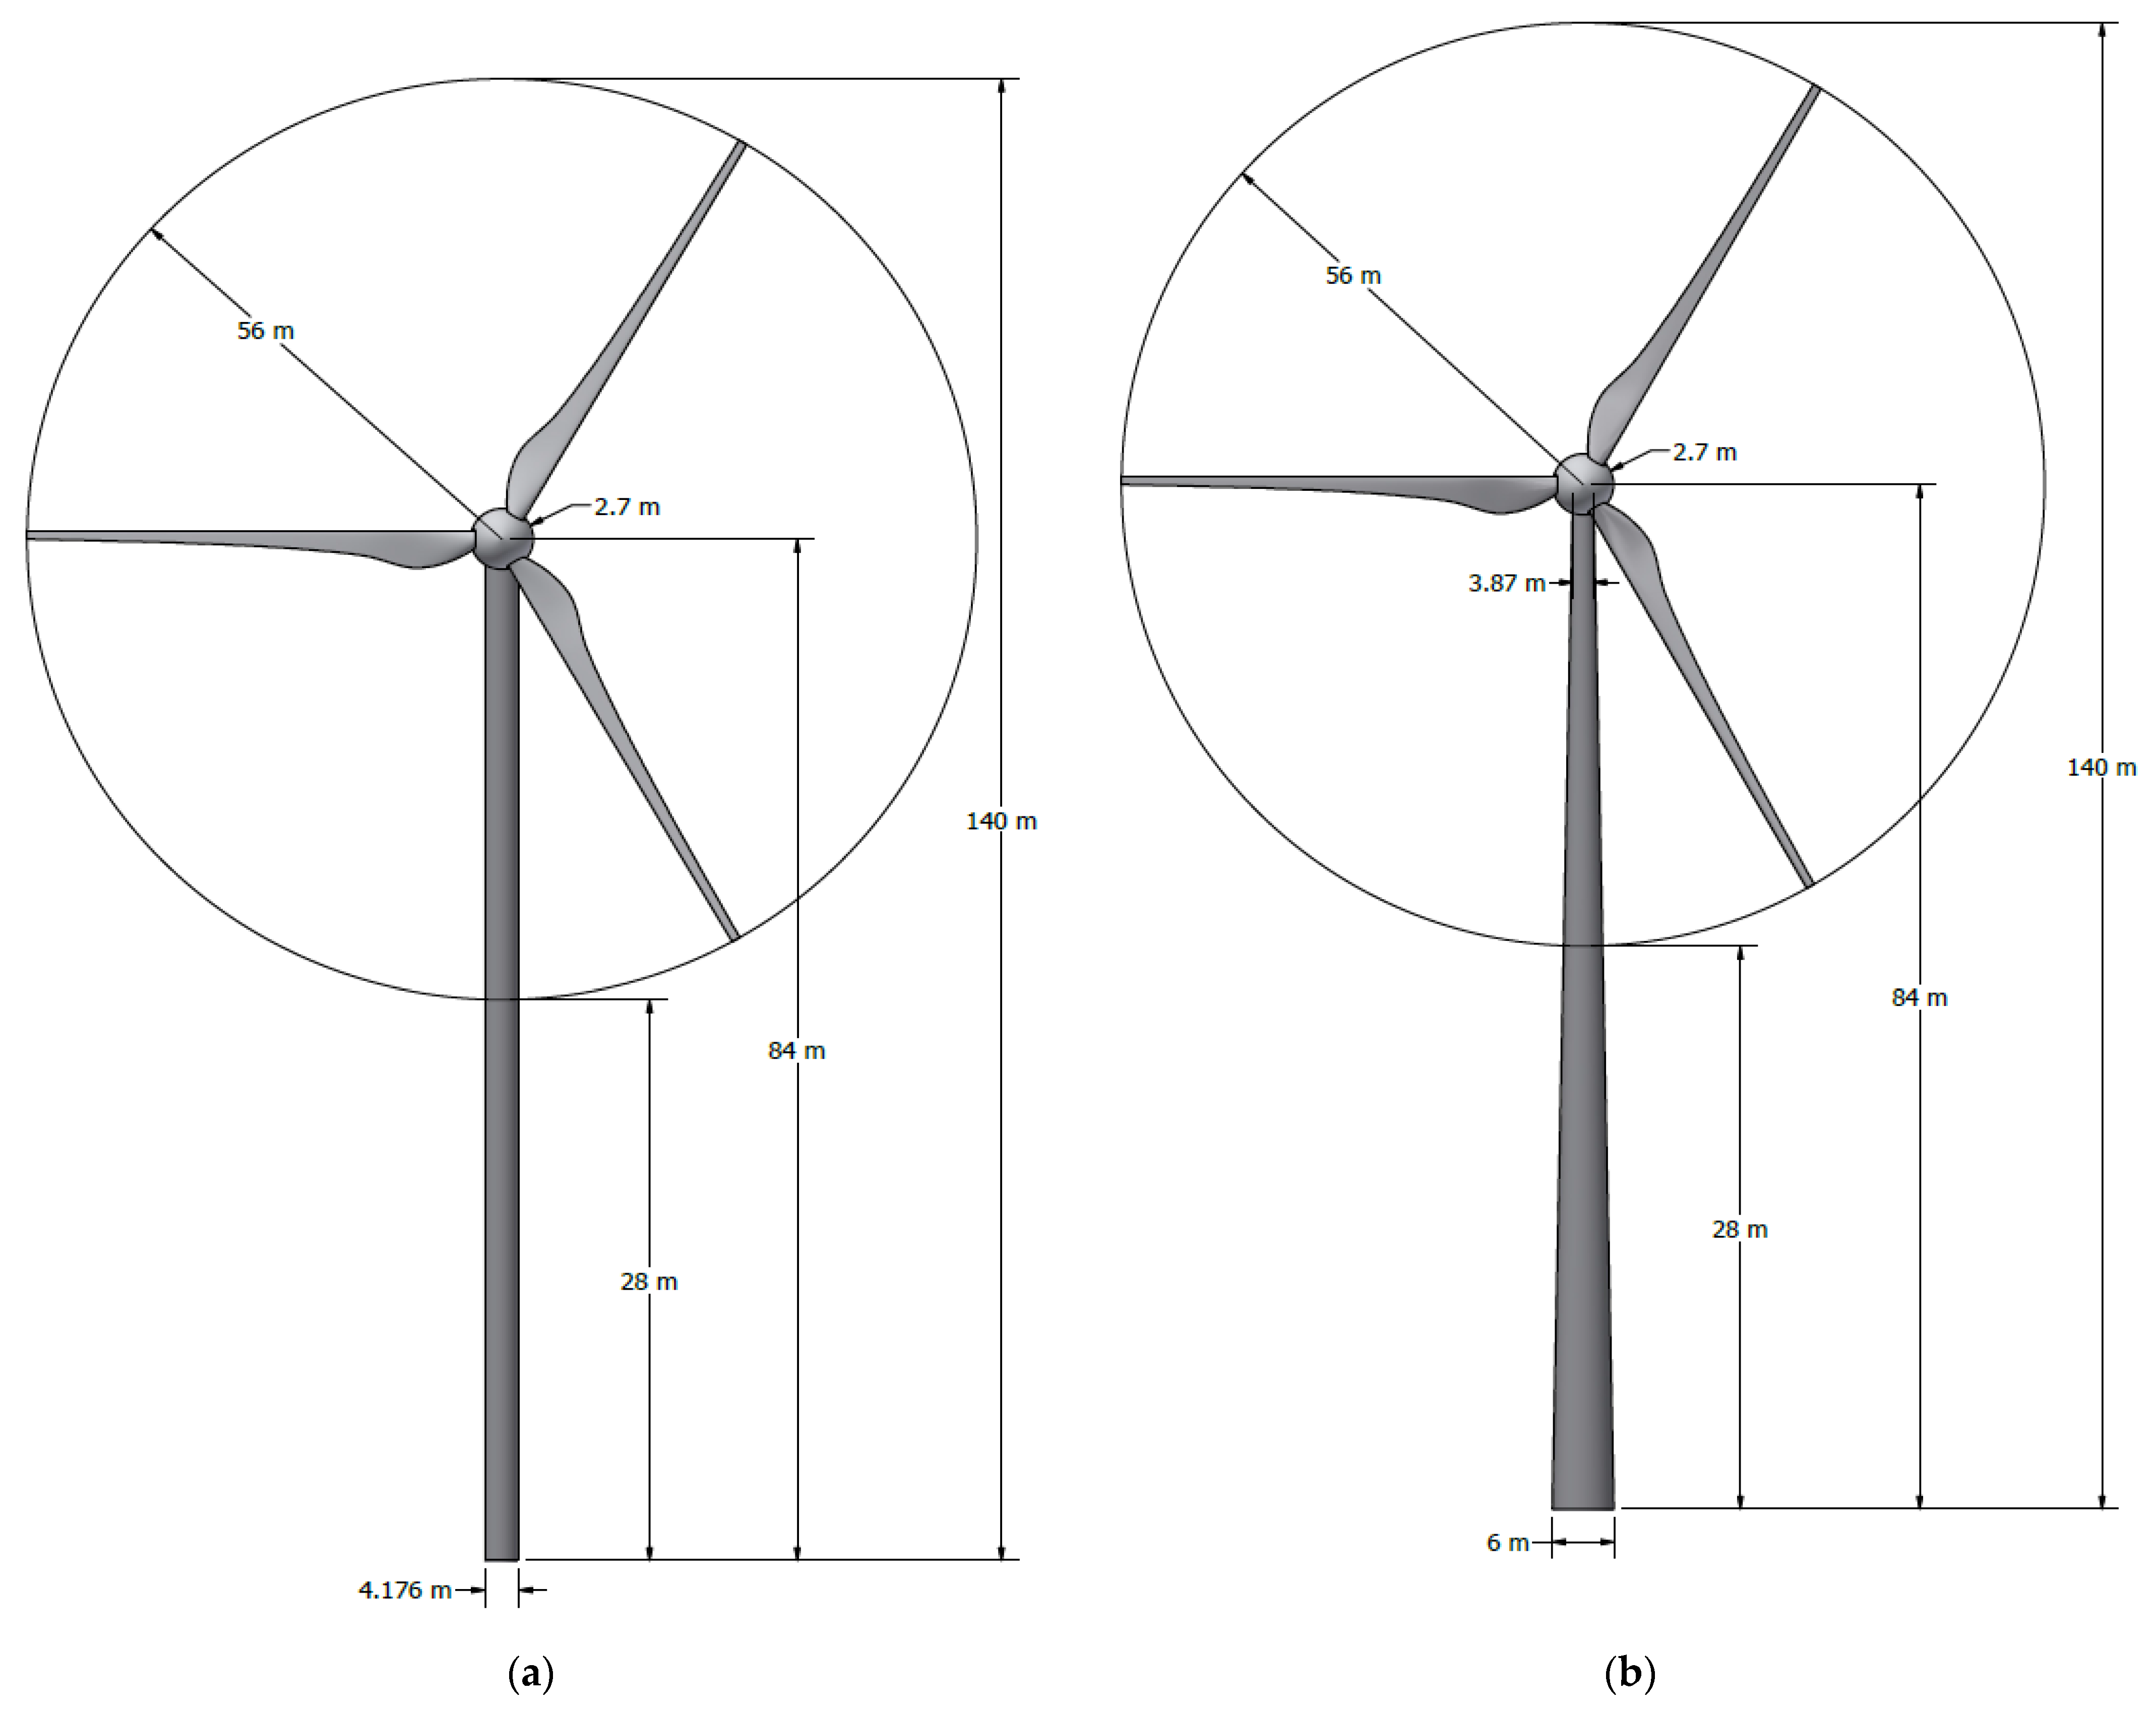
2.1. Characteristics of the Wind Turbine and Tower
2.2. Basic Assumptions
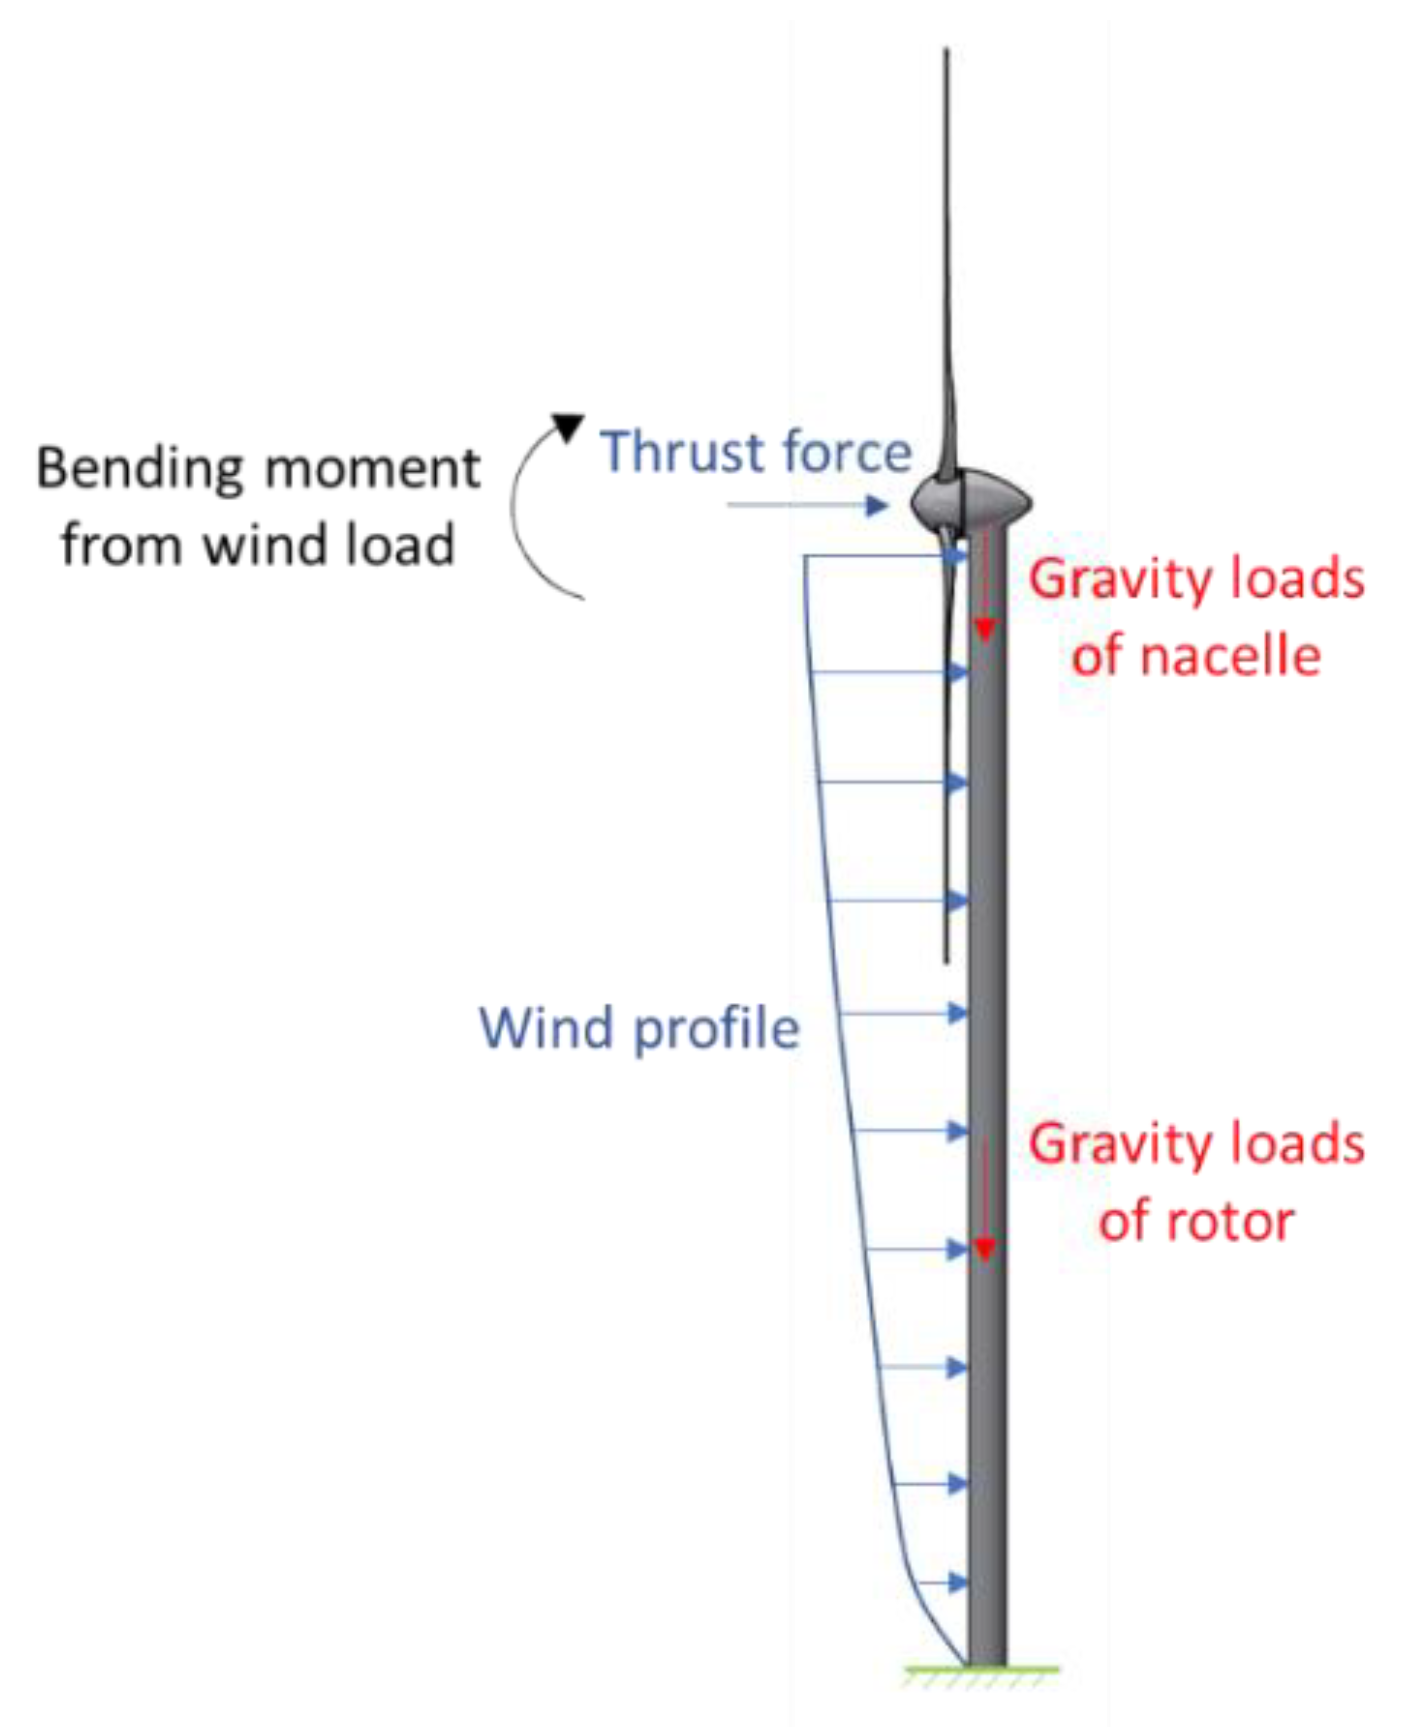
- The tower was considered to be a cantilevered beam that was fixed to the structure. At the top, a mass was applied that was equal to the mass of the nacelle, blades, and rotor;
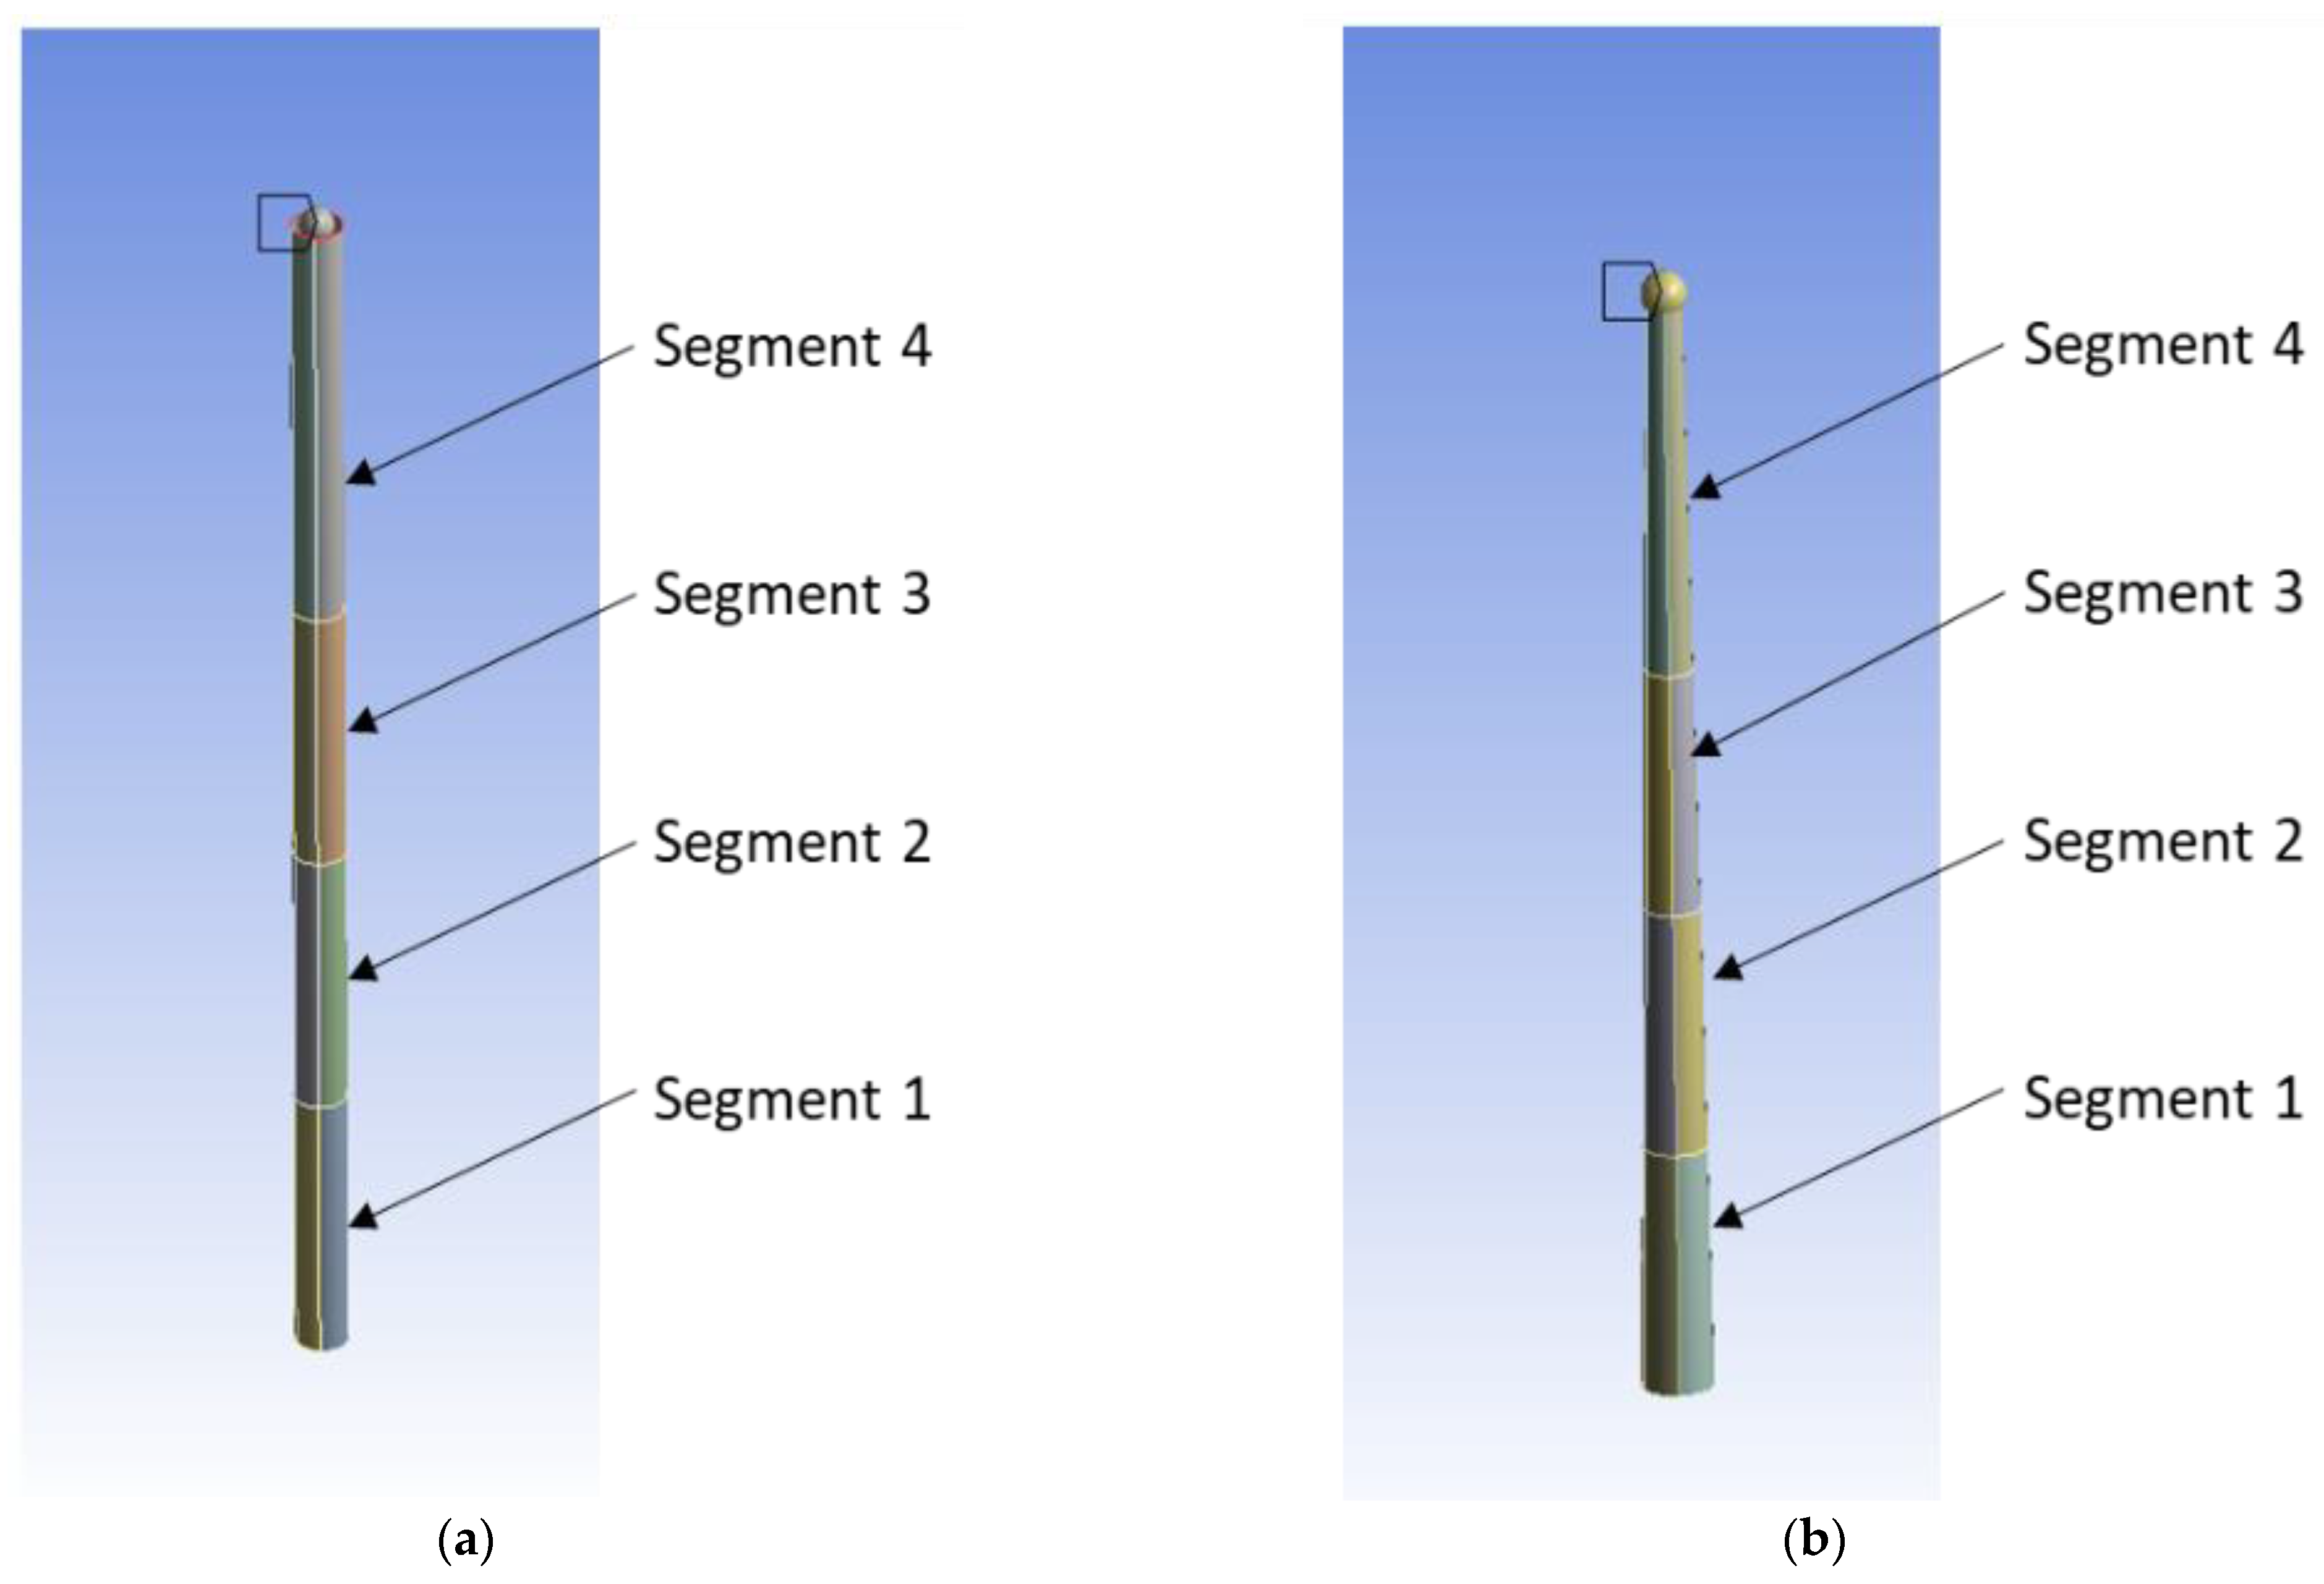
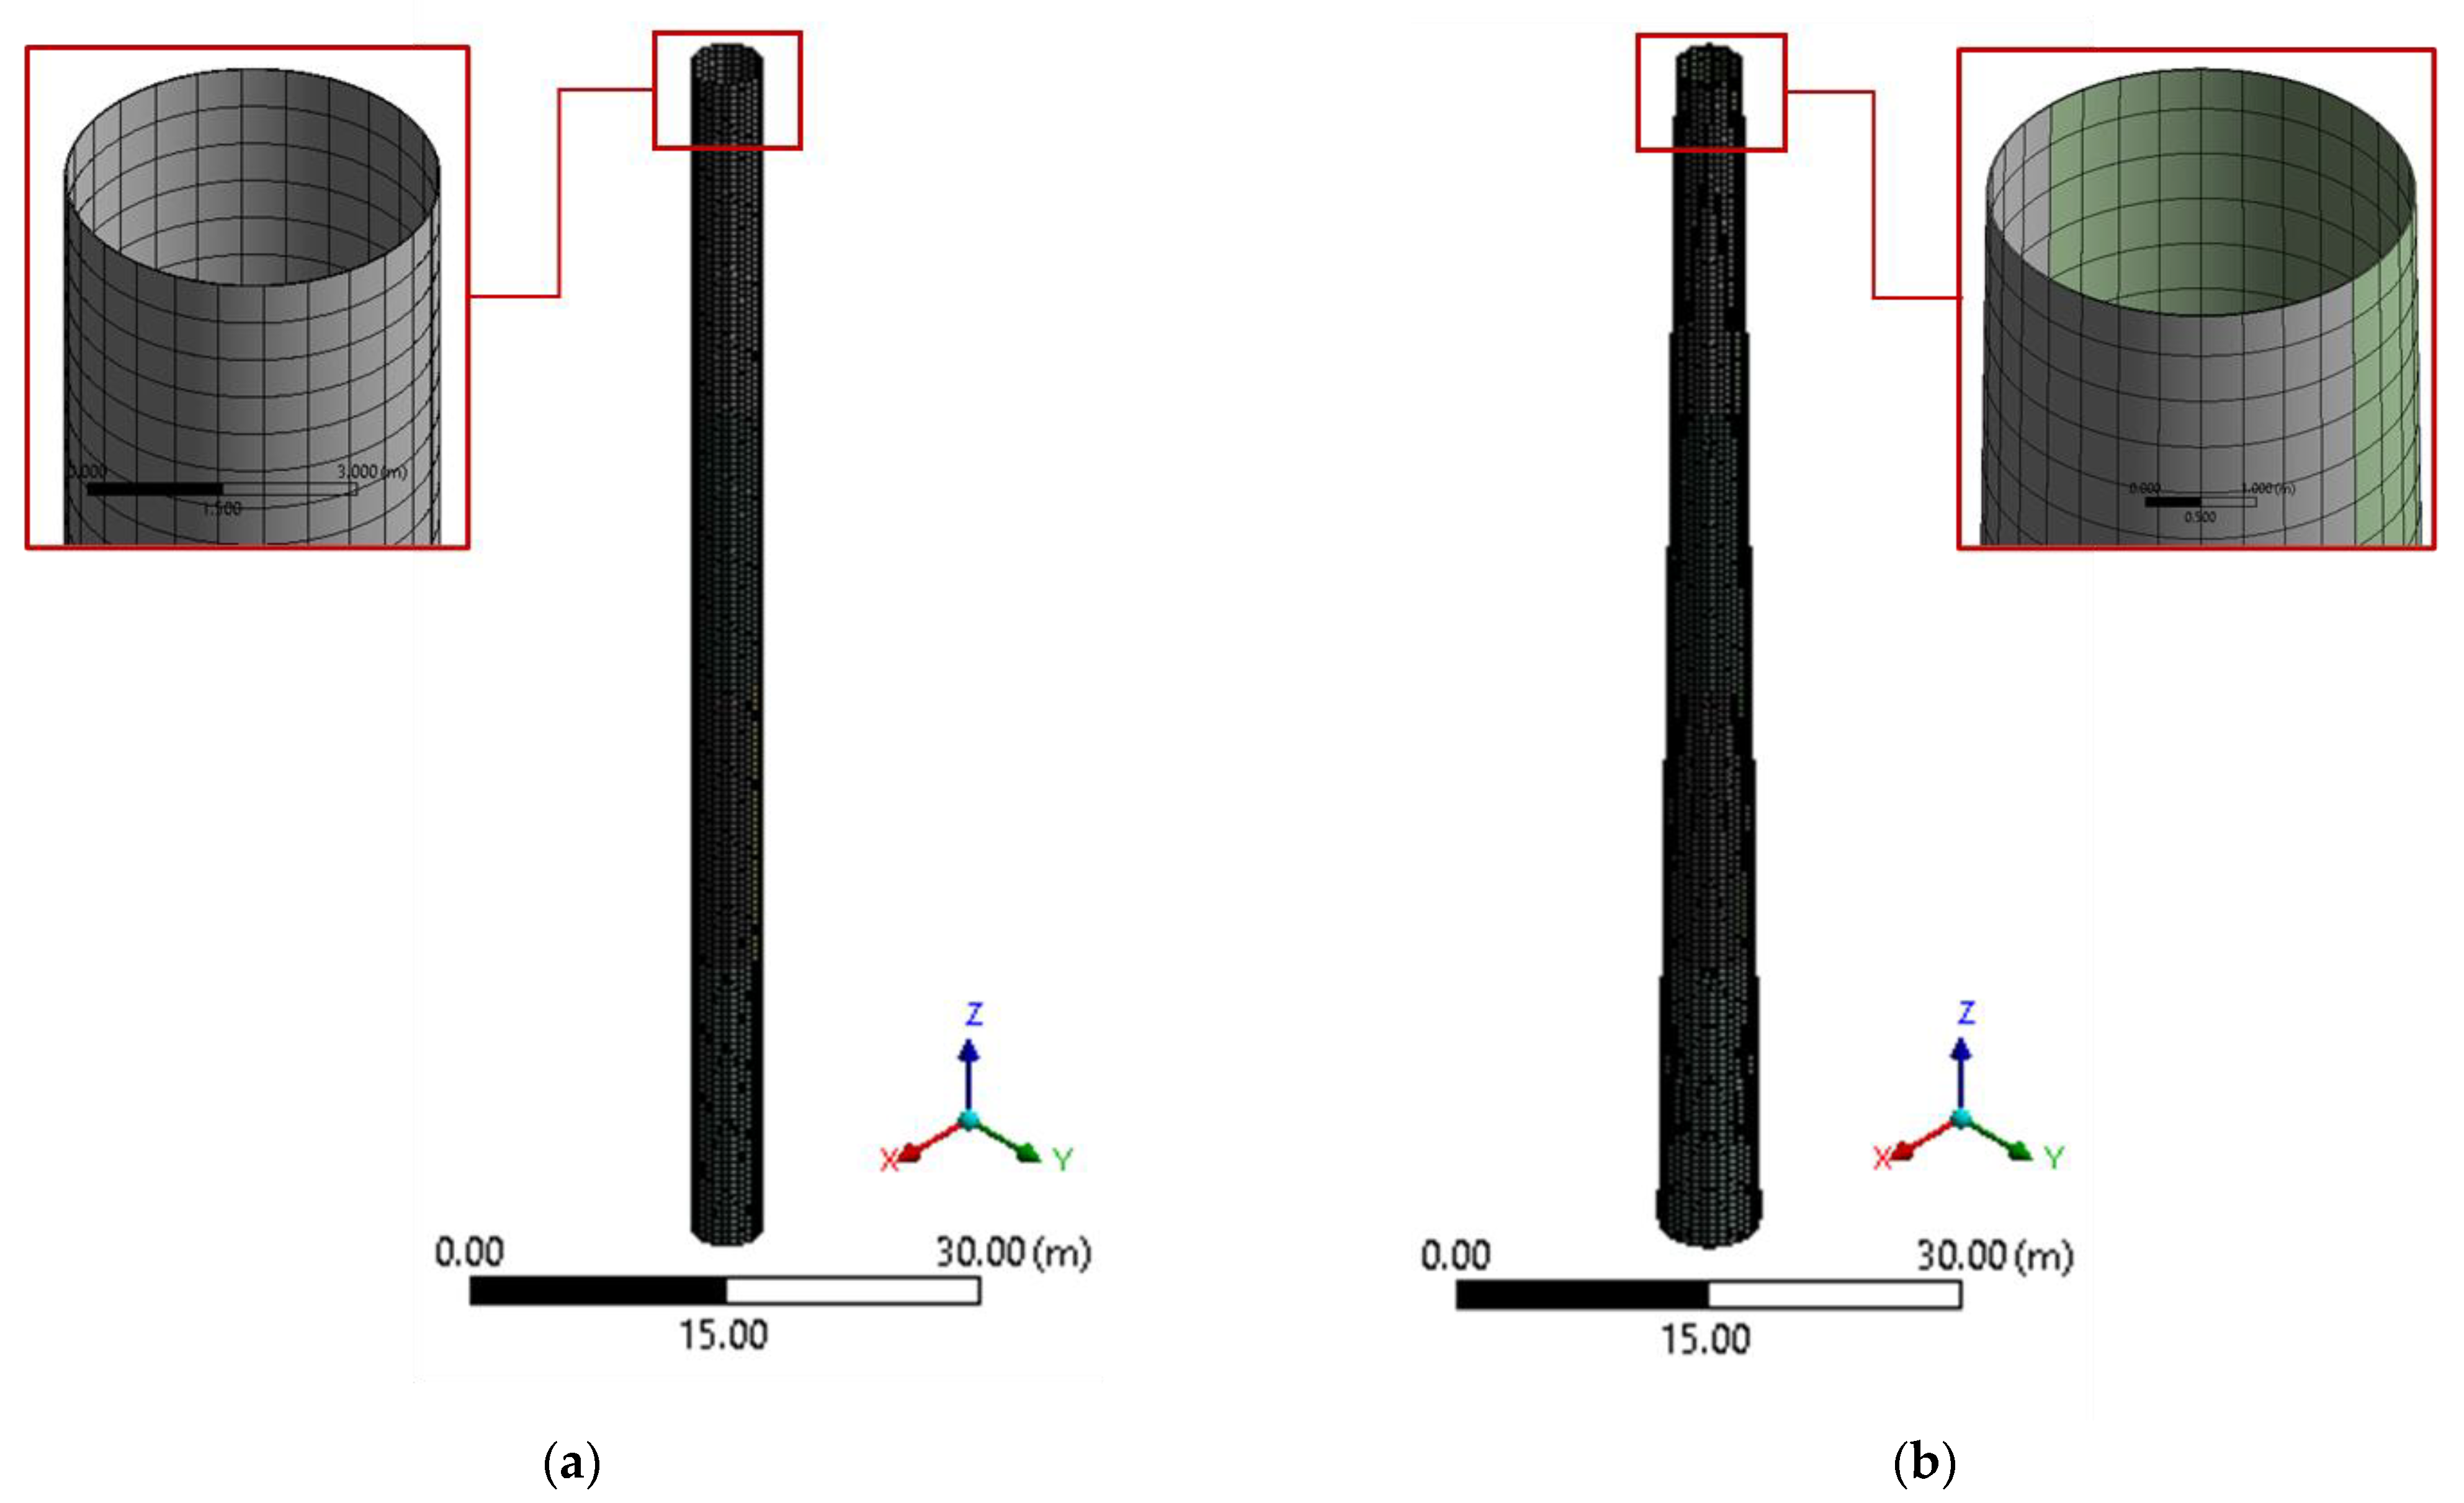
- The material of the tower was considered to be isotropic and homogeneous. One tower had a constant circular section along the height, and the other one had a decreasing section from the base to the top, and both of them featured small wall thicknesses;
- The secondary effects (such as axial and shear deformations and moment of inertia) were neglected;
- The aerodynamic distributed loads were caused only by drag forces.
2.3. Loads Calculation
2.3.1. Gravitational Loads
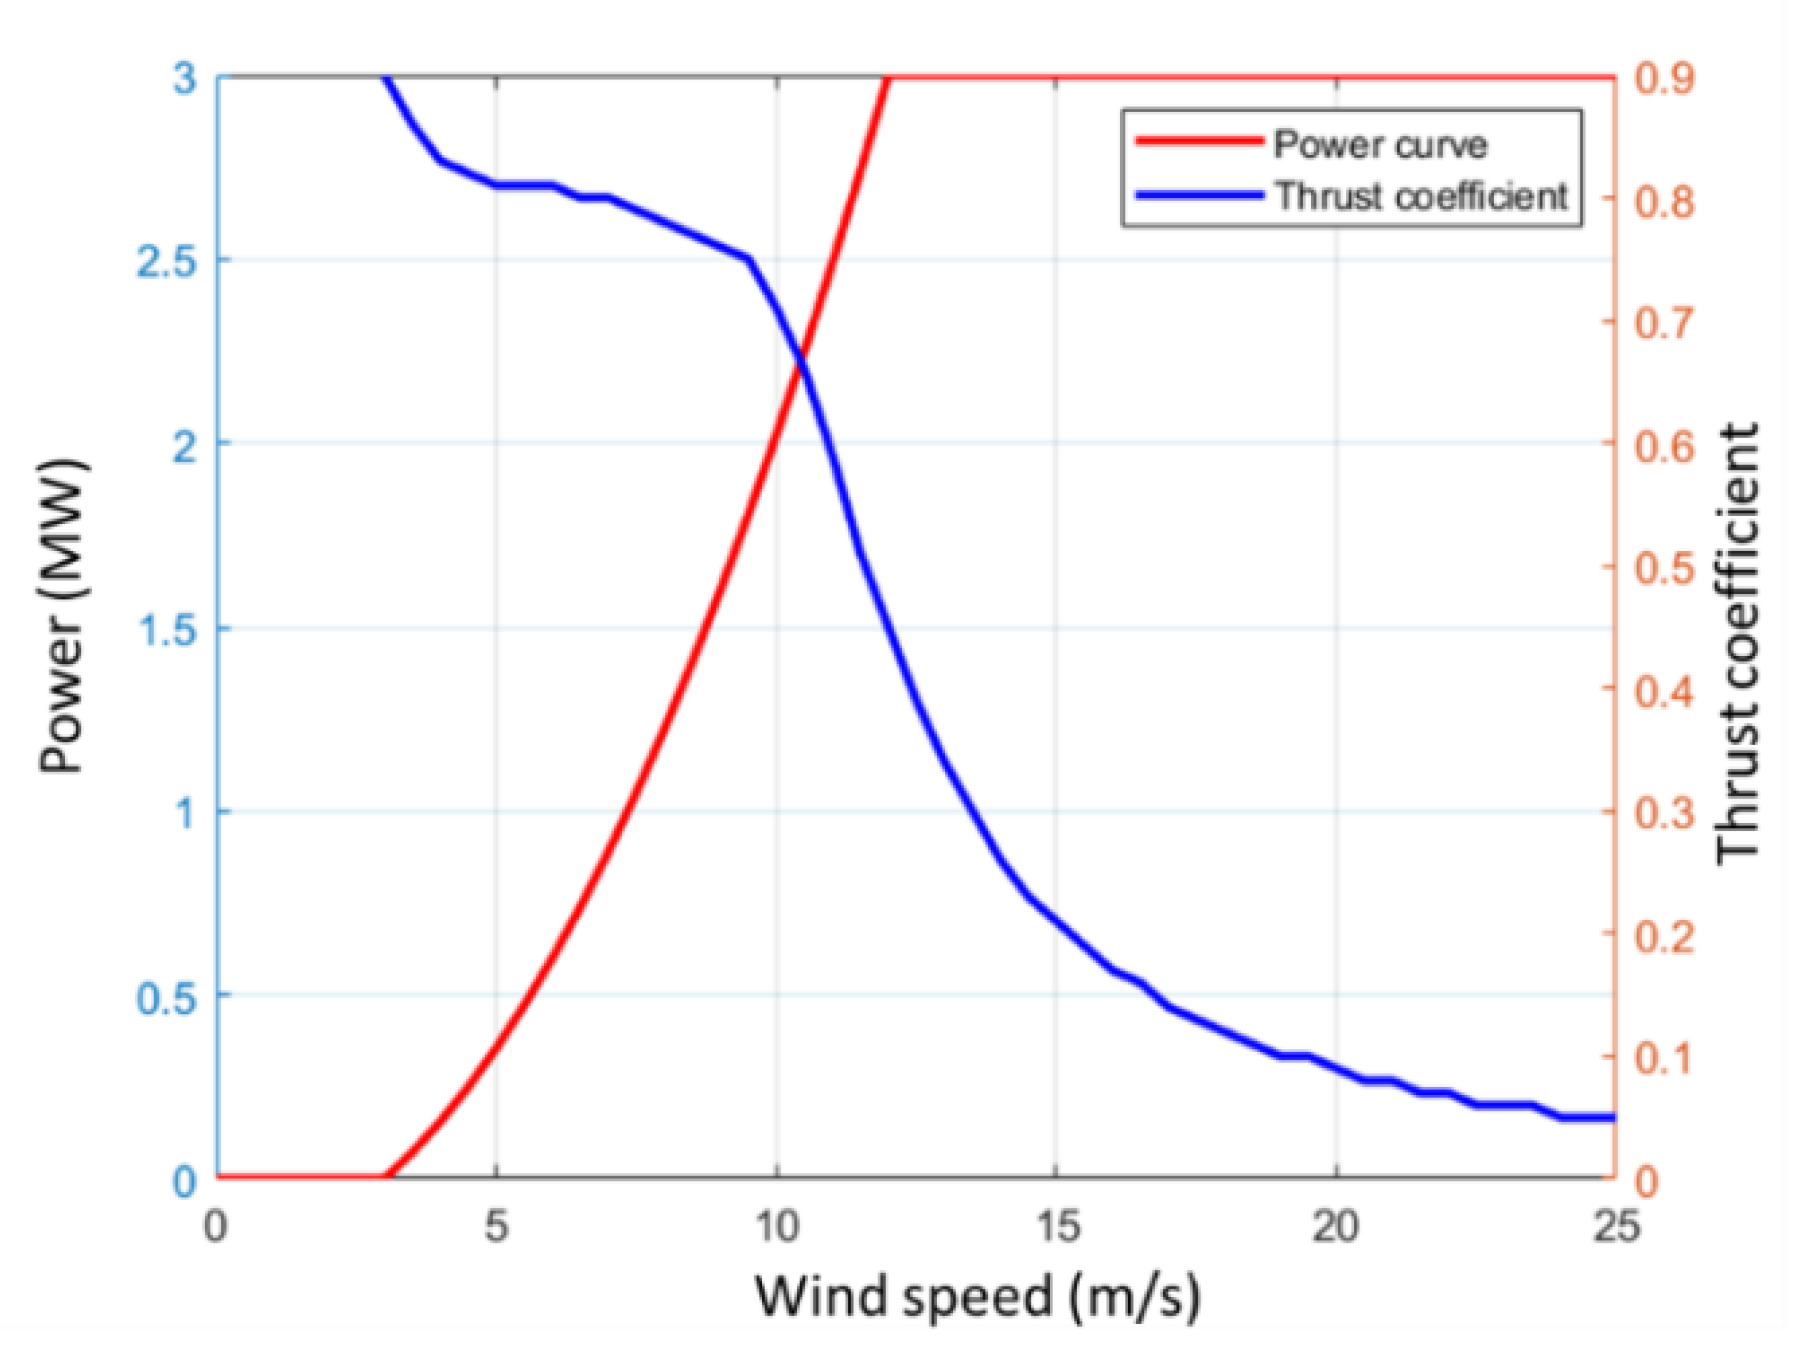
2.3.2. Aerodynamic Loads
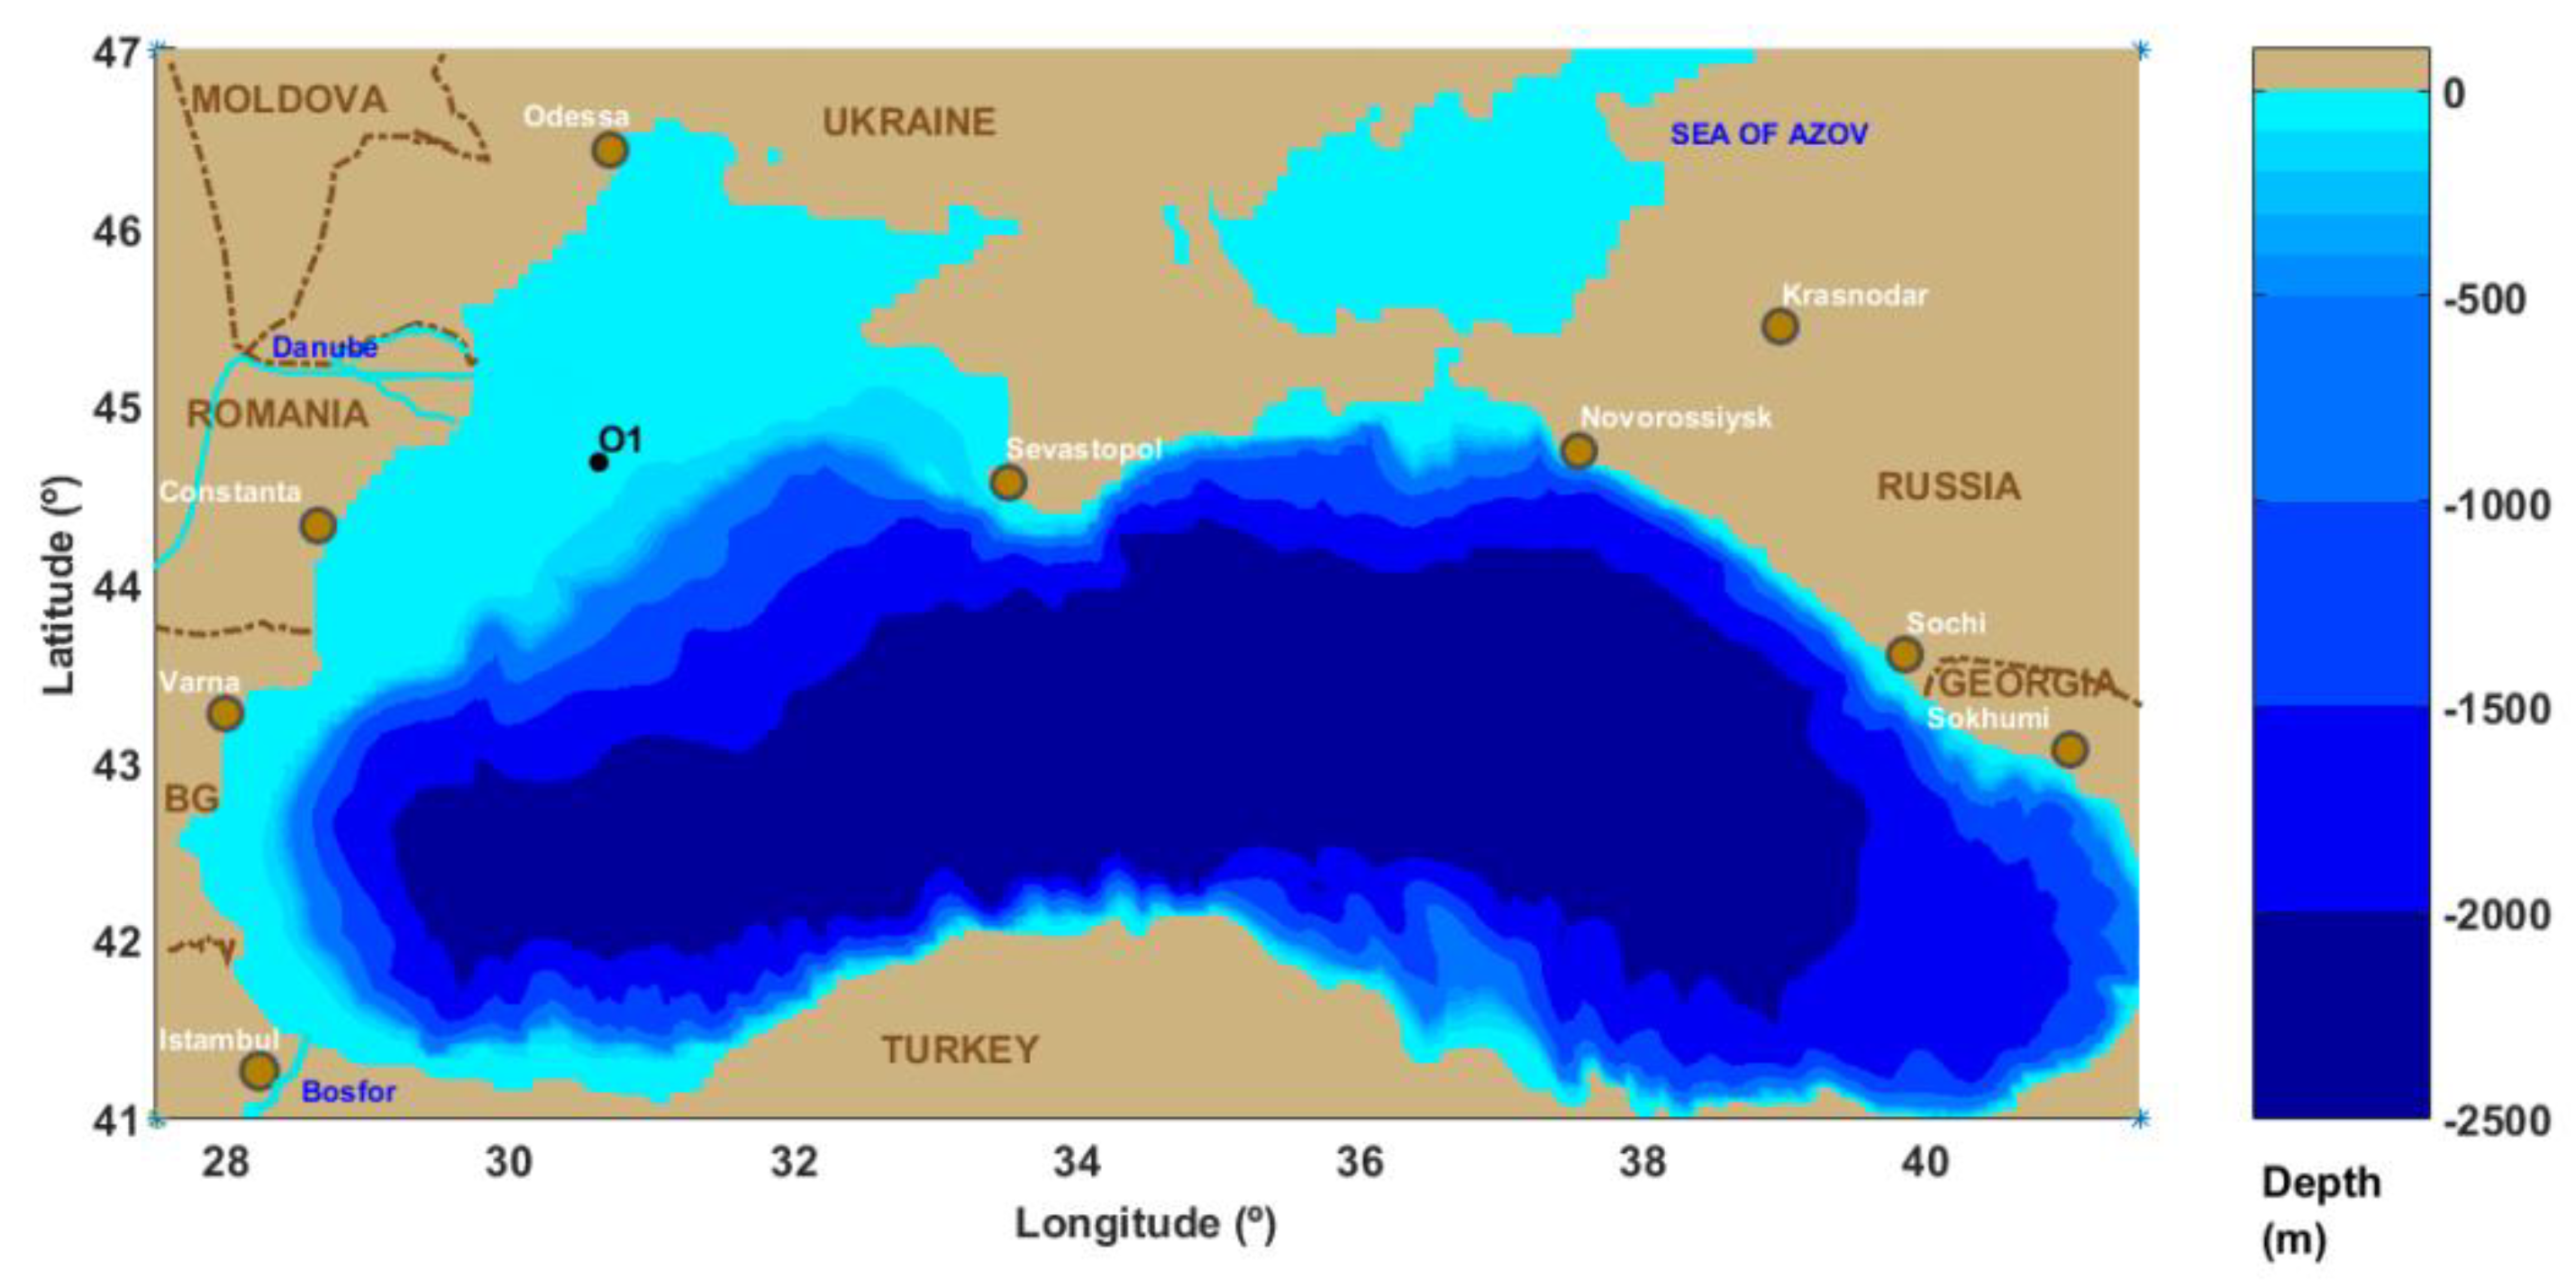
2.4. Analysis of the Behavior of the Two Towers in a Location in the Black Sea and Possibilities to Reduce the Thickness of the Shell
3. Results and Discussion
4. Conclusions
Author Contributions
Funding
Institutional Review Board Statement
Conflicts of Interest
References
- Post, E.; Alley, R.B.; Christensen, T.R.; Macias-Fauria, M.; Forbes, B.C.; Gooseff, M.N.; Iler, A.; Kerby, J.T.; Laidre, K.L.; Mann, M.E. The polar regions in a 2 C warmer world. Sci. Adv. 2019, 5, eaaw9883. [Google Scholar] [CrossRef] [PubMed] [Green Version]
- Akbar, M.; Hussain, A.; Akbar, A.; Ullah, I. The dynamic association between healthcare spending, CO2 emissions, and human development index in OECD countries: Evidence from panel VAR model. Environ. Dev. Sustain. 2021, 23, 10470–10489. [Google Scholar] [CrossRef]
- Shakoor, A.; Ashraf, F.; Shakoor, S.; Mustafa, A.; Rehman, A.; Altaf, M.M. Biogeochemical transformation of greenhouse gas emissions from terrestrial to atmospheric environment and potential feedback to climate forcing. Environ. Sci. Pollut. Res. 2020, 27, 38513–38536. [Google Scholar] [CrossRef] [PubMed]
- IEA. Global Energy Review 2021; IEA (International Energy Agency): Paris, France, 2021. [Google Scholar]
- bp. Statistical Review of World Energy 2021; BP p.l.c.: London, UK, 2021. [Google Scholar]
- Vivek, C.M.; Ramkumar, P.; Srividhya, P.K.; Sivasubramanian, M. Recent strategies and trends in implanting of renewable energy sources for sustainability–A review. Mater. Today Proc. 2021, 46, 8204–8208. [Google Scholar] [CrossRef]
- Van de Graaf, T. Fragmentation in Global Energy Governance: Explaining the Creation of IRENA. Glob. Environ. Politics 2011, 13, 14–33. [Google Scholar] [CrossRef]
- IRENA. Renewable Capacity Statistics 2021; International Renewable Energy Agency (IRENA): Abu Dhabi, United Arab Emirates, 2021. [Google Scholar]
- National Statistics. Energy Trends; National Statistics: London, UK, 2021. [Google Scholar]
- Higgins, P.; Foley, A. The evolution of offshore wind power in the United Kingdom. Renew. Sustain. Energy Rev. 2014, 37, 599–612. [Google Scholar] [CrossRef]
- MCA. MGN 372 (M+ F) Offshore Renewable Energy Installations (OREIs): Guidance to Mariners Operating in the Vicinity of UK OREIs; Maritime and Coastguard Agency: Southampton, UK, 2008. [Google Scholar]
- Navadeh, N.; Goroshko, I.; Zhuk, Y.; Moghadam, F.E.; Fallah, A.S. Finite element analysis of wind turbine blade vibrations. Vibration 2021, 4, 310–322. [Google Scholar] [CrossRef]
- Bottasso, C.L.; Campagnolo, F.; Croce, A.; Dilli, S.; Gualdoni, F.; Nielsen, M.B. Structural optimization of wind turbine rotor blades by multilevel sectional/multibody/3D-FEM analysis. Multibody Syst. Dyn. 2014, 32, 87–116. [Google Scholar] [CrossRef]
- Wang, L.; Liu, X.; Kolios, A. State of the art in the aeroelasticity of wind turbine blades: Aeroelastic modelling. Renew. Sustain. Energy Rev. 2016, 64, 195–210. [Google Scholar] [CrossRef] [Green Version]
- Kaveh, A.; Sabeti, S. Optimal design of monopile offshore wind turbine structures using CBO, ECBO, and VPS algorithms. Sci. Iran. 2019, 26, 1232–1248. [Google Scholar] [CrossRef] [Green Version]
- Muskulus, M.; Schafhirt, S. Design optimization of wind turbine support structures—A review. J. Ocean Wind Energy 2014, 1, 12–22. [Google Scholar]
- O’Leary, K.; Pakrashi, V.; Kelliher, D. Optimization of composite material tower for offshore wind turbine structures. Renew. Energy 2019, 140, 928–942. [Google Scholar] [CrossRef]
- Gutiérrez, E.; Primi, S.; Taucer, F.; Caperan, P.; Tirelli, D.; Mieres, J.; Calvo, I.; Rodriguez, J.; Vallano, F.; Galiotis, C. A wind turbine tower design based on the use of fibre-reinforced composites. In MEGAWIND FP5 Project, ENK5-CT-2000-00328; ELSA: Ispra, Italy, 2003; p. 163. [Google Scholar]
- Young, A.C.; Goupee, A.J.; Dagher, H.J.; Viselli, A.M. Methodology for optimizing composite towers for use on floating wind turbines. J. Renew. Sustain. Energy 2017, 9, 33305. [Google Scholar] [CrossRef]
- Uys, P.E.; Farkas, J.; Jarmai, K.; Van Tonder, F. Optimisation of a steel tower for a wind turbine structure. Eng. Struct. 2007, 29, 1337–1342. [Google Scholar] [CrossRef]
- Wang, L.; Kolios, A.; Luengo, M.M.; Liu, X. Structural optimisation of wind turbine towers based on finite element analysis and genetic algorithm. Wind Energy Sci. Discuss. 2016, 153, 1–26. [Google Scholar]
- Jonkman, J.; Butterfield, S.; Musial, W.; Scott, G. Definition of a 5-MW Reference Wind Turbine for Offshore System Development; National Renewable Energy Lab. (NREL): Golden, CO, USA, 2009. [Google Scholar]
- Zhu, R.S.; Zheng, Z.Z.; Liu, Y.M.; Shen, J.; Xiao, Y.; Jiang, D.X.; Chen, J. Finite Element Analysis for MW Wind Turbine Tower. In Applied Mechanics and Materials; Trans Tech Publications Ltd.: Stafa-Zurich, Switzerland, 2012; Volume 130, pp. 124–127. [Google Scholar]
- Li, X.L.; Ren, L.M. Finite Element Analysis of Wind Turbine Tower. In Applied Mechanics and Materials; Trans Tech Publications Ltd.: Stafa-Zurich, Switzerland, 2013; Volume 351, pp. 825–828. [Google Scholar]
- Joshi, Y.S.; Alandkar, M.P.M. Finite Element Analysis of Connections for Wind Turbine Towers; ACADEMIA: San Francisco, CA, USA, 2017. [Google Scholar]
- Diaf, S.; Notton, G.; Belhamel, M.; Haddadi, M.; Louche, A. Design and techno-economical optimization for hybrid PV/wind system under various meteorological conditions. Appl. Energy 2008, 85, 968–987. [Google Scholar] [CrossRef]
- Diaconita, A.I.; Rusu, L.; Andrei, G. A Local Perspective on Wind Energy Potential in Six Reference Sites on the Western Coast of the Black Sea Considering Five Different Types of Wind Turbines. Inventions 2021, 6, 44. [Google Scholar] [CrossRef]
- Shittu, A.A.; Mehmanparast, A.; Wang, L.; Salonitis, K.; Kolios, A. Comparative study of structural reliability assessment methods for offshore wind turbine jacket support structures. Appl. Sci. 2020, 10, 860. [Google Scholar] [CrossRef] [Green Version]
- Chantharasenawong, C.; Jongpradist, P.; Laoharatchapruek, S. Preliminary design of 1.5-MW modular wind turbine tower. In Proceedings of the 2nd TSME International Conference on Mechanical Engineering, Krabi, Thailand, 19–21 October 2011. [Google Scholar]
- Dagli, B.Y.; Tuskan, Y.; Gökkuş, Ü. Evaluation of offshore wind turbine tower dynamics with numerical analysis. Adv. Civ. Eng. 2018, 2018, 1–11. [Google Scholar] [CrossRef] [Green Version]
- Liu, Y.; Chen, D.; Yi, Q.; Li, S. Wind Profiles and Wave Spectra for Potential Wind Farms in South China Sea. Part I: Wind Speed Profile Model. Energies 2017, 10, 125. [Google Scholar] [CrossRef] [Green Version]
- Manwell, J.F.; McGowan, J.G.; Rogers, A.L. Wind Energy Explained: Theory, Design and Application; Wiley: Chichester, UK, 2009. [Google Scholar]
- Hellmann, G. Über die Bewegung der Luft in den untersten Schichten der Atmosphäre. Meteoral. Z. 1916, 34, 273. [Google Scholar]
- Albani, A.; Ibrahim, M.Z. Wind Energy Potential and Power Law Indexes Assessment for Selected Near-Coastal Sites in Malaysia. Energies 2017, 10, 307. [Google Scholar] [CrossRef] [Green Version]
- International Electrotechnical Commission. Wind Turbines—Part 1: Design Requirements; Tech. Doc. IEC 61400-1; International Electrotechnical Commission: Geneva, Switzerland, 2005. [Google Scholar]
- American Bureau of Shipping (ABS). Guide for Building and Classing Offshore Wind Turbine Installation; ABS: Houston, TX, USA, 2014. [Google Scholar]
- Hsu, Y.; Wu, W.-F.; Chang, Y.-C. Reliability analysis of wind turbine towers. Procedia Eng. 2014, 79, 218–224. [Google Scholar] [CrossRef] [Green Version]
- Liu, H.; Yang, S.; Tian, W.; Zhao, M.; Yuan, X.; Xu, B. Vibration reduction strategy for offshore wind turbines. Appl. Sci. 2020, 10, 6091. [Google Scholar] [CrossRef]
- Diaconita, A.; Andrei, G.; Rusu, L. New insights into the wind energy potential of the west Black Sea area based on the North Sea wind farms model. Energy Rep. 2021, 7, 112–118. [Google Scholar] [CrossRef]
- Gentils, T.; Wang, L.; Kolios, A. Integrated structural optimisation of offshore wind turbine support structures based on finite element analysis and genetic algorithm. Appl. Energy 2017, 199, 187–204. [Google Scholar] [CrossRef] [Green Version]
- Lloyd, G.; Hamburg, G. Guideline for the Certification of Wind Turbines; Germanischer Lloyd Industrial Services GmbH: Hamburg, Germany, 2010. [Google Scholar]
- Nicholson, J.C. Design of Wind Turbine Tower and Foundation Systems: Optimization Approach. Ph.D. Thesis, The University of Iowa, Iowa City, IA, USA, 2011. [Google Scholar]
- Rebelo, C.; Veljkovic, M.; da Silva, L.S.; Simões, R.; Henriques, J. Structural monitoring of a wind turbine steel tower—Part I: System description and calibration. Wind Struct. 2012, 15, 285. [Google Scholar] [CrossRef]


| Properties | Values | |
|---|---|---|
| Rated capacity | 3 MW | |
| Wind class | IEC Ia | |
| Rotor diameter | 112 m | |
| Swept area | 9852 m2 | |
| Mass (blades, rotor, nacelle) | 155 t | |
| Hub height | 84 m | |
| Material | Steel S355JR | |
| Type of tower | Cylindrical | Conical |
| Tower diameter | 4.176 m | 6 m at base 3.87 at top |
| Properties | Values |
|---|---|
| Young’s modulus (E) | 200·103 MPa |
| Density (ρ) | 7800 kg/m3 |
| Poisson’s ratio (ν) | 0.3 |
| Data | Values |
|---|---|
| Location | Black Sea |
| Longitude (°) | 30.62 |
| Latitude (°) | 44.68 |
| Depth (m) | 75.29 |
| Maximum wind speed (m/s) | 27.17 |
| Mean wind speed (m/s) | 8.00 |
| Annual energy production (MWh) | 11,712 |
| Capacity factor (%) | 45 |
| Segment | Thickness |
|---|---|
| Segment 1 | 50 mm |
| Segment 2 | 30 mm |
| Segment 3 | 19 mm |
| Segment 4 | 19 mm |
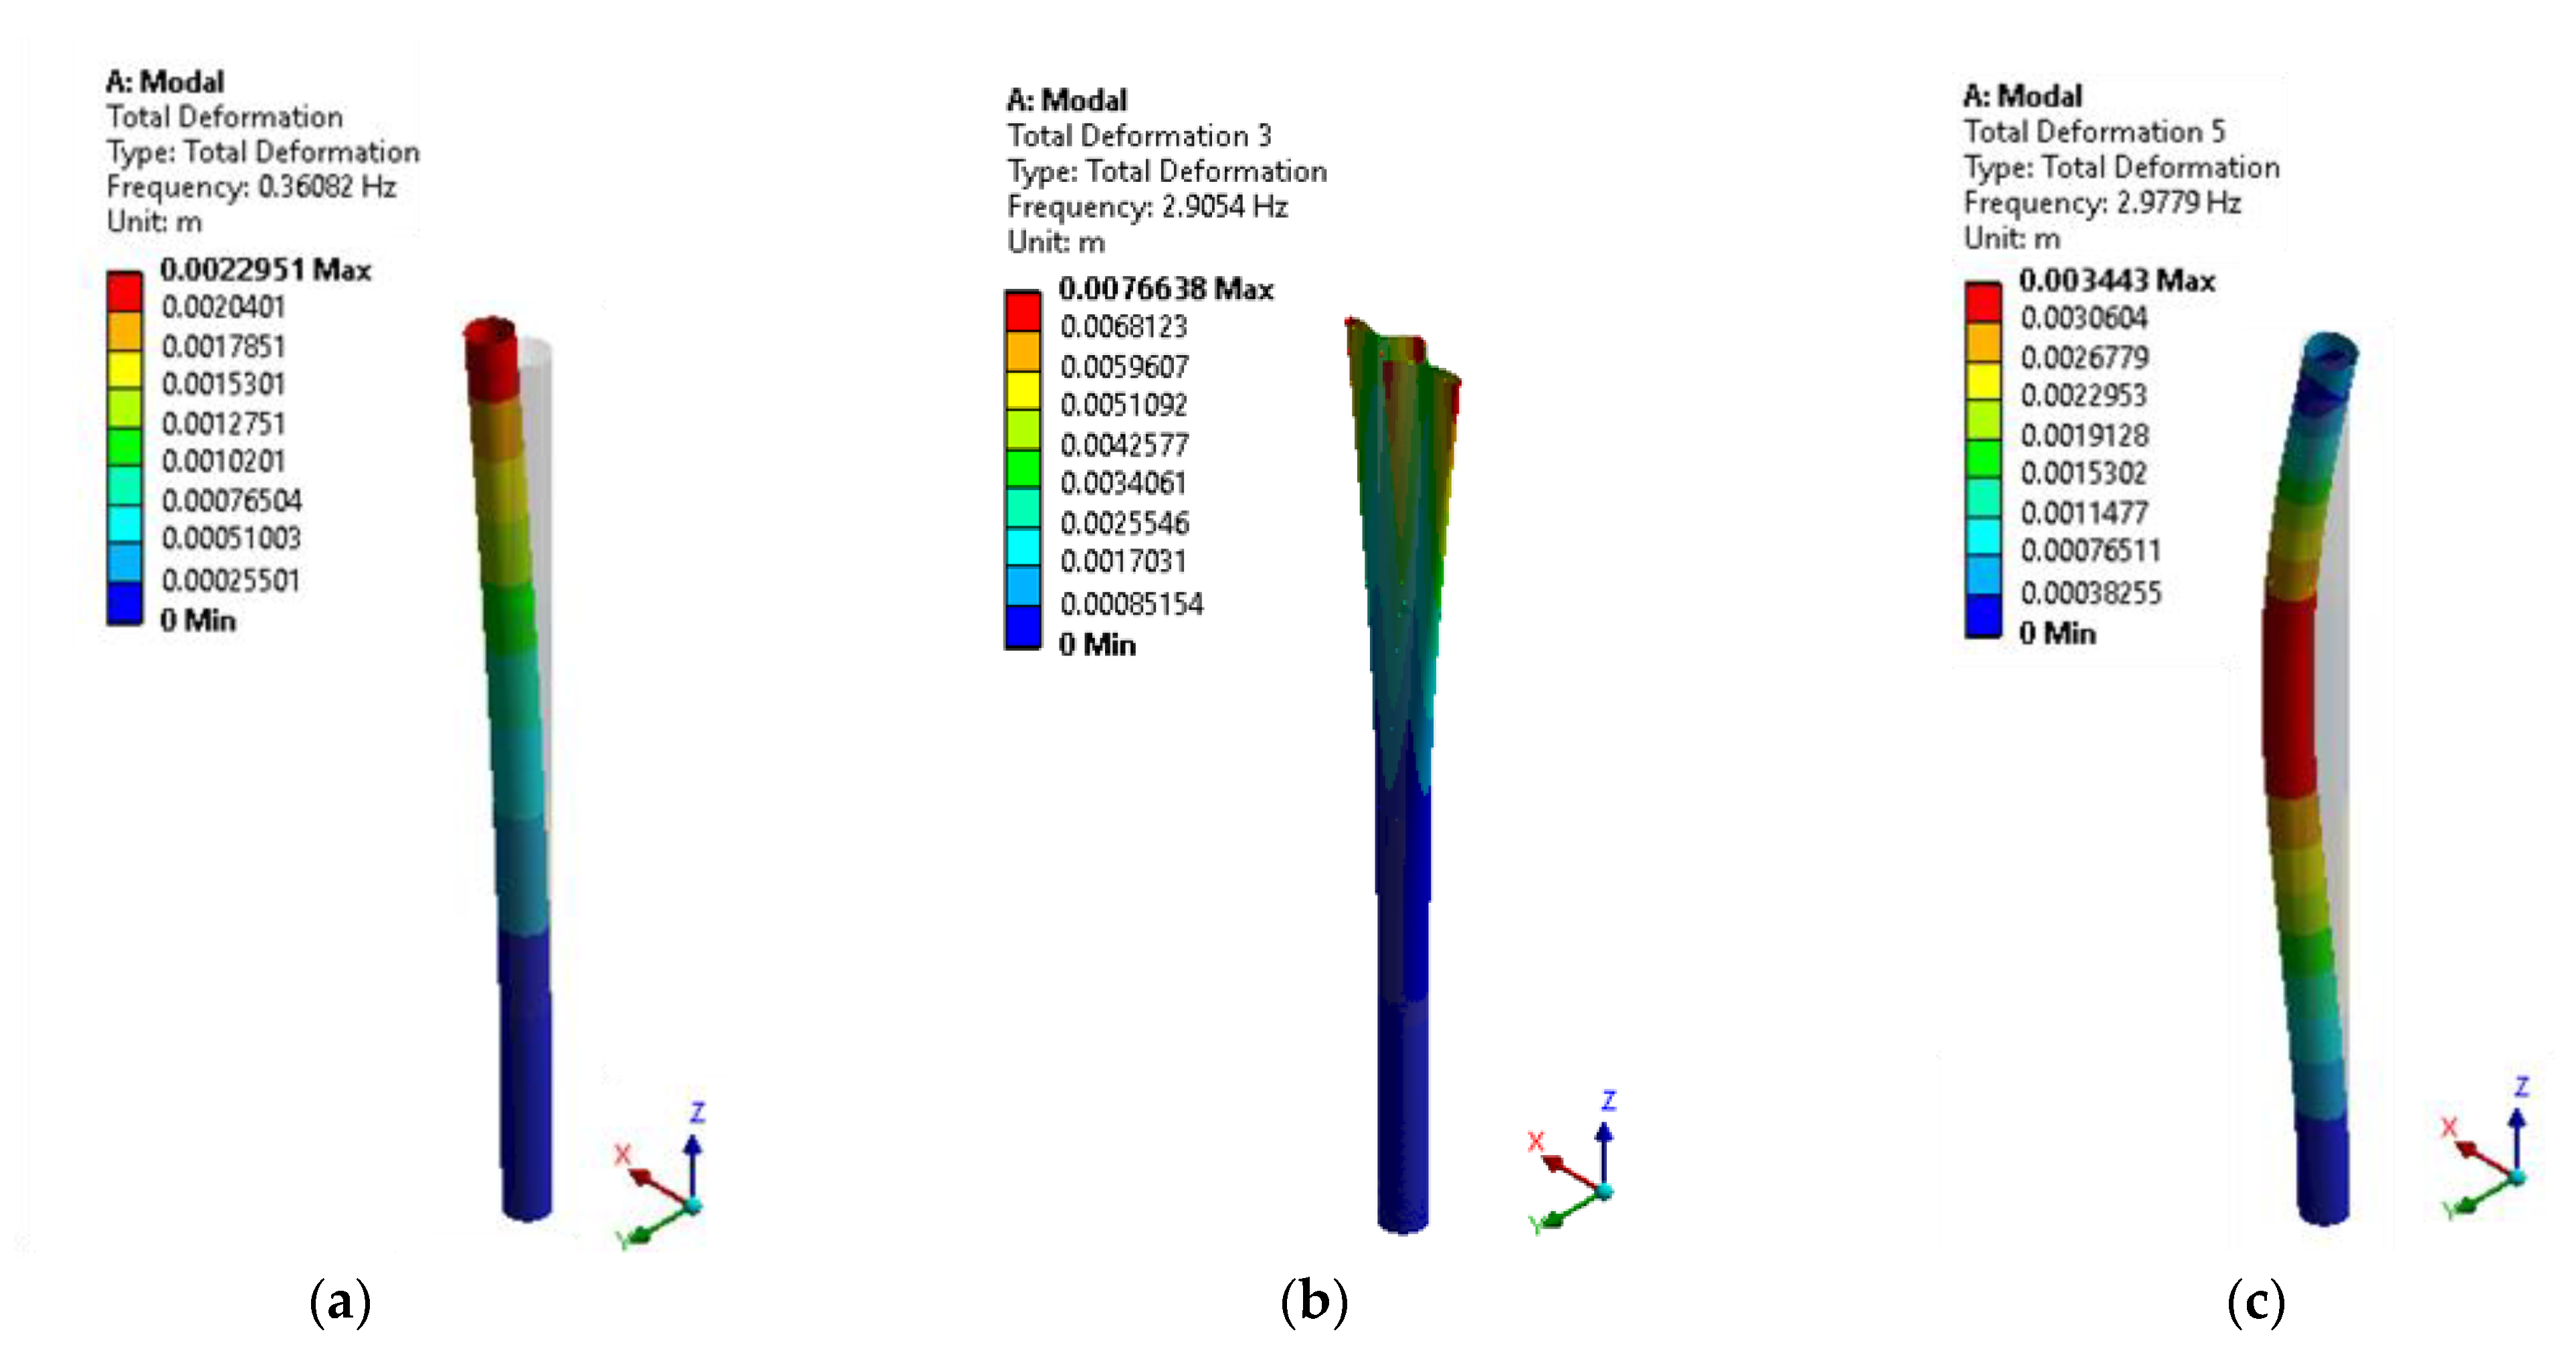
| Type of Tower | Modal Frequencies (Hz) | Mesh Size | |||
|---|---|---|---|---|---|
| 2 m | 1 m | 0.5 m | 0.25 m | ||
| Cylindrical | 1 | 0.35984 | 0.36079 | 0.36082 | 0.36084 |
| 2 | 0.35985 | 0.36079 | 0.36082 | 0.36084 | |
| 3 | 2.97390 | 2.91420 | 2.90540 | 2.90390 | |
| 4 | 2.97410 | 2.91750 | 2.90670 | 2.90450 | |
| 5 | 3.13870 | 2.97780 | 2.97790 | 2.97790 | |
| 6 | 3.15560 | 2.97780 | 2.97790 | 2.97790 | |
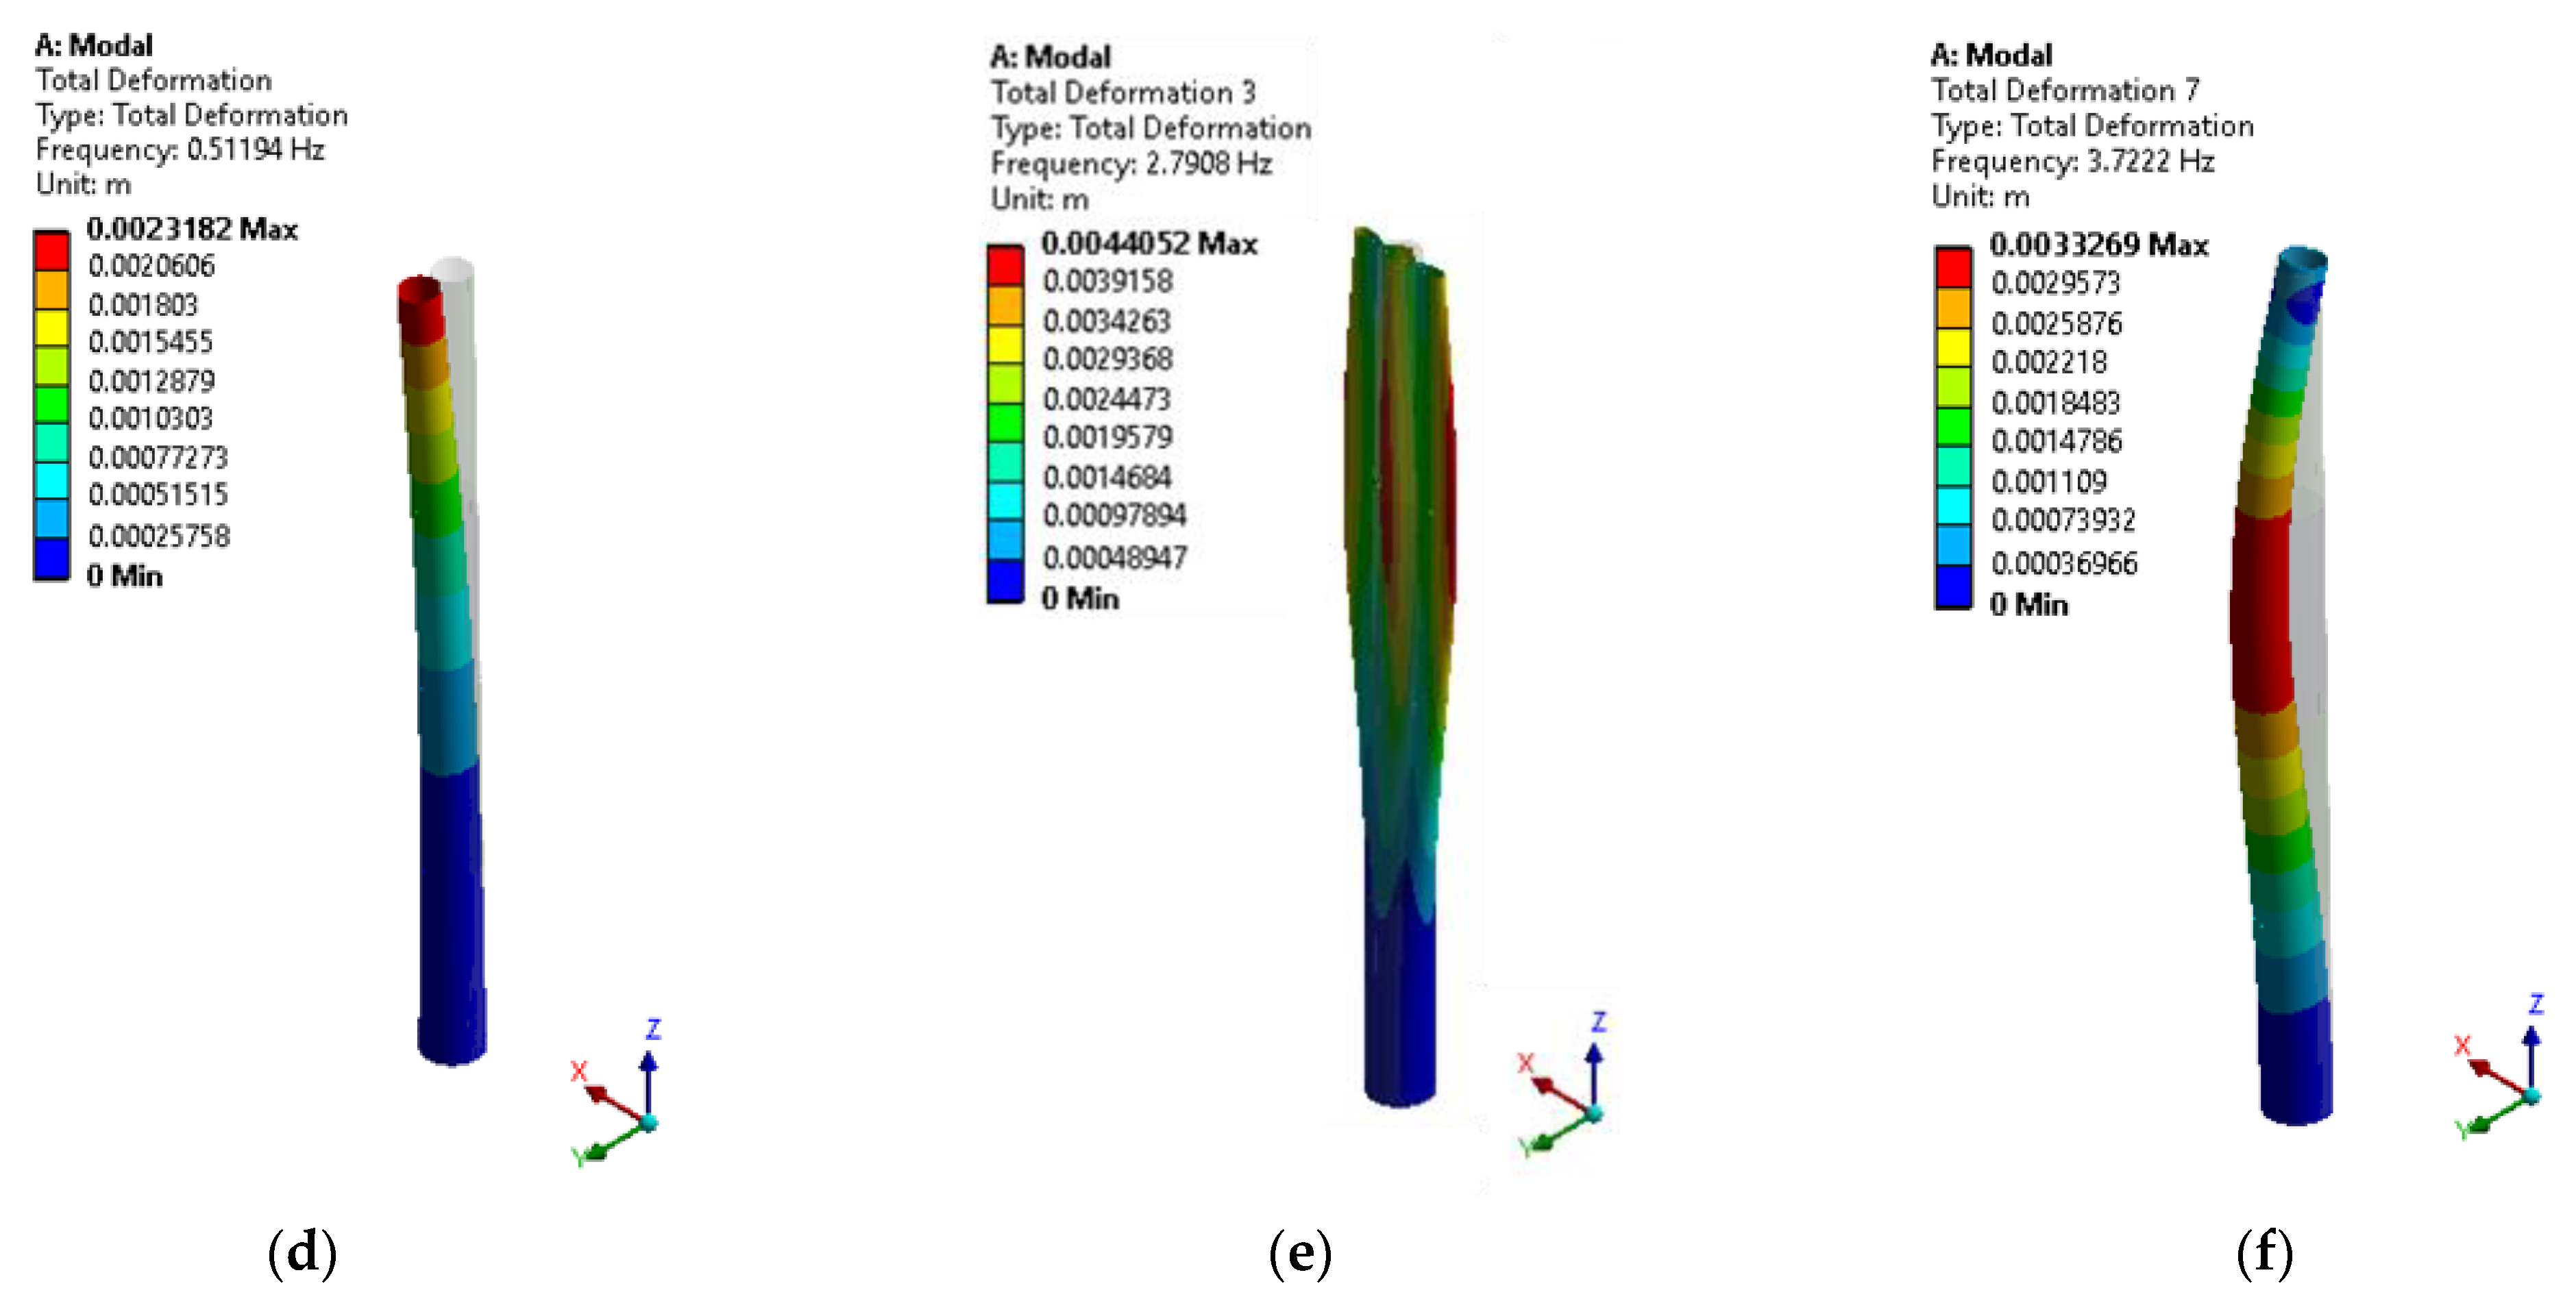
| Conical | 1 | 0.50980 | 0.51150 | 0.51194 | 0.51206 |
| 2 | 0.51066 | 0.51174 | 0.51199 | 0.51207 | |
| 3 | 2.89480 | 2.79470 | 2.79080 | 2.79140 | |
| 4 | 2.95560 | 2.79860 | 2.79230 | 2.79200 | |
| 5 | 3.45660 | 3.36670 | 3.36330 | 3.36410 | |
| 6 | 3.51160 | 3.37100 | 3.36490 | 3.36480 | |
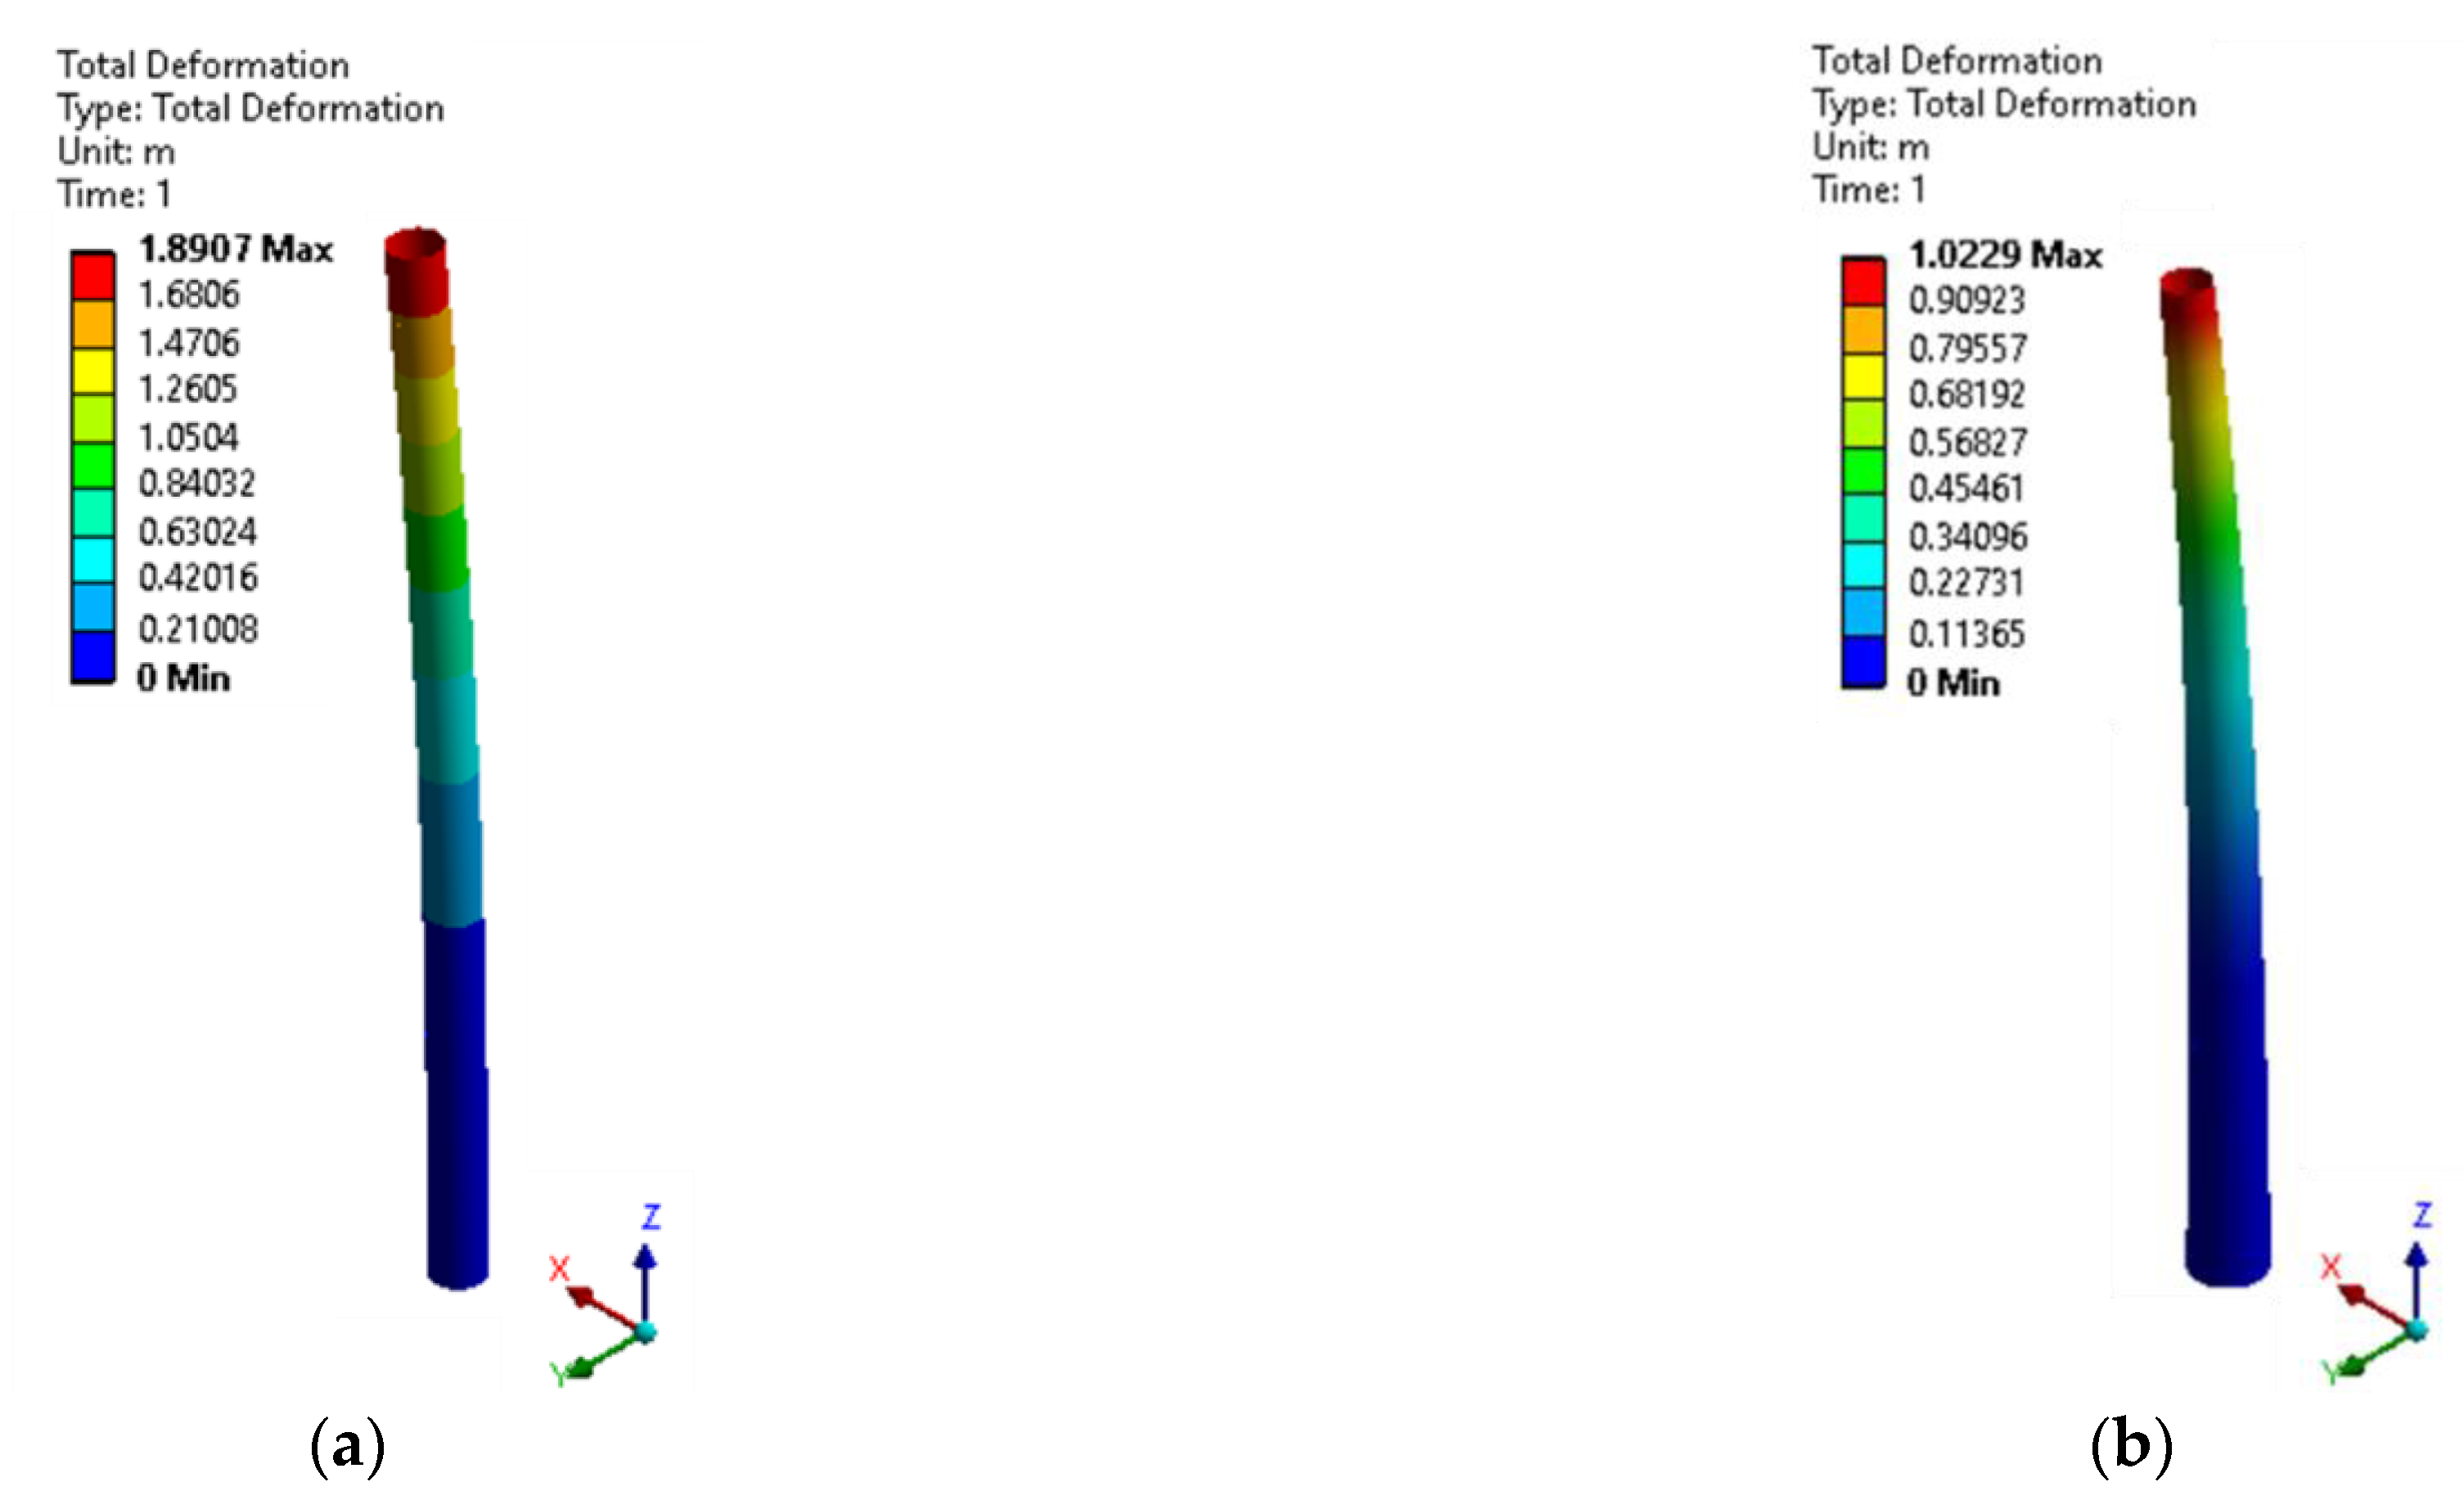
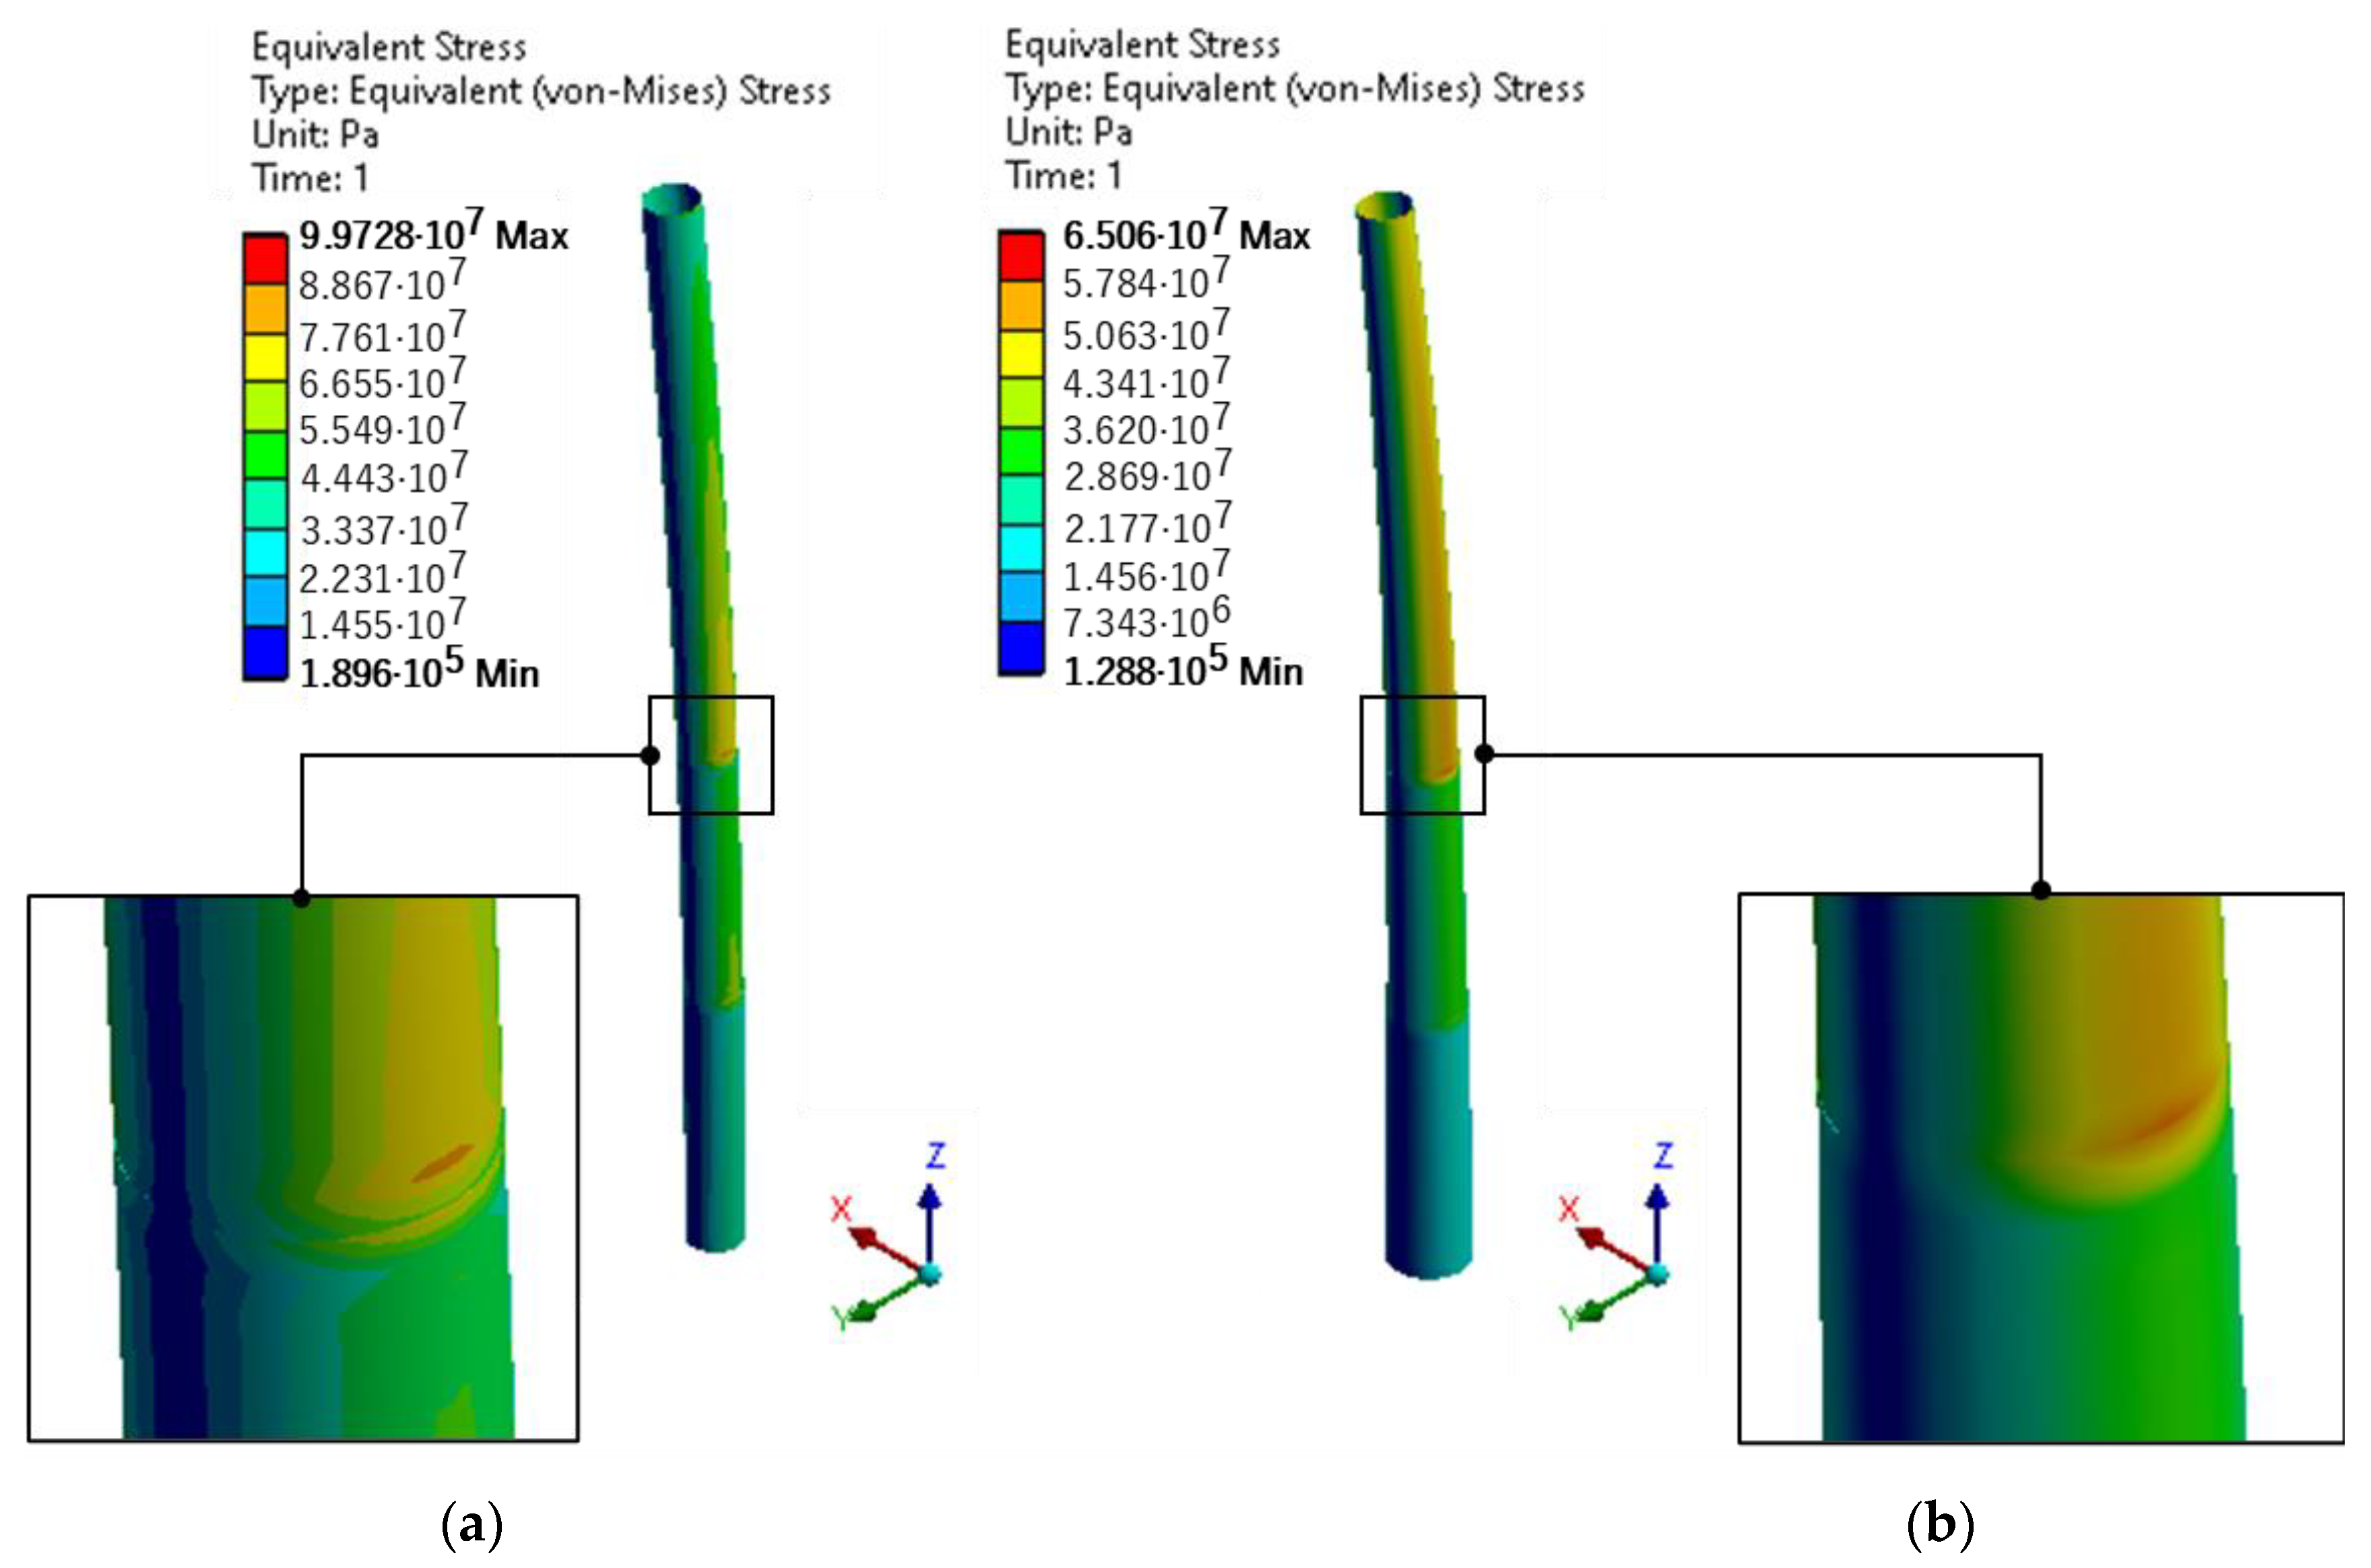
| Type of Tower | Parameters | Baseline | 25% Thickness Reduction | 50% Thickness Reduction |
|---|---|---|---|---|
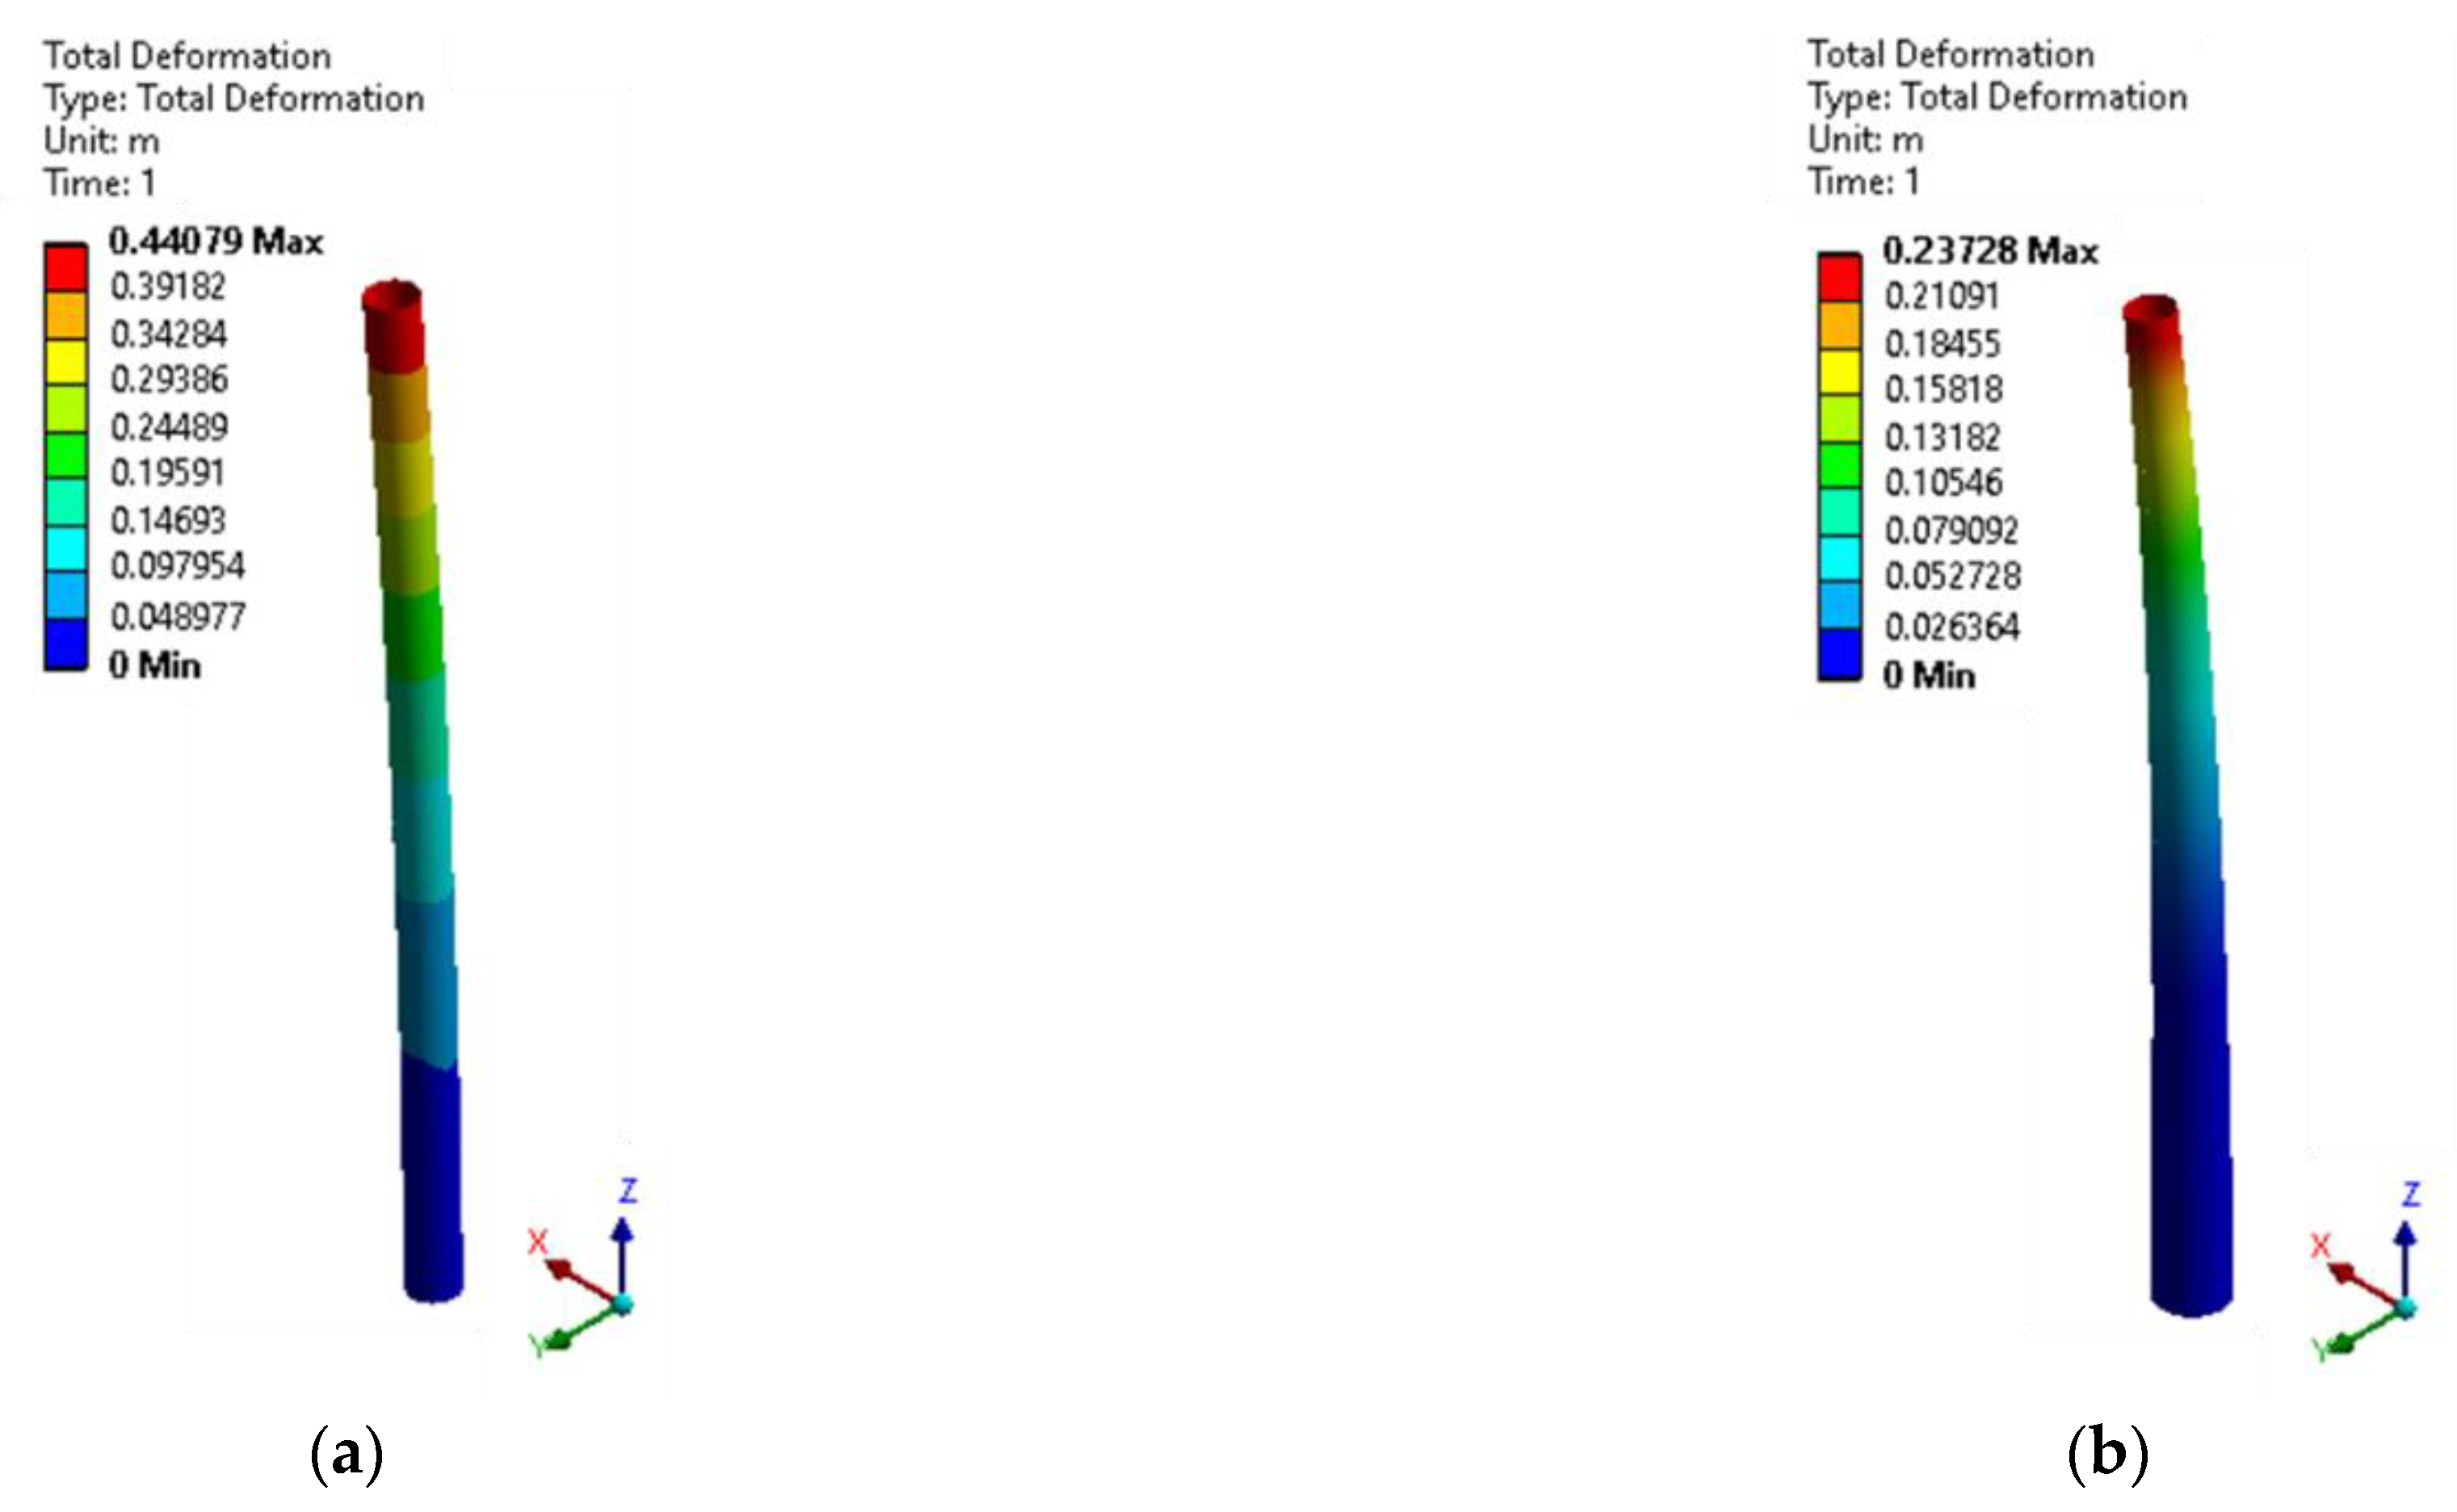
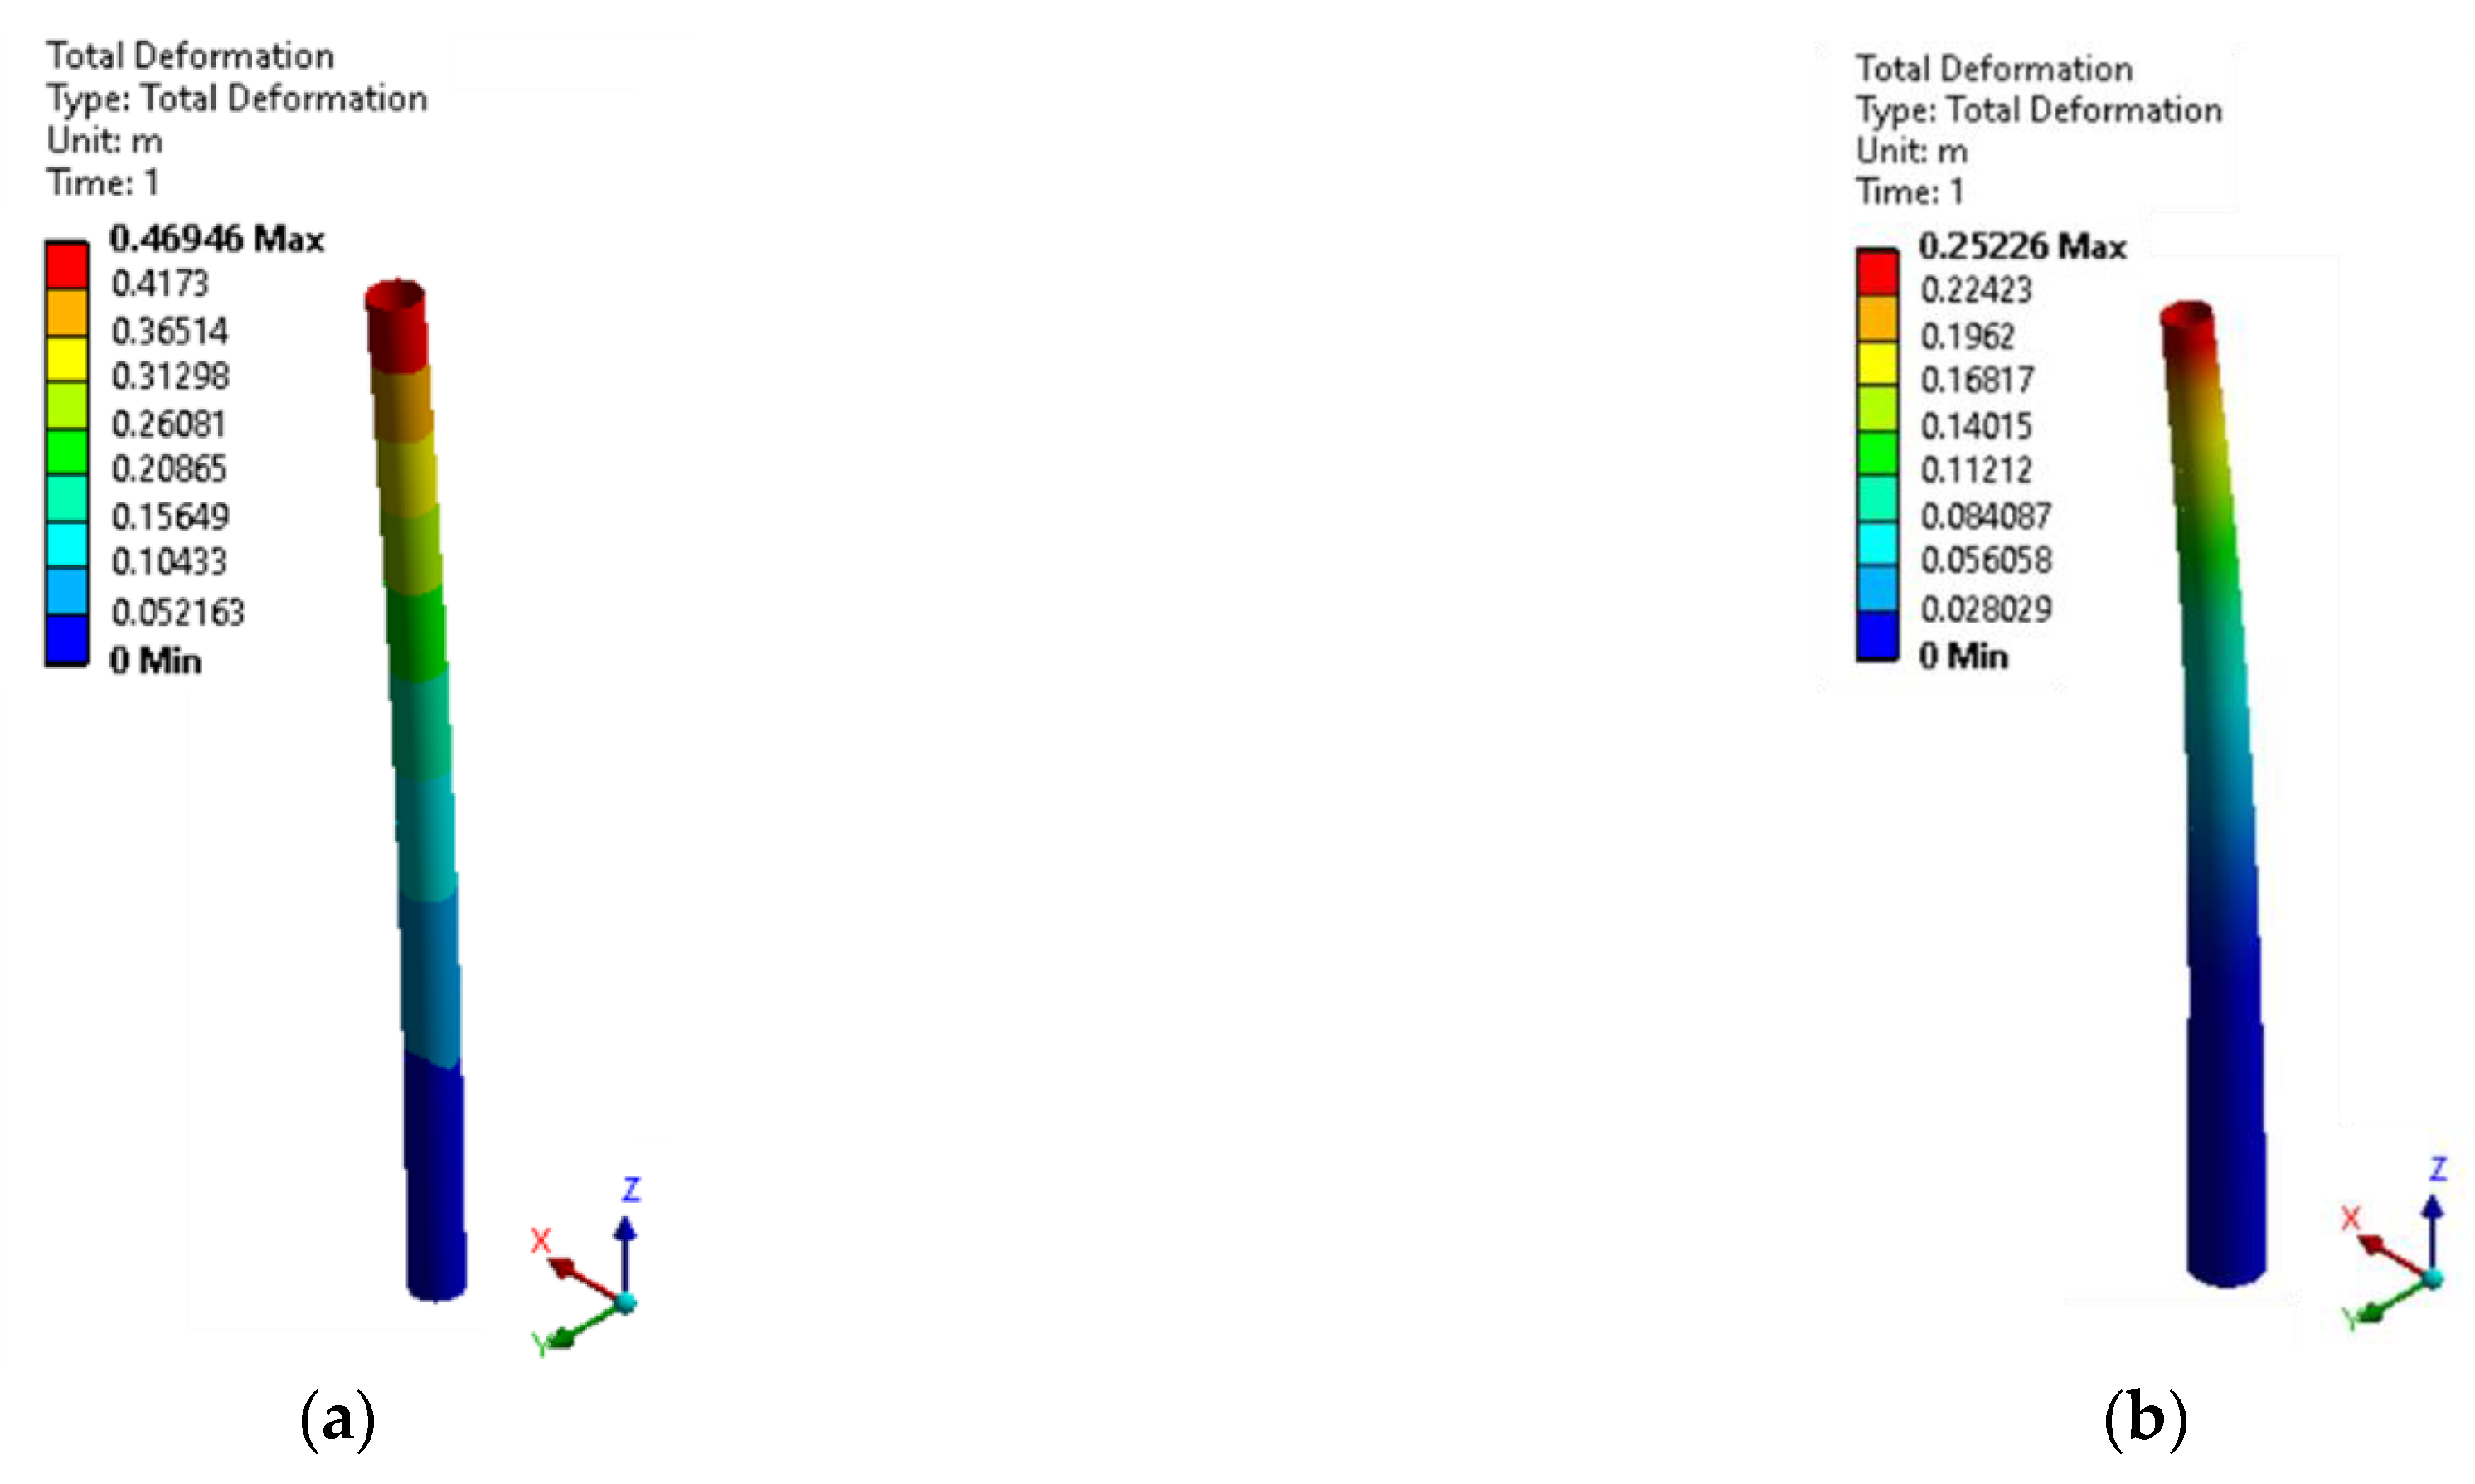
| Cylindrical | Maximum total deformation | 0.46946 m | 0.62205 m | 0.92772 m |
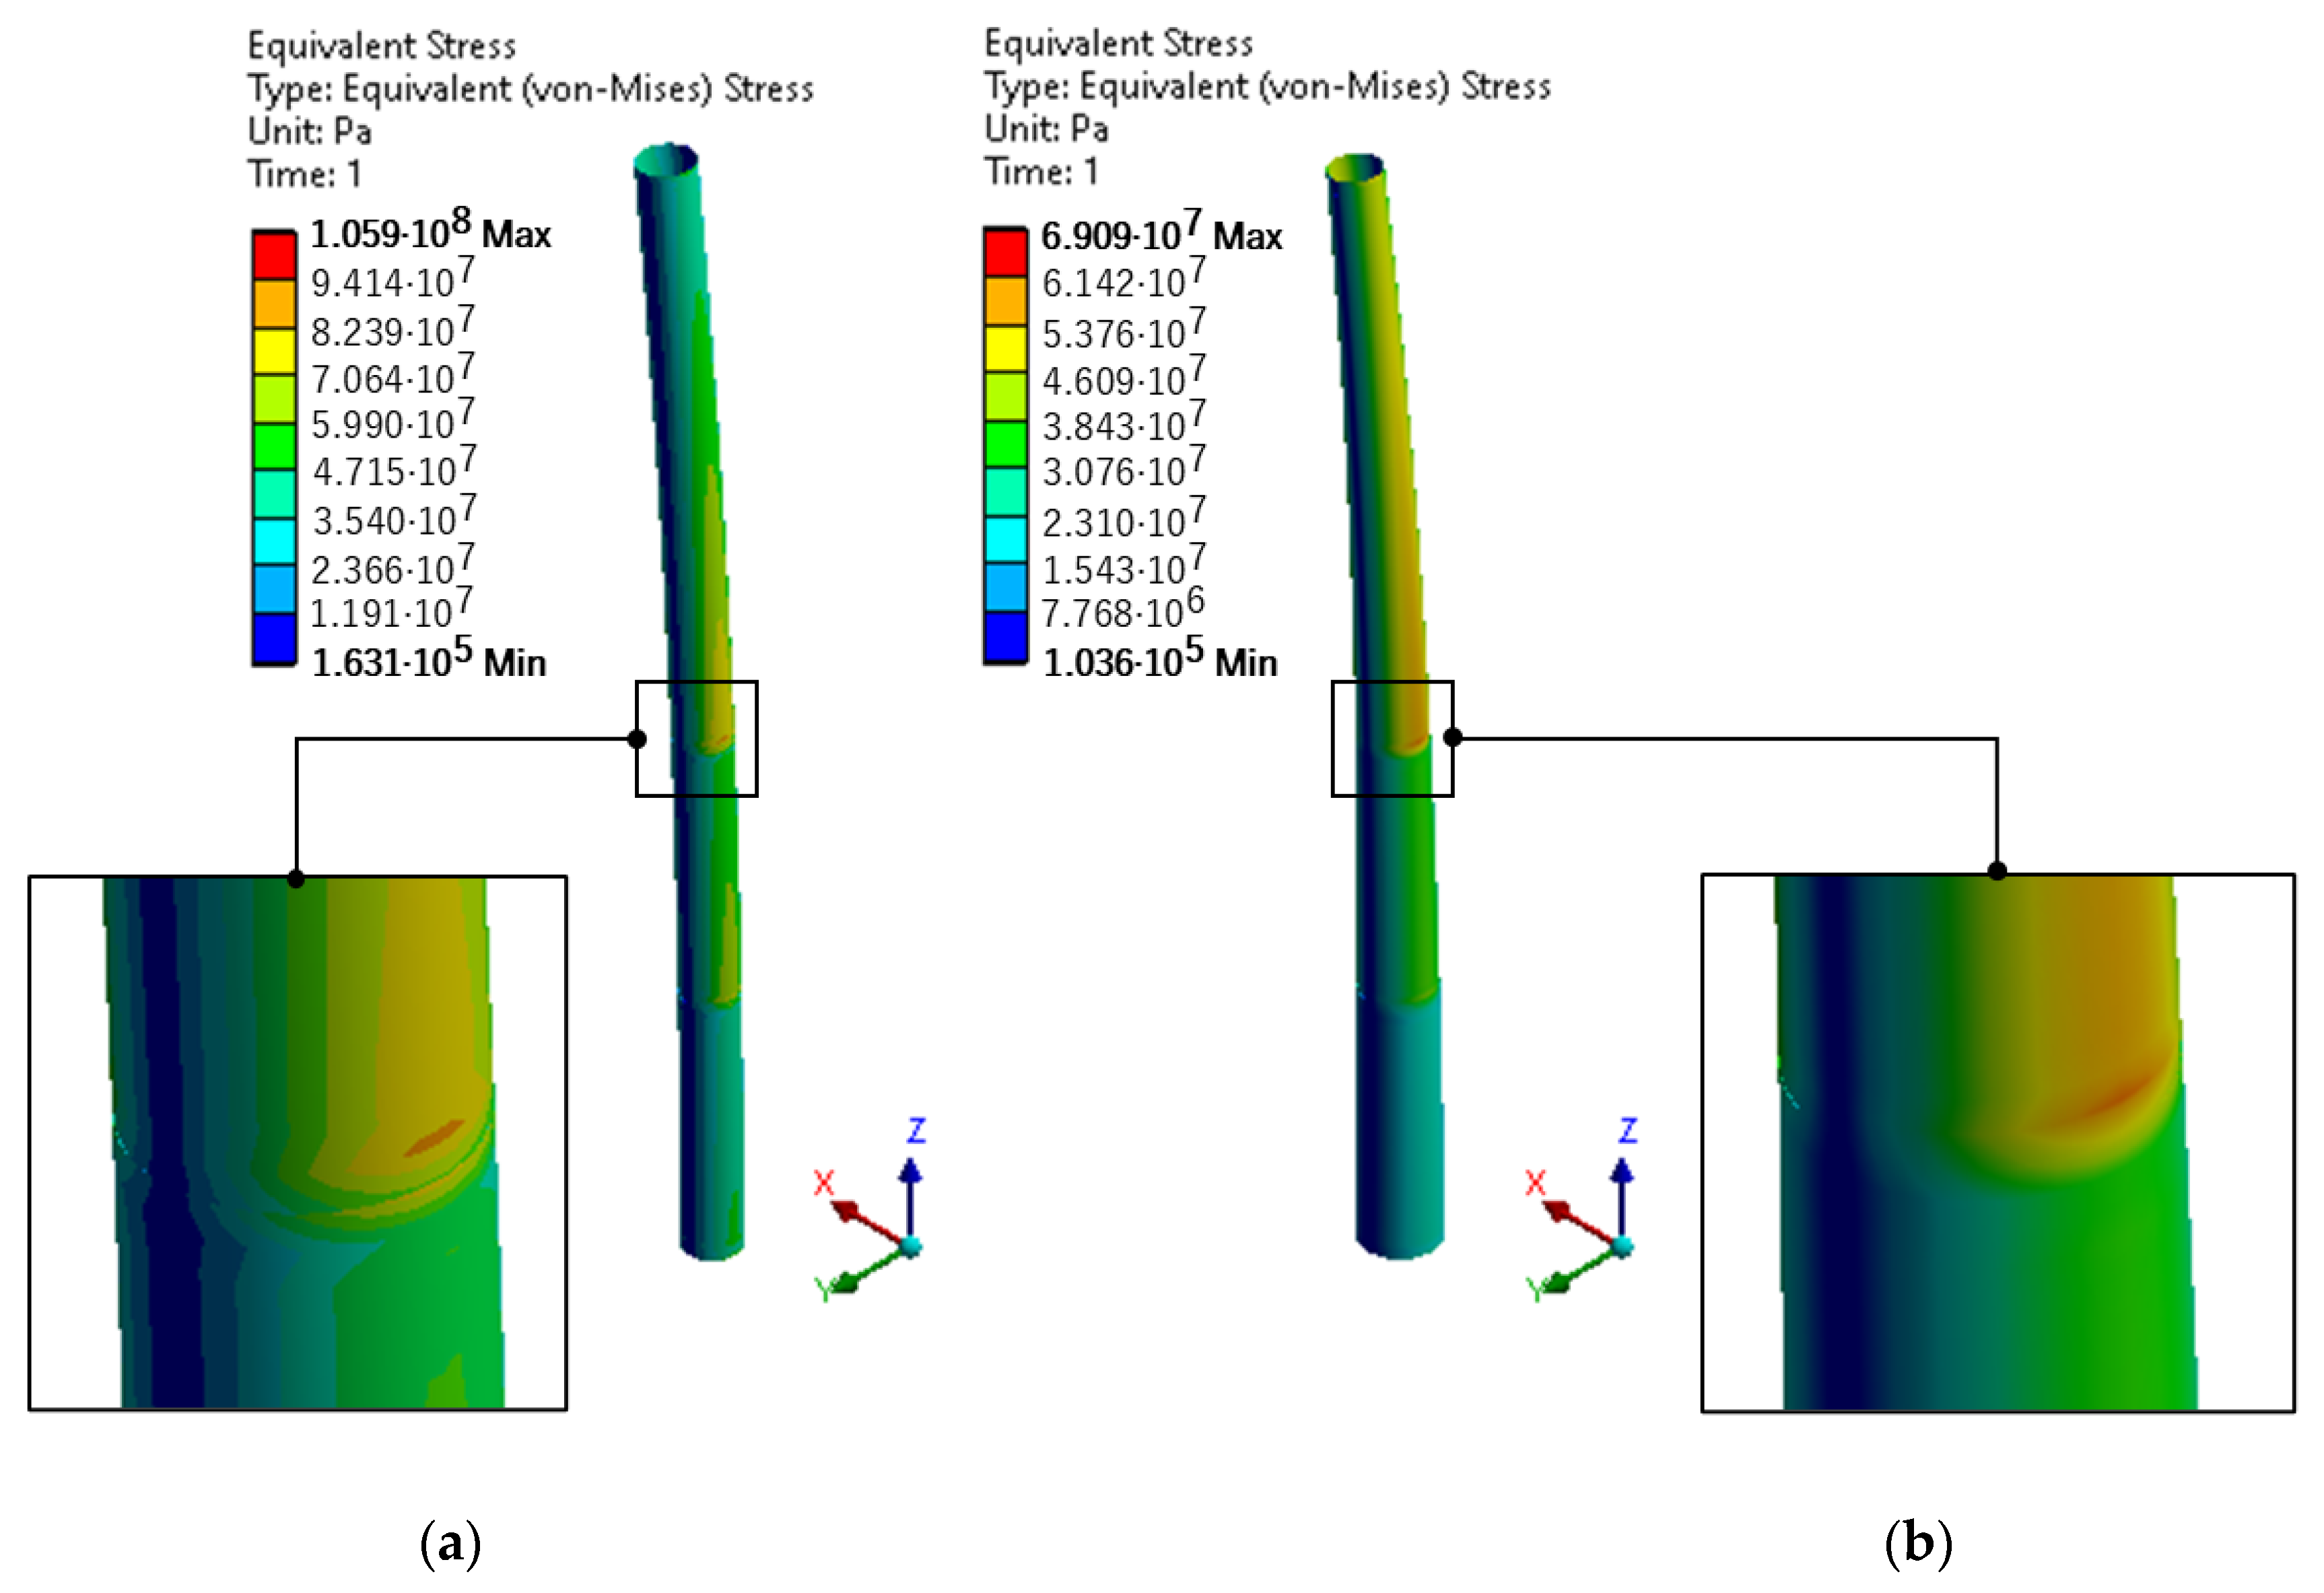
| Maximum von Mises Stress | 105.88 MPa | 138.39 MPa | 200.88 MPa | |
| Minimum von Mises Stress | 0.16311 MPa | 0.38075 MPa | 0.56118 MPa | |
| 1st Natural frequency | 0.36082 Hz | 0.32099 Hz | 0.26951 Hz | |
| Conical | Maximum total deformation | 0.25226 m | 0.32420 m | 0.50011 m |
| Maximum von Mises Stress | 69.086 MPa | 97.276 MPa | 144.02 MPa | |
| Minimum von Mises Stress | 0.10357 MPa | 0.23201 MPa | 0.20016 MPa | |
| 1st Natural frequency | 0.51194 Hz | 0.45413 Hz | 0.38008 Hz |
Publisher’s Note: MDPI stays neutral with regard to jurisdictional claims in published maps and institutional affiliations. |
© 2022 by the authors. Licensee MDPI, Basel, Switzerland. This article is an open access article distributed under the terms and conditions of the Creative Commons Attribution (CC BY) license (https://creativecommons.org/licenses/by/4.0/).
Share and Cite
Diaconita, A.I.; Andrei, G.; Rusu, E. Estimation of the Tower Shape Effect on the Stress–Strain Behavior of Wind Turbines Operating under Offshore Boundary Conditions. Inventions 2022, 7, 11. https://doi.org/10.3390/inventions7010011
Diaconita AI, Andrei G, Rusu E. Estimation of the Tower Shape Effect on the Stress–Strain Behavior of Wind Turbines Operating under Offshore Boundary Conditions. Inventions. 2022; 7(1):11. https://doi.org/10.3390/inventions7010011
Chicago/Turabian StyleDiaconita, Alexandra Ionelia, Gabriel Andrei, and Eugen Rusu. 2022. "Estimation of the Tower Shape Effect on the Stress–Strain Behavior of Wind Turbines Operating under Offshore Boundary Conditions" Inventions 7, no. 1: 11. https://doi.org/10.3390/inventions7010011
APA StyleDiaconita, A. I., Andrei, G., & Rusu, E. (2022). Estimation of the Tower Shape Effect on the Stress–Strain Behavior of Wind Turbines Operating under Offshore Boundary Conditions. Inventions, 7(1), 11. https://doi.org/10.3390/inventions7010011