Article

Estimation of the Tower Shape Effect on the Stress–Strain Behavior of Wind Turbines Operating under Offshore Boundary Conditions

by
Alexandra Ionelia Diaconita
*,
Gabriel Andrei
and
Eugen Rusu
Department of Mechanical Engineering, Faculty of Engineering, “Dunarea de Jos” University of Galati, 47 Domneasca Street, 800008 Galati, Romania
*
Author to whom correspondence should be addressed.
Inventions 2022, 7(1), 11; https://doi.org/10.3390/inventions7010011
Submission received: 8 November 2021 / Revised: 4 December 2021 / Accepted: 3 January 2022 / Published: 7 January 2022

Abstract

:
The metal tower, or the pylon, is one of the most important elements in the construction of a wind turbine. It has the role of supporting the entire wind turbine, and it also allows access for inspection and conducting planned maintenance and repairs. Moreover, the tower ensures support for the structure and strengthens the whole assembly. It has a particularly important role, as it has to face very severe weather conditions. The present study aims to analyze the forces and moments resulting from the action of the wind on the tower of a wind turbine. Two important load cases are considered, namely, the load under operating conditions and the ultimate load under 50 year wind conditions. For this purpose, cylindrical and conical geometric shapes of the tower were chosen. These were analyzed under the action of both normal and extreme wind speeds. Then, the behavior of the two towers under the action of the wind speed for a location in the Black Sea was analyzed. Finally, in an attempt to make the structure more economical, the thickness of the shell was reduced.

1. Introduction

Global warming is a set of changes that affect the planet. Among them is an increase in temperature, especially in polar areas, where such an increase has exceeded 3 degrees Celsius since 1906, while for the rest of Earth, it increased by approximately 0.9 degrees Celsius [1]. Climate change leads to melting glaciers, the occurrence of extreme weather events, rising water levels, impacts on animal habitats, the extinction of several animal species, and many other effects. In addition to the negative effects on the environment, greenhouse gas emissions also harm human health [2], resulting in respiratory diseases caused by pollution and smog [3].
Reducing greenhouse gas emissions is a point of interest in the 21st century because of the negative effects caused by the exploitation of conventional resources to produce electricity. Carbon dioxide is responsible for approximately three-quarters of greenhouse gas emissions, which can remain in the atmosphere for thousands of years. These emissions have gradually increased, and in 2021, they reached a value of 33 Gt CO2, despite the significant decrease that was noticed in 2020 (having a value of 31.5 Gt CO2), which was considered the largest decrease recorded globally, even exceeding the decline in 2009 when the global financial crisis hit [4]. Due to the pandemic, not only have CO2 emissions decreased, but energy demand has also fallen the most since World War II and to date, decreasing by approximately 4.5% [5].
One of the best ways to eliminate greenhouse gas emissions is to replace the sources that produce the highest amounts of CO2. Globally, the sources producing the highest amounts of CO2 emissions are the burning of materials such as coal, oil, gas, and wood to obtain energy. Therefore, attention has focused on renewable resources [6] that have lately gained increasing importance. According to the International Renewable Energy Agency (IRENA) [7], the installed capacity from renewable sources increased by 10% in 2020, having the largest increase so far despite the COVID-19 pandemic. Currently, the total installed capacity reaches a value of 2799 GW, the highest percentage of which is allocated to the hydraulic renewable energy sector (approximately 44% of the total installed capacity) [8]. This spectacular growth makes the renewable energy sector the new normal in the 21st century, and it is expected to add more than 280 GW by the end of 2021. In addition, the energy generated in the first quarter of 2021 sustains the idea of eliminating conventional sources, and energy from fossil fuels and that from renewable sources recorded the same value of 34.7 TWh [9]. In terms of wind energy, this was doubled in 2020 compared to 2019 due to the technological advances in wind turbines. The offshore industry aims to exploit deeper waters where wind speeds are higher. Currently, there are wind farms located with the help of floating structures in waters with depths over 100 m [10]. Apart from the desire to advance as far as possible, the design of higher capacity turbines is also expected with the largest offshore turbine being Haliade-X at 14 MW. Obtaining high power is closely related to turbine components such as large rotors and high towers. Compared to onshore wind turbines, offshore wind turbines do not require very high towers, for instance, a height of 22 m between the lowest point of the rotor sweep and the average height of the water springs is quite enough [11]. On the other hand, the towers placed offshore are much more exposed to water corrosion and, for this reason, they must meet specific standards. Through the technological development of wind turbines, such as the growth of the rotor [12,13] and the tendency to place it in the deepest possible waters, the field of offshore renewable energy attracts increasing amounts of investments. Each location implies certain costs; therefore, it is necessary to consider a site-specific design so that the structure lasts approximately 25 years and, thus, the LCOE for each farm may vary [14]. The optimization of a wind turbine according to the weather conditions at a specific location takes into account two aspects. The first aspect is related to the behavior of the structure, and the second aspect refers to the identification of the optimal design variables [15]. In order for wind energy to be competitive with renewable energy sources, the trend is to optimize these already developed structures so that costs are minimized [16]. Among the methods for optimizing the tower of a wind turbine is the replacement of conventional materials, i.e., steel with carbon or glass fiber. These materials improve fatigue performance and have better corrosion resistance [17,18,19]. Another method of minimizing costs is to reduce the thickness of the shell and reduce the number of ring-stiffeners [20].
Since the towers for wind turbines of no more than 4 MW have diameters between 3 and 5 m, the present study aimed to analyze the behavior of two types of towers, one circular and one conical, under the action of the same environmental conditions. The forces and moments applied on the two towers were given only by the wind speed and the weight of the components that were part of the wind turbine, and those given by the waves were omitted. The structure was divided into four sections of different thicknesses. In addition, we considered the wind speed from a location in the west of the Black Sea, close to the Romanian nearshore. For this purpose, the wind data were taken from the EURO-CORDEX database and then processed using a MATLAB computational environment. From this data, the maximum and average wind speeds were taken into consideration to provide a more comprehensive image of the wind potential from the reference point considered. Then, a study was performed to analyze the behavior of the two structures under the action of the maximum wind. The possibility of reducing the thickness of the two towers by 25% and 50%, respectively, was also considered.
Similar studies were conducted by Lin Wang et al. [21] in a paper entitled “Structural Optimization of Wind Turbine Towers Based on Finite Element Analysis and Genetic Algorithm”, and they conducted a structural analysis on an 87.6 m tower using as a reference the 5 MW turbine designed by NREL (National Renewable Energy Laboratory) [22], with the final goal of this work being to optimize the tower. Another study dealing with this subject is that of Zhu Rensheng et al. [23], who performed a finite element analysis on a turbine with a horizontal axis of 1.5 MW with the tower having a conical construction. A similar study was conducted by Chile Li and Limin Ren [24], who carried out a finite element analysis also for a 1.5 MW turbine. The two cases studied took into account both normal and storm conditions to establish whether the structures were safe. The analyses showed that the structures were sufficiently secure, and there was no strength failure. Yadneshwar S. Joshi and Pratibha Alandkar [25] conducted a study with the purpose of performing a finite element analysis of the tower but also of the connections between the sections of the tower in order to understand exactly how these connections behave under the action of environmental forces. The analysis was performed on a conical tower that was divided into 16 sections and which had a height that was considered to be 80. For this study, a Suzlon S88-2.1 MW turbine was considered.

2. Materials and Methods

2.1. Characteristics of the Wind Turbine and Tower

The turbine chosen for this study was a Vestas V112-3 MW which corresponds to IEC Class I. This type of wind turbine has a horizontal axis, with an upwind orientation. The turbine is equipped with a rotor with three blades that are controlled by a microprocessor pitch control system. The characteristics of the turbine are presented in Table 1 and Figure 1.
The material characteristics of the Vestas V122-3 MW turbine tower are given in Table 2.
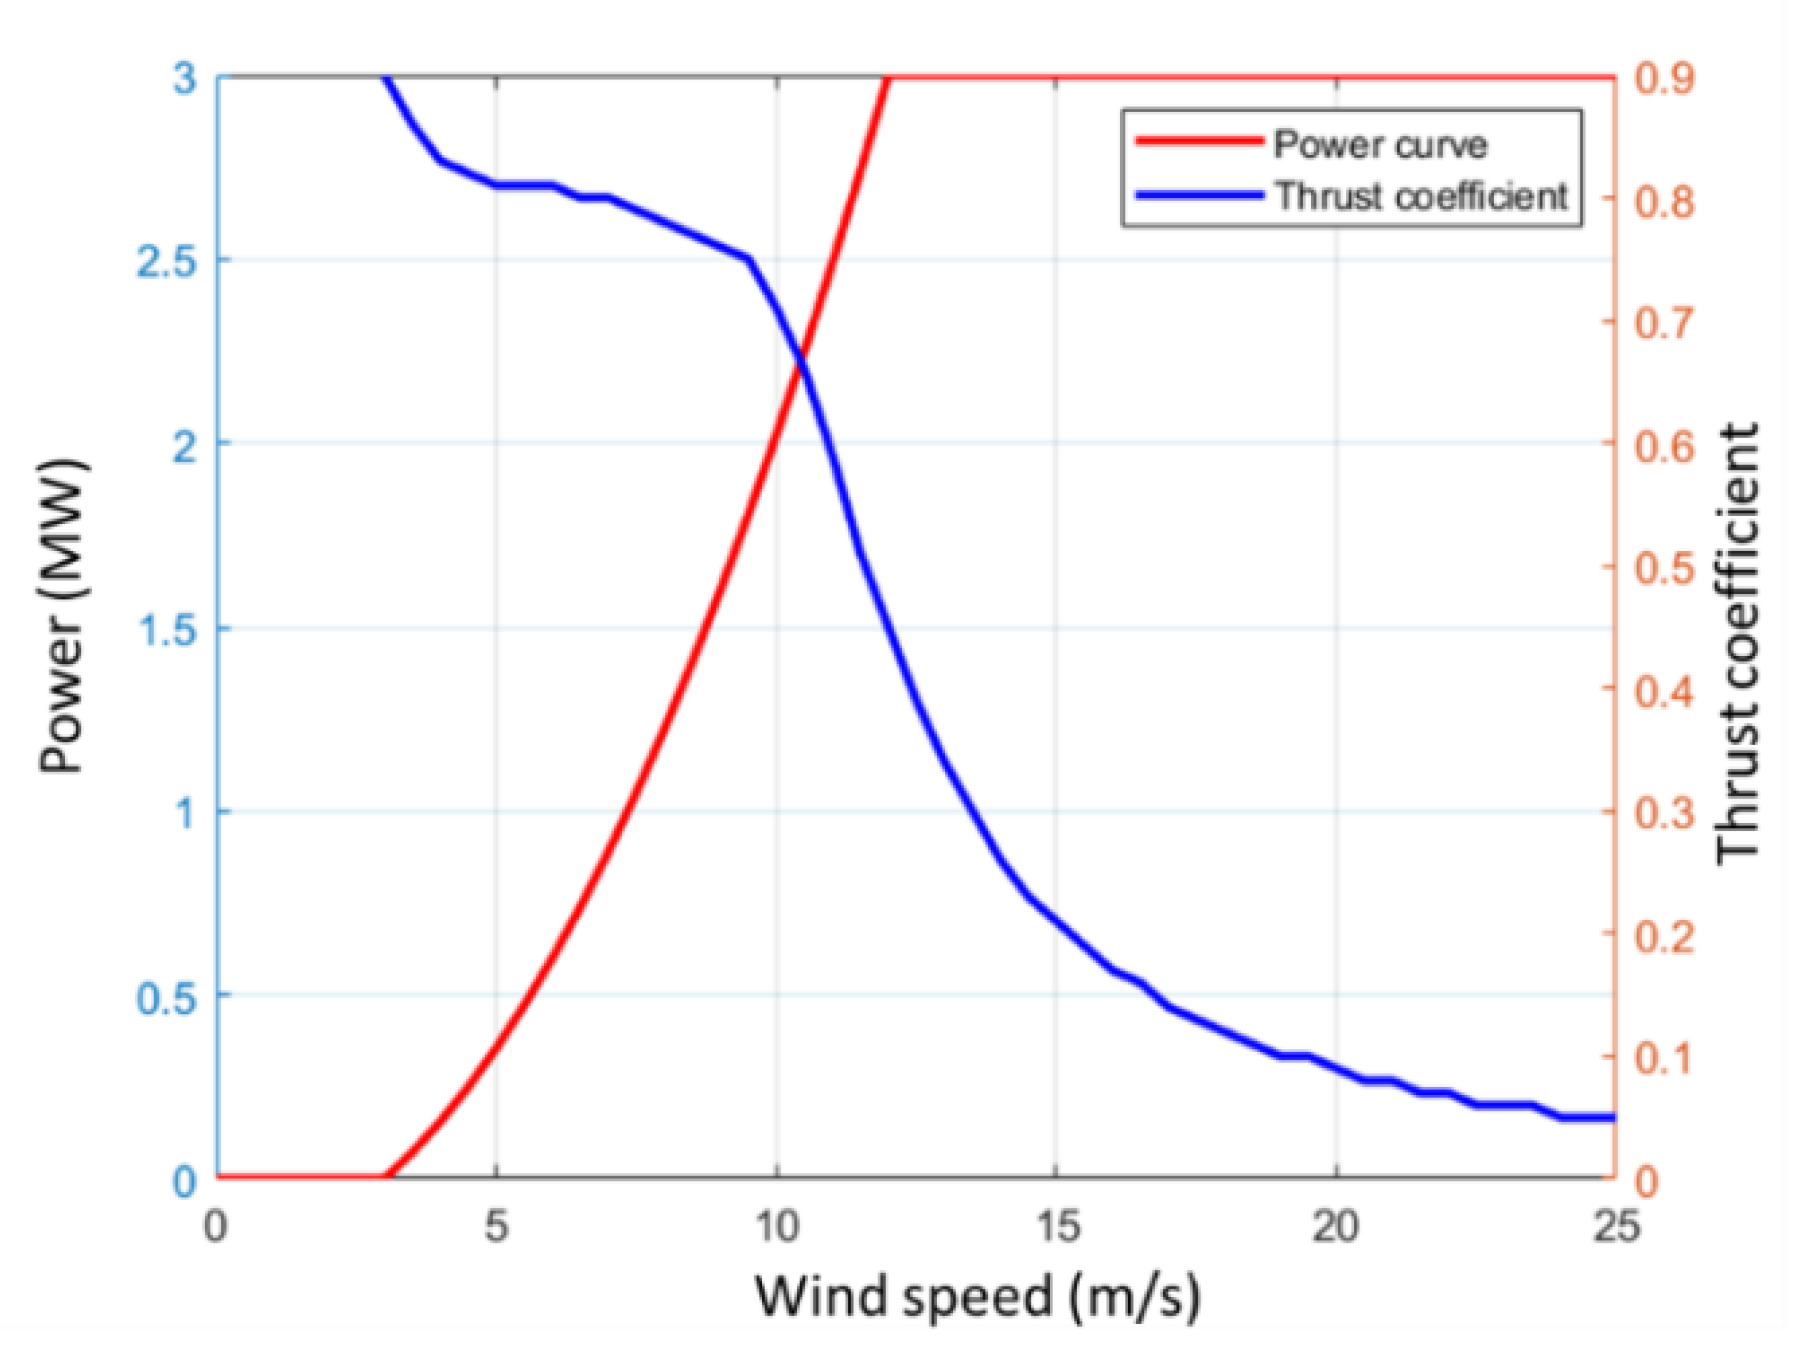
The power curve and the thrust coefficient are presented in Figure 2. The power curve shows how much power can be generated under the action of a certain wind speed. The power curve in Figure 2 was obtained using a quadratic equation that is related to the wind speed [26,27].
P wg ( V ) = { q ( V ) P r 0 V cin < V < V rat V rat < V < V cou V V cin   and   V V cou q ( V ) = P r V 2 - V cin 2 V rat 2 - V cin 2
where V (in m/s) is the wind speed at the height of 84 m, Vcin (in m/s) is the cut-in wind speed (having the value of 3 m/s), Vcou (in m/s) is the cut-out wind speed (having the value of 25 m/s), Vrat (in m/s) is the rated wind speed (having the value of 12 m/s), and Pr is the rated power in MW.

2.2. Basic Assumptions

  • The tower was considered to be a cantilevered beam that was fixed to the structure. At the top, a mass was applied that was equal to the mass of the nacelle, blades, and rotor;
  • The material of the tower was considered to be isotropic and homogeneous. One tower had a constant circular section along the height, and the other one had a decreasing section from the base to the top, and both of them featured small wall thicknesses;
  • The secondary effects (such as axial and shear deformations and moment of inertia) were neglected;
  • The aerodynamic distributed loads were caused only by drag forces.

2.3. Loads Calculation

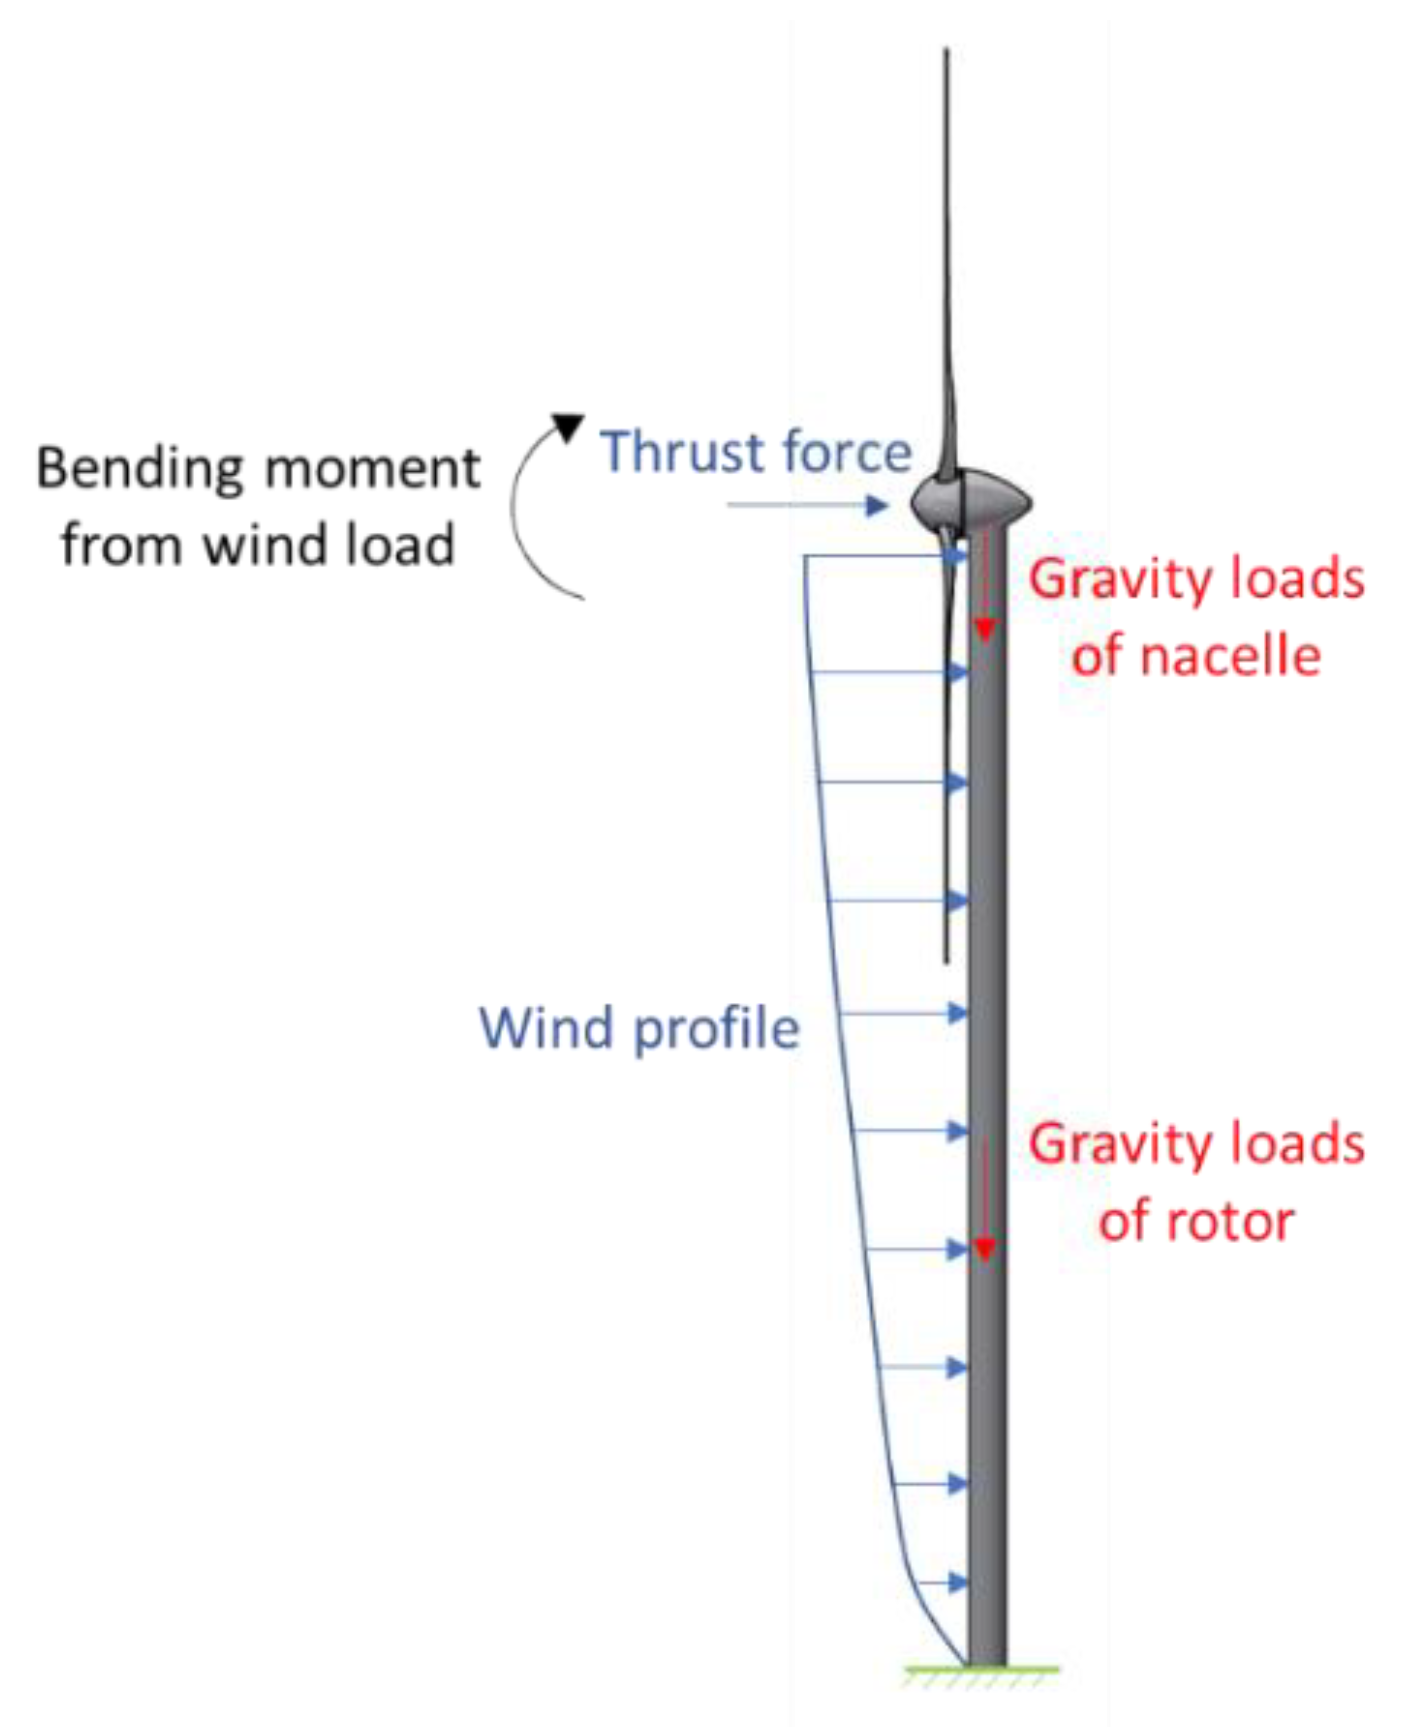
The main loads acting on the tower were gravitational loads and aerodynamic loads given by the action of the wind, which can be drag and lift forces. The aerodynamic loads were grouped into two categories: those that act directly on the tower and those that act on the rotor and are further transferred to the upper part of the tower [28]. The forces and moments acting on the turbine are illustrated in Figure 3.

2.3.1. Gravitational Loads

The gravitational loads are given by the weight of the supported components. These components are the nacelle, rotor, and blades. Their approximate weight was 155 tons. This load contributed to the compression loads on the tower’s structure. The representation was made with the help of a mass point at the top of the tower.

2.3.2. Aerodynamic Loads

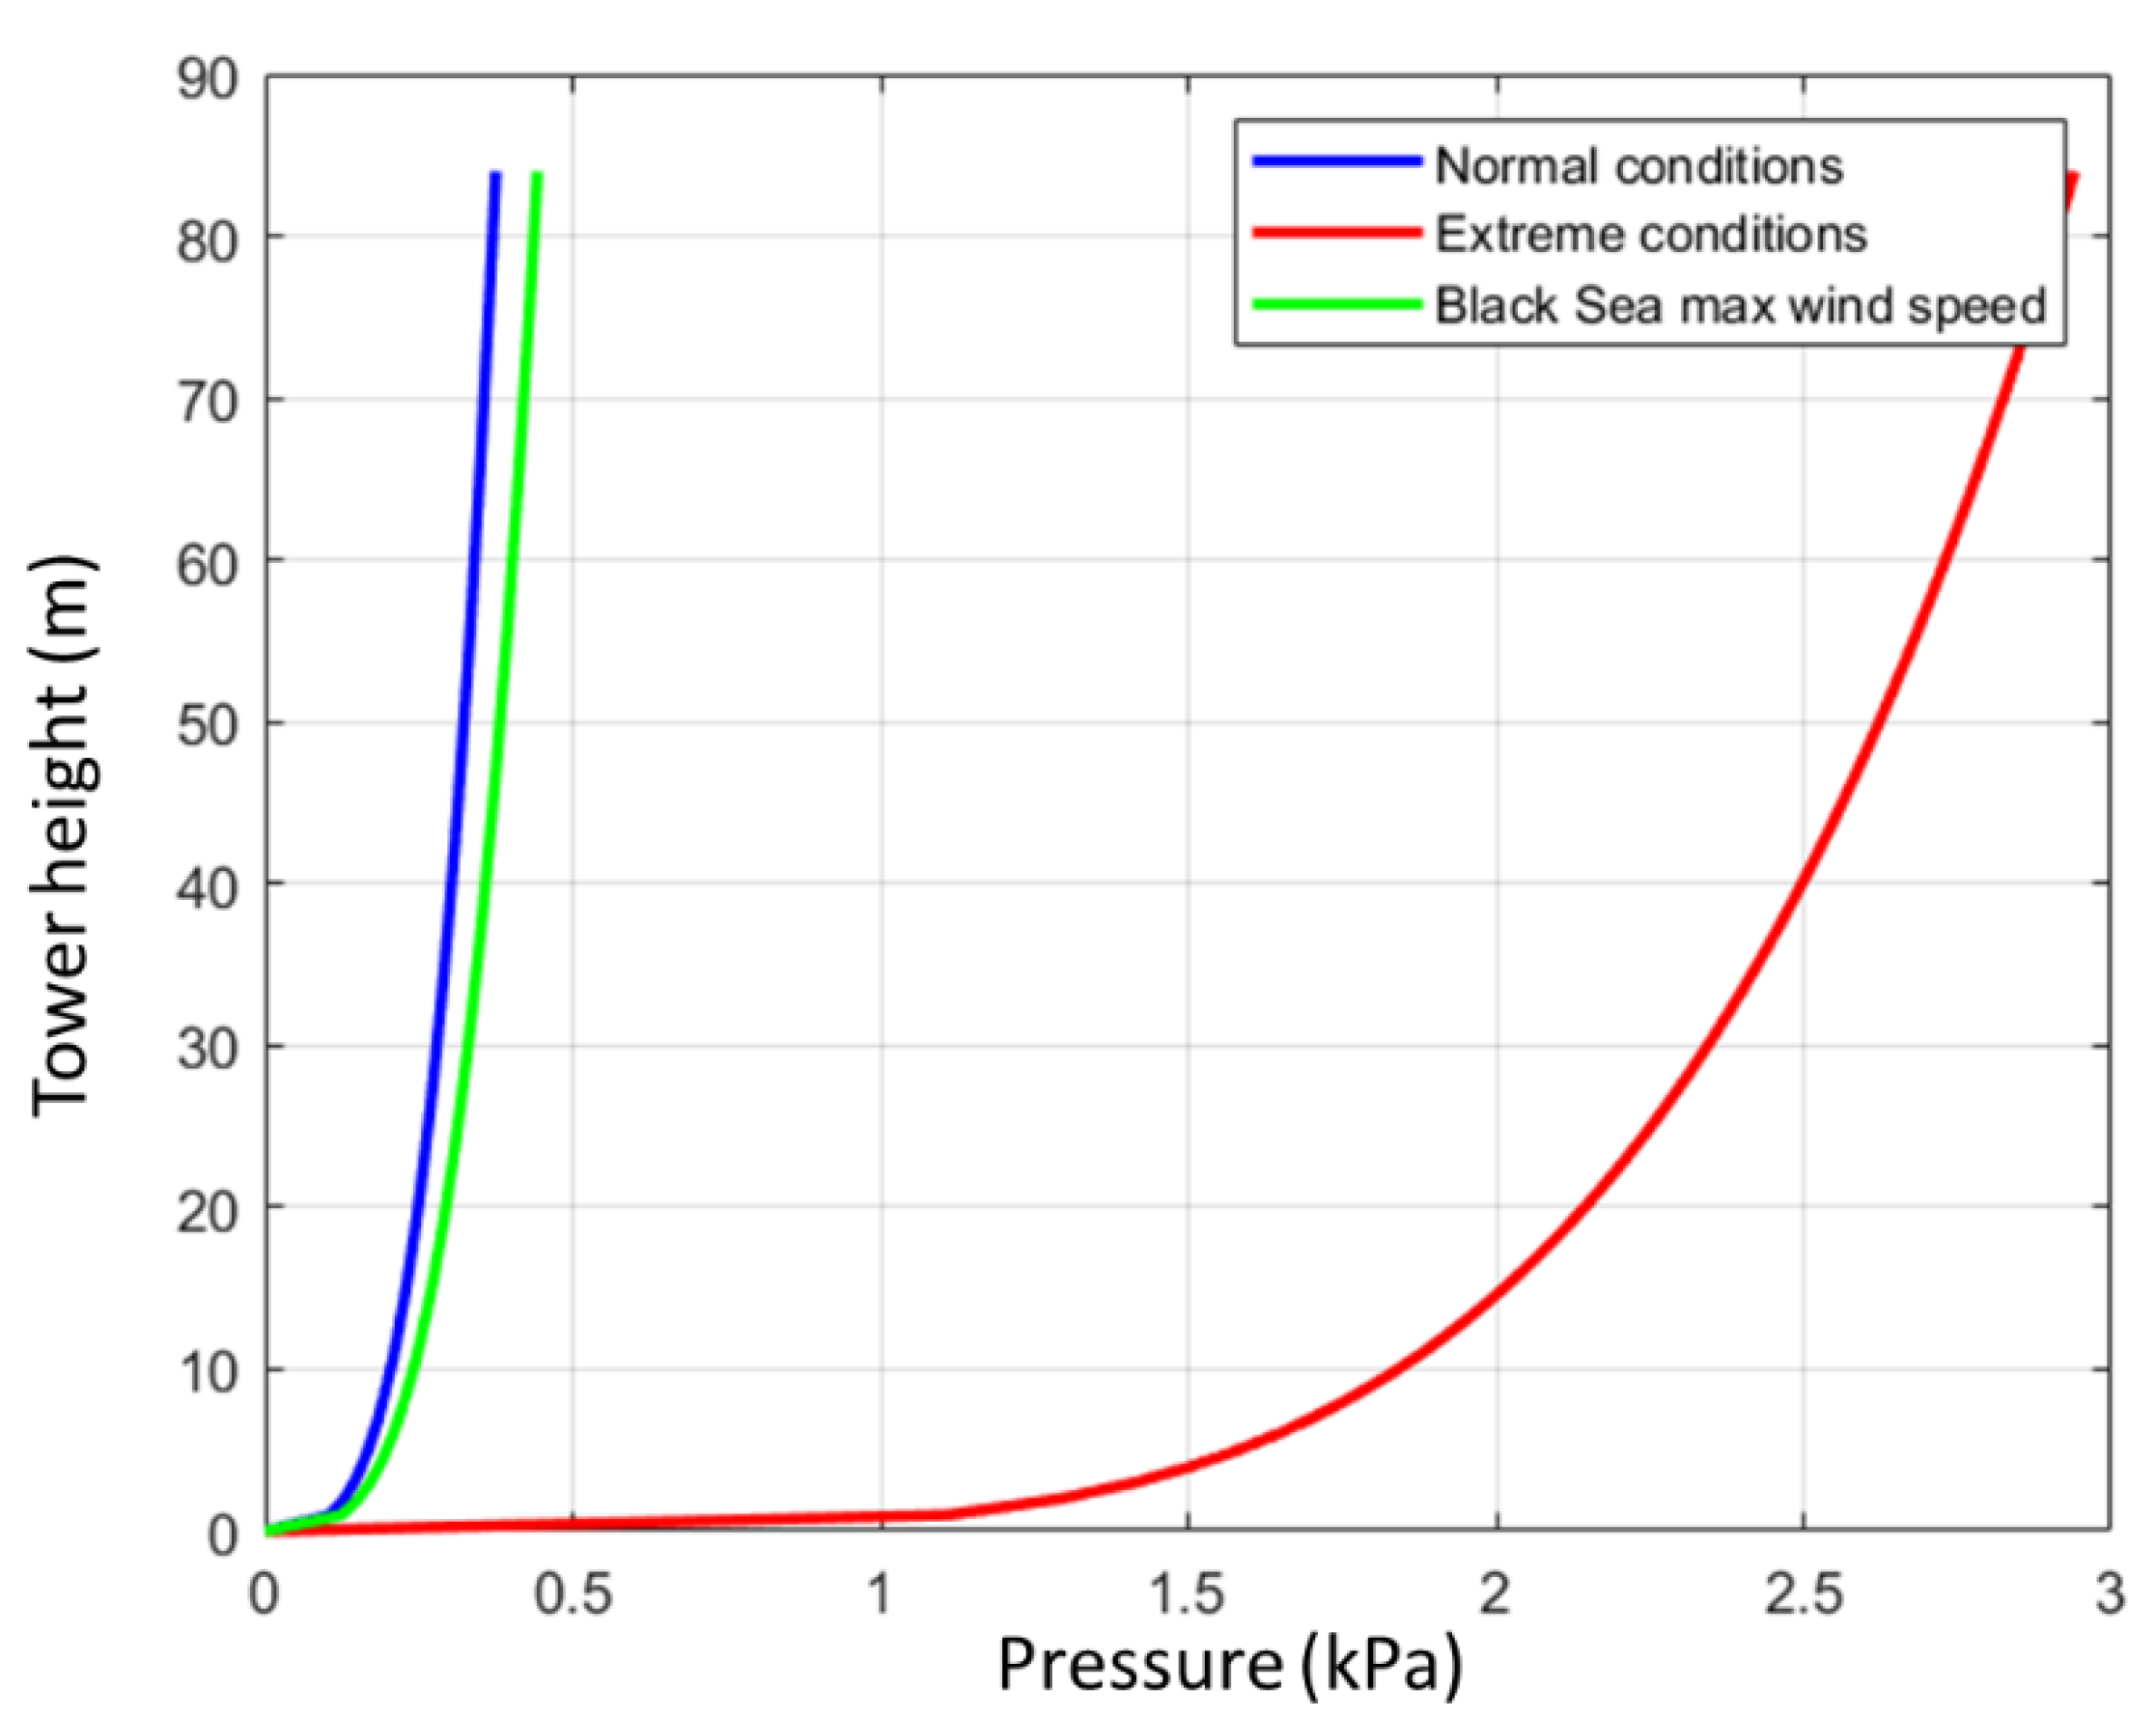
The wind loads acting on the tower arise due to the airflow and its interaction with the wind turbine tower. The distributed wind load along the tower height per unit length, z, can be calculated using the following formula (Figure 4) [29,30]:
F d = 1 2 ρ V ( z ) 2 C d D ( z )
where ρ is the air density (having the value of 1.225 kg/m3), V(z) is the wind velocity at height z (in m/s), Cd is the drag coefficient (this parameter has a value of 0.7).
As the wind speed varies along the tower height, under normal wind conditions, the wind will be calculated using the following formula [31]:
V ( z ) =   V hub ( z z hub ) α
where Vhub is the reference wind speed in m/s at height zhub (the hub height), and α is the power law exponent (this parameter is also known as the Hellman exponent) [32,33]. The value of this coefficient was estimated to be 1/7 (approximately 0.143) [34] and evaluates the wind profile under normal weather conditions.
For the extreme wind model, the wind was calculated using the formula below, which was according to the IEC 61400-1 standard [35]:
Ve50 = 1.4·Vref
Offshore wind turbines are classified depending on wind speed and turbulence parameters, according to the IEC standard. In the above formula, Ve50 is the expected extreme wind speed with a recurrence time interval of 50 years (in m/s). The chosen turbine belongs to class IEC Ia, and according to the standard, the reference speed Vref is 50 m/s.
Using the wind profile power law, the equation above becomes:
V ( e 50 ) z = 1 . 4 ·   V ref ( z z hub ) α
The Hellman exponent in this case had a value of 0.11 [36], because the value of 0.143 can cause computational errors when it comes to the field of offshore wind energy; therefore, the value of 0.11 was much more suitable for open water.
Apart from the loads that were given by the wind on the tower, its upper part was also affected by a series of forces and moments given by the action of the wind on other components of the turbine assembly [37]. The IEC61400-1 [35] design standard defines twenty-two load cases for turbine design, covering all operating conditions, from start-up to extreme conditions. The typical cases used were those in extreme wind conditions and those in normal operating conditions. The aerodynamic force given by the action of the wind on the rotor can be calculated using the formula [24,38]:
F x = 1 2 C T ρ V 2 A
where CT is the thrust coefficient, ρ is the air density (having the value of 1.225 kg/m3), V is the wind speed in m/s, and A is the swept area in m2.

2.4. Analysis of the Behavior of the Two Towers in a Location in the Black Sea and Possibilities to Reduce the Thickness of the Shell

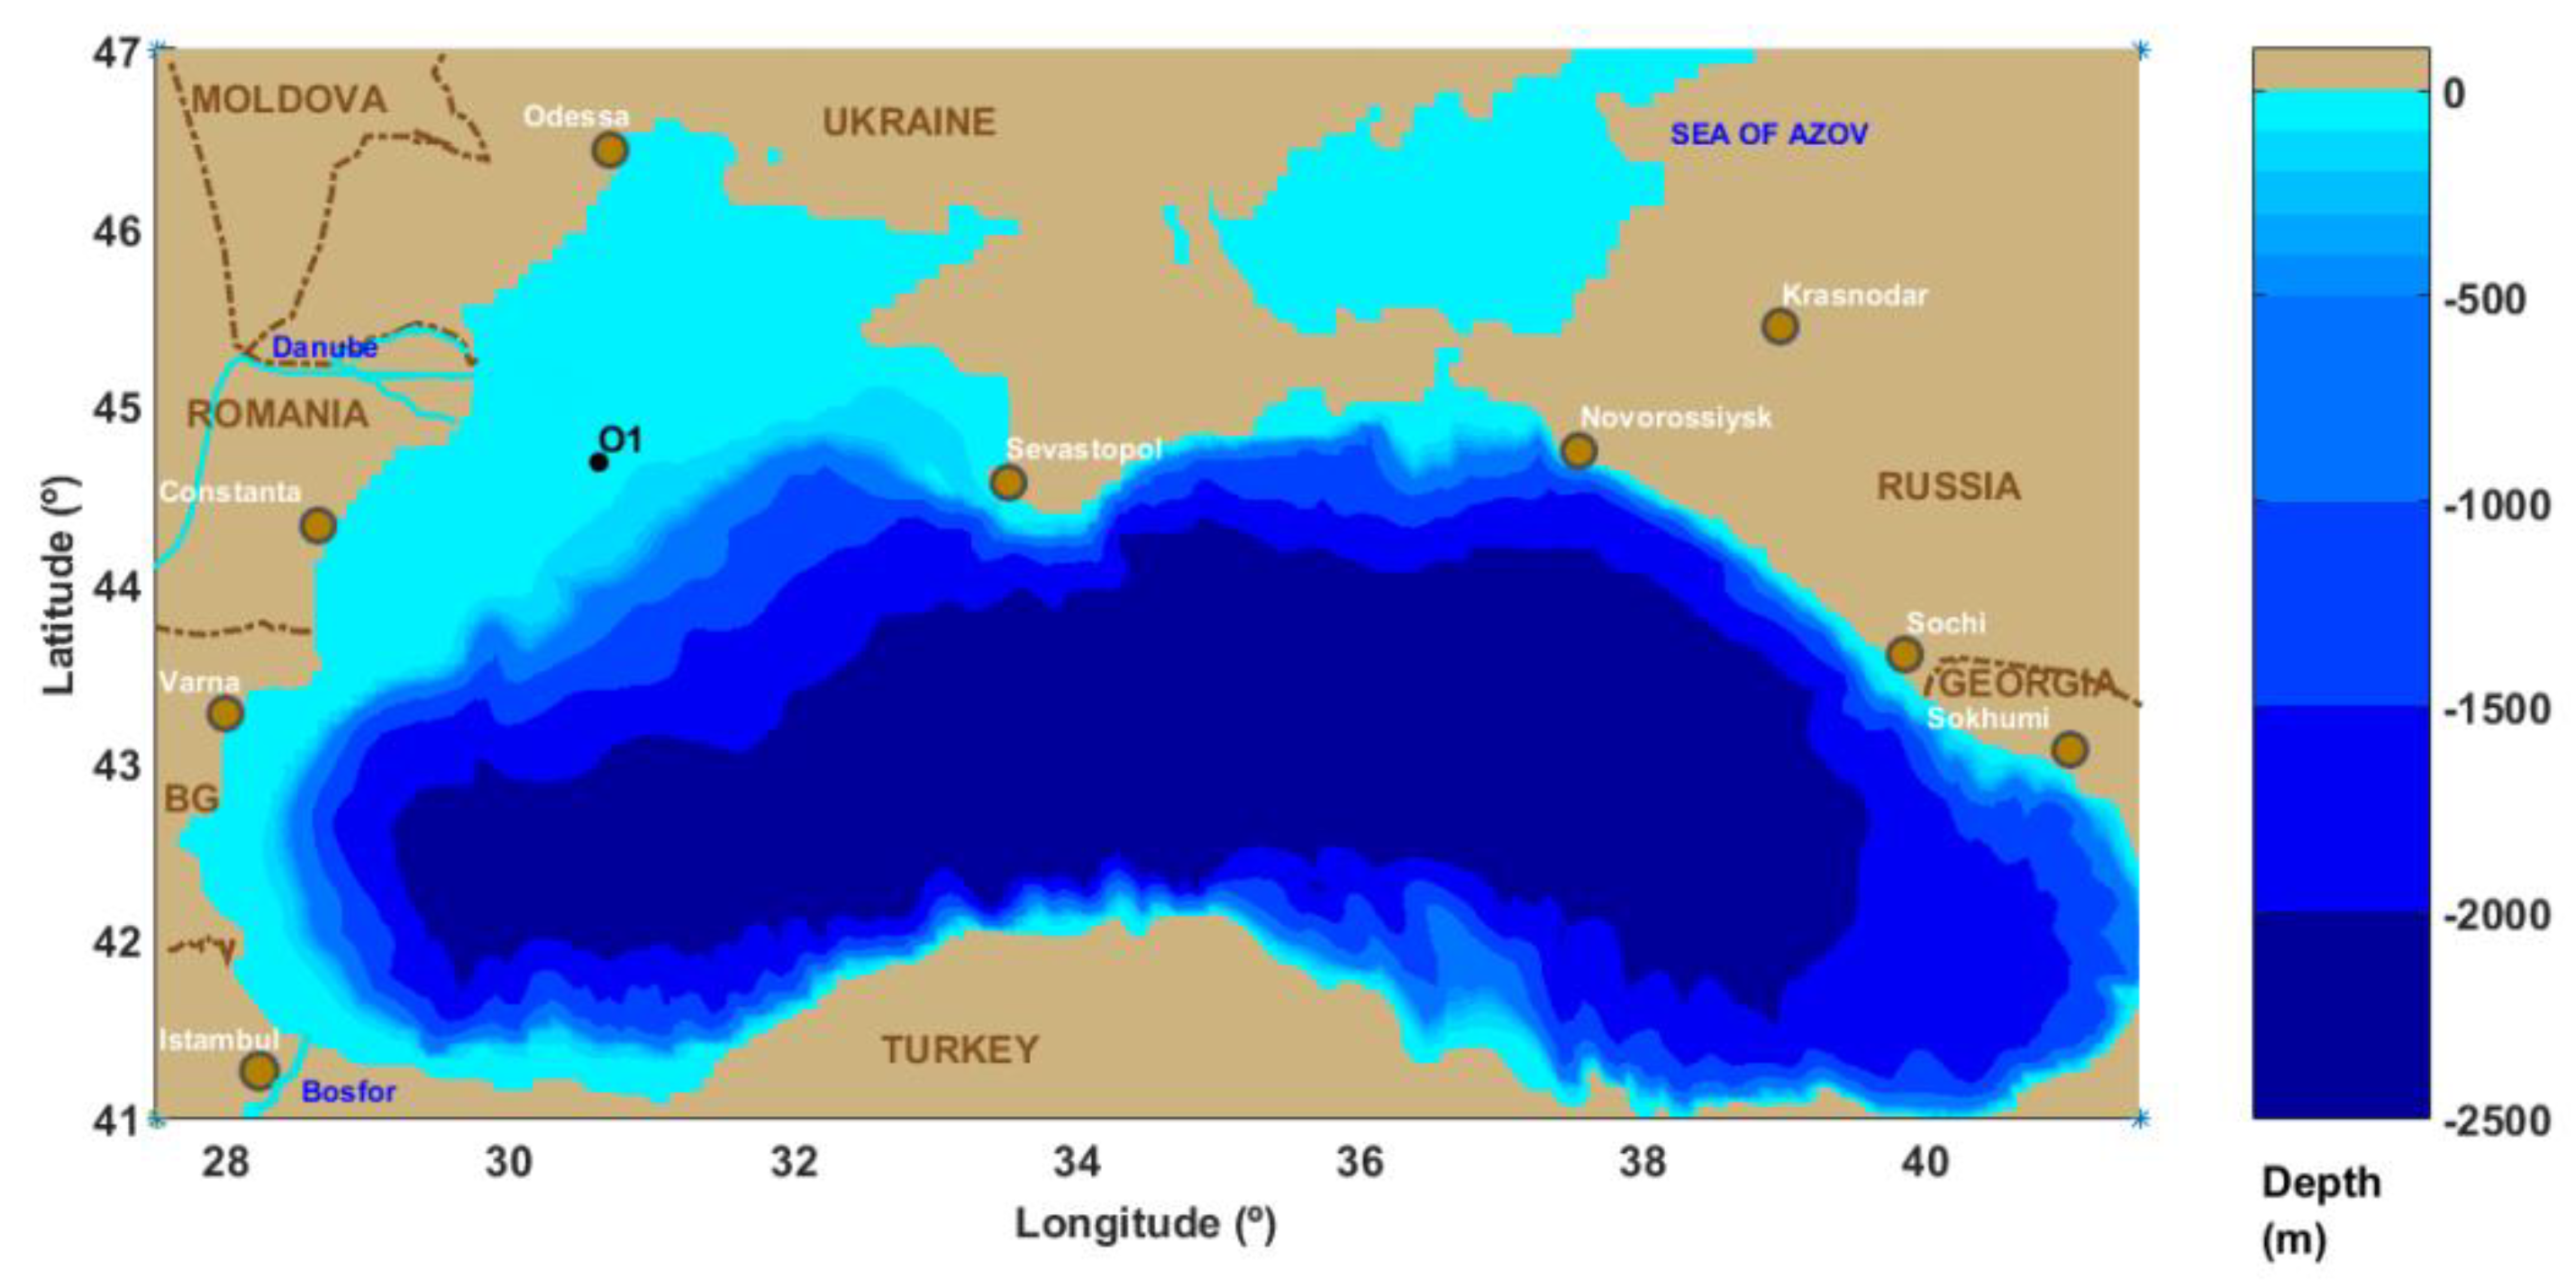
In the study in [39], conducted on the potential of the Black Sea for renewable wind energy, it was established that of the six points analyzed, the highest wind speeds that were interpolated at a height of 80 m were for the point that is represented in Figure 5.
The algorithm used in Reference [39] was also considered in this case, but the interpolation was made at a height of 84 m. All calculations were conducted using MATLAB software. The data used to obtain wind speed at 84 m were obtained from the EURO-CORDEX database, and the period analyzed was over 30 years, from 1 January 2021 to 31 December 2050. The location chosen has an elevated percentage of high wind speed occurrence, which correspond to wind class 7 (this class is recommended for the offshore industry), which is approximately 34%, and 30% of speeds were lower but still suitable for extracting renewable energy. Wind speeds in the Black Sea are not strong, and for this reason there are currently no wind farms. The highest wind speeds are to be found on the west coast of the Black Sea near Romania. We further considered the maximum wind speeds in these areas and analyzed the behavior of the two towers, simulating the forces and moments given by them. The location and wind characteristics for the chosen point are presented in Table 3.
Since the chosen reference point had a maximum wind speed value of 27.17 m/s, we tried to reduce the tower wall thickness, once by 25% and once by 50%, to see what would happen.

3. Results and Discussion

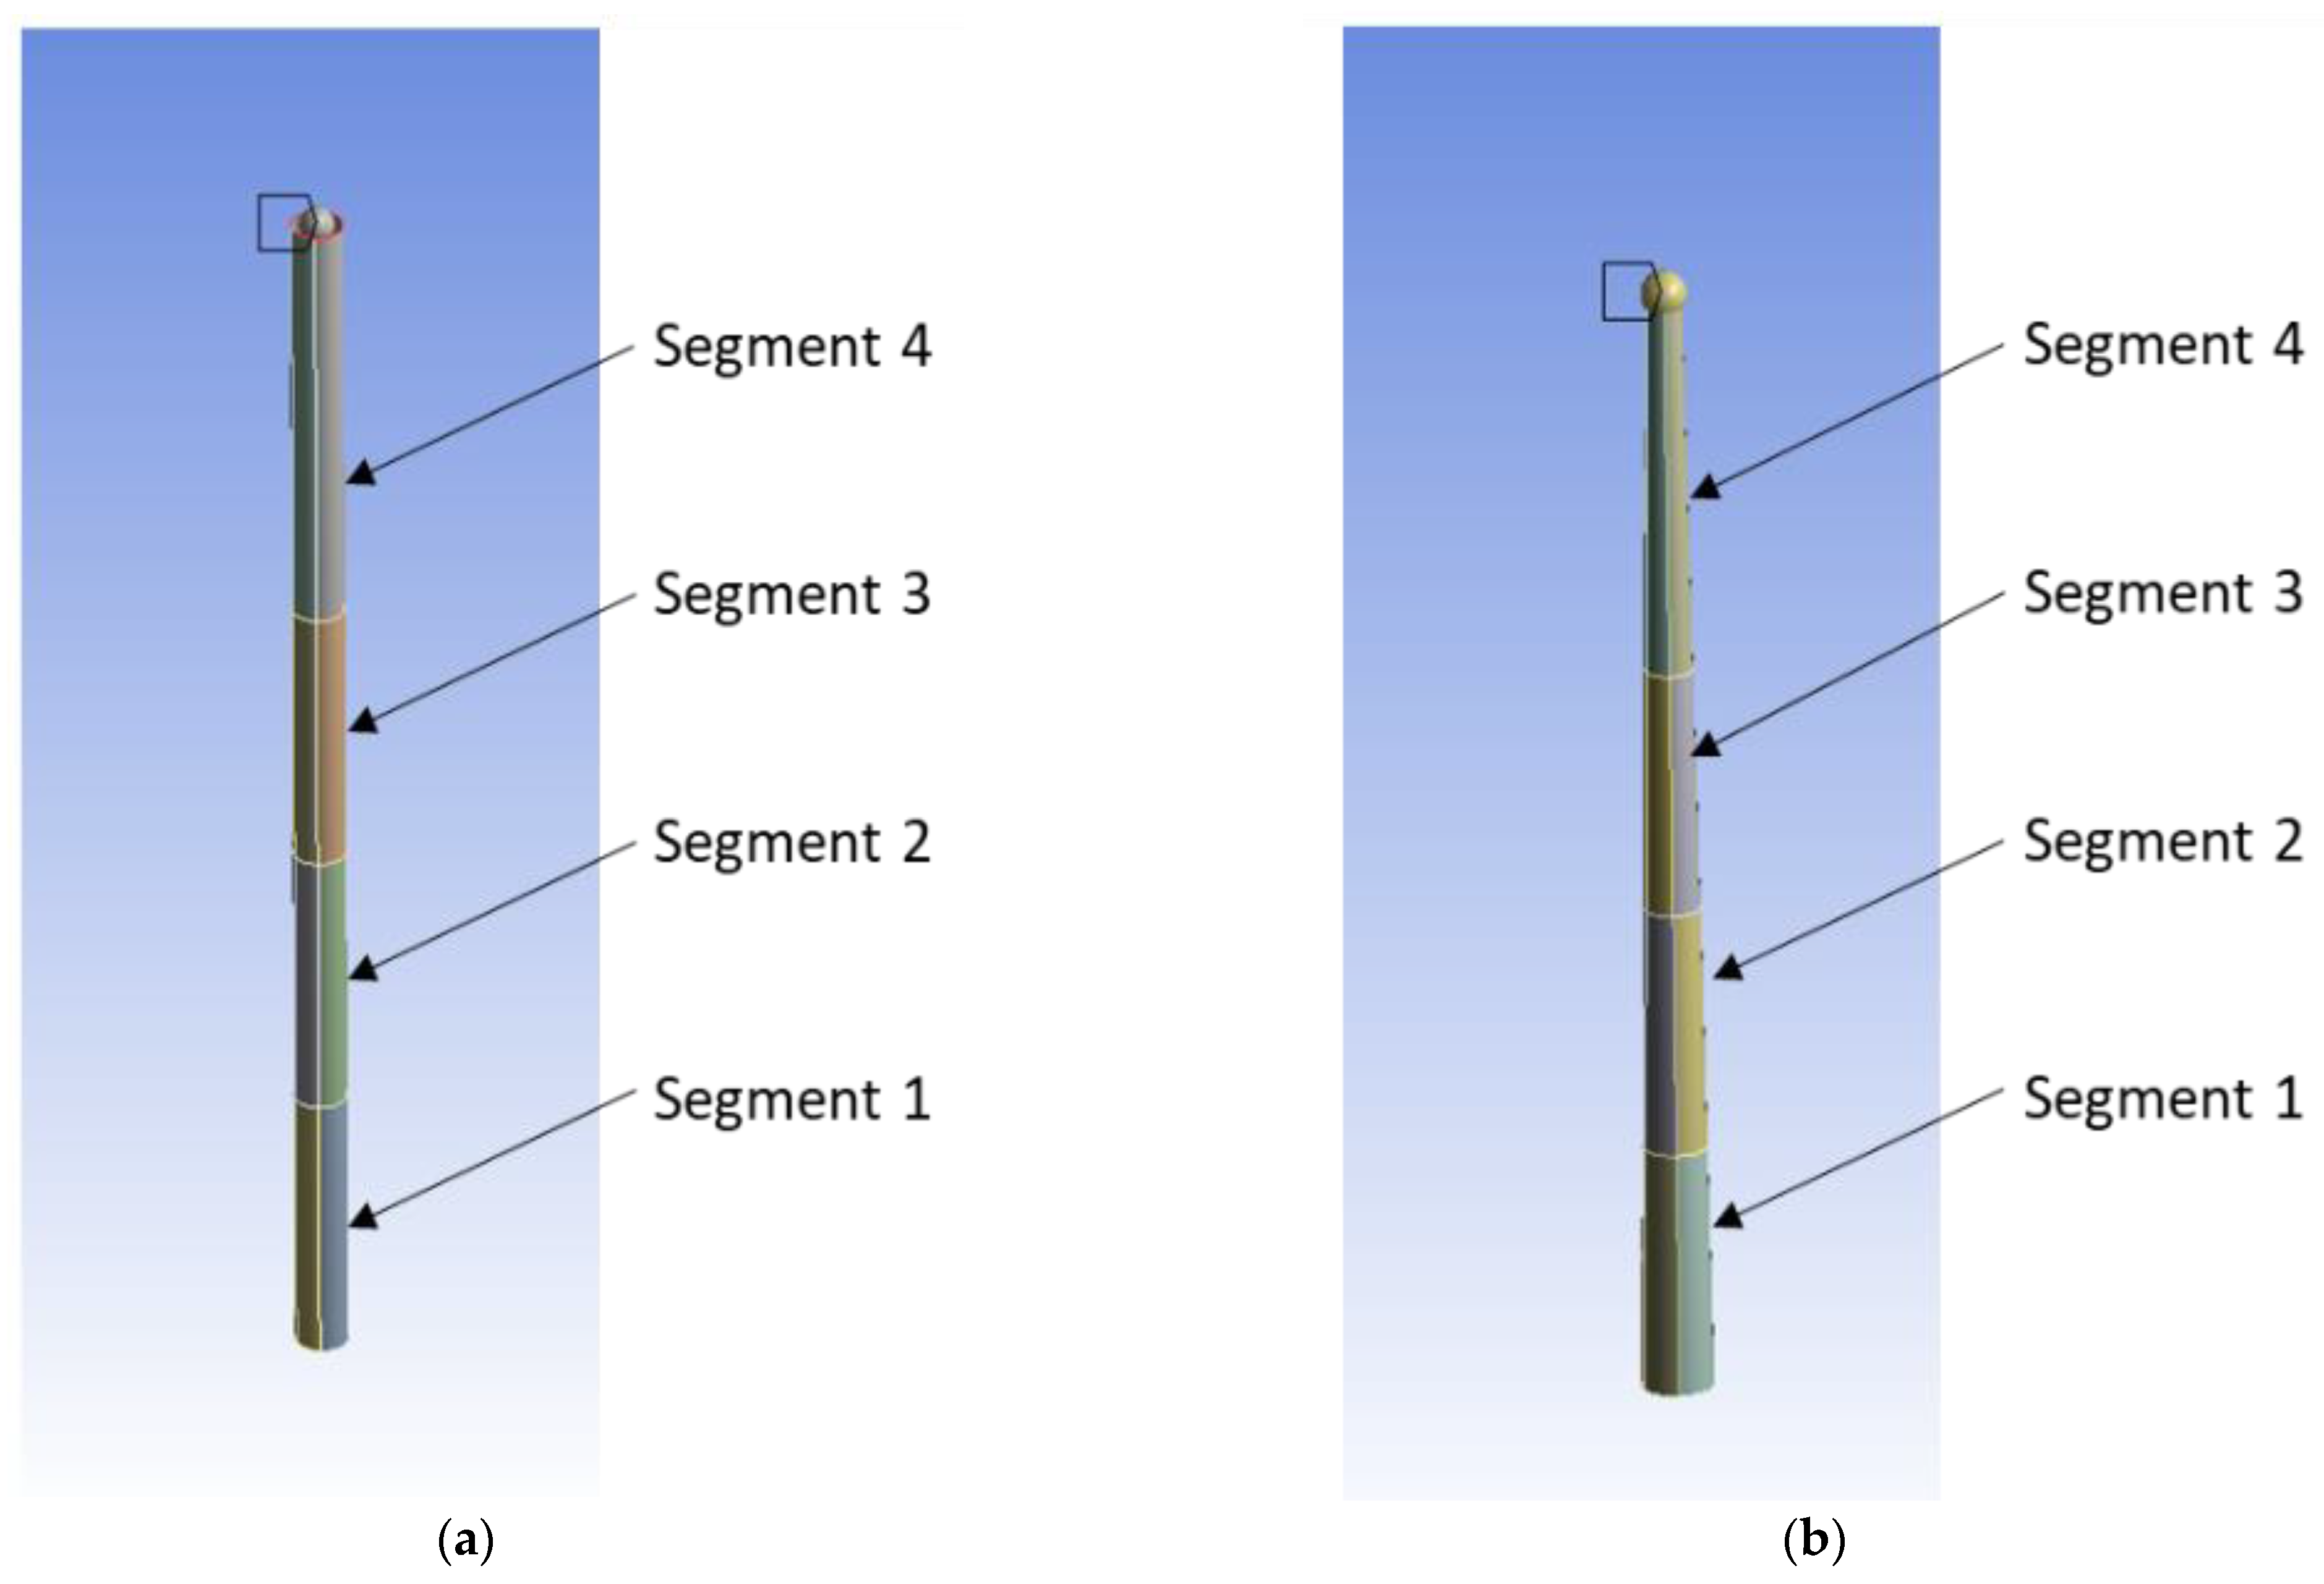
The most common method of designing wind turbine towers is by manufacturing sections between 20 and 30 m coupled with flanges at both ends and then bolting them to the location. In this paper, only the sections of the tower were considered without simulating the connections. The towers were divided into four sections, three of which had a length of 20 m and one with a length of 24 m. Each section had a certain thickness allocated, starting from 50 mm at the bottom and reaching 19 mm at the top. The two towers were modeled as shell structures in ANSYS. The main characteristics are detailed in Table 1 and Table 2. The thickness of the two towers are indicated in Table 4. The 3D model is presented in Figure 6.
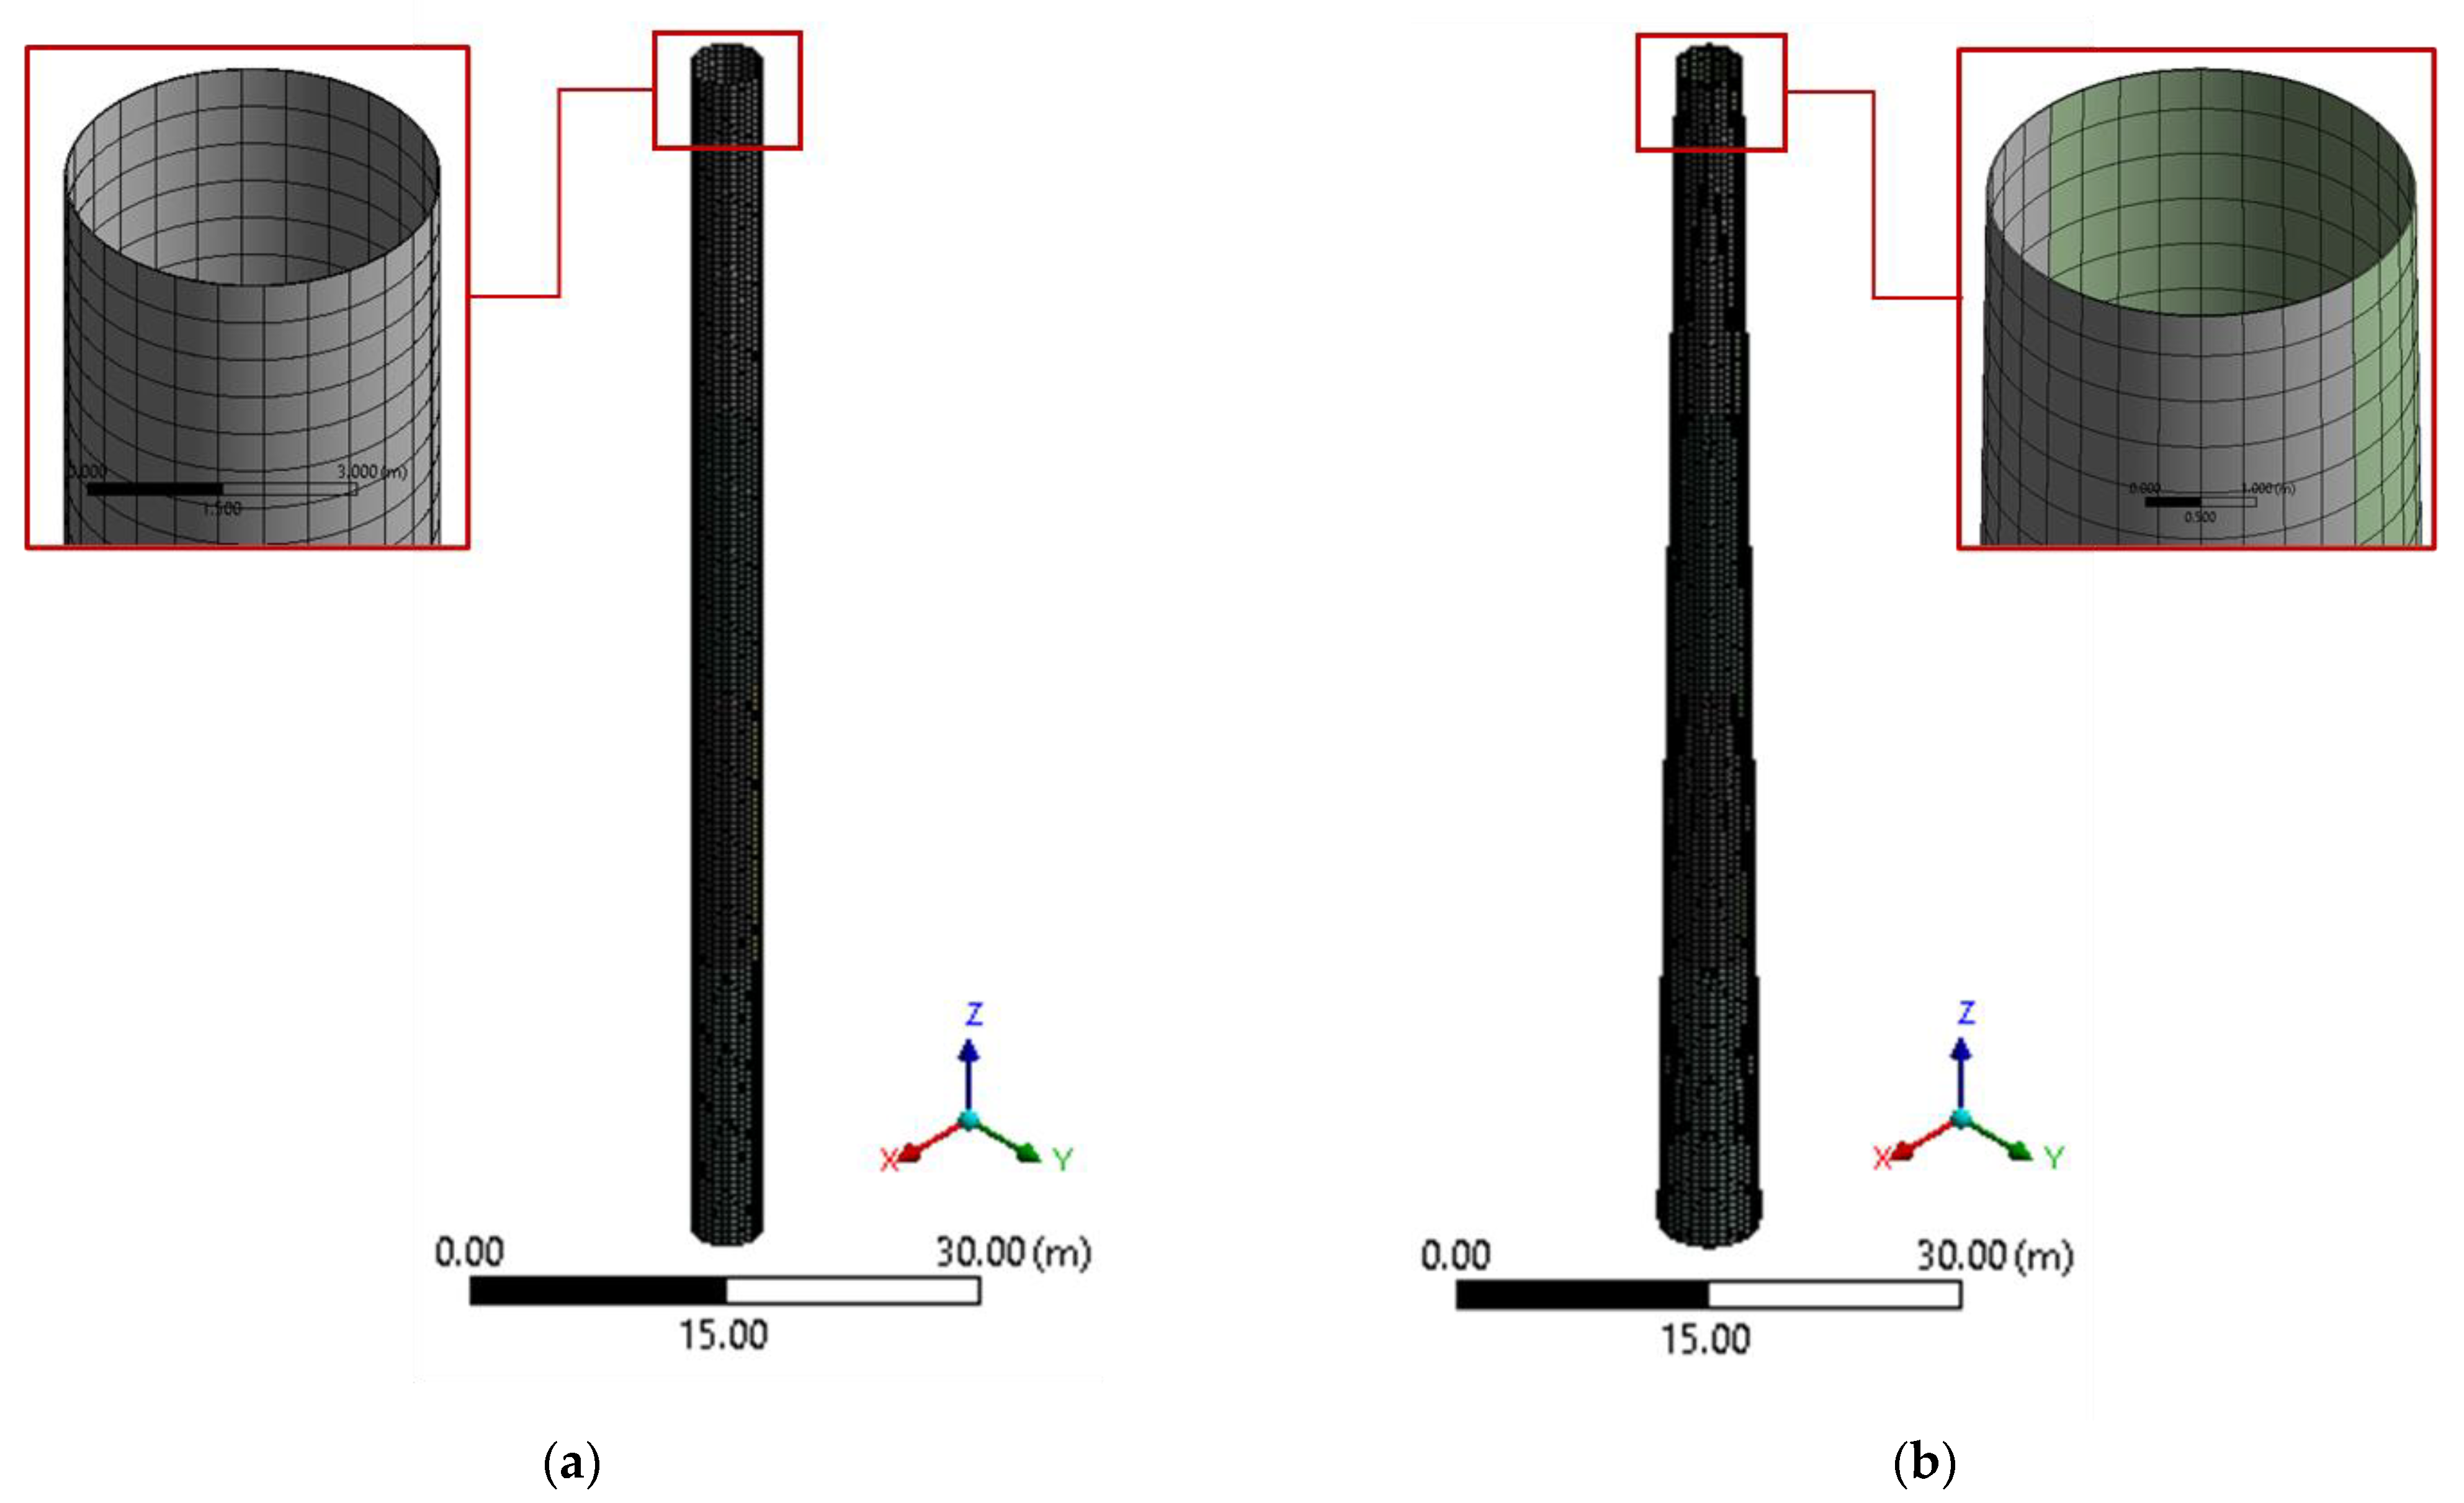
The mesh was generated through quadrilateral elements, as they best reproduce the stress distribution, and the results given by the finite element analysis are dependent on the chosen discretization solution. The size of applied quadrilateral elements was 0.5 m.
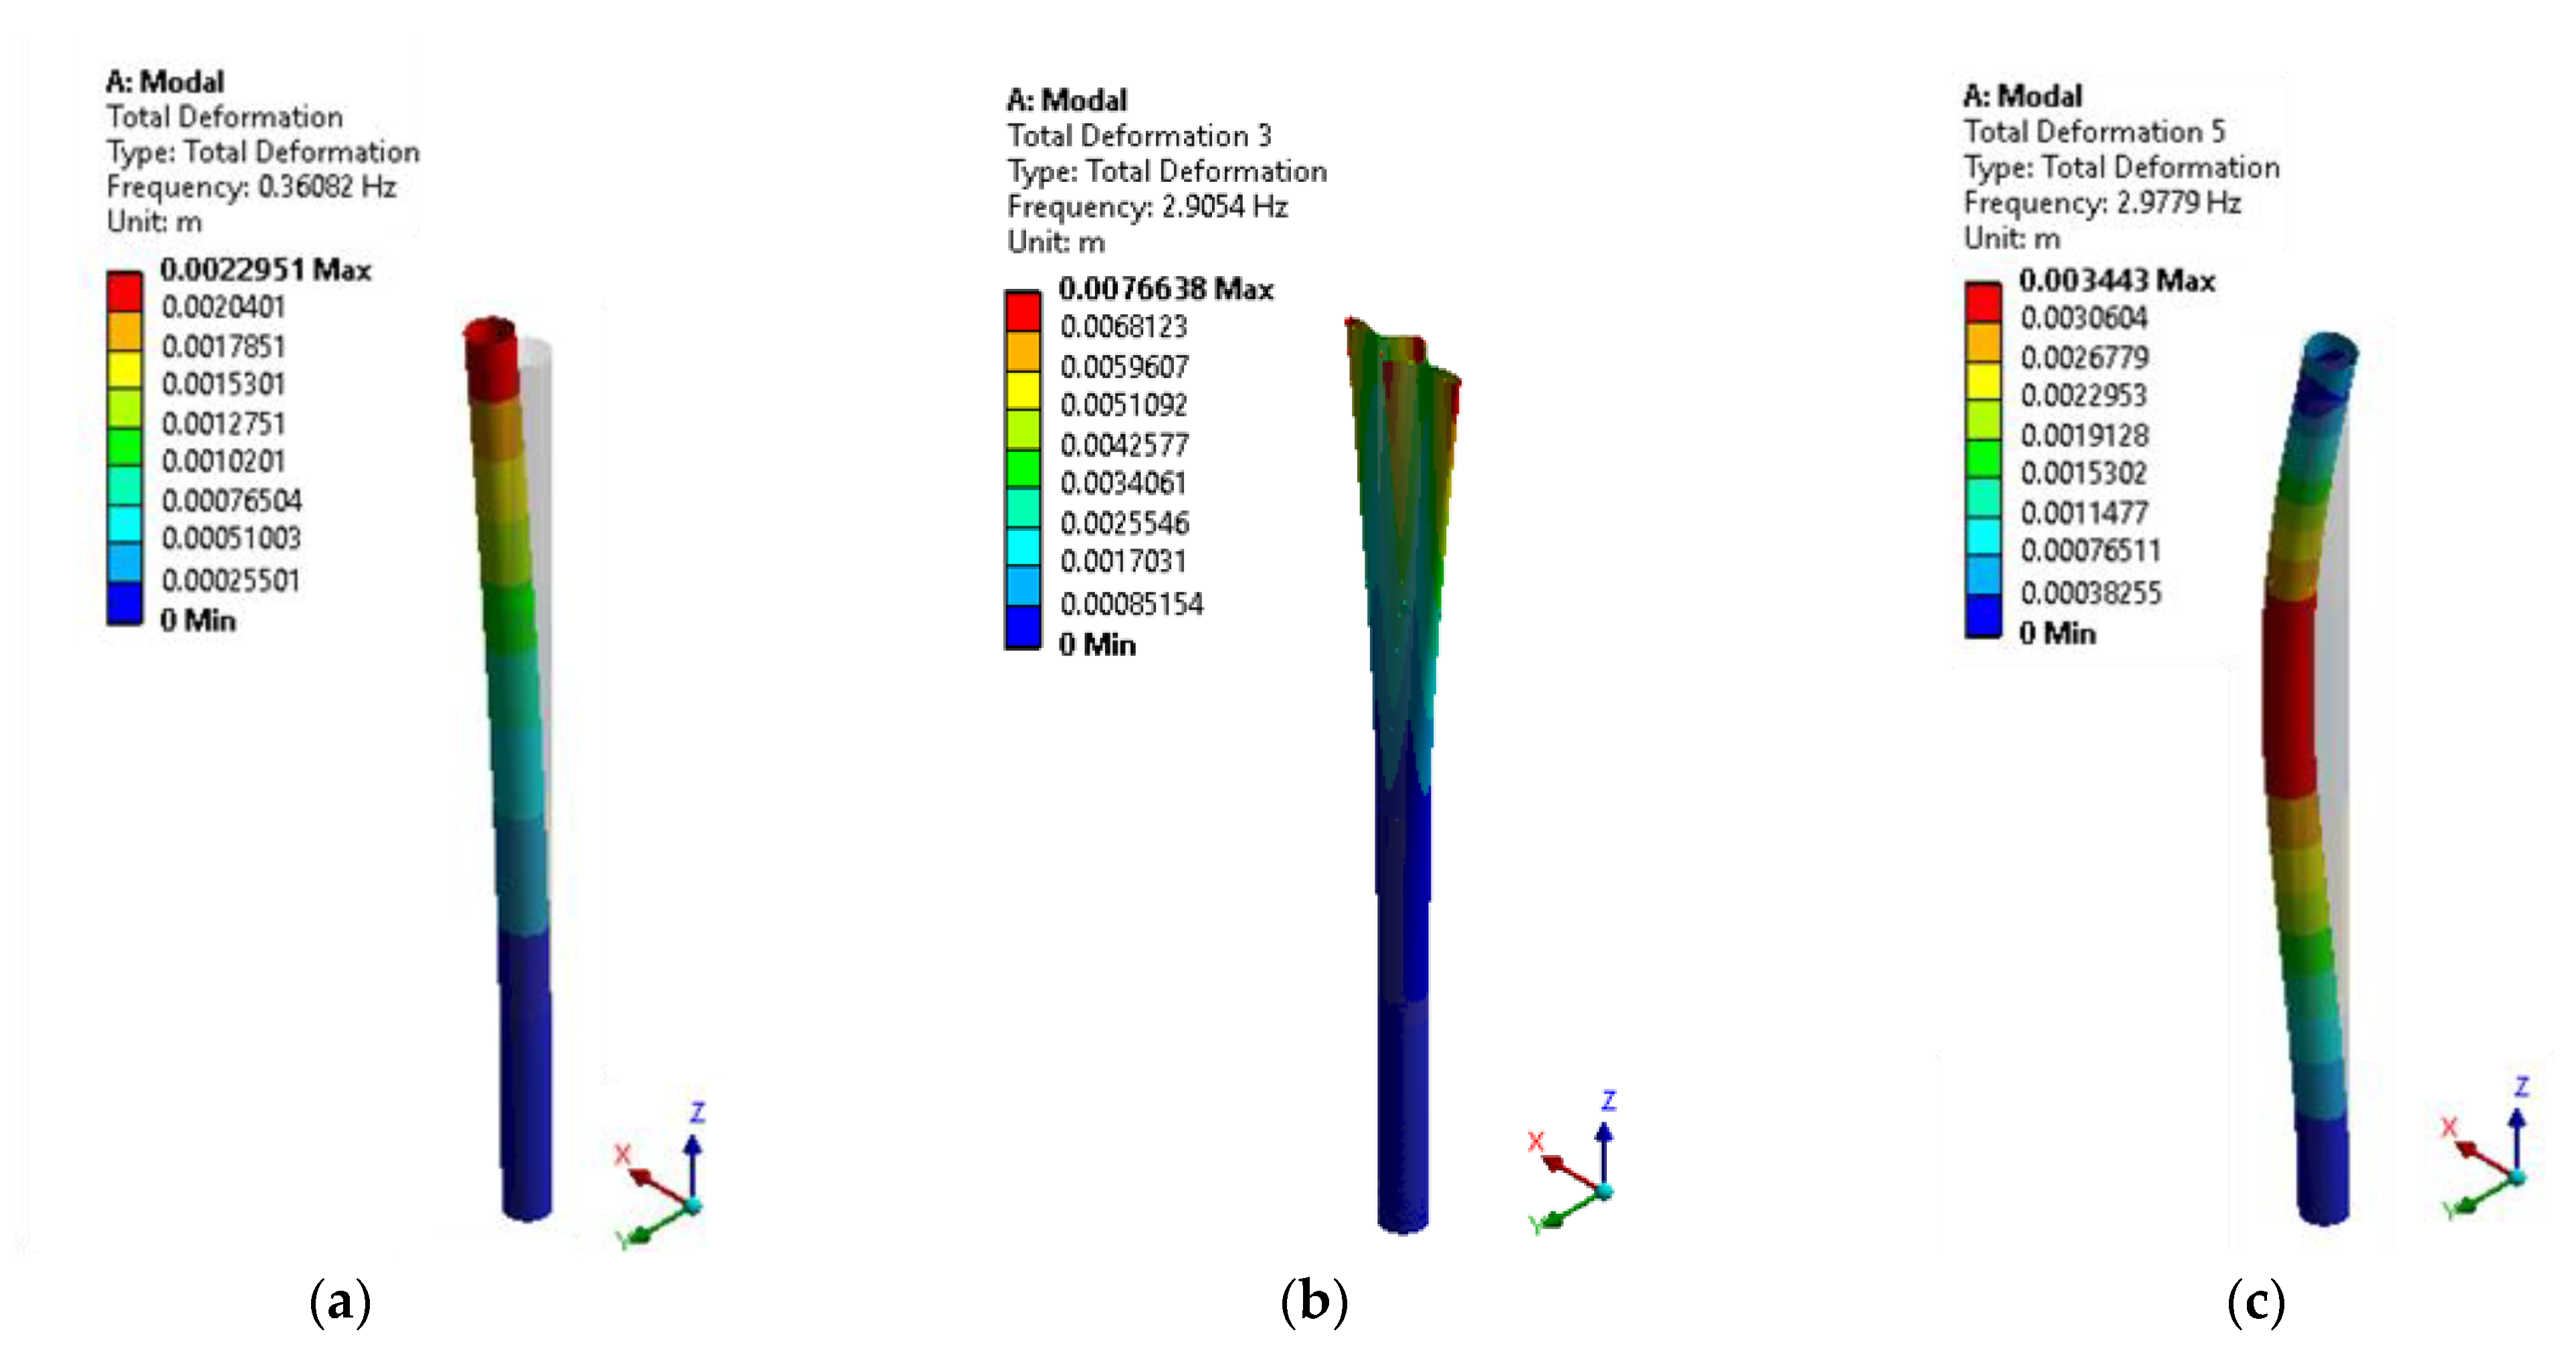
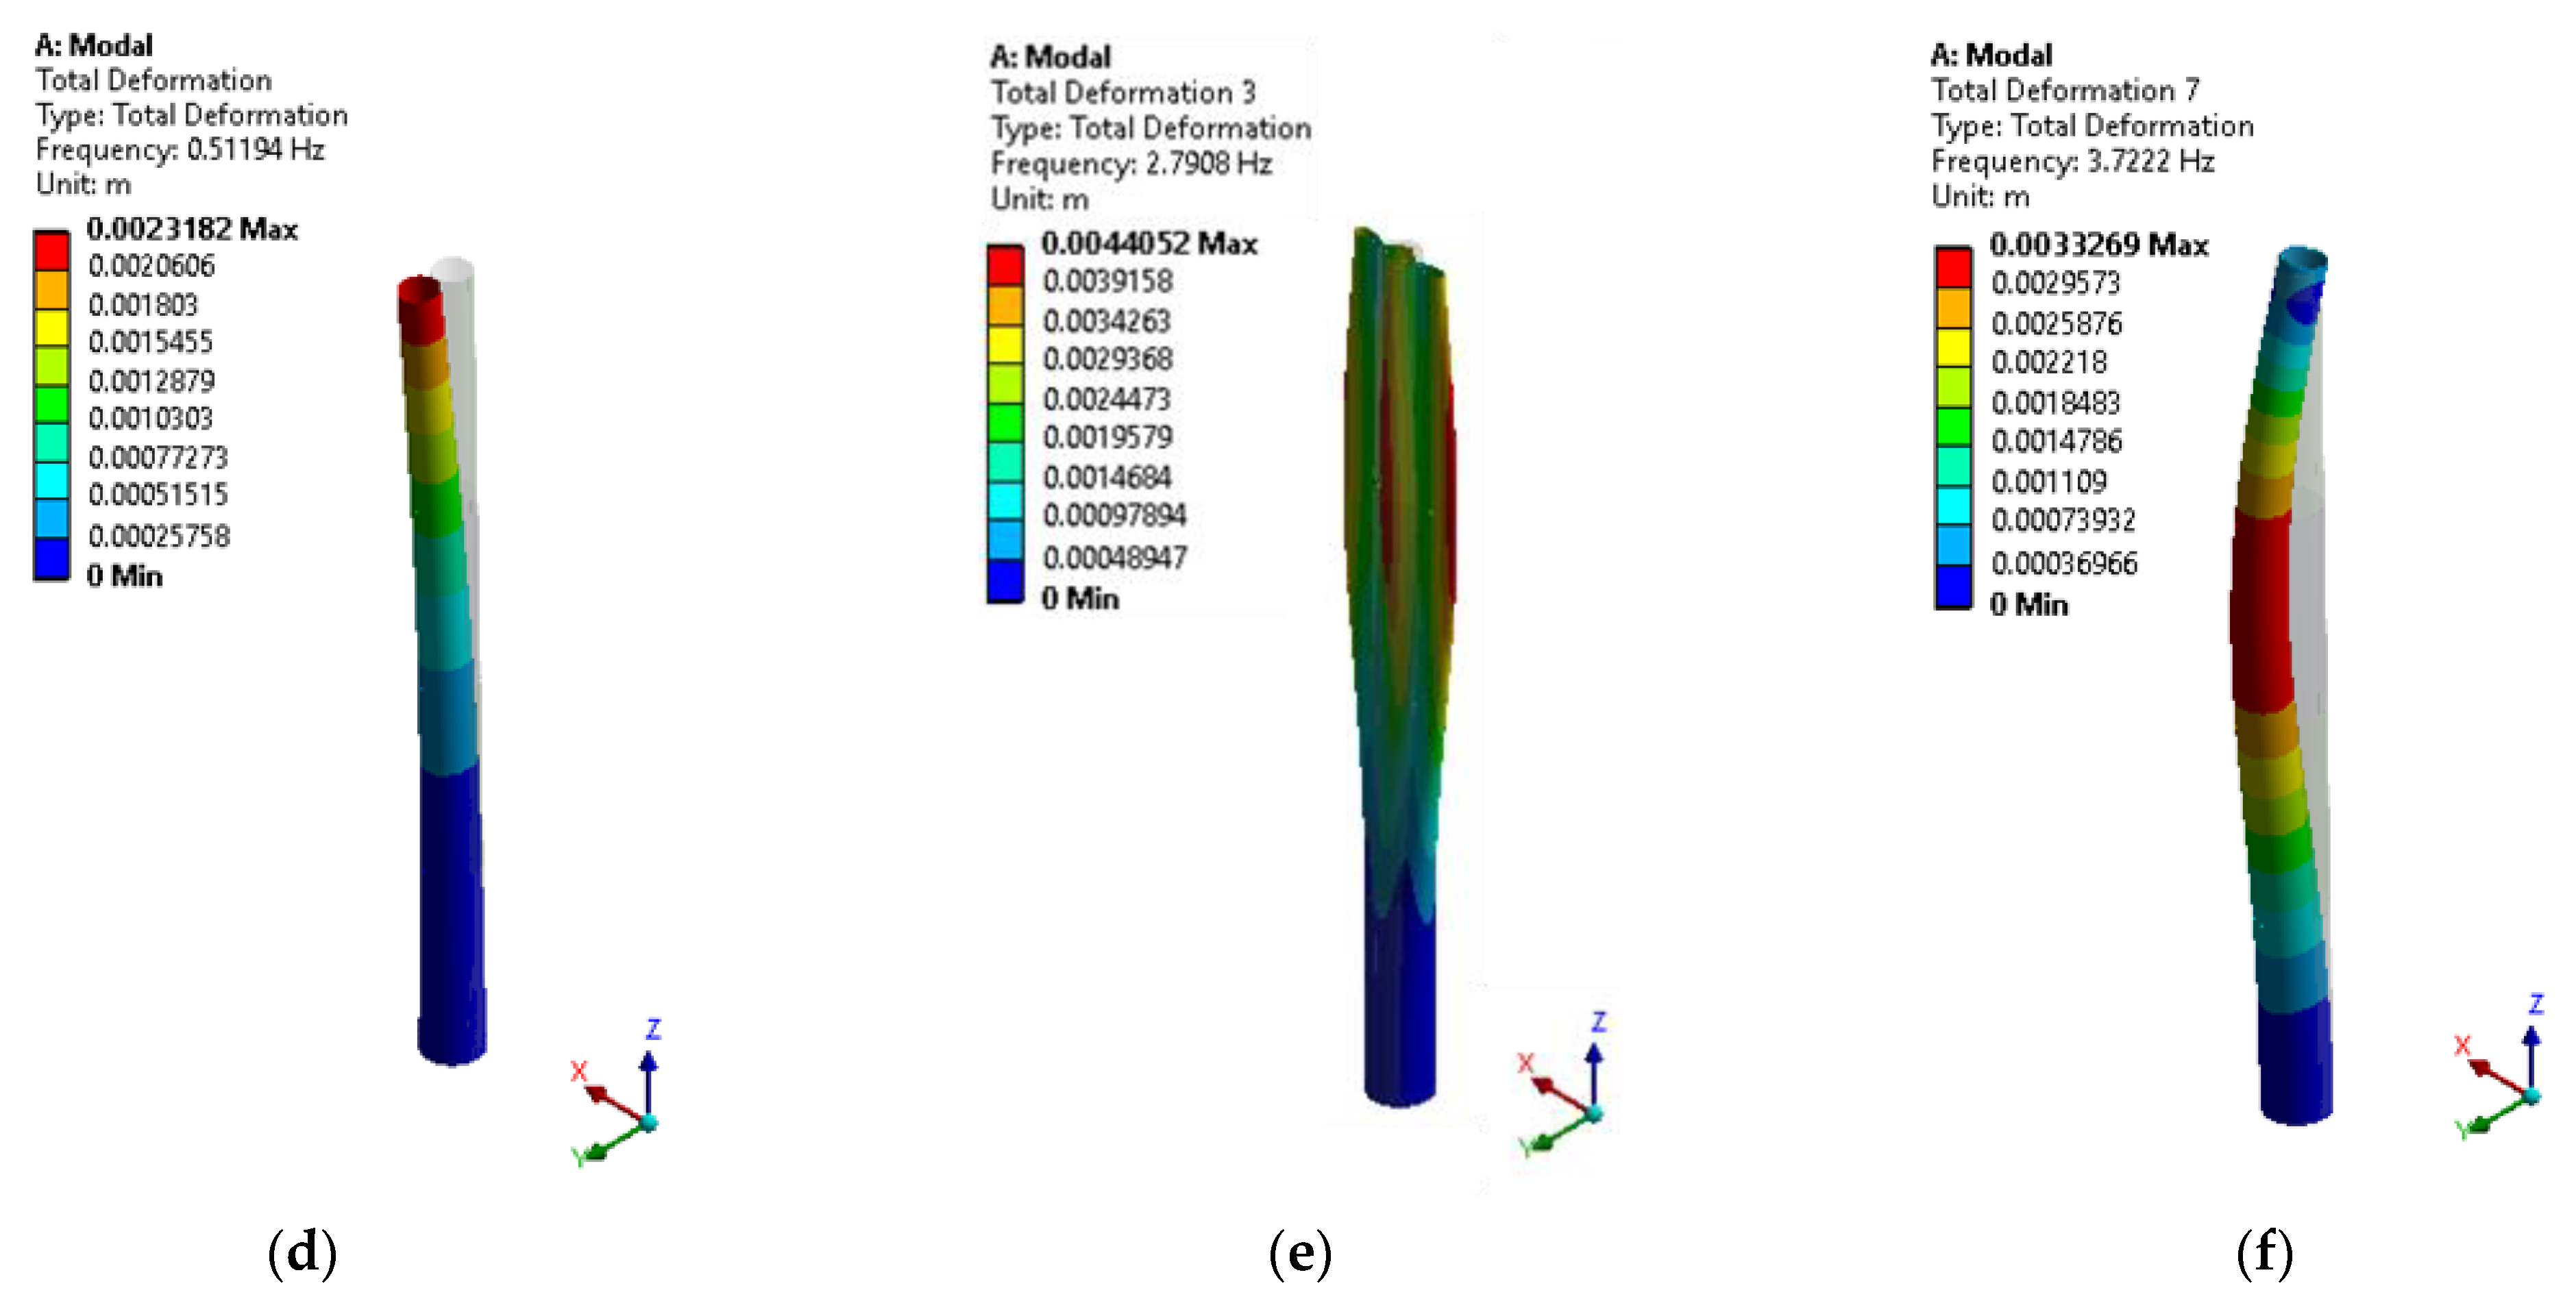
To determine the size of the mesh elements, a mesh sensitivity study was performed. For this, the two towers were fixed at the bottom and allowed to vibrate freely without adding forces and moments. The results obtained for the six modal frequencies are presented in Table 5.
For the meshes of 0.5 (Figure 7) and 0.25 m, respectively, for both the cylindrical and conical towers, the differences were imperceptible. For the cylindrical structure, the difference between the natural frequency for mode 1 for the 0.5 and 0.25 m mesh was approximately 0.006%. For the conical structure, the difference between the natural frequency for mode 3 for the mesh of 0.5 and 0.25 m was approximately 0.023%.
To avoid resonance caused by the vibrations, the frequency of the tower must be different from the harmonic vibrations associated with the rotor. The rotor had a value of harmonic vibrations between 1P = frot·Sf and 3 P = 3 · f rot S f , which corresponded to the frequency of the rotor. 1P is the primary excitation frequency of the rotor caused by the rotor spinning at a given velocity which induces mass imbalances. The second excitation frequency was caused by the blade passing the tower; this wind turbine had three blades, so it is written as 3P. This interdependence can be expressed by the inequality below. This range is a soft–stiff one and represents the optimum range for the best possible design [40]:
f rot · S f f tower 3 · f rot S f
where Sf is the safety factor for frequency (has the value of 1.05 according to the GL standard [41]), ftower is the first natural frequency of the tower, and frot is the frequency associated with the rotor. Vestas V112-3 MW has a rotor rotational speed of 12.8 rpm, which corresponded to the frequency of 0.213 Hz.
Thus, the values obtained for the first natural frequency of the tower must be between the values:
0.244 ≤ ftower ≤0.640
As shown in Figure 8, the first frequency mode for the cylindrical structure was 0.361 Hz, and for the conical structure, it was 0.512 Hz. Both values were within the range of 0.224–0.640 Hz.
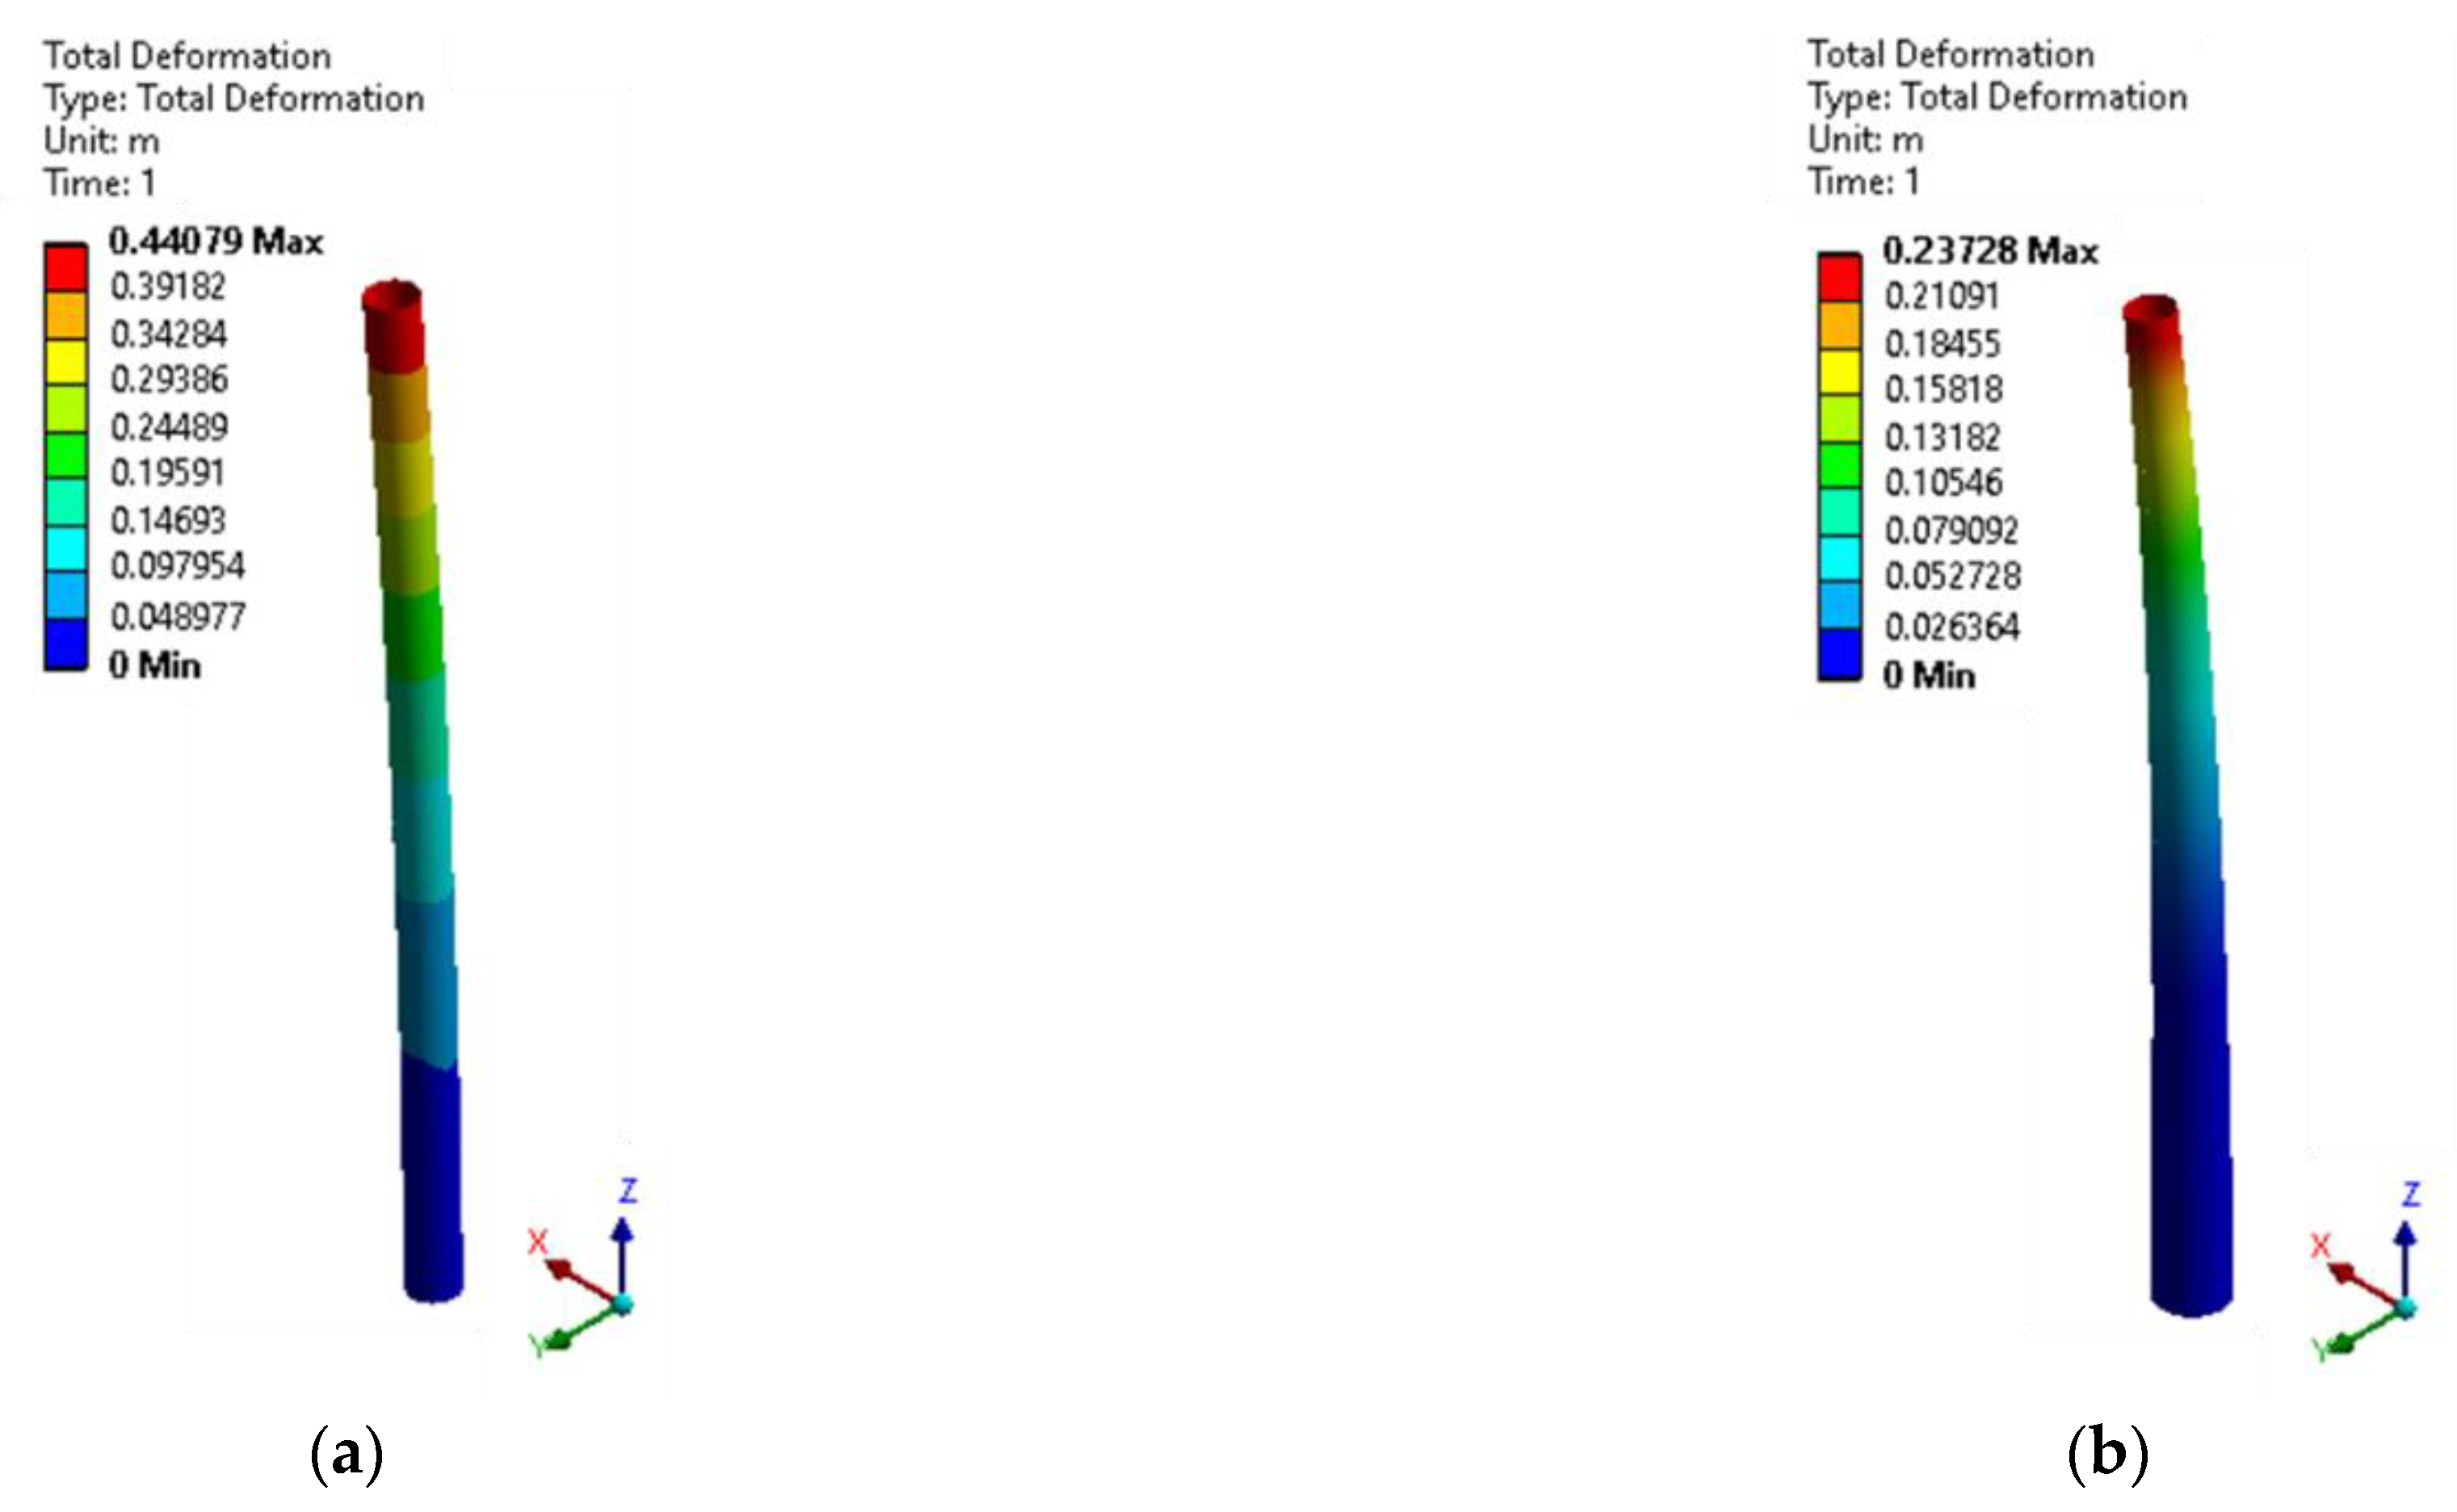
Figure 9 illustrates the two deformed towers under the action of the forces and moments in normal wind conditions. A tower is considered safe when the maximum deformation (marked with dmax) does not exceed the allowable deformation (marked with dallowable). It is considered that the structure is globally stable and is out of any danger when the following relationship is fulfilled [21]:
dmax ≤ dallowable
The allowable deformation can be calculated with the formula [42]:
d allowable = 1 . 25 · L 100
where L is the height of the tower and is measured in m.
From the above equations, the value of 1.05 m for the admissible deformation was obtained. The deformations obtained for the two geometric shapes of the tower were below this value (Figure 9). The cylindrical structure had the maximum deformation at the top of the tower, and its value was approximately 0.44 m, while the conical structure was much smaller, i.e., approximately 0.24 m. Thus, the two structures avoided excessive motion. These values were much lower than the allowable value, which indicates that the structure was sufficiently rigid.
Figure 10 illustrates the deformation of the two towers under the action of forces and moments in extreme conditions. The maximum deformation for the cylindrical tower was 1.8907 m, which exceeds the value of the allowable deformation. This result indicates that the structure was not sufficiently rigid for these conditions. The maximum deformation of the conical tower was 1.0229 m. This value was 2.7% lower than the allowable value and indicates that the tower was sufficiently stiff and would not experience large deformations.
The von Mises stress, σ, generated by the loads cannot exceed the allowable stress. This can be expressed in the following inequality forms:
σ ≤ σallowable
The allowable stress is given by:
σ allowable = σ y γ m
where σy is the yield strength, and γm is the material safety factor.
The material yield strength for S355 Steel is 335 MPa for thicknesses of 40 ≤ t ≤ 63 mm, and for thicknesses of 16 ≤ t ≤ 40 (mm), the yield strength is 345 MPa. In the case of the chosen towers, we considered the yield strength at the upper thickness to ensure that they met all the desired conditions.
The value of the safety factor was chosen as 1.1 [35]. This value is minimal compared to those used in practice but is a reference value that takes into account the instability of the material. For this reason, the values obtained from the calculation may be higher than the actual ones.
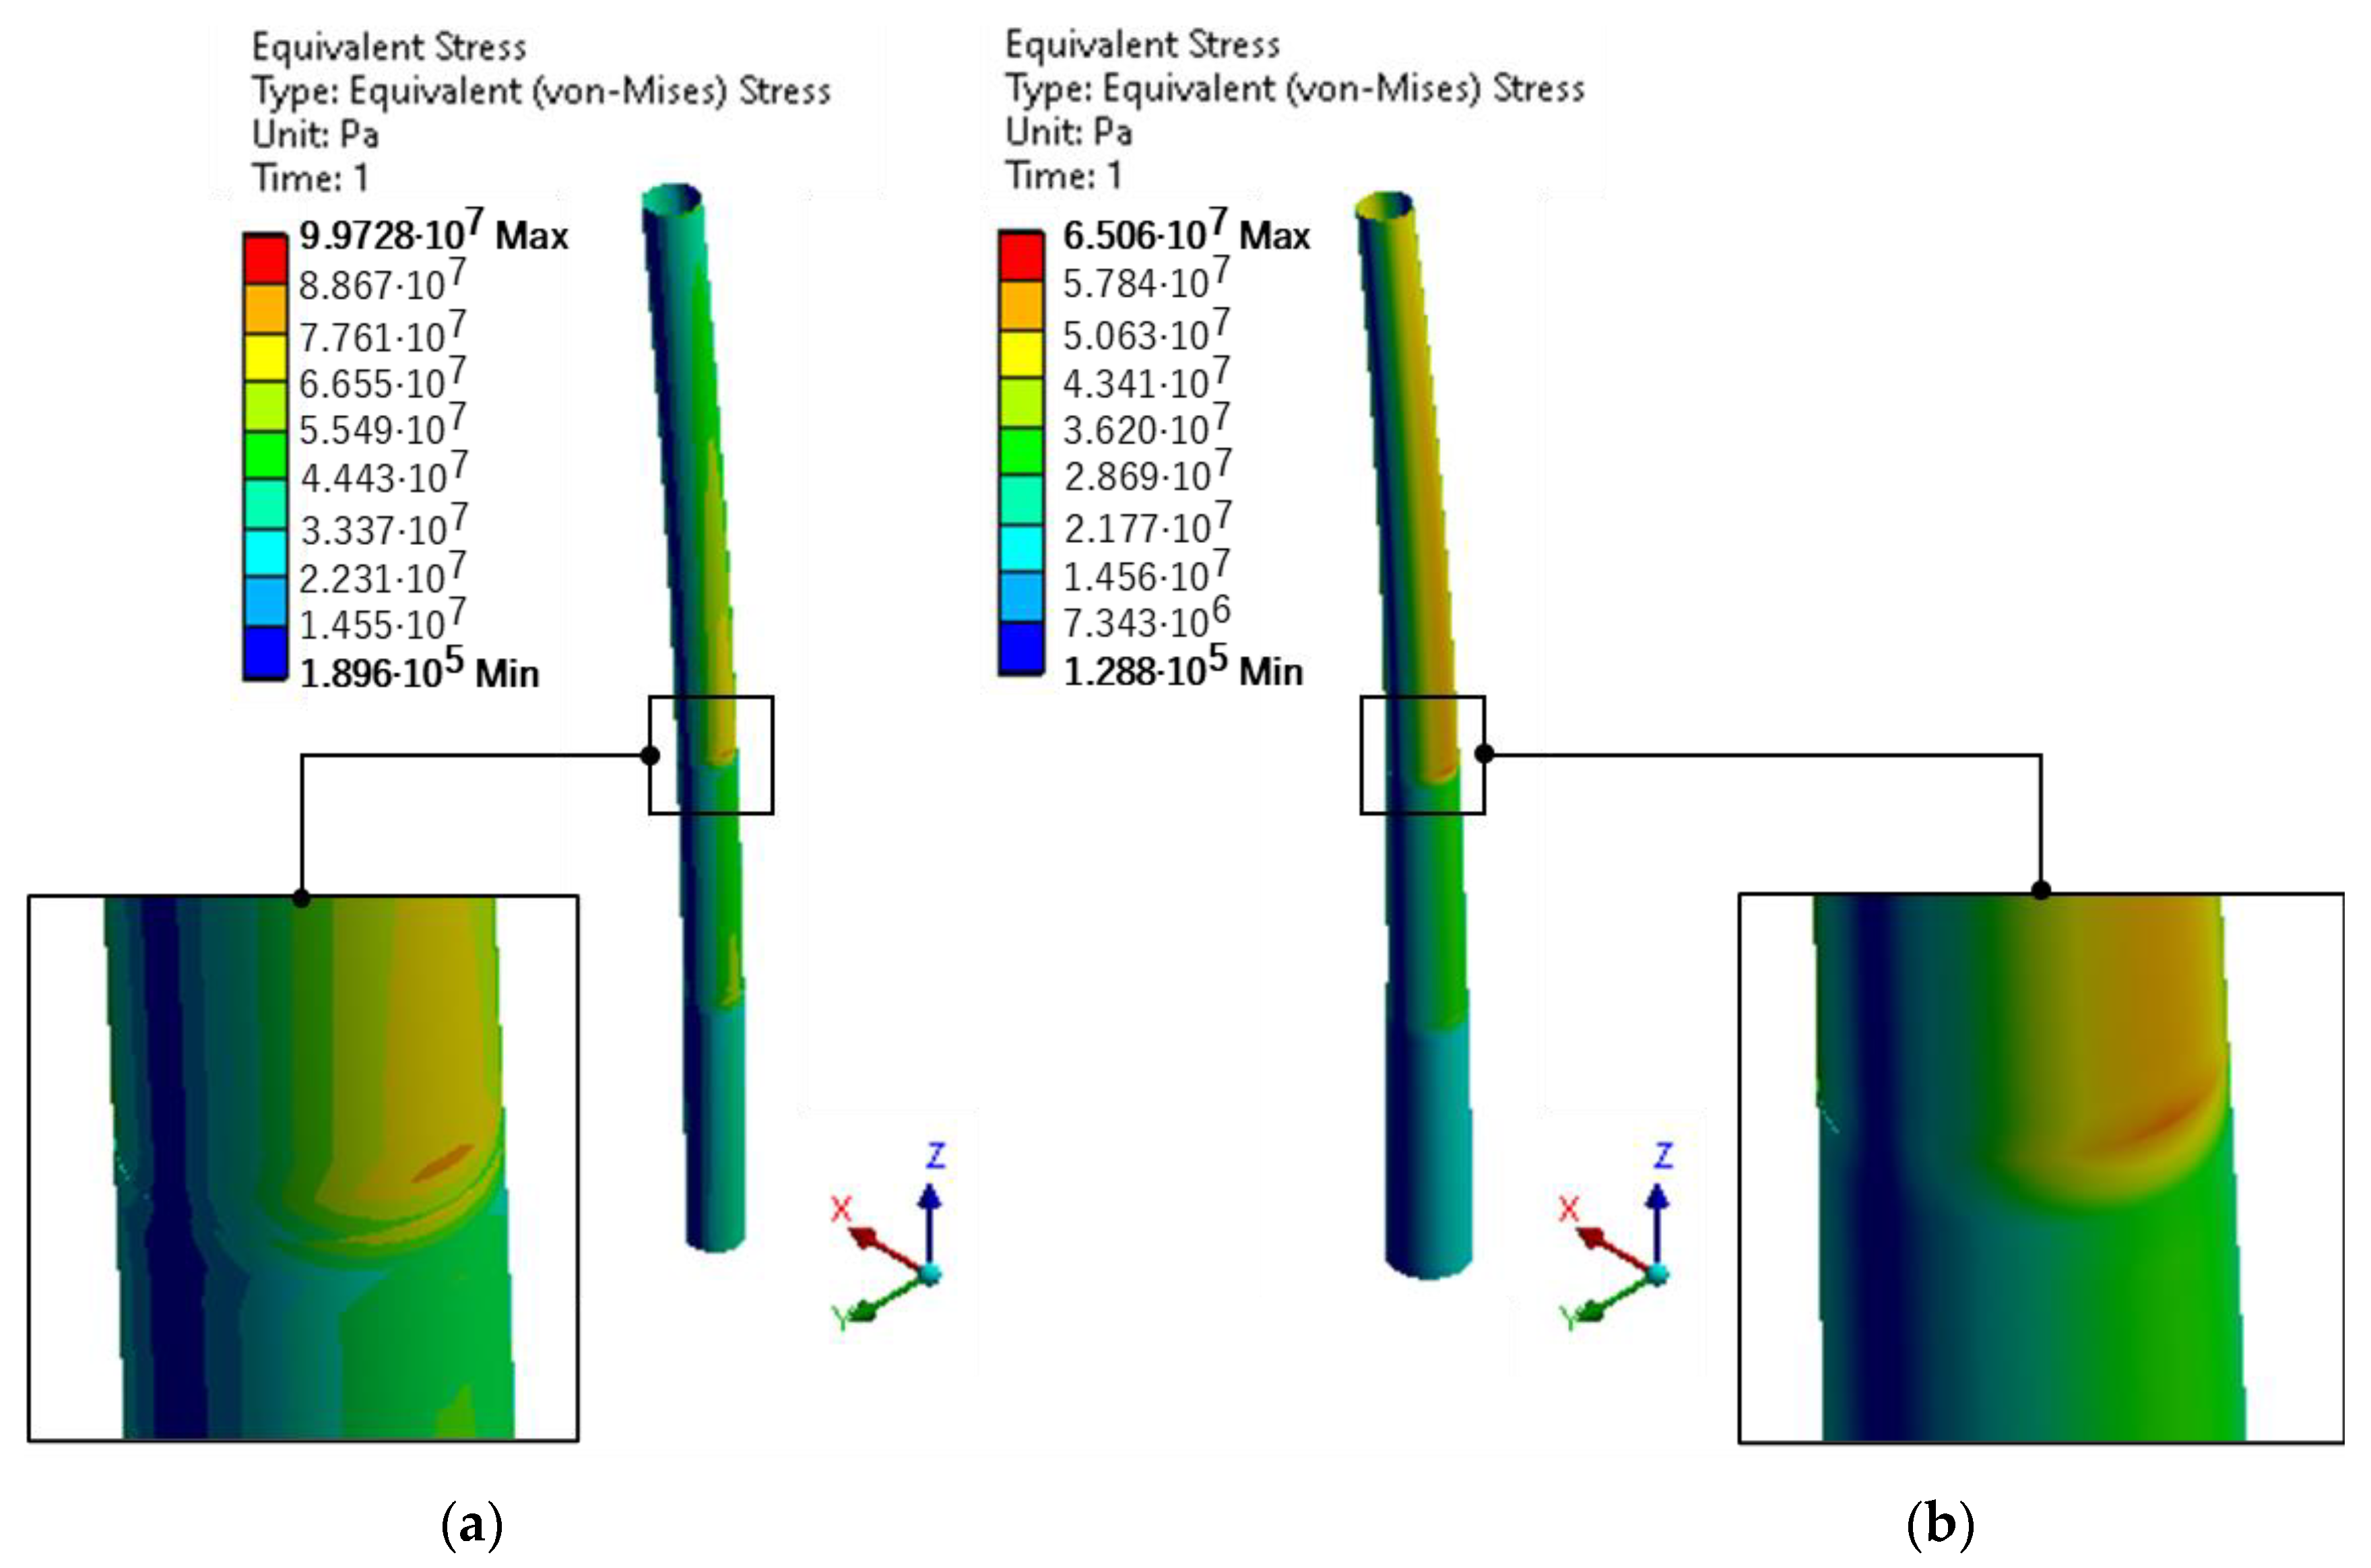
Using Equations (11) and (12), we obtained the value of the allowable stress of 305 MPa. The values of the von Mises stresses in the case of the cylindrical and conical structures under normal operating conditions were 100 and 65 MPa, respectively (Figure 11). These values are below the allowable stress value.
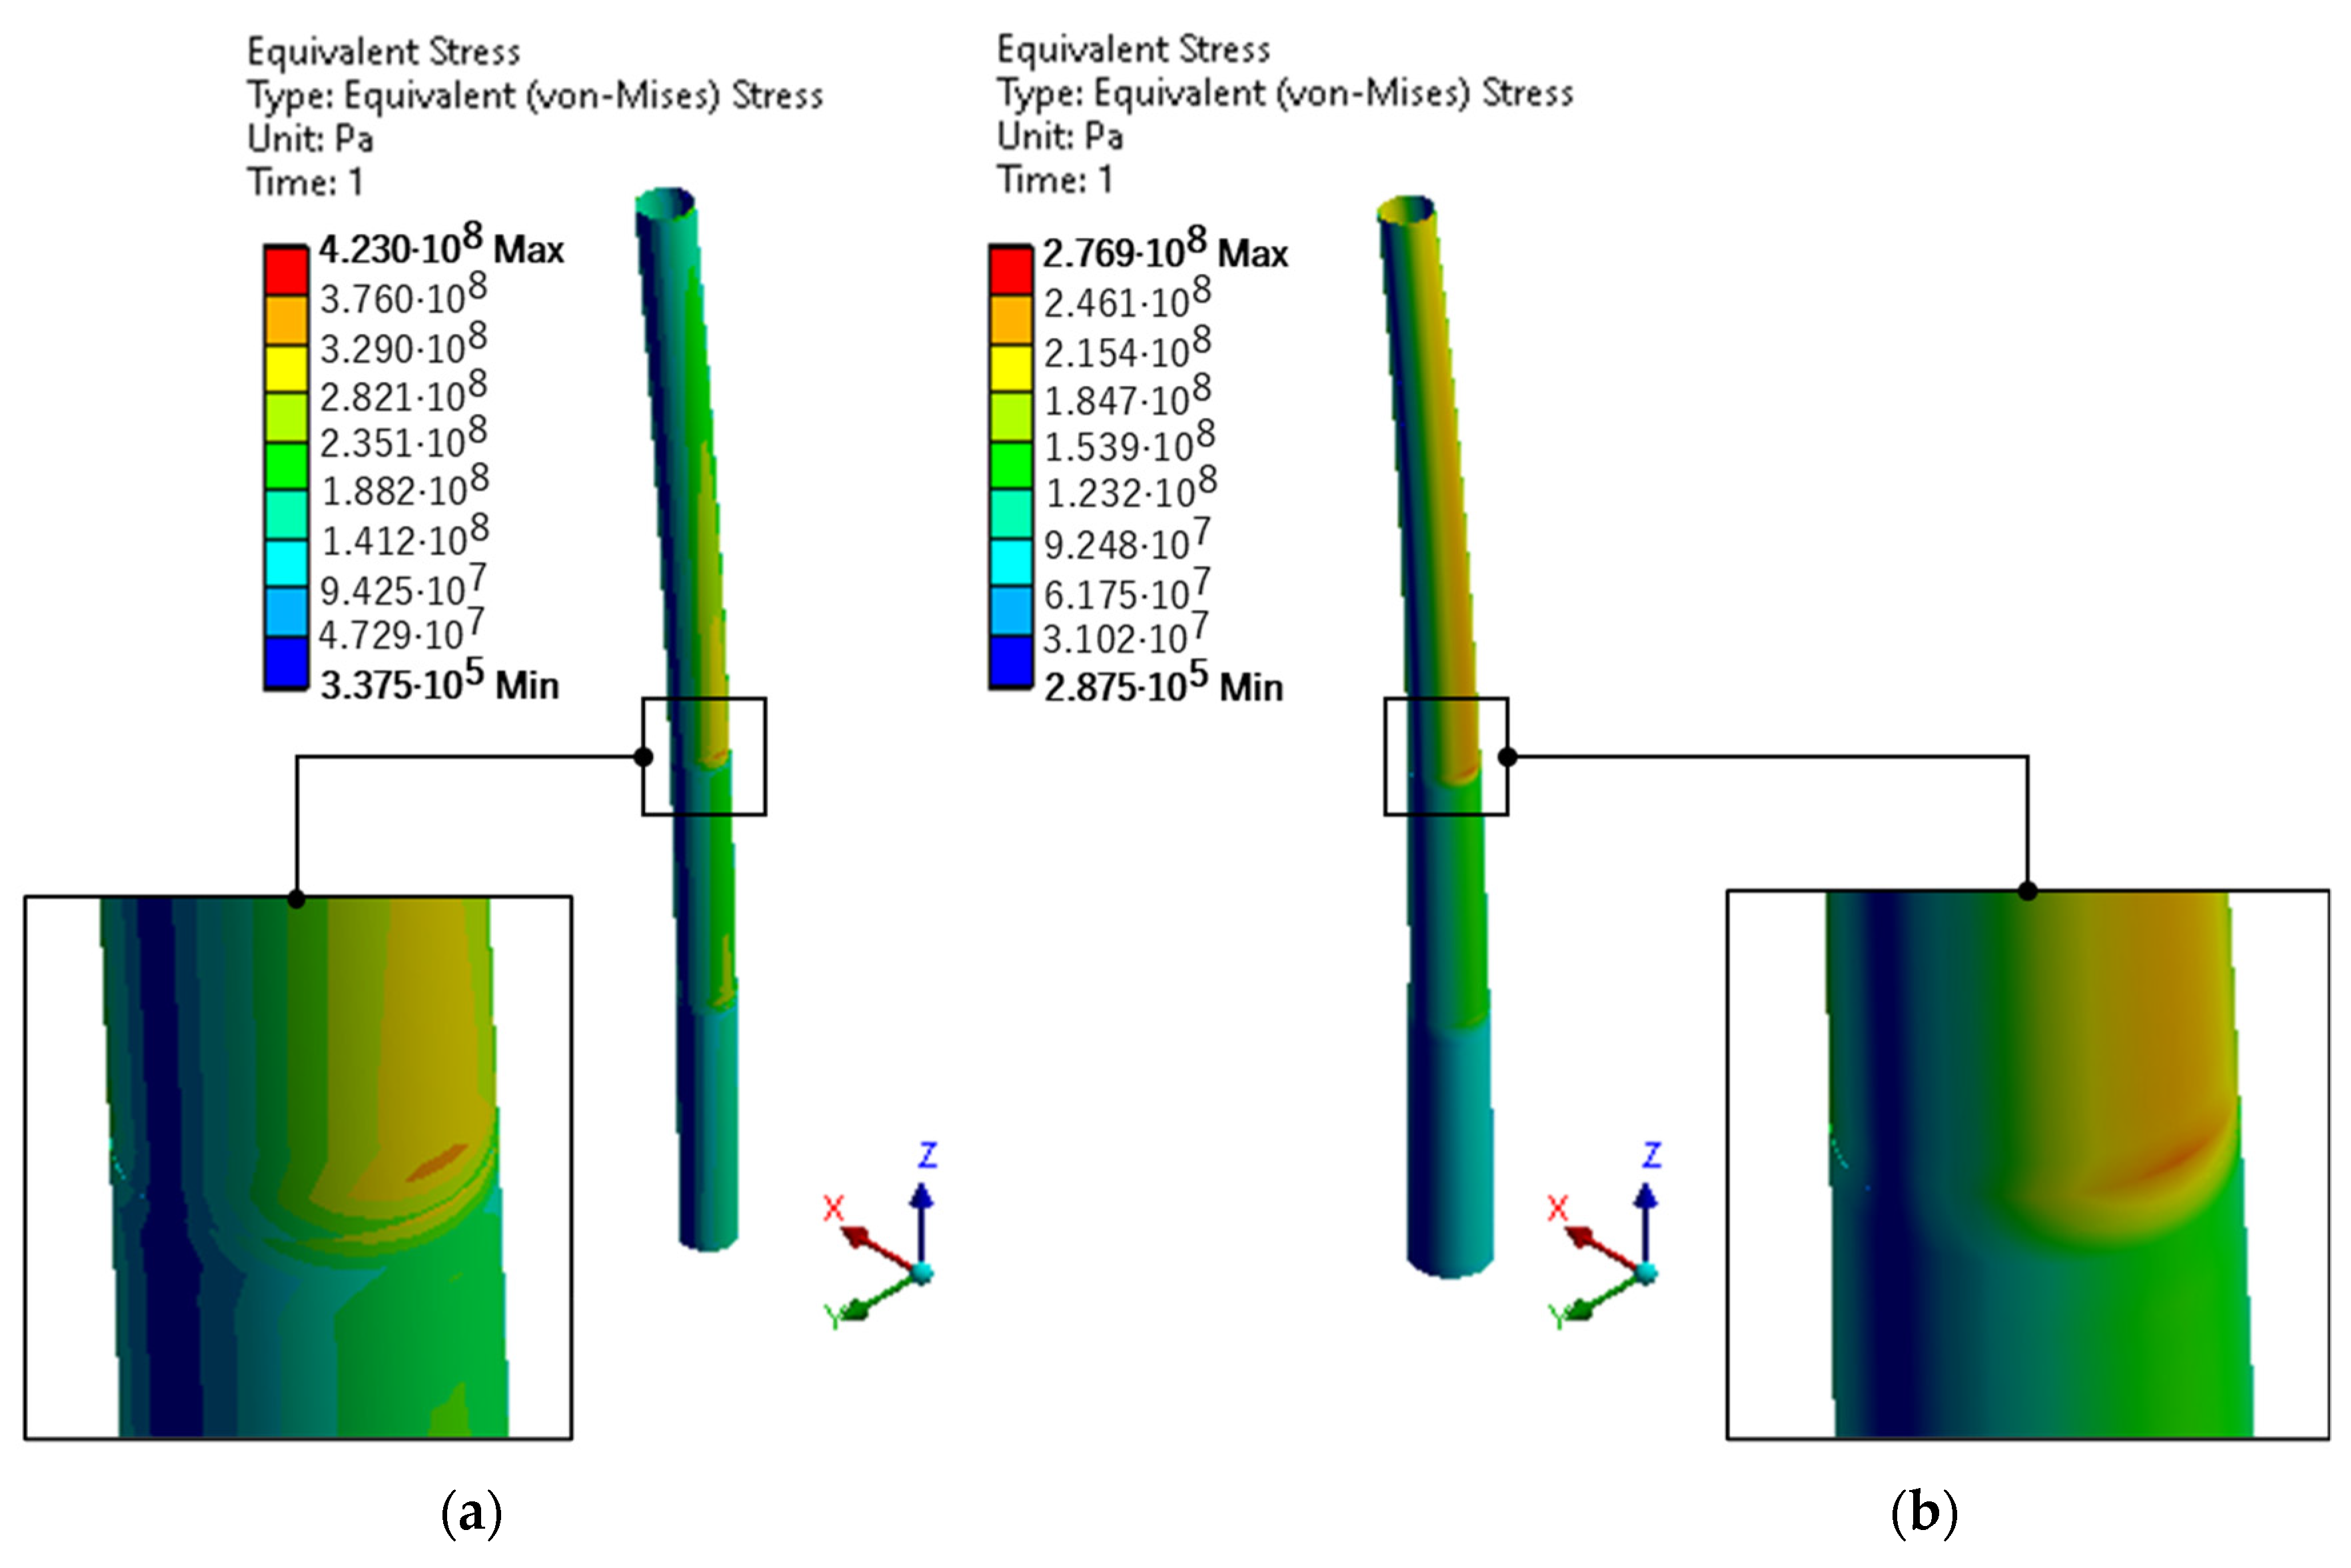
Figure 12 illustrates the distribution of von Mises stress in extreme wind conditions. We can see that the cylindrical tower had a von Mises stress value of 423 MPa; this exceeds the allowable value such that the cylindrical structure was not safe. The value of the conical tower had a von Mises stress of 277 MPa. The conical structure was safe both in normal operating conditions and in extreme conditions.
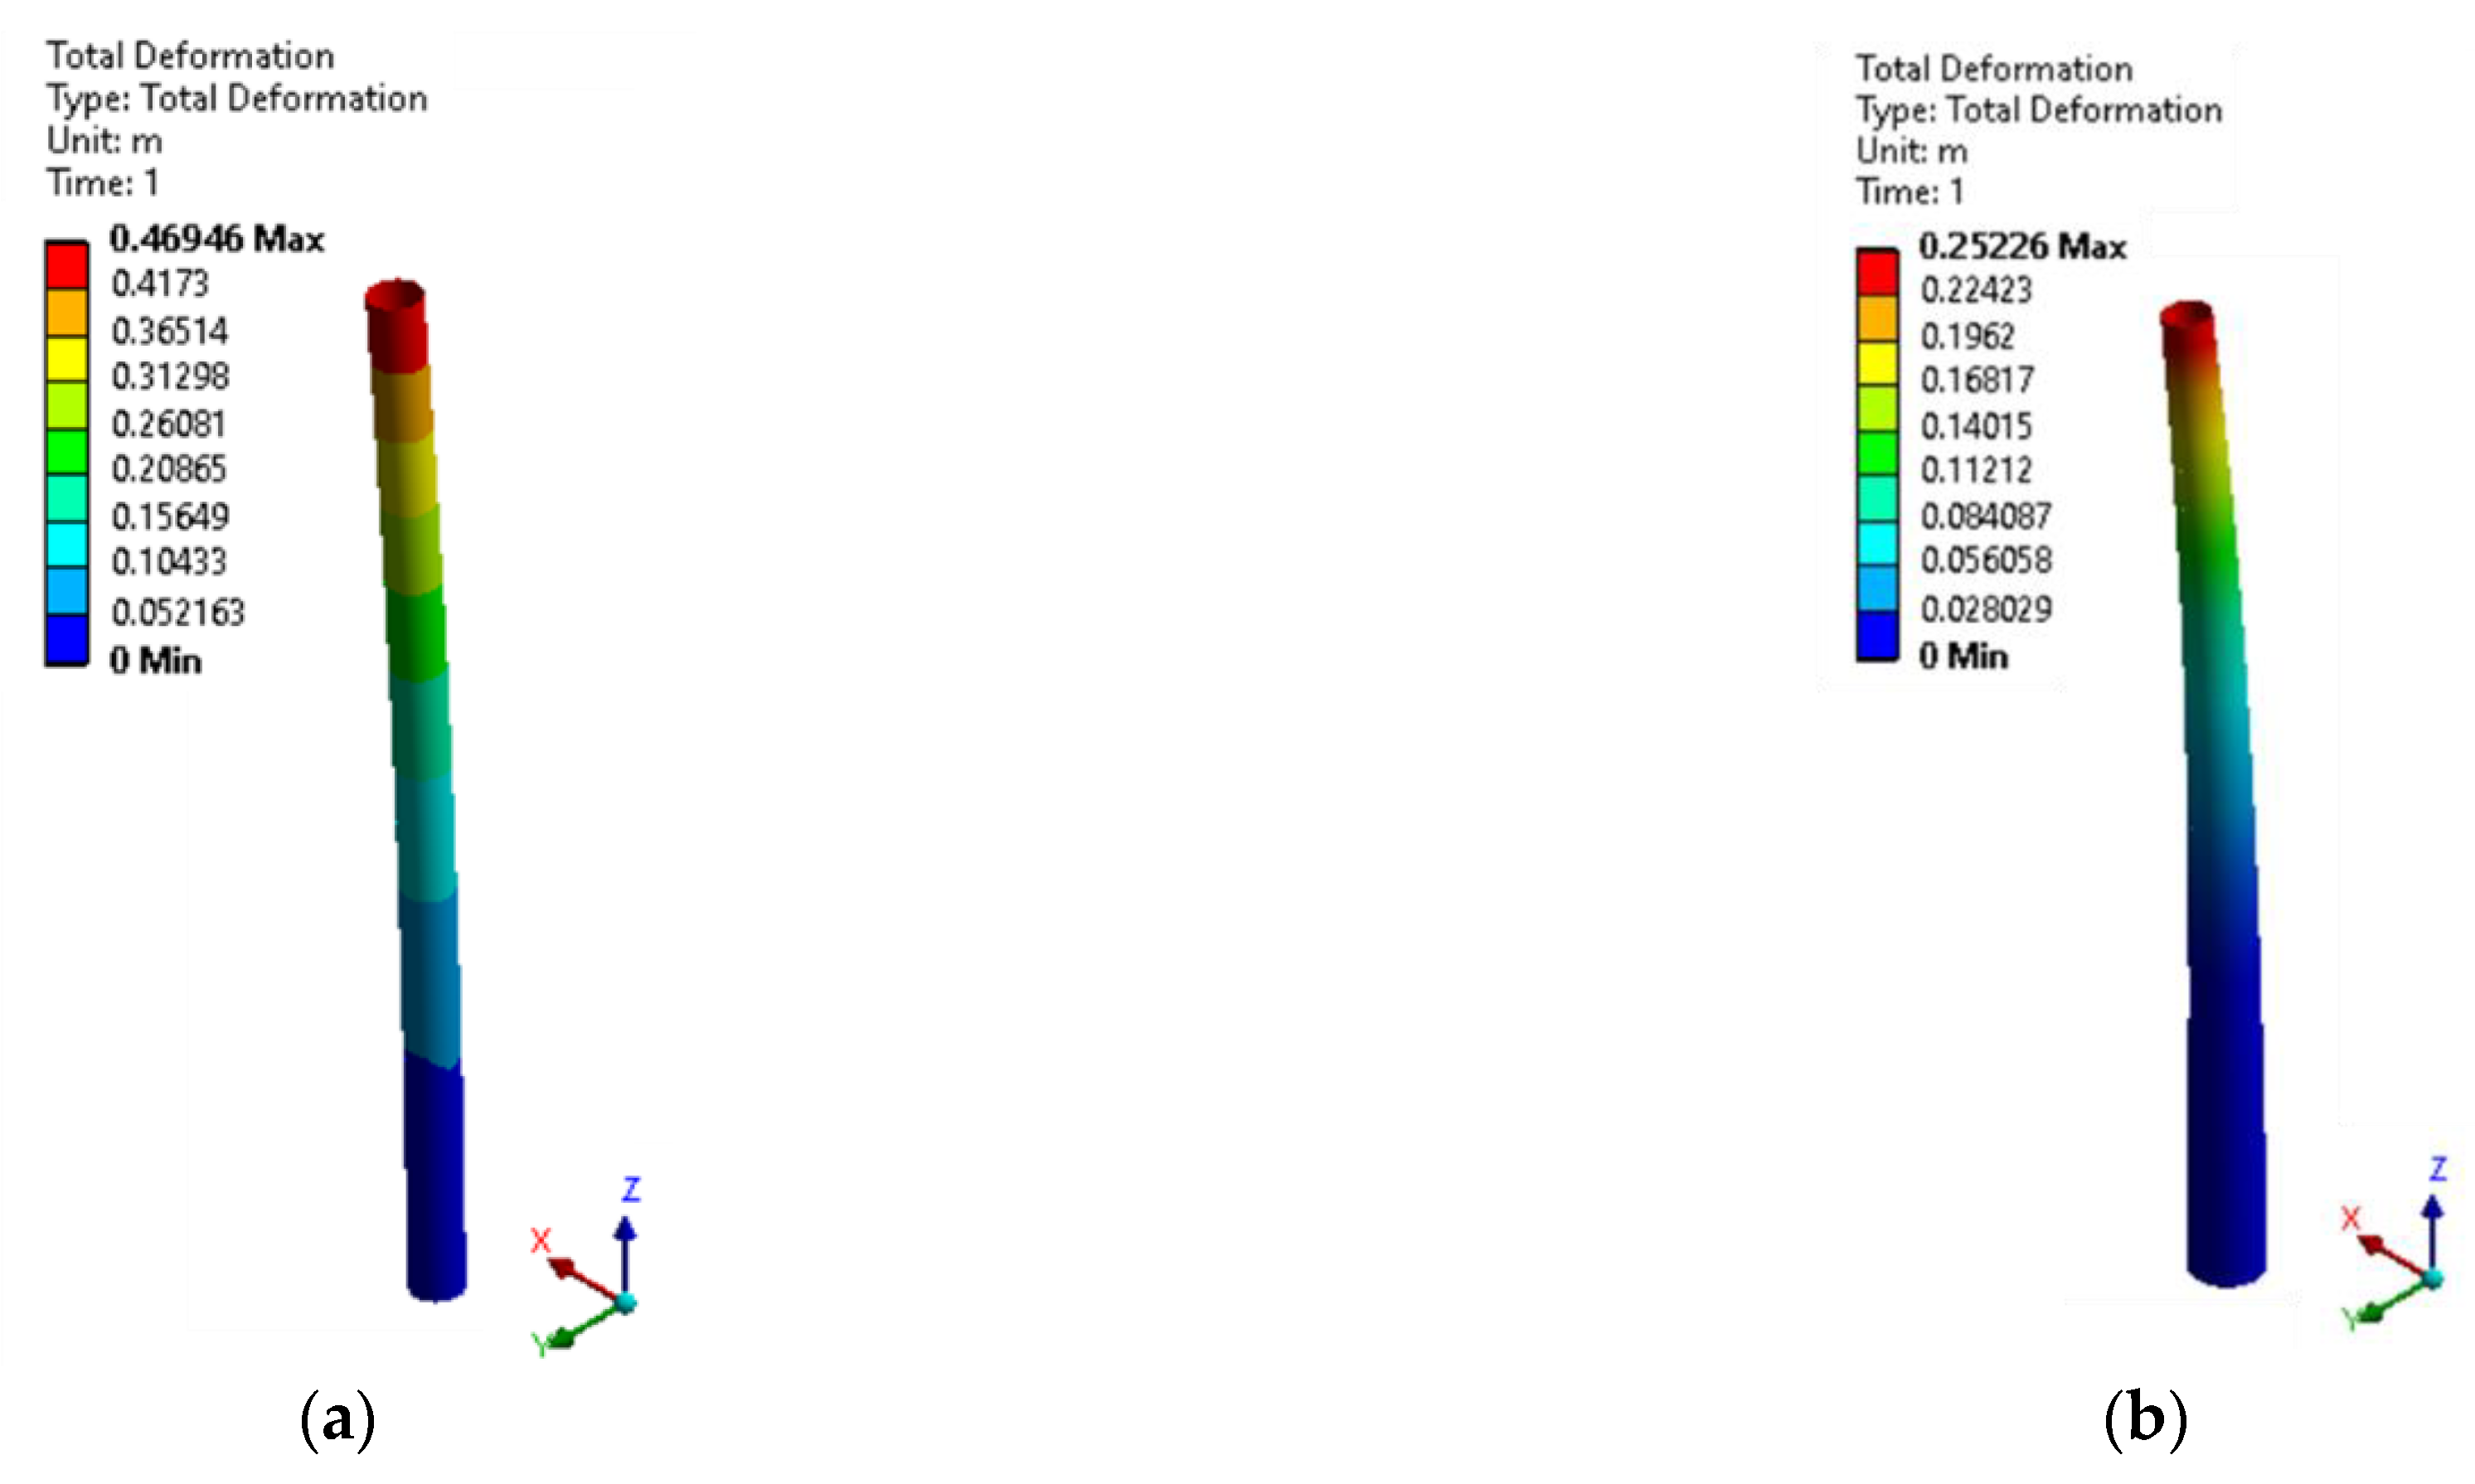
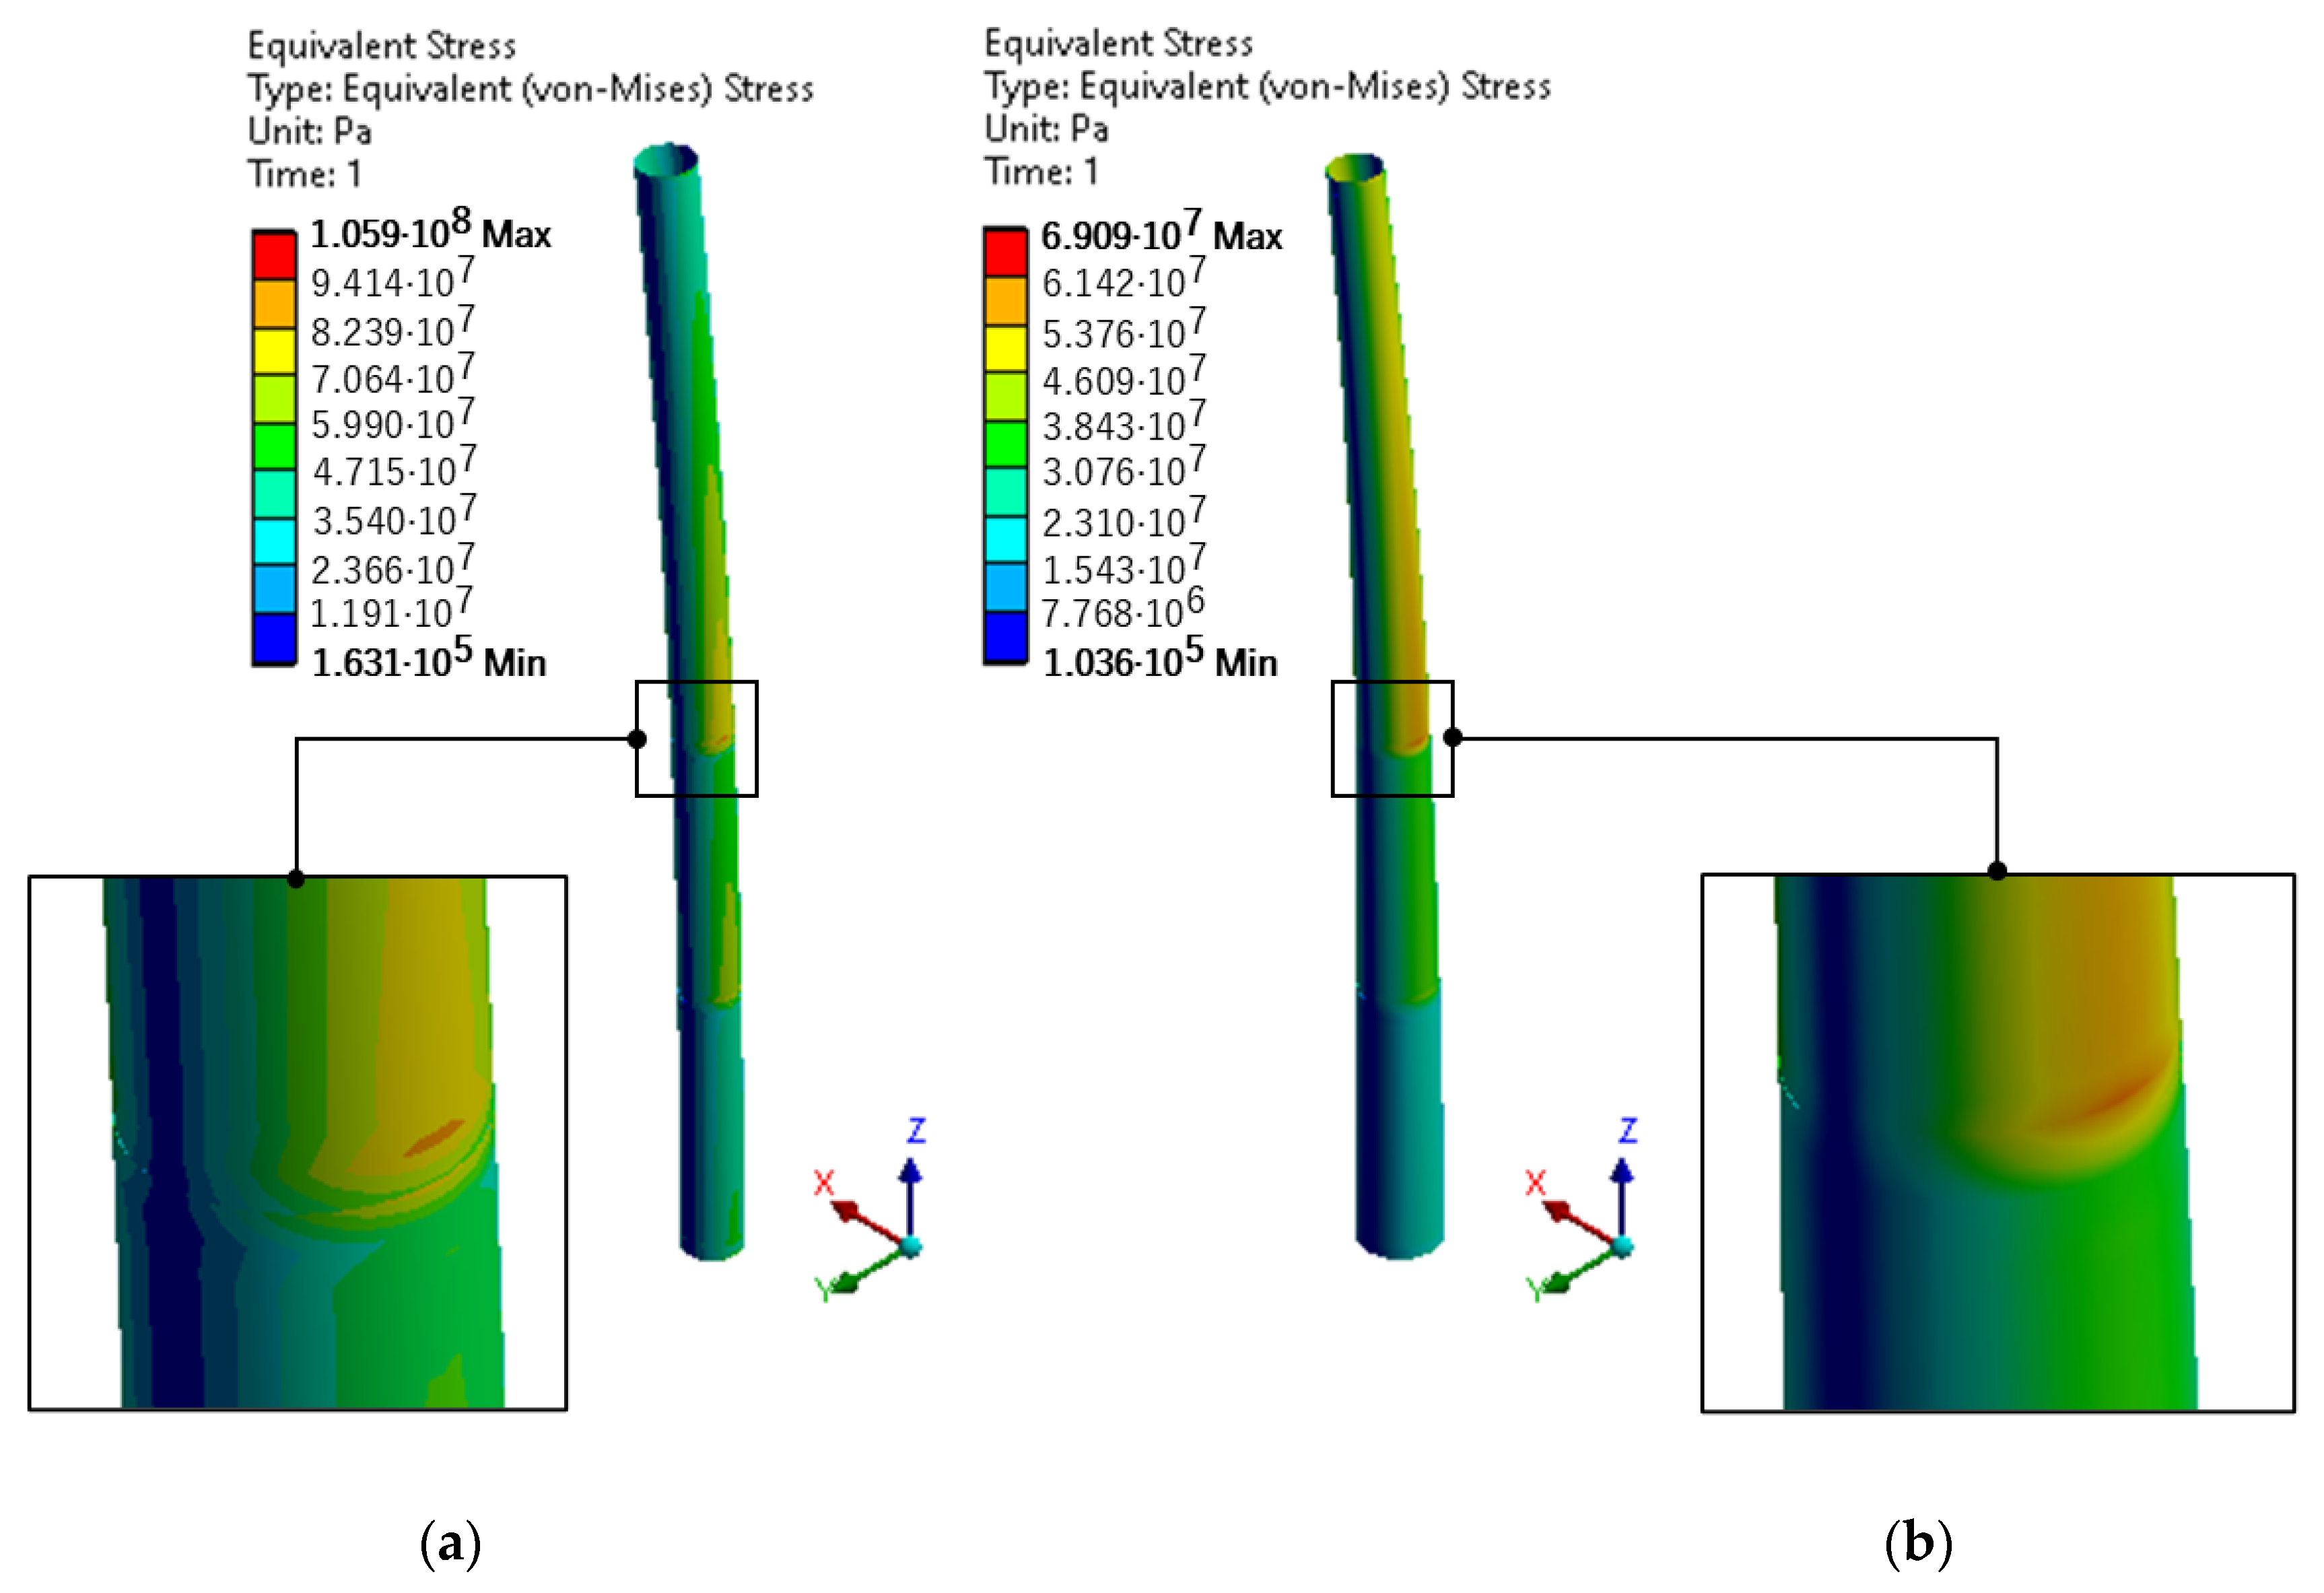
Figure 13 and Figure 14 illustrate the total deformations and von Mises stresses. From them, it can be observed that the results are similar to those in Figure 9 and Figure 11; this is because the wind speeds were also close.
As we reduced the thickness, the overall mass of the two towers reduced too, along with their frequencies. From Table 6, we can observe that there was a tendency for the natural frequencies to reduce as the thickness decreased too. For vibration mode 1, all of the values obtained relative to all of thicknesses were in the range mentioned in Equation (8), which means that the resonance effect was avoided regardless of the chosen thickness. In addition, the deformations tended to increase with the reduction in the tower’s thickness, but no value exceeded the maximum allowable limit of 1.05 m. The highest value was obtained in the case of the cylindrical tower where the thickness was reduced by 50%. The von Mises stress also had an increasing tendency as well as deformations, but even these did not exceed the allowable limit established with the help of Equations (11) and (12).

4. Conclusions

This study aimed to evaluate two towers of a wind turbine: one with a cylindrical shape and the other one with a conical shape. The reference parameters were adopted from the Vestas V112-3 MW offshore wind turbine and are shown in Figure 1. The virtual models of the two towers were built using the ANSYS software.
Following the modal analysis, a 0.5 m mesh size was adopted, because the difference between the 0.25 m mesh and the 0.5 m mesh was almost imperceptible. The natural frequency for the cylindrical tower was 0.361 Hz, and for the conical tower it was 0.512, with both frequencies being between 0.224 and 0.640 Hz; thus, the resonance effect was avoided.
A static analysis was performed for two cases: when the turbine was operating in normal conditions, up to a cut-out speed of 25 m/s; when the turbine was no longer functional and the wind speed was 50 m/s. The forces applied on the tower, both for the normal case and the failure case, were given by the thrust force provided by the wind and acting on the blades, the bending moment of the blades, the distributed wind load on the tower, the gravitational force given the weight of the supported components (nacelle, blades, and rotor) and the weight of the tower.
The deformations of the two towers in normal operating conditions were below the allowable value, being smaller by more than 50%. In extreme wind conditions, the deformations for the conical structure were close to the admissible limit, and those for the cylindrical tower exceeded this admissible limit. The maximum deformations for both the conical and the cylindrical tower were located at the upper part of the tower, at a height of 84 m. If we consider a diameter for the cylindrical tower that is equivalent to the conical structure, the deformation obtained had a value of 1.18 m, a value that still exceeds the allowable deformation. Thus, the conical structure exhibited better resistance than the cylindrical one. The optimal diameter for the structure to deform below the allowable limit was 5.2 m (for this diameter, a maximum deformation of 1.02 m was obtained) a difference of 1 m from the diameter chosen for this work.
The von Mises stresses for the two towers under normal operating conditions were below the allowable value, the allowable stress being 305 MPa and those obtained for the cylinder and conical tower were 65 and 100 MPa, respectively; these values were four and three times lower than the allowable stress. In extreme wind conditions, the cylindrical structure exceeded the allowable value by approximately 118 MPa, while the conical tower was still below the allowable value. The highest stresses were identified in the coupling area of the tower sections, especially at the transition area from the wall thickness of 30–19 mm (at a height of 40 m). High stresses were also found at the junction between the 50 and 30 mm thick sections (at a height of 20 m). The reason why the stresses were found in these areas and not at the bottom of the tower, as would have been normal, is that the two towers were designed without flanges. If we consider the same diameter of 5.2 m, the von Mises stress would be below the allowable value, having a value of 287 MPa.
To validate the model in the paper, we compared the results obtained with the reference [43], which performed measurements on a turbine with a pillar that had a height of 80 m. This study consisted of placing sensors at different heights (on four levels, from level 0 to level 3) and measuring several types of signals, which were acceleration, strain, temperature, and inclination. The paper also presented a finite element model made with the help of the LUSAS software. This model was developed to determine whether it was viable and could be used in further analyses. The conclusion was that the results could be interpreted and computed using FE models. Following the study, a value for the natural frequencies for mode 1 was obtained being close to the value of 0.340 Hz. The values obtained from this paper were 0.361 Hz for the cylindrical tower and 0.512 Hz for the conical one. These differences were due to the thicknesses of the plates, which for the current study, were larger than those in the reference study; Table 6, however, showed a tendency of these frequencies to decrease with the decrease in thickness. Moreover, the differences are given by the diameters chosen for the towers. Taking into account all these aspects, we can say that the towers had similar frequencies, and the reference paper can serve as a method of validating the model developed in this paper. In addition, the value of the maximum stresses under the action of a wind speed of 25 m/s was approximately 70 MPa, and those for the towers in the study were approximately 100 and 65 MPa, respectively.
Following the study, a possible direction was identified towards the efficiency of this type of turbine, taking into account the possibility of placing it in the Black Sea, where the wind speed does not have such a high intensity, but the productivity of such a turbine can be approximately 45%. It was observed that by reducing the thickness of the sheets, the turbine would be strong enough for this location.

Author Contributions

A.I.D. carried out the statistical analysis and interpreted the results, wrote the final form of the manuscript, and drew the conclusions; E.R. conceived the paper’s scope, methodology, and contributed to the final form of the manuscript in terms of editing; G.A. performed the literature review, editing, supervision, and contributed to the design of the article. The final manuscript was approved by all authors. All authors have read and agreed to the published version of the manuscript.

Funding

This work was carried out in the framework of the research project DREAM (Dynamics of the Resources and Technological Advance in Harvesting Marine Renewable Energy), supported by the Romanian Executive Agency for Higher Education, Research, Development, and Innovation Funding-UEFISCDI (grant number: PN-III-P4-ID-PCE-2020-0008).

Institutional Review Board Statement

Not applicable.

Conflicts of Interest

The authors declare no conflict of interest.

References

  1. Post, E.; Alley, R.B.; Christensen, T.R.; Macias-Fauria, M.; Forbes, B.C.; Gooseff, M.N.; Iler, A.; Kerby, J.T.; Laidre, K.L.; Mann, M.E. The polar regions in a 2 C warmer world. Sci. Adv. 2019, 5, eaaw9883. [Google Scholar] [CrossRef] [PubMed] [Green Version]
  2. Akbar, M.; Hussain, A.; Akbar, A.; Ullah, I. The dynamic association between healthcare spending, CO2 emissions, and human development index in OECD countries: Evidence from panel VAR model. Environ. Dev. Sustain. 2021, 23, 10470–10489. [Google Scholar] [CrossRef]
  3. Shakoor, A.; Ashraf, F.; Shakoor, S.; Mustafa, A.; Rehman, A.; Altaf, M.M. Biogeochemical transformation of greenhouse gas emissions from terrestrial to atmospheric environment and potential feedback to climate forcing. Environ. Sci. Pollut. Res. 2020, 27, 38513–38536. [Google Scholar] [CrossRef] [PubMed]
  4. IEA. Global Energy Review 2021; IEA (International Energy Agency): Paris, France, 2021. [Google Scholar]
  5. bp. Statistical Review of World Energy 2021; BP p.l.c.: London, UK, 2021. [Google Scholar]
  6. Vivek, C.M.; Ramkumar, P.; Srividhya, P.K.; Sivasubramanian, M. Recent strategies and trends in implanting of renewable energy sources for sustainability–A review. Mater. Today Proc. 2021, 46, 8204–8208. [Google Scholar] [CrossRef]
  7. Van de Graaf, T. Fragmentation in Global Energy Governance: Explaining the Creation of IRENA. Glob. Environ. Politics 2011, 13, 14–33. [Google Scholar] [CrossRef]
  8. IRENA. Renewable Capacity Statistics 2021; International Renewable Energy Agency (IRENA): Abu Dhabi, United Arab Emirates, 2021. [Google Scholar]
  9. National Statistics. Energy Trends; National Statistics: London, UK, 2021. [Google Scholar]
  10. Higgins, P.; Foley, A. The evolution of offshore wind power in the United Kingdom. Renew. Sustain. Energy Rev. 2014, 37, 599–612. [Google Scholar] [CrossRef]
  11. MCA. MGN 372 (M+ F) Offshore Renewable Energy Installations (OREIs): Guidance to Mariners Operating in the Vicinity of UK OREIs; Maritime and Coastguard Agency: Southampton, UK, 2008. [Google Scholar]
  12. Navadeh, N.; Goroshko, I.; Zhuk, Y.; Moghadam, F.E.; Fallah, A.S. Finite element analysis of wind turbine blade vibrations. Vibration 2021, 4, 310–322. [Google Scholar] [CrossRef]
  13. Bottasso, C.L.; Campagnolo, F.; Croce, A.; Dilli, S.; Gualdoni, F.; Nielsen, M.B. Structural optimization of wind turbine rotor blades by multilevel sectional/multibody/3D-FEM analysis. Multibody Syst. Dyn. 2014, 32, 87–116. [Google Scholar] [CrossRef]
  14. Wang, L.; Liu, X.; Kolios, A. State of the art in the aeroelasticity of wind turbine blades: Aeroelastic modelling. Renew. Sustain. Energy Rev. 2016, 64, 195–210. [Google Scholar] [CrossRef] [Green Version]
  15. Kaveh, A.; Sabeti, S. Optimal design of monopile offshore wind turbine structures using CBO, ECBO, and VPS algorithms. Sci. Iran. 2019, 26, 1232–1248. [Google Scholar] [CrossRef] [Green Version]
  16. Muskulus, M.; Schafhirt, S. Design optimization of wind turbine support structures—A review. J. Ocean Wind Energy 2014, 1, 12–22. [Google Scholar]
  17. O’Leary, K.; Pakrashi, V.; Kelliher, D. Optimization of composite material tower for offshore wind turbine structures. Renew. Energy 2019, 140, 928–942. [Google Scholar] [CrossRef]
  18. Gutiérrez, E.; Primi, S.; Taucer, F.; Caperan, P.; Tirelli, D.; Mieres, J.; Calvo, I.; Rodriguez, J.; Vallano, F.; Galiotis, C. A wind turbine tower design based on the use of fibre-reinforced composites. In MEGAWIND FP5 Project, ENK5-CT-2000-00328; ELSA: Ispra, Italy, 2003; p. 163. [Google Scholar]
  19. Young, A.C.; Goupee, A.J.; Dagher, H.J.; Viselli, A.M. Methodology for optimizing composite towers for use on floating wind turbines. J. Renew. Sustain. Energy 2017, 9, 33305. [Google Scholar] [CrossRef]
  20. Uys, P.E.; Farkas, J.; Jarmai, K.; Van Tonder, F. Optimisation of a steel tower for a wind turbine structure. Eng. Struct. 2007, 29, 1337–1342. [Google Scholar] [CrossRef]
  21. Wang, L.; Kolios, A.; Luengo, M.M.; Liu, X. Structural optimisation of wind turbine towers based on finite element analysis and genetic algorithm. Wind Energy Sci. Discuss. 2016, 153, 1–26. [Google Scholar]
  22. Jonkman, J.; Butterfield, S.; Musial, W.; Scott, G. Definition of a 5-MW Reference Wind Turbine for Offshore System Development; National Renewable Energy Lab. (NREL): Golden, CO, USA, 2009. [Google Scholar]
  23. Zhu, R.S.; Zheng, Z.Z.; Liu, Y.M.; Shen, J.; Xiao, Y.; Jiang, D.X.; Chen, J. Finite Element Analysis for MW Wind Turbine Tower. In Applied Mechanics and Materials; Trans Tech Publications Ltd.: Stafa-Zurich, Switzerland, 2012; Volume 130, pp. 124–127. [Google Scholar]
  24. Li, X.L.; Ren, L.M. Finite Element Analysis of Wind Turbine Tower. In Applied Mechanics and Materials; Trans Tech Publications Ltd.: Stafa-Zurich, Switzerland, 2013; Volume 351, pp. 825–828. [Google Scholar]
  25. Joshi, Y.S.; Alandkar, M.P.M. Finite Element Analysis of Connections for Wind Turbine Towers; ACADEMIA: San Francisco, CA, USA, 2017. [Google Scholar]
  26. Diaf, S.; Notton, G.; Belhamel, M.; Haddadi, M.; Louche, A. Design and techno-economical optimization for hybrid PV/wind system under various meteorological conditions. Appl. Energy 2008, 85, 968–987. [Google Scholar] [CrossRef]
  27. Diaconita, A.I.; Rusu, L.; Andrei, G. A Local Perspective on Wind Energy Potential in Six Reference Sites on the Western Coast of the Black Sea Considering Five Different Types of Wind Turbines. Inventions 2021, 6, 44. [Google Scholar] [CrossRef]
  28. Shittu, A.A.; Mehmanparast, A.; Wang, L.; Salonitis, K.; Kolios, A. Comparative study of structural reliability assessment methods for offshore wind turbine jacket support structures. Appl. Sci. 2020, 10, 860. [Google Scholar] [CrossRef] [Green Version]
  29. Chantharasenawong, C.; Jongpradist, P.; Laoharatchapruek, S. Preliminary design of 1.5-MW modular wind turbine tower. In Proceedings of the 2nd TSME International Conference on Mechanical Engineering, Krabi, Thailand, 19–21 October 2011. [Google Scholar]
  30. Dagli, B.Y.; Tuskan, Y.; Gökkuş, Ü. Evaluation of offshore wind turbine tower dynamics with numerical analysis. Adv. Civ. Eng. 2018, 2018, 1–11. [Google Scholar] [CrossRef] [Green Version]
  31. Liu, Y.; Chen, D.; Yi, Q.; Li, S. Wind Profiles and Wave Spectra for Potential Wind Farms in South China Sea. Part I: Wind Speed Profile Model. Energies 2017, 10, 125. [Google Scholar] [CrossRef] [Green Version]
  32. Manwell, J.F.; McGowan, J.G.; Rogers, A.L. Wind Energy Explained: Theory, Design and Application; Wiley: Chichester, UK, 2009. [Google Scholar]
  33. Hellmann, G. Über die Bewegung der Luft in den untersten Schichten der Atmosphäre. Meteoral. Z. 1916, 34, 273. [Google Scholar]
  34. Albani, A.; Ibrahim, M.Z. Wind Energy Potential and Power Law Indexes Assessment for Selected Near-Coastal Sites in Malaysia. Energies 2017, 10, 307. [Google Scholar] [CrossRef] [Green Version]
  35. International Electrotechnical Commission. Wind Turbines—Part 1: Design Requirements; Tech. Doc. IEC 61400-1; International Electrotechnical Commission: Geneva, Switzerland, 2005. [Google Scholar]
  36. American Bureau of Shipping (ABS). Guide for Building and Classing Offshore Wind Turbine Installation; ABS: Houston, TX, USA, 2014. [Google Scholar]
  37. Hsu, Y.; Wu, W.-F.; Chang, Y.-C. Reliability analysis of wind turbine towers. Procedia Eng. 2014, 79, 218–224. [Google Scholar] [CrossRef] [Green Version]
  38. Liu, H.; Yang, S.; Tian, W.; Zhao, M.; Yuan, X.; Xu, B. Vibration reduction strategy for offshore wind turbines. Appl. Sci. 2020, 10, 6091. [Google Scholar] [CrossRef]
  39. Diaconita, A.; Andrei, G.; Rusu, L. New insights into the wind energy potential of the west Black Sea area based on the North Sea wind farms model. Energy Rep. 2021, 7, 112–118. [Google Scholar] [CrossRef]
  40. Gentils, T.; Wang, L.; Kolios, A. Integrated structural optimisation of offshore wind turbine support structures based on finite element analysis and genetic algorithm. Appl. Energy 2017, 199, 187–204. [Google Scholar] [CrossRef] [Green Version]
  41. Lloyd, G.; Hamburg, G. Guideline for the Certification of Wind Turbines; Germanischer Lloyd Industrial Services GmbH: Hamburg, Germany, 2010. [Google Scholar]
  42. Nicholson, J.C. Design of Wind Turbine Tower and Foundation Systems: Optimization Approach. Ph.D. Thesis, The University of Iowa, Iowa City, IA, USA, 2011. [Google Scholar]
  43. Rebelo, C.; Veljkovic, M.; da Silva, L.S.; Simões, R.; Henriques, J. Structural monitoring of a wind turbine steel tower—Part I: System description and calibration. Wind Struct. 2012, 15, 285. [Google Scholar] [CrossRef]
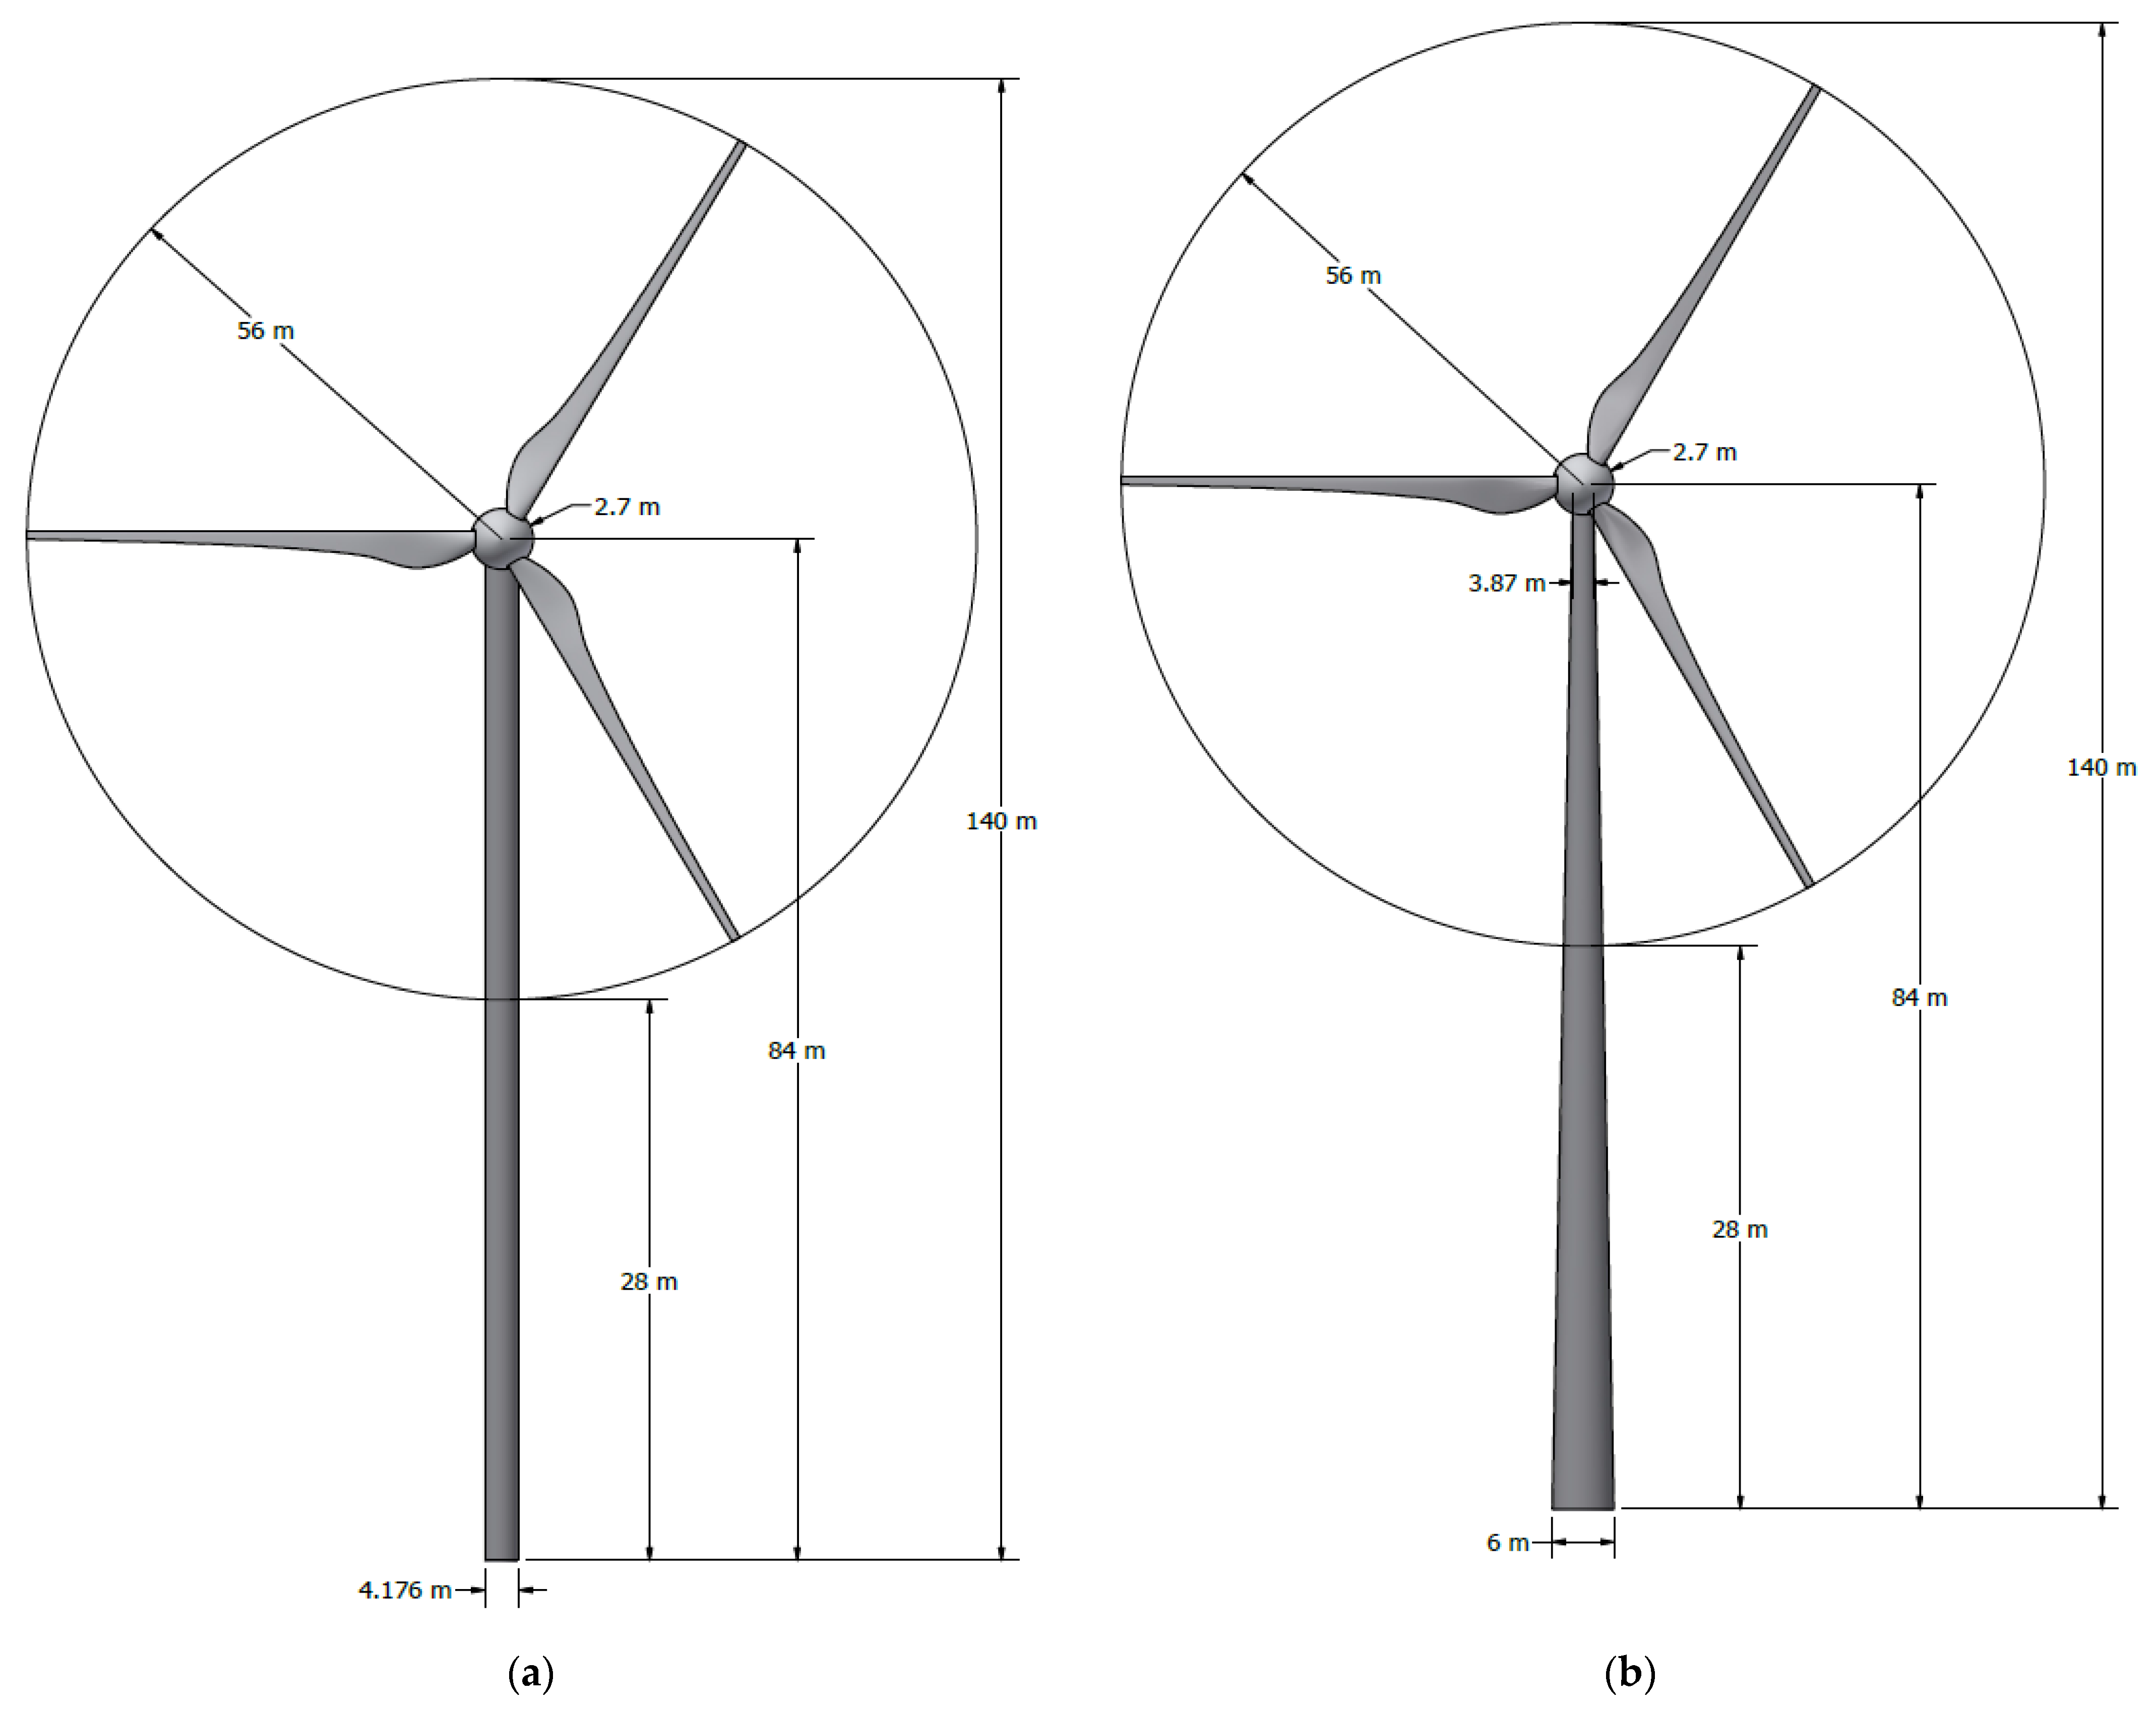
Figure 1. 2D model of the wind turbine with a (a) cylindrical tower; (b) conical tower.
Inventions 07 00011 g001
Figure 2. Power curve and thrust coefficient of the turbine Vestas V112-3 MW.
Inventions 07 00011 g002
Figure 3. The forces and moments considered in this study.
Inventions 07 00011 g003
Figure 4. The pressure applied along the two towers.
Inventions 07 00011 g004
Figure 5. The location of the chosen point.
Inventions 07 00011 g005
Figure 6. Tower geometry: (a) cylindrical; (b) conical.
Inventions 07 00011 g006
Figure 7. The mesh for the two towers: (a) cylindrical tower with 4368 elements; (b) conical tower with 5344 elements.
Inventions 07 00011 g007
Figure 8. Vibration modes of the wind towers: (a) cylindrical tower—first mode; (b) cylindrical tower—third mode; (c) cylindrical tower—fifth mode; (d) conical tower—first mode; (e) conical tower—third mode; (f) conical tower—seventh mode.
Inventions 07 00011 g008aInventions 07 00011 g008b
Figure 9. Total deformation for the two structures in normal wind conditions: (a) cylindrical tower; (b) conical tower.
Inventions 07 00011 g009
Figure 10. Total deformation for the two structures in extreme wind conditions: (a) cylindrical tower; (b) conical tower.
Inventions 07 00011 g010
Figure 11. Distribution of von Mises stresses on the two structures in normal wind conditions: (a) cylindrical tower; (b) conical tower.
Inventions 07 00011 g011
Figure 12. Distribution of von Mises stresses on the two structures in extreme wind conditions: (a) cylindrical tower; (b) conical tower.
Inventions 07 00011 g012
Figure 13. Total deformation of the two structures under the conditions of the Black Sea: (a) cylindrical tower; (b) conical tower.
Inventions 07 00011 g013
Figure 14. Distribution of von Mises stresses on the two structures under the conditions of the Black Sea: (a) cylindrical tower; (b) conical tower.
Inventions 07 00011 g014
Table 1. Wind turbine characteristics.
PropertiesValues
Rated capacity3 MW
Wind classIEC Ia
Rotor diameter112 m
Swept area9852 m2
Mass (blades, rotor, nacelle)155 t
Hub height84 m
MaterialSteel S355JR
Type of towerCylindricalConical
Tower diameter4.176 m6 m at base
3.87 at top
Table 2. Vestas V122-3 MW material characteristics.
PropertiesValues
Young’s modulus (E)200·103 MPa
Density (ρ)7800 kg/m3
Poisson’s ratio (ν)0.3
Table 3. Data regarding the chosen location.
DataValues
LocationBlack Sea
Longitude (°)30.62
Latitude (°)44.68
Depth (m)75.29
Maximum wind speed (m/s)27.17
Mean wind speed (m/s)8.00
Annual energy production (MWh)11,712
Capacity factor (%)45
Table 4. Tower wall thickness.
SegmentThickness
Segment 150 mm
Segment 230 mm
Segment 319 mm
Segment 419 mm
Table 5. The modal frequencies for the four sizes of the mesh elements.
Type of TowerModal Frequencies
(Hz)
Mesh Size
2 m1 m0.5 m0.25 m
Cylindrical10.359840.360790.360820.36084
20.359850.360790.360820.36084
32.973902.914202.905402.90390
42.974102.917502.906702.90450
53.138702.977802.977902.97790
63.155602.977802.977902.97790
Conical10.509800.511500.511940.51206
20.510660.511740.511990.51207
32.894802.794702.790802.79140
42.955602.798602.792302.79200
53.456603.366703.363303.36410
63.511603.371003.364903.36480
Table 6. The results obtained for the three types of thicknesses.
Type of TowerParametersBaseline25% Thickness Reduction50% Thickness Reduction
CylindricalMaximum total deformation0.46946 m0.62205 m0.92772 m
Maximum von Mises Stress105.88 MPa138.39 MPa200.88 MPa
Minimum von Mises Stress0.16311 MPa0.38075 MPa0.56118 MPa
1st Natural frequency0.36082 Hz0.32099 Hz0.26951 Hz
ConicalMaximum total deformation0.25226 m0.32420 m0.50011 m
Maximum von Mises Stress69.086 MPa97.276 MPa144.02 MPa
Minimum von Mises Stress0.10357 MPa0.23201 MPa0.20016 MPa
1st Natural frequency0.51194 Hz0.45413 Hz0.38008 Hz
Publisher’s Note: MDPI stays neutral with regard to jurisdictional claims in published maps and institutional affiliations.