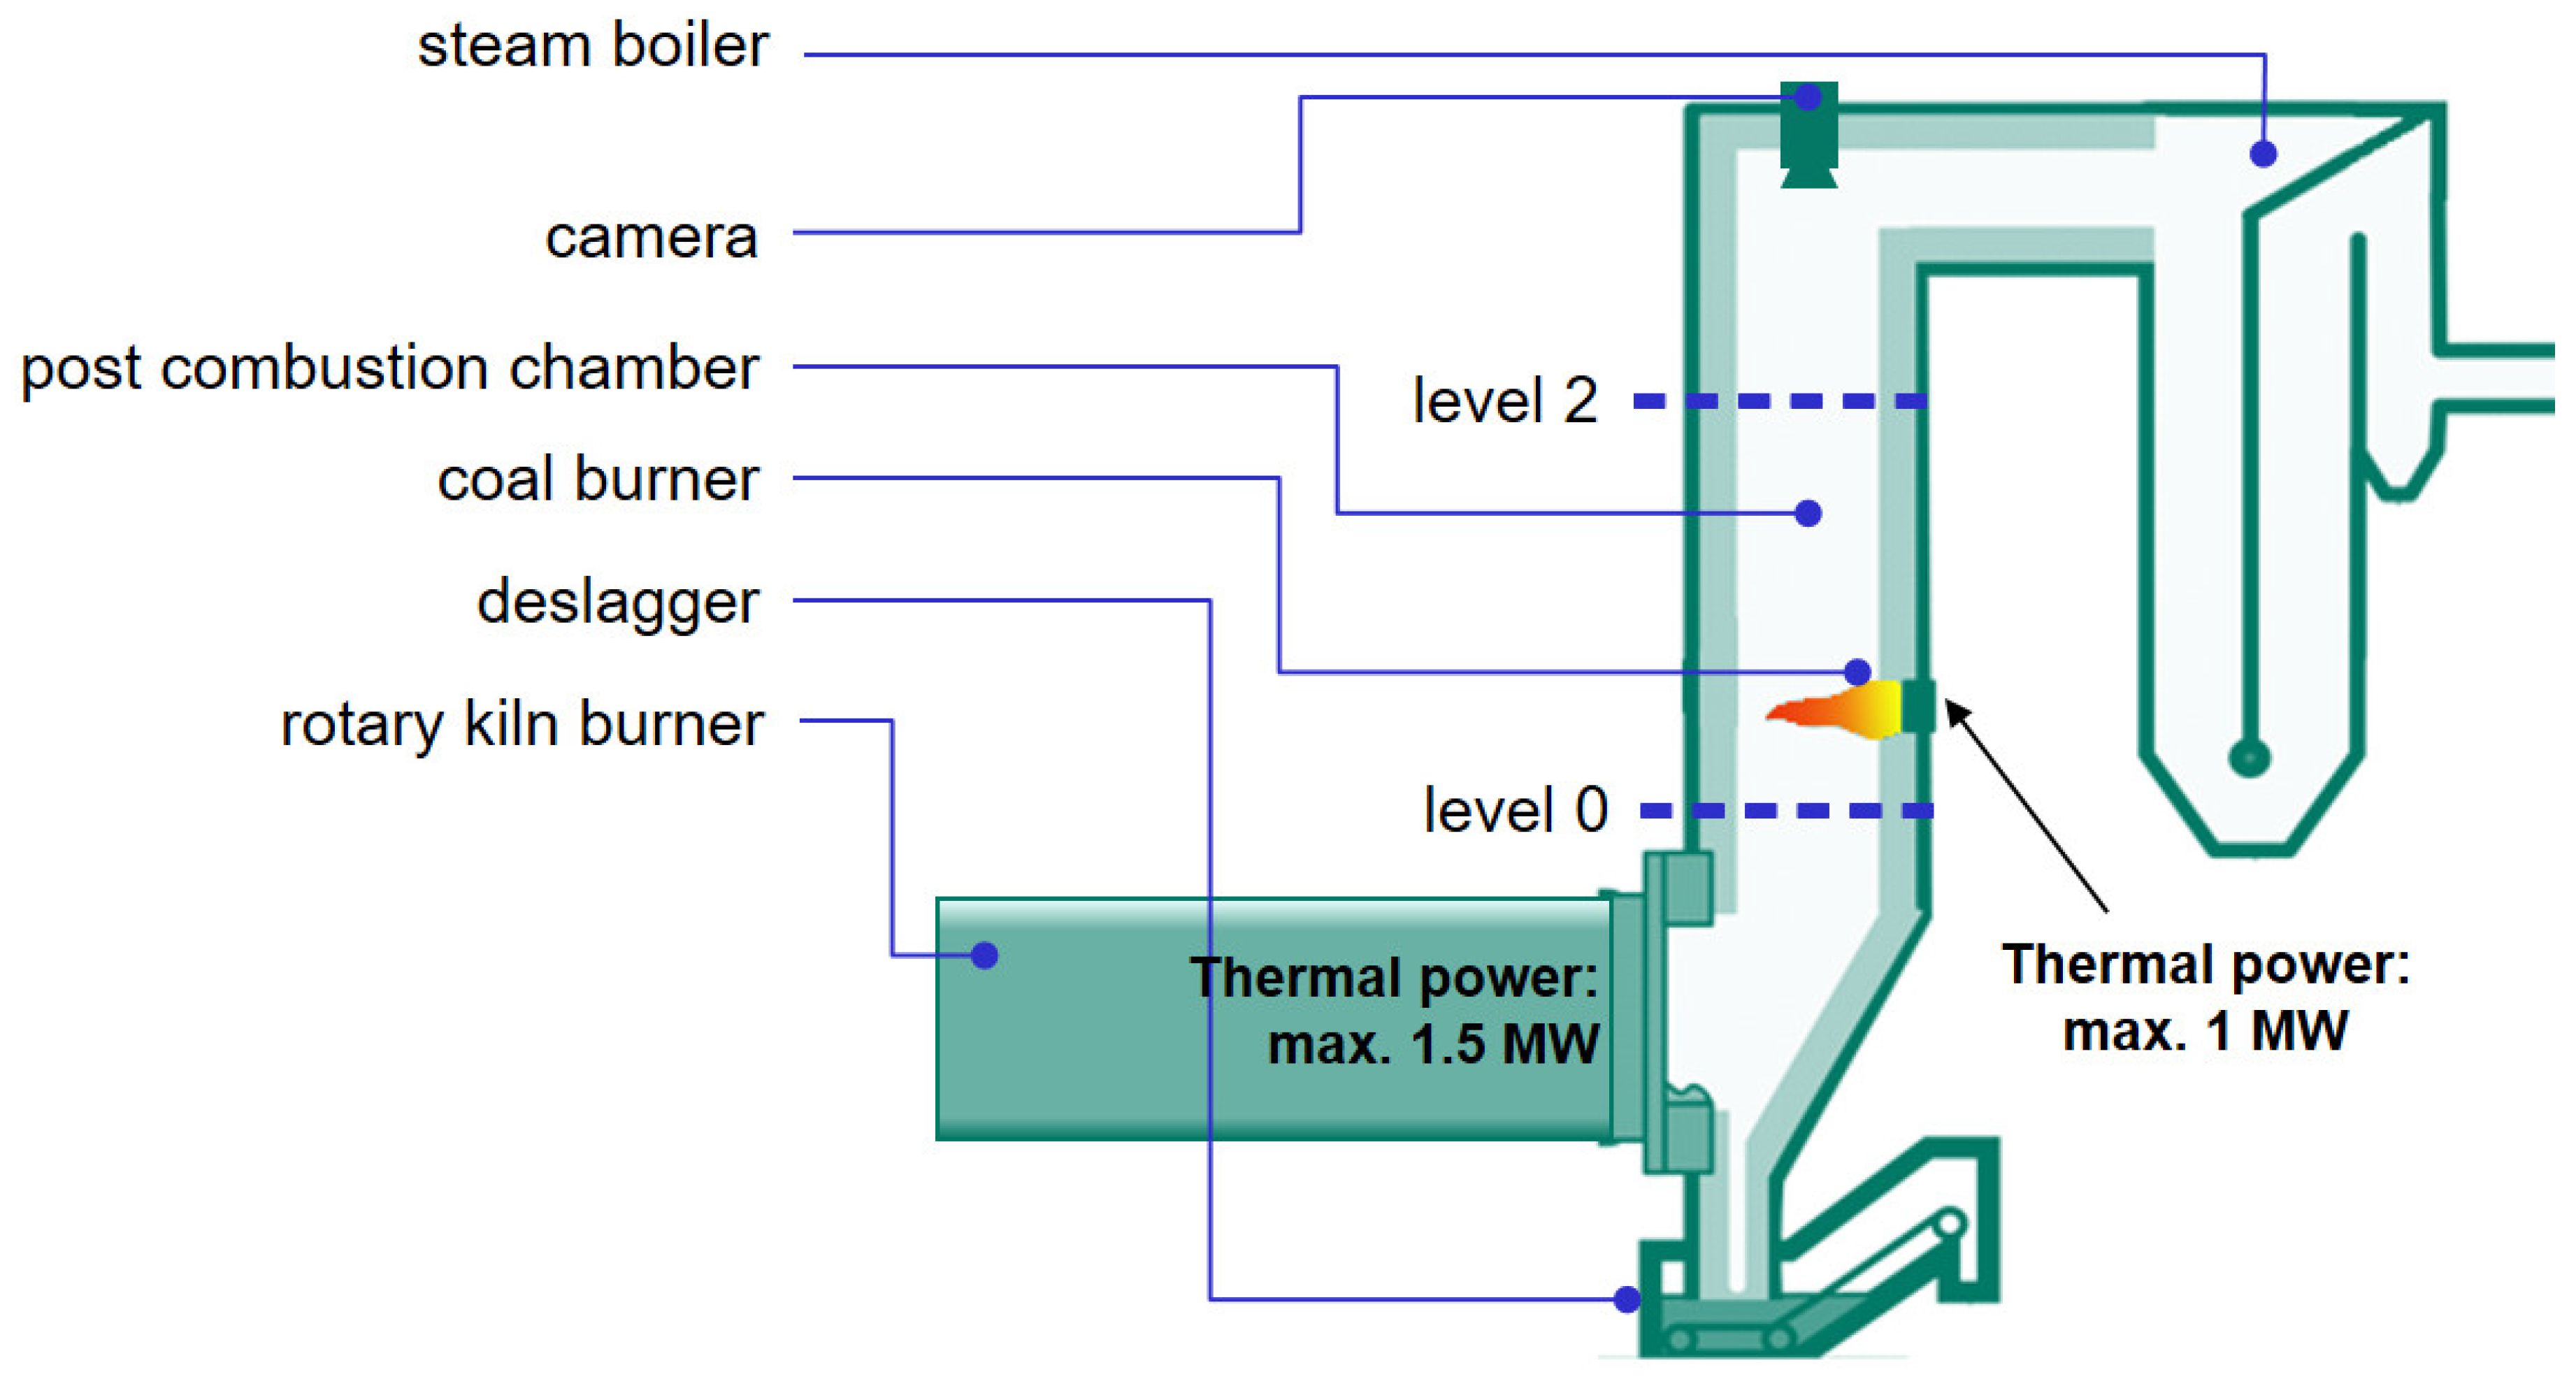
The temperature distribution in the post combustion chamber does not change much in between the different tests due to the thermal power of the rotary kiln, which is always higher than the thermal power of the coal burner (500 kW for 57 kg/h; 620 kW for 70 kg/h and 800 kW for 90 kg/h). The information given here refer to the test presented in Figure 13 with a coal mass flow about 57 kg/h. The values in brackets (“number”) are the data for the case with oscillation. The gaseous species and the temperature in level 0 were measured only during the non-oscillating case. The CO and NOx values are not normalized to 6 Vol.-% of oxygen.
Only a slight decrease of oxygen in the oscillating mode could be recognized while the solid (TC) and gaseous burnout (CO) is quite good for both conditions in level 2.
4.1. Screening Campaign A
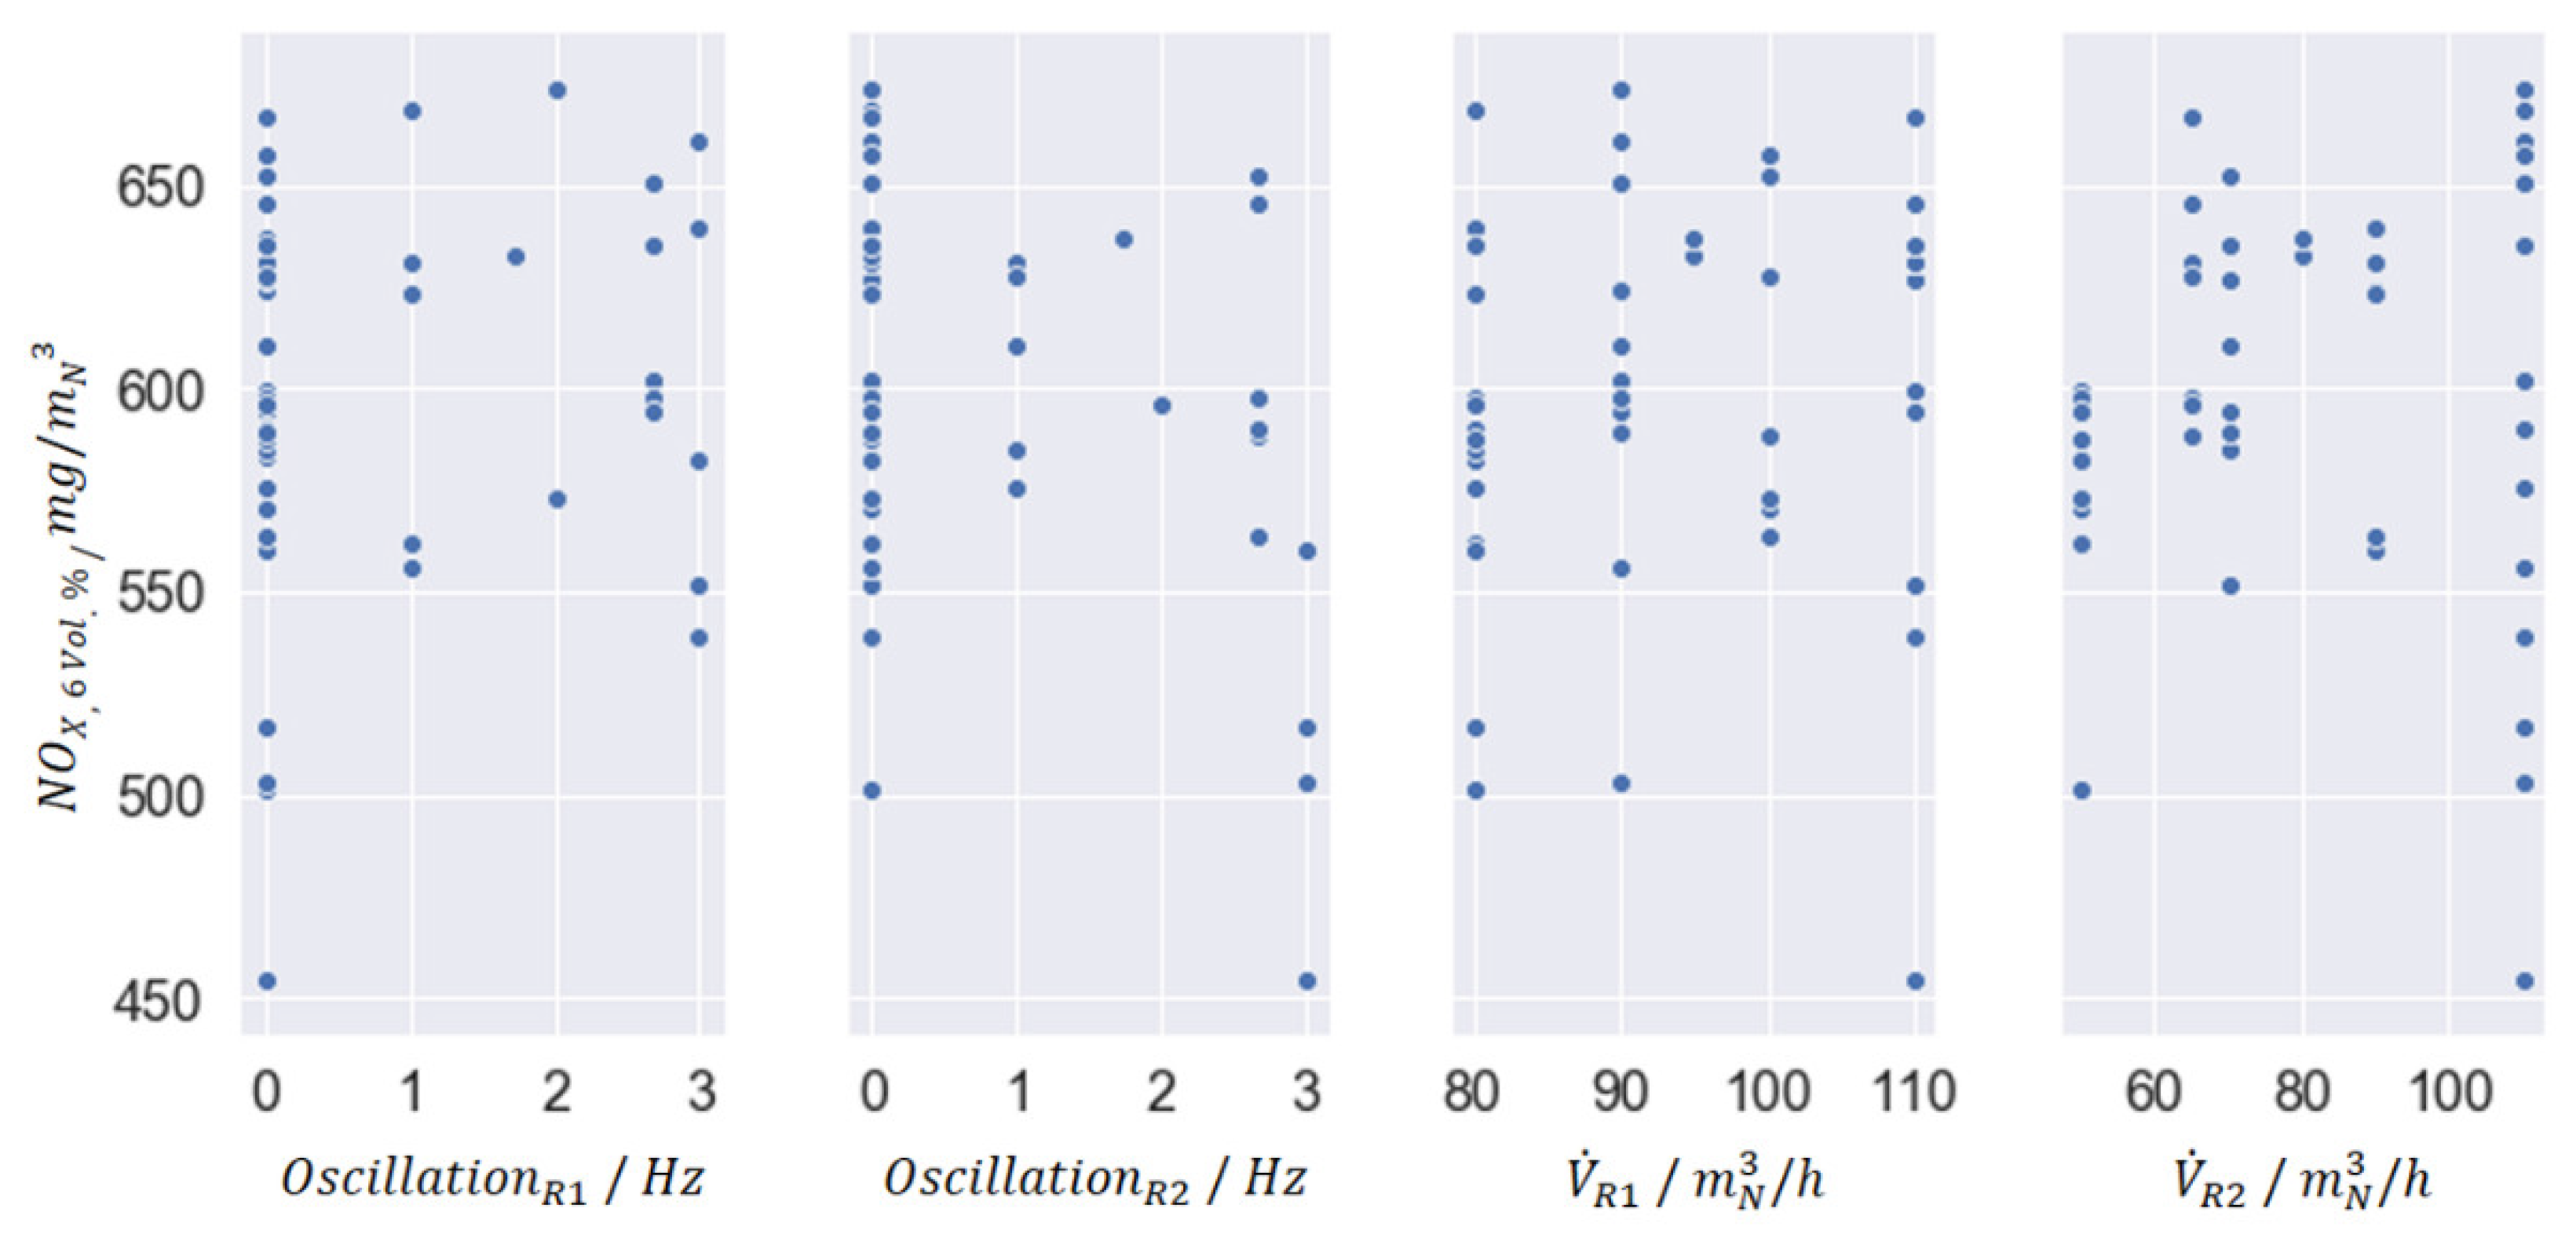
Figure 6 shows the dependence of the nitrogen oxide concentration on the oscillation frequency and the volume flow in R1 and R2 from the statistical test planning. The corresponding parameter levels are listed in
Table 1. The high disperion of the measured data points is a result from the trial plan, since several parameters were changed simultaniously when the one on the
x-axis was kept constant.
The results from the statistical test planning based on campaign A show no obvious dependencies towards the NOx concentrations, so additional calculations with the EDI-Hive-model as well as the expert model are required to get more specific answers for the question: which are the main influencing parameters for the oscillation combustion?
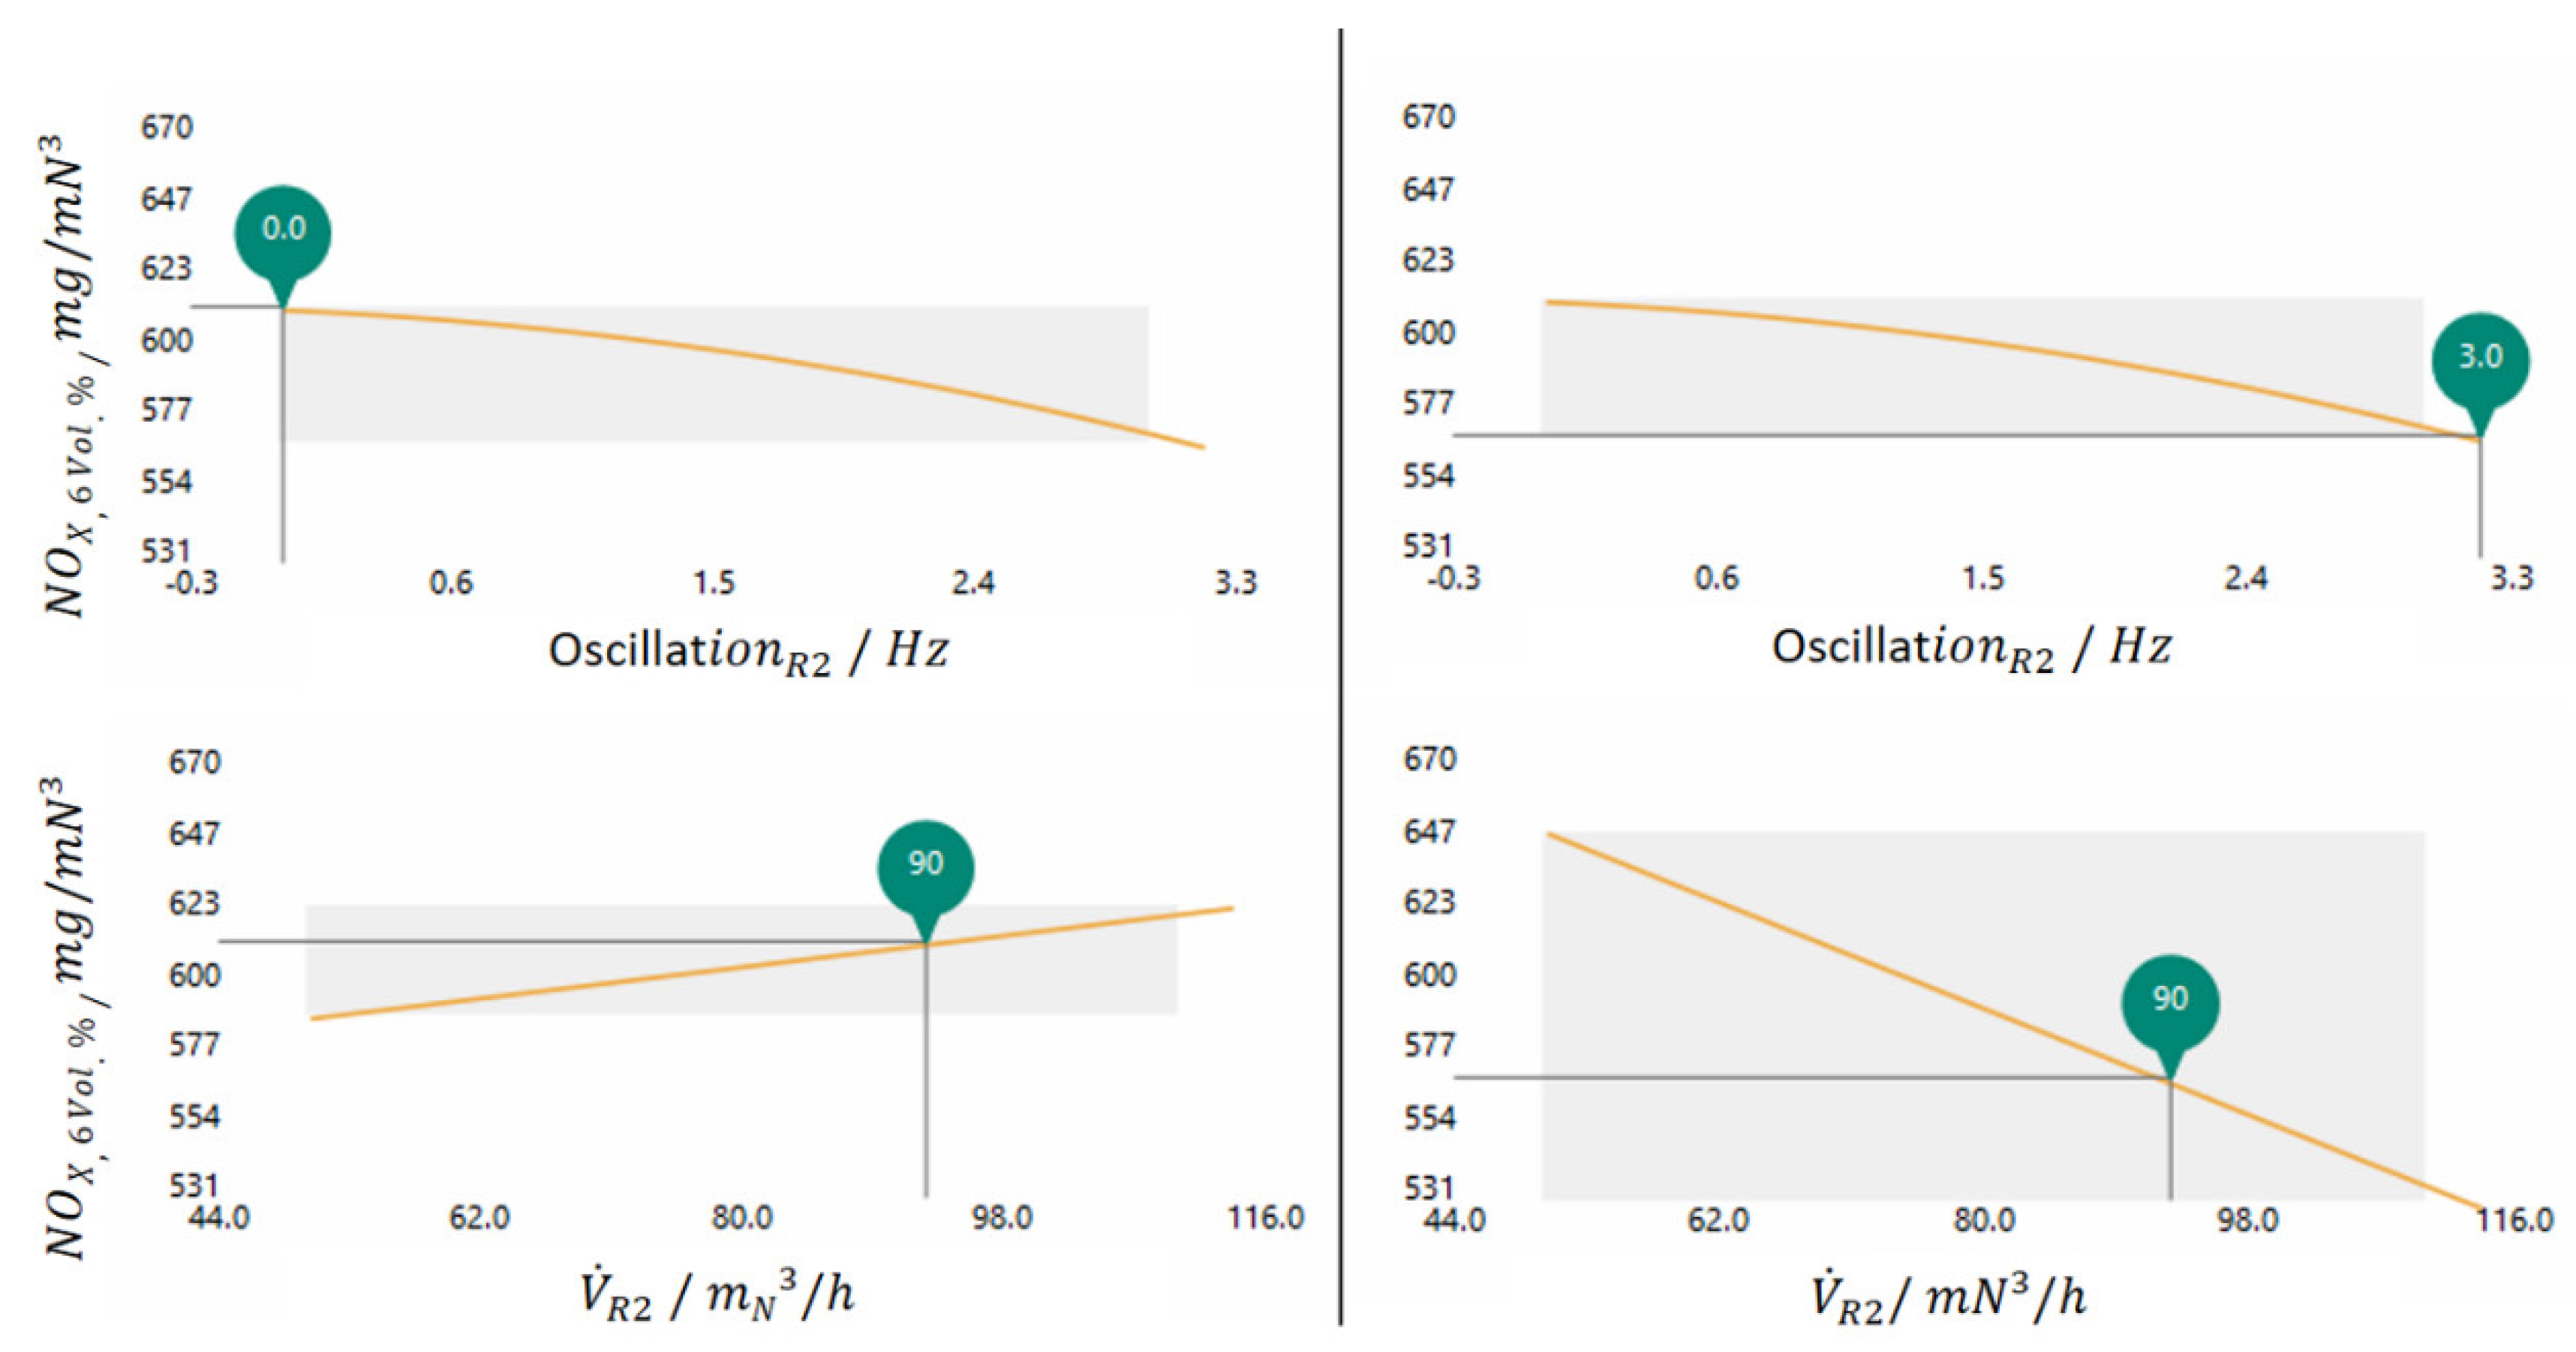
For the analysis of the interaction between the oscillation frequencies and the oscillated air flow in
Figure 7 a statistical calculation tool provided by EDI GmbH (See
https://edi.gmbh/de/, last access date: 18 December 2020) which is based on a multivariate regression was used. Since the shown graphs are calculated by a model, there are no data points plotted in these graphs. The shape of the graphs is based on the linear or quadratic influence on the target variable. For further information about the tool see [
12].
The dependency of nitrogen oxide from the oscillation is shown in the two upper diagrams and the dependency from the volume flow in the two lower diagrams. Now two scenarios are considered, the two diagrams on the left show the progression of the approximated nitrogen oxide concentration for a oscillation frequency of 0 Hz set by the cursor through the orange line. The two diagrams on the right show the NOX concentration at a set oscillation frequency of 3 Hz.
For the diagram of the volume flow dependence in the left part of the figure, the nitrogen oxide concentration is increasing with the volume flow, whereas the dependence of the NOX concentration at a oscillation of 3 Hz in the right part of the figure shows a clear reduction of the NOX concentration with increasing volume flow. The point at which the effect of the volume flow dependence reverses in R2 could be determined with the model generator and is at a oscillation frequency of 0.8 Hz.
The evaluation shows that without oscillation the increase in the volume flow leads to an increase in the NOX concentration. At a oscillation of 3 Hz the increase of the volume flow leads to a significant reduction of the nitrogen oxide concentration.
In the case of a volume flow increase without oscillation, the provision of more oxygen leads to higher emission values of the nitrogen oxides. The NH
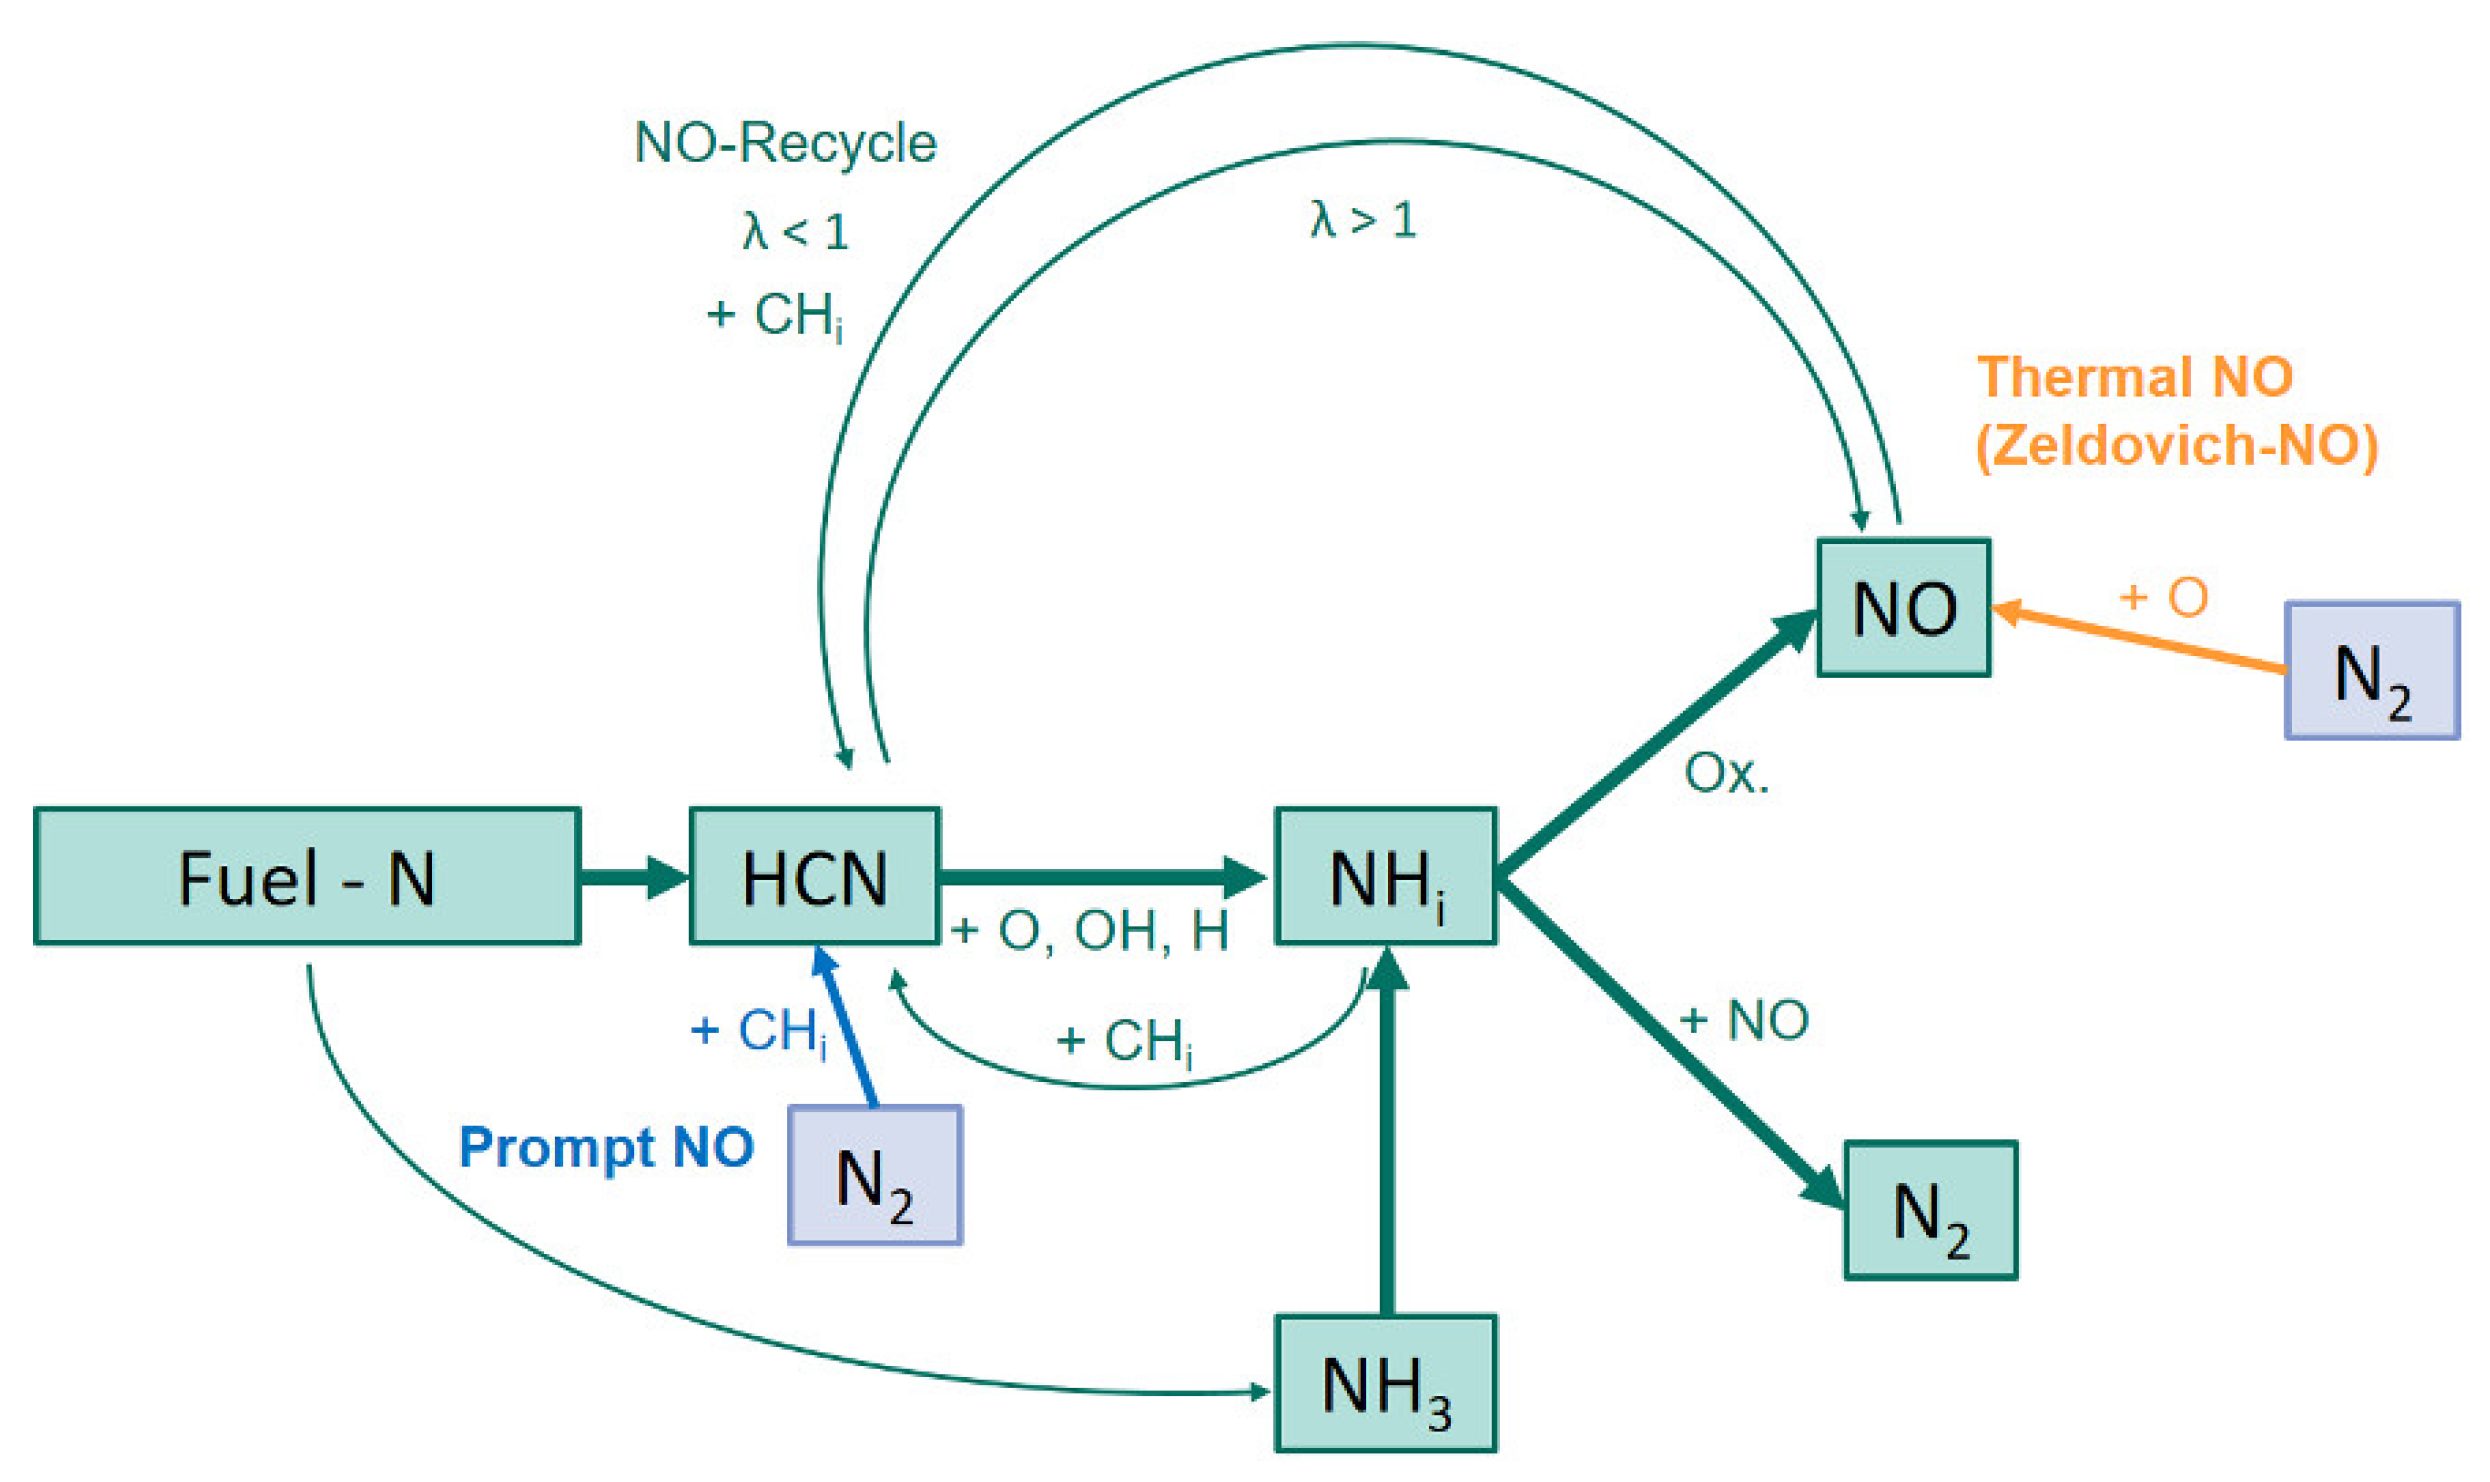
i species from
Figure 1 react directly to NO under these conditions and the reaction to molecular nitrogen is inhibited here. In the case of an increase in volume flow at a oscillation of 3 Hz, a similar result should also be obtained. But apparently a more concise oscillating profile of the local stoichiometry can be generated by oscillation of higher volume flows. This allows the reaction of the formed NO to molecular nitrogen in the time gaps of the interruption of the volume flow. It should be mentioned that a higher volumetric flow has a larger impulse than a lower volumetric flow due to the equation
. The higher the impulse of air (by an increase of the volumetric flow and corresponding to a higher velocity) the better the interruption of the coal mass flow is possible. Not to the extent that the oscillation of the fuel flow would cause it, but to the extent that favourable reaction conditions prevail for the reduction of nitrogen oxide emissions.
4.2. Expert Model
A second tool was applied based on the data from campaign A including the knowledge of experts. The expert model includes all influencing parameters that were specifically modified in the statistical design of the experiment, as well as the air ratio
, the swirl number S and the interaction of volume flow and oscillation in annular gap R1 and annular gap R2. The explanatory variables and their abbreviations for the following considerations are shown in
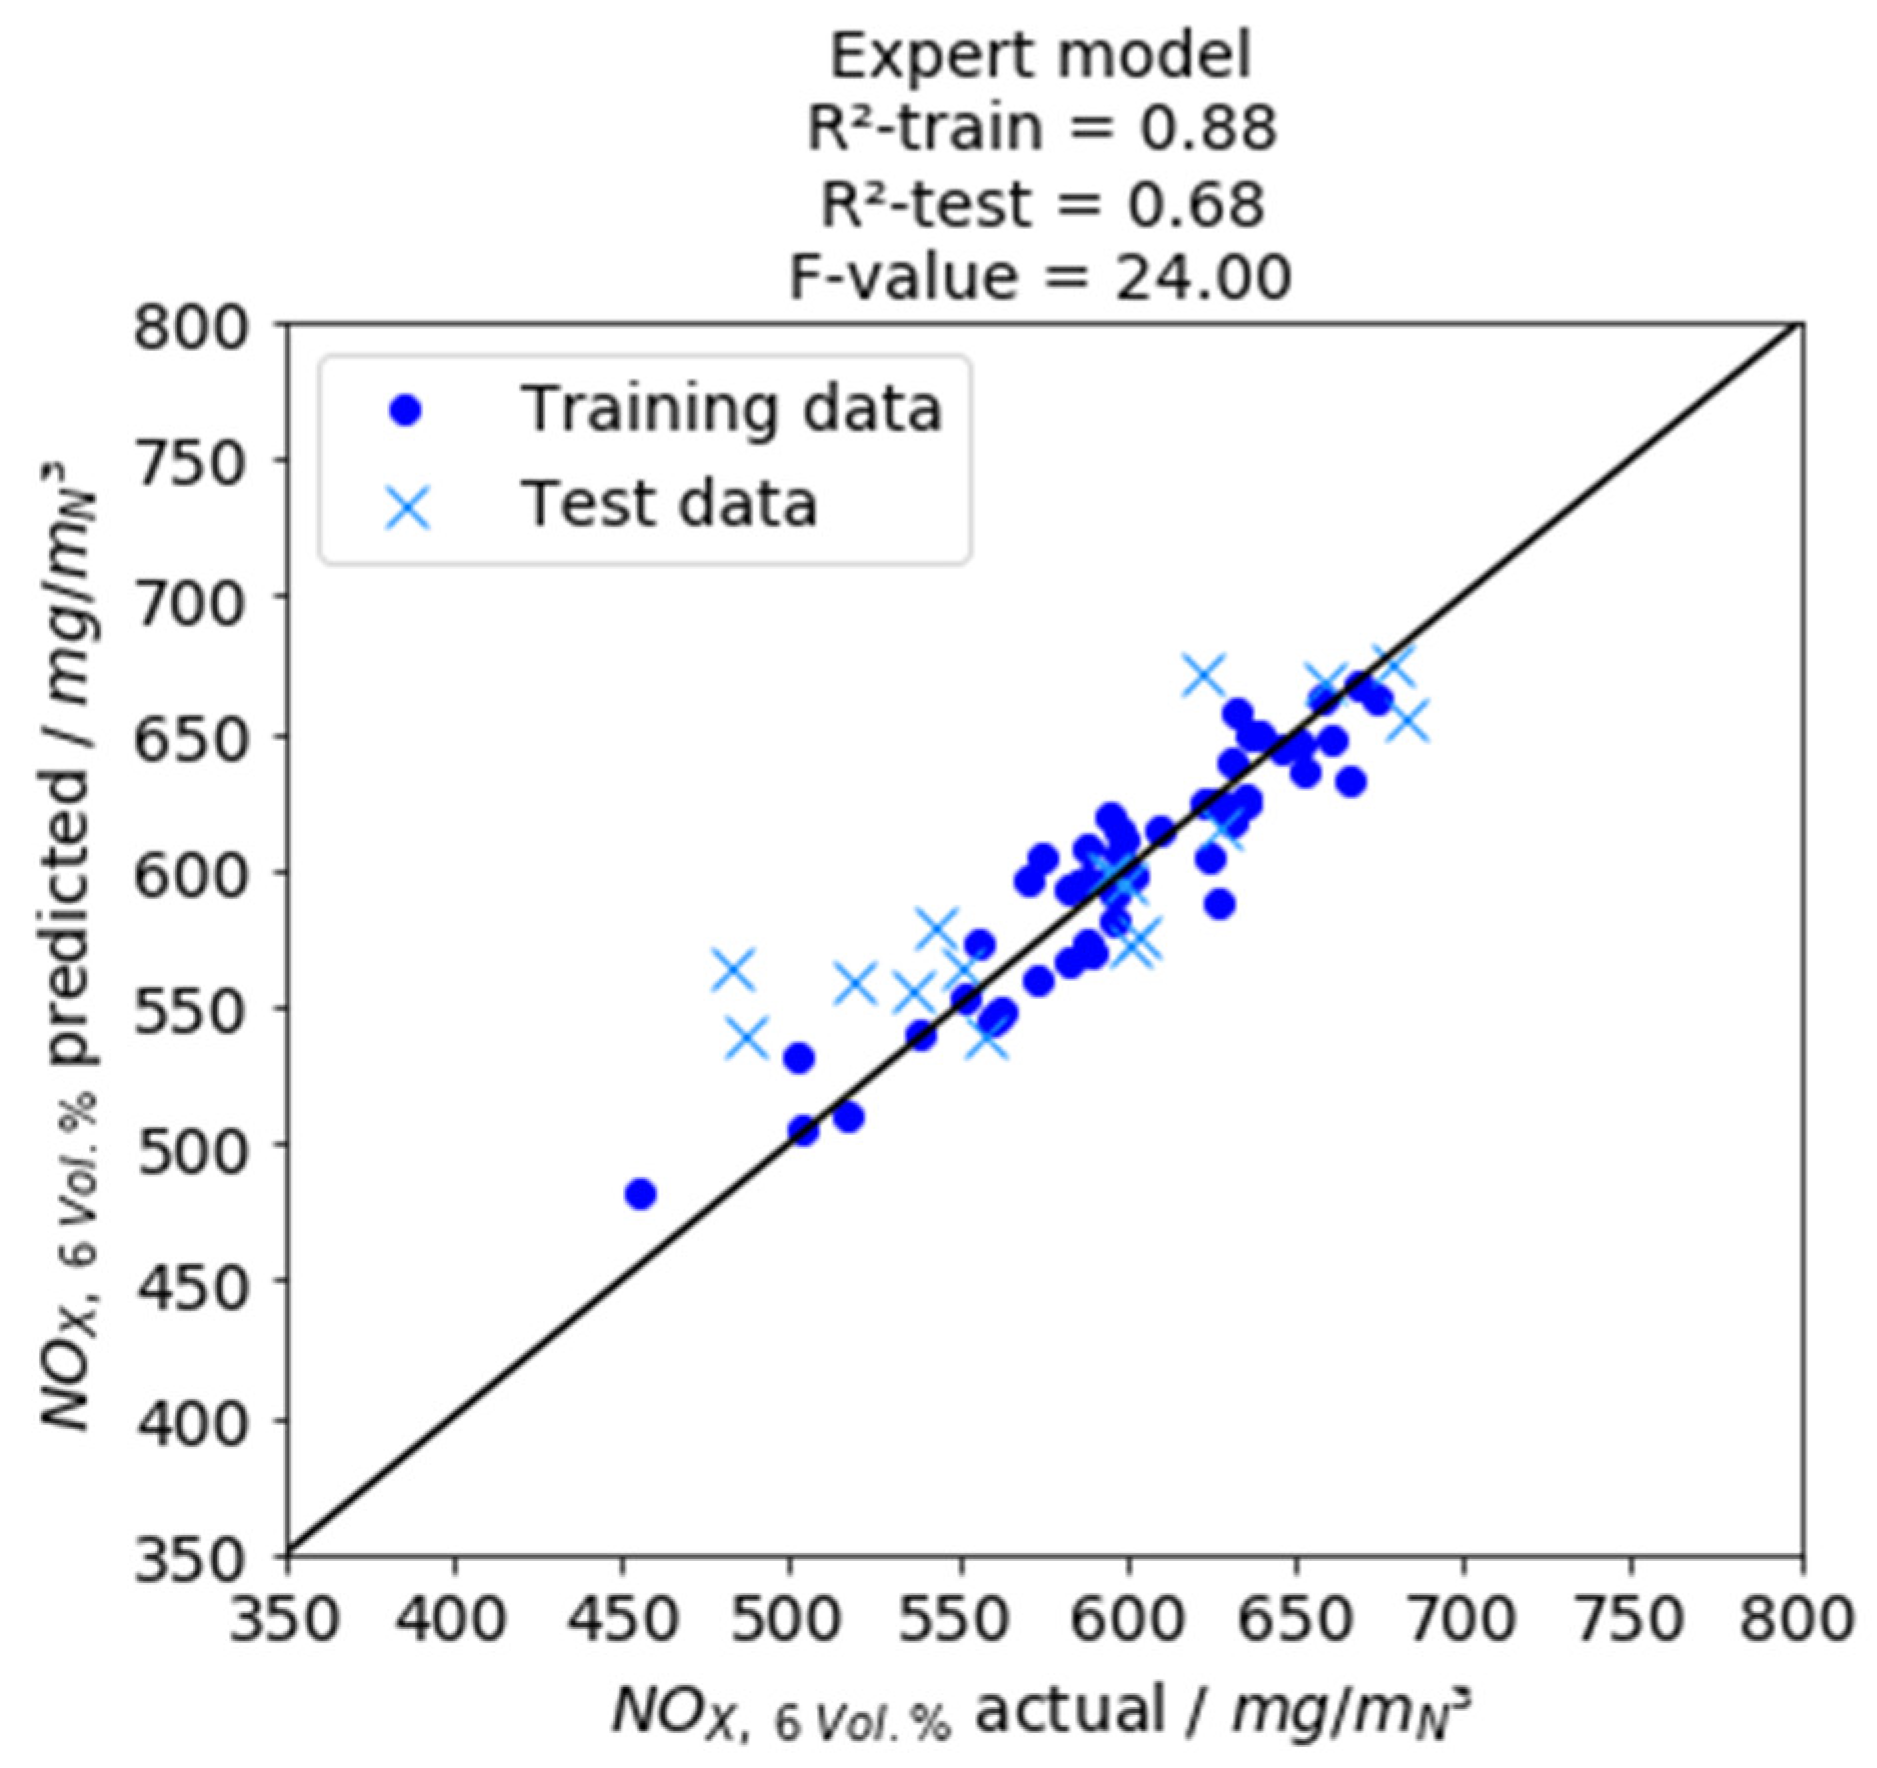
Table 2. First, the multivariate regression model with eleven descriptive variables is considered. The approximated NO
X emission data, the calculated predictive accuracy of the model for training and test data and the F-value of the model are shown in
Figure 8. For the tabular F-value with the degrees of freedom f
1 = 11 and f
2 = 36, an F-value of F
11,36,0.95 = 2.07 is obtained. The model has a higher F-value and therefore contains variables describing the problem more significantly.
Table 5 shows the regression coefficients of the individual influencing variables for the regular and the standardized training data. With the non-standardized coefficients, the set parameter variations can be used directly to calculate the nitrogen oxide concentration and the units of the coefficients reduce to the unit of the target value to be approximated, nitrogen oxide concentration in the flue gas in mg/m
N3. The unit and the value of the coefficients are given in the table below. For the non-standardized regression coefficients, no comparison is possible regarding the weighting due to the different orders of magnitude of the parameters. For this reason, the standardized, dimensionless beta coefficients are also shown. With them the coefficients can be compared regarding their weighting because of the previously carried out standardization of the data.
The corresponding model based on the standardized coefficients of the linear terms
anorm to
gnorm and the interaction terms
aenorm and
bfnorm is given by the following pattern.
Inserting the standardized regression coefficients from
Table 5 which are calculated with the least square method and fitted by the training data set for the multivariate regression model the following equation concludes. This equation is applied to the test data for showing the prediction accuracy of the model (see
Figure 8).
The largest absolute values for the standardized coefficients
βi are the parameters
c and
i, which both result from the coal mass flow and are thus directly involved in increasing the fuel nitrogen content. The third largest value results for
h, the swirl number. All three quantities mentioned have a negative sign, i.e., the approximated target quantity decreases with an increase of the parameter. This is of interest for the coal mass flow, as its increase will introduce more nitrogen into the system and NO
X emissions should increase accordingly. The effect of the stoichiometric air ratio can be explained by the anti-proportionality to the coal mass flow (see Equation (3)). Similarly, the linear influences of the oscillation frequency a and b have a positive sign and the interaction terms of the two variables ae and bf have a negative sign. Thus, according to Equation (5), the effects are contrary related to the target quantity. Such dependencies can be used to map the interactions for the oscillation frequency and the volume flow in R2 from
Figure 7. with a statistical model. Furthermore, the model assumes that the parameters are varied within the investigated limits of the design space.
Since Equation (5) is a mathematically determined model equation for the investigated parameter space from
Table 1, it is only valid for this particular parameter space. Thus, the relations behind the examined regression coefficients follow the adjusted parameter combinations, whereby by using the parameters the target quantity can be predicted with an accuracy of 88%.
The results for the examined parameters of the expert model are shown in
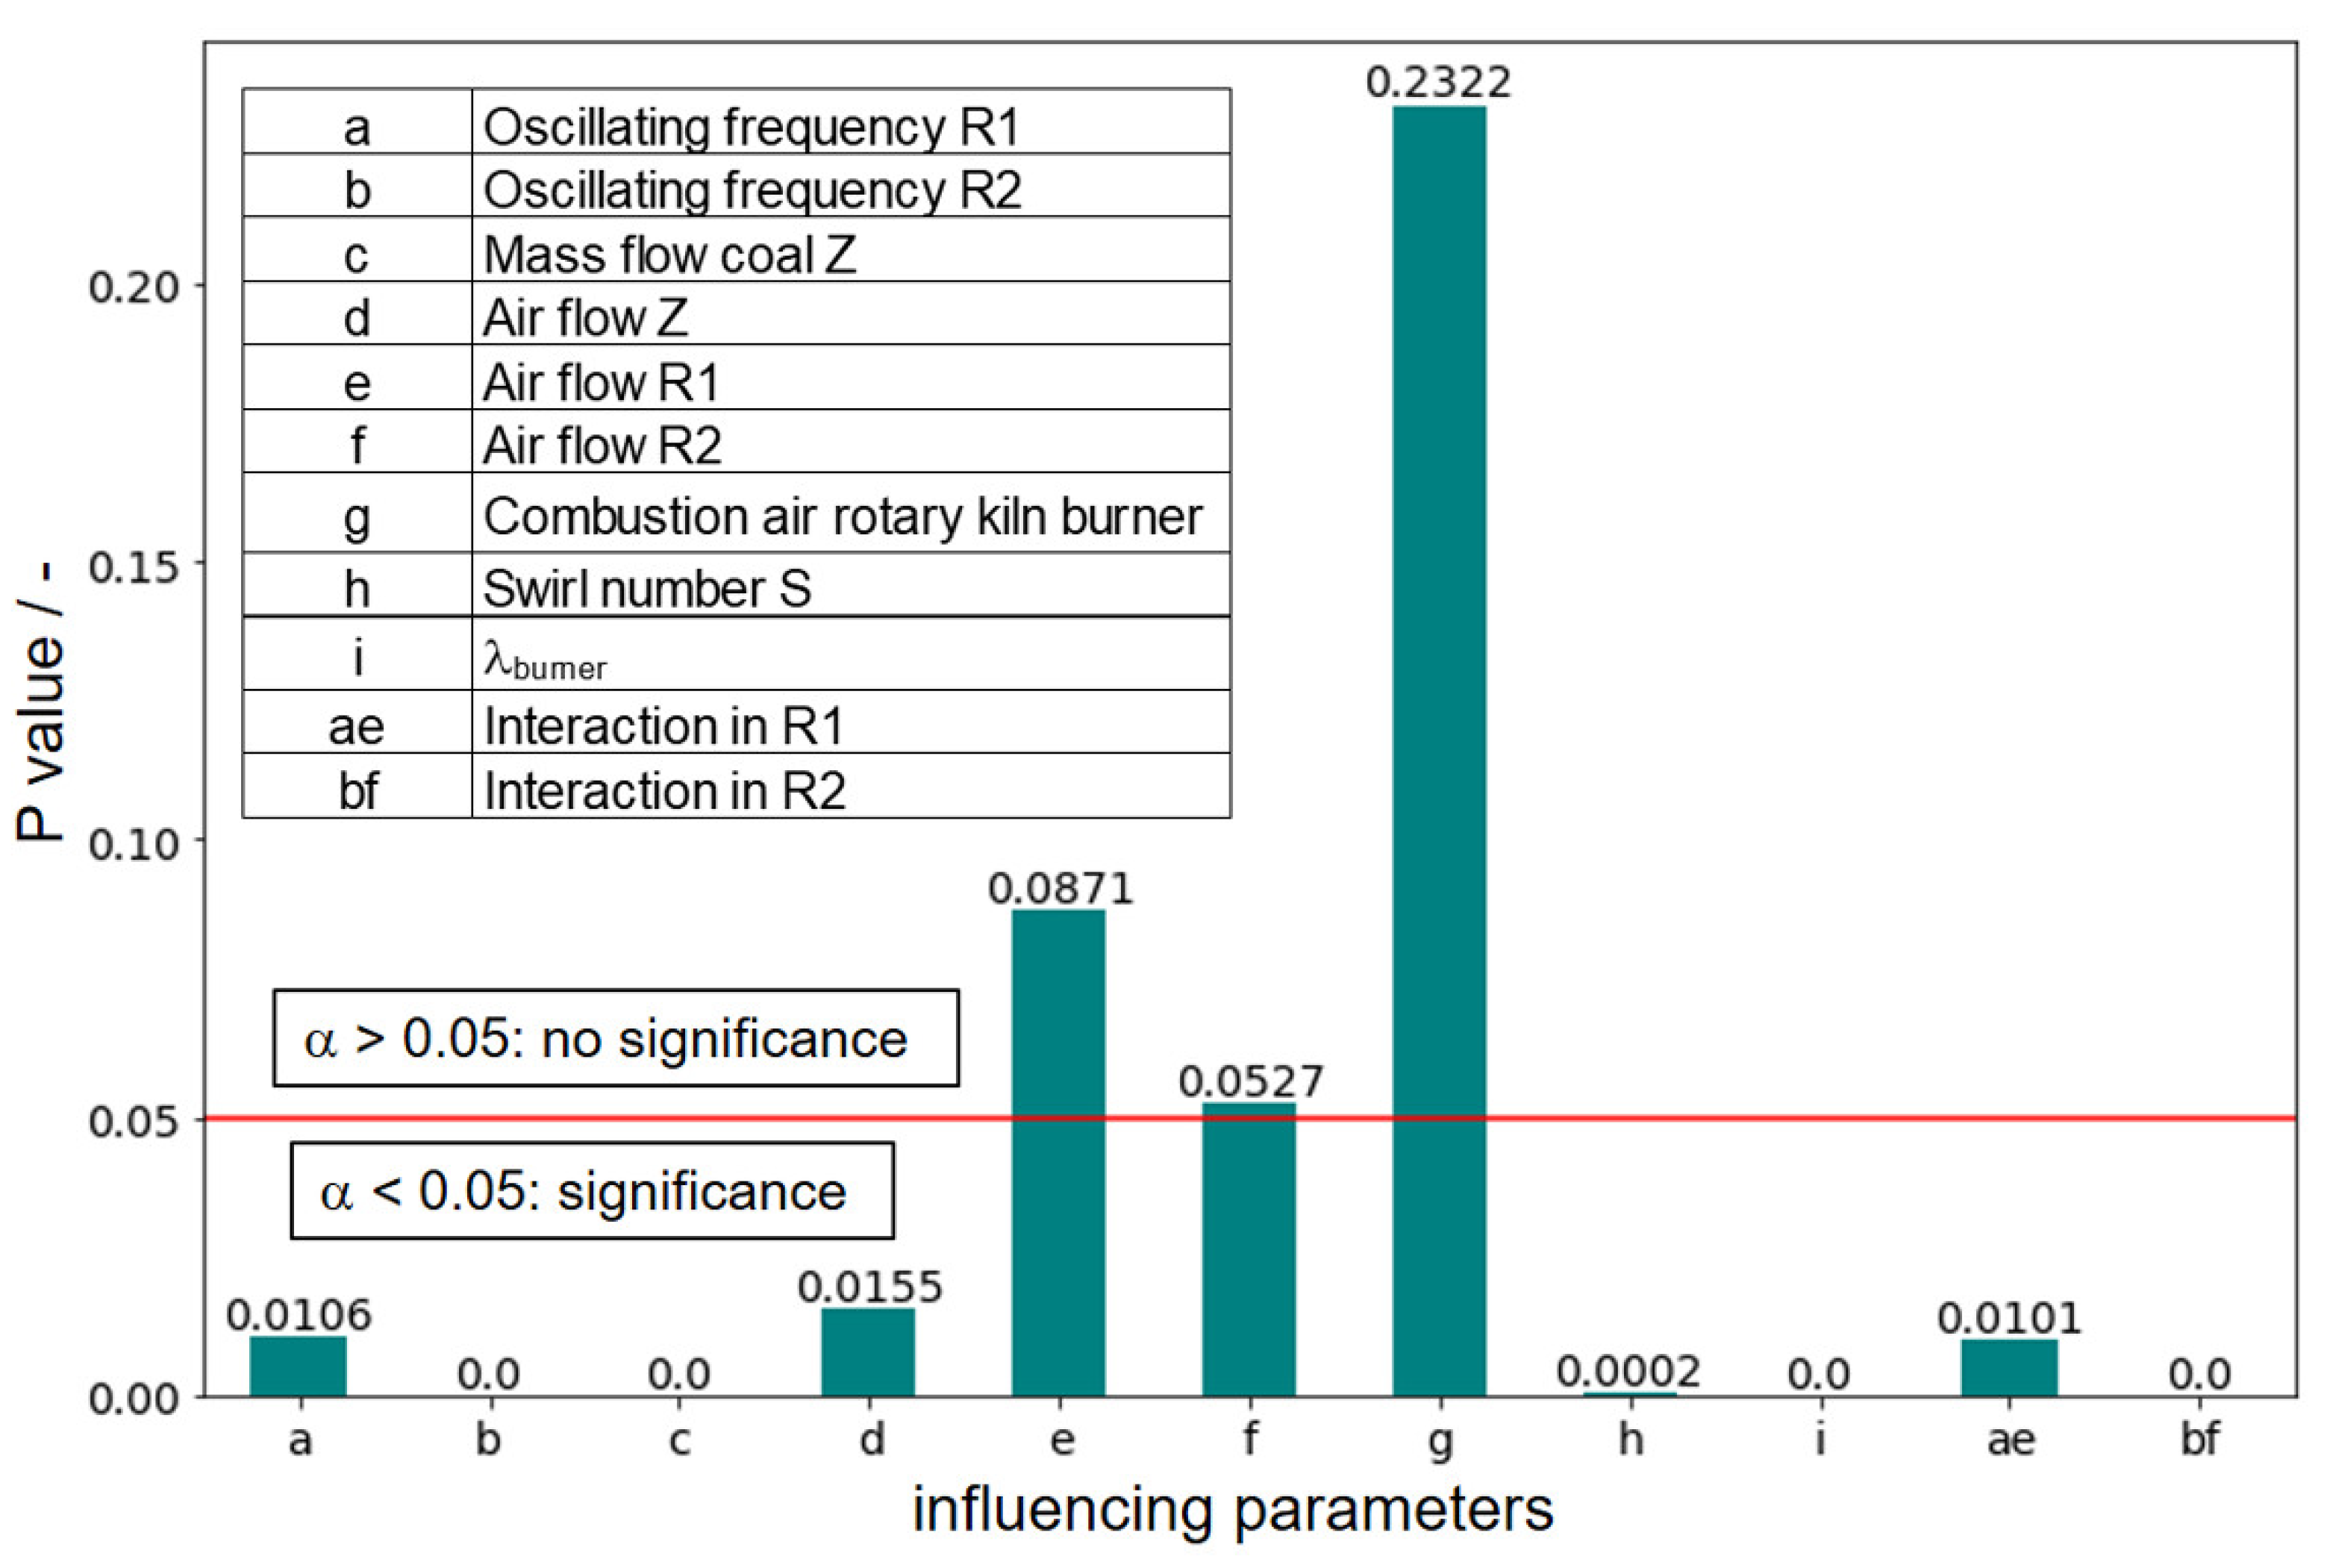
Figure 9. Here, the red line represents the significance level α = 0.05, which determines if a parameter is significant or not.
p-values greater than α are non-significant and
p-values less than α point to significant model parameters,
p-values less than α = 0.001 are strongly significant.
The evaluation clearly shows that the influencing parameters e volume flow in R1, f volume flow in R2 and g combustion air from the rotary kiln burner have a higher p value than the selected significance level α of 0.05. According to the evaluation carried out, the parameters mentioned have no explanatory content for the model formed. The parameters b oscillation frequency in R2, c coal mass flow in Z, h swirl number, i air ratio and bf interaction of oscillation frequency and volume flow in R2 are considered strongly significant for the model formed. Furthermore, it is shown that the interactions ae and bf of the oscillation frequency with the respective volume flow from R1 or R2 are to be classified as significant parameters, whereas the linear influences of the volume flows in R1 and R2 have no significant effect on the model and these only contribute to the model in the interaction with the respective oscillation frequency. As obvious significant effects with a p-value of 0, b oscillation frequency in R2, c carbon mass flow in Z, i air ratio and bf interaction of oscillation and volume flow in R2 can be identified. The high significance of the two parameters coal mass flow and regarding the NOX emission is due to the influence of the increased fuel input and corresponds to the findings from the analysis of the regression coefficients from Equation (5). The increase in the fuel input is directly reflected in the coal mass flow; the air ratio λ takes into account the incoming air flows and is anti-proportional to the coal mass flow according to Equation (4). The oscillation frequency in R2 and the interaction of the oscillation frequency with the volume flow in R2 reflect the investigated effect of air oscillation. Obviously, it is possible to exert a significant effect on NOX emissions by oscillating the air volume flow. The influence of the swirl number also has a significant effect in the evaluated data. This is consistent with the observation in Equation (5), where the swirl number has the third largest standardized regression coefficient.
4.3. Test Campaign B
Based on the findings of the statistical analysis by the expert model, that the oscillation of a high-volume flow in R2 leads to a lower nitrogen oxide concentration, the oscillating addition of a high-volume flow of 180 mN3/h from the annular gap R2 was investigated.
In
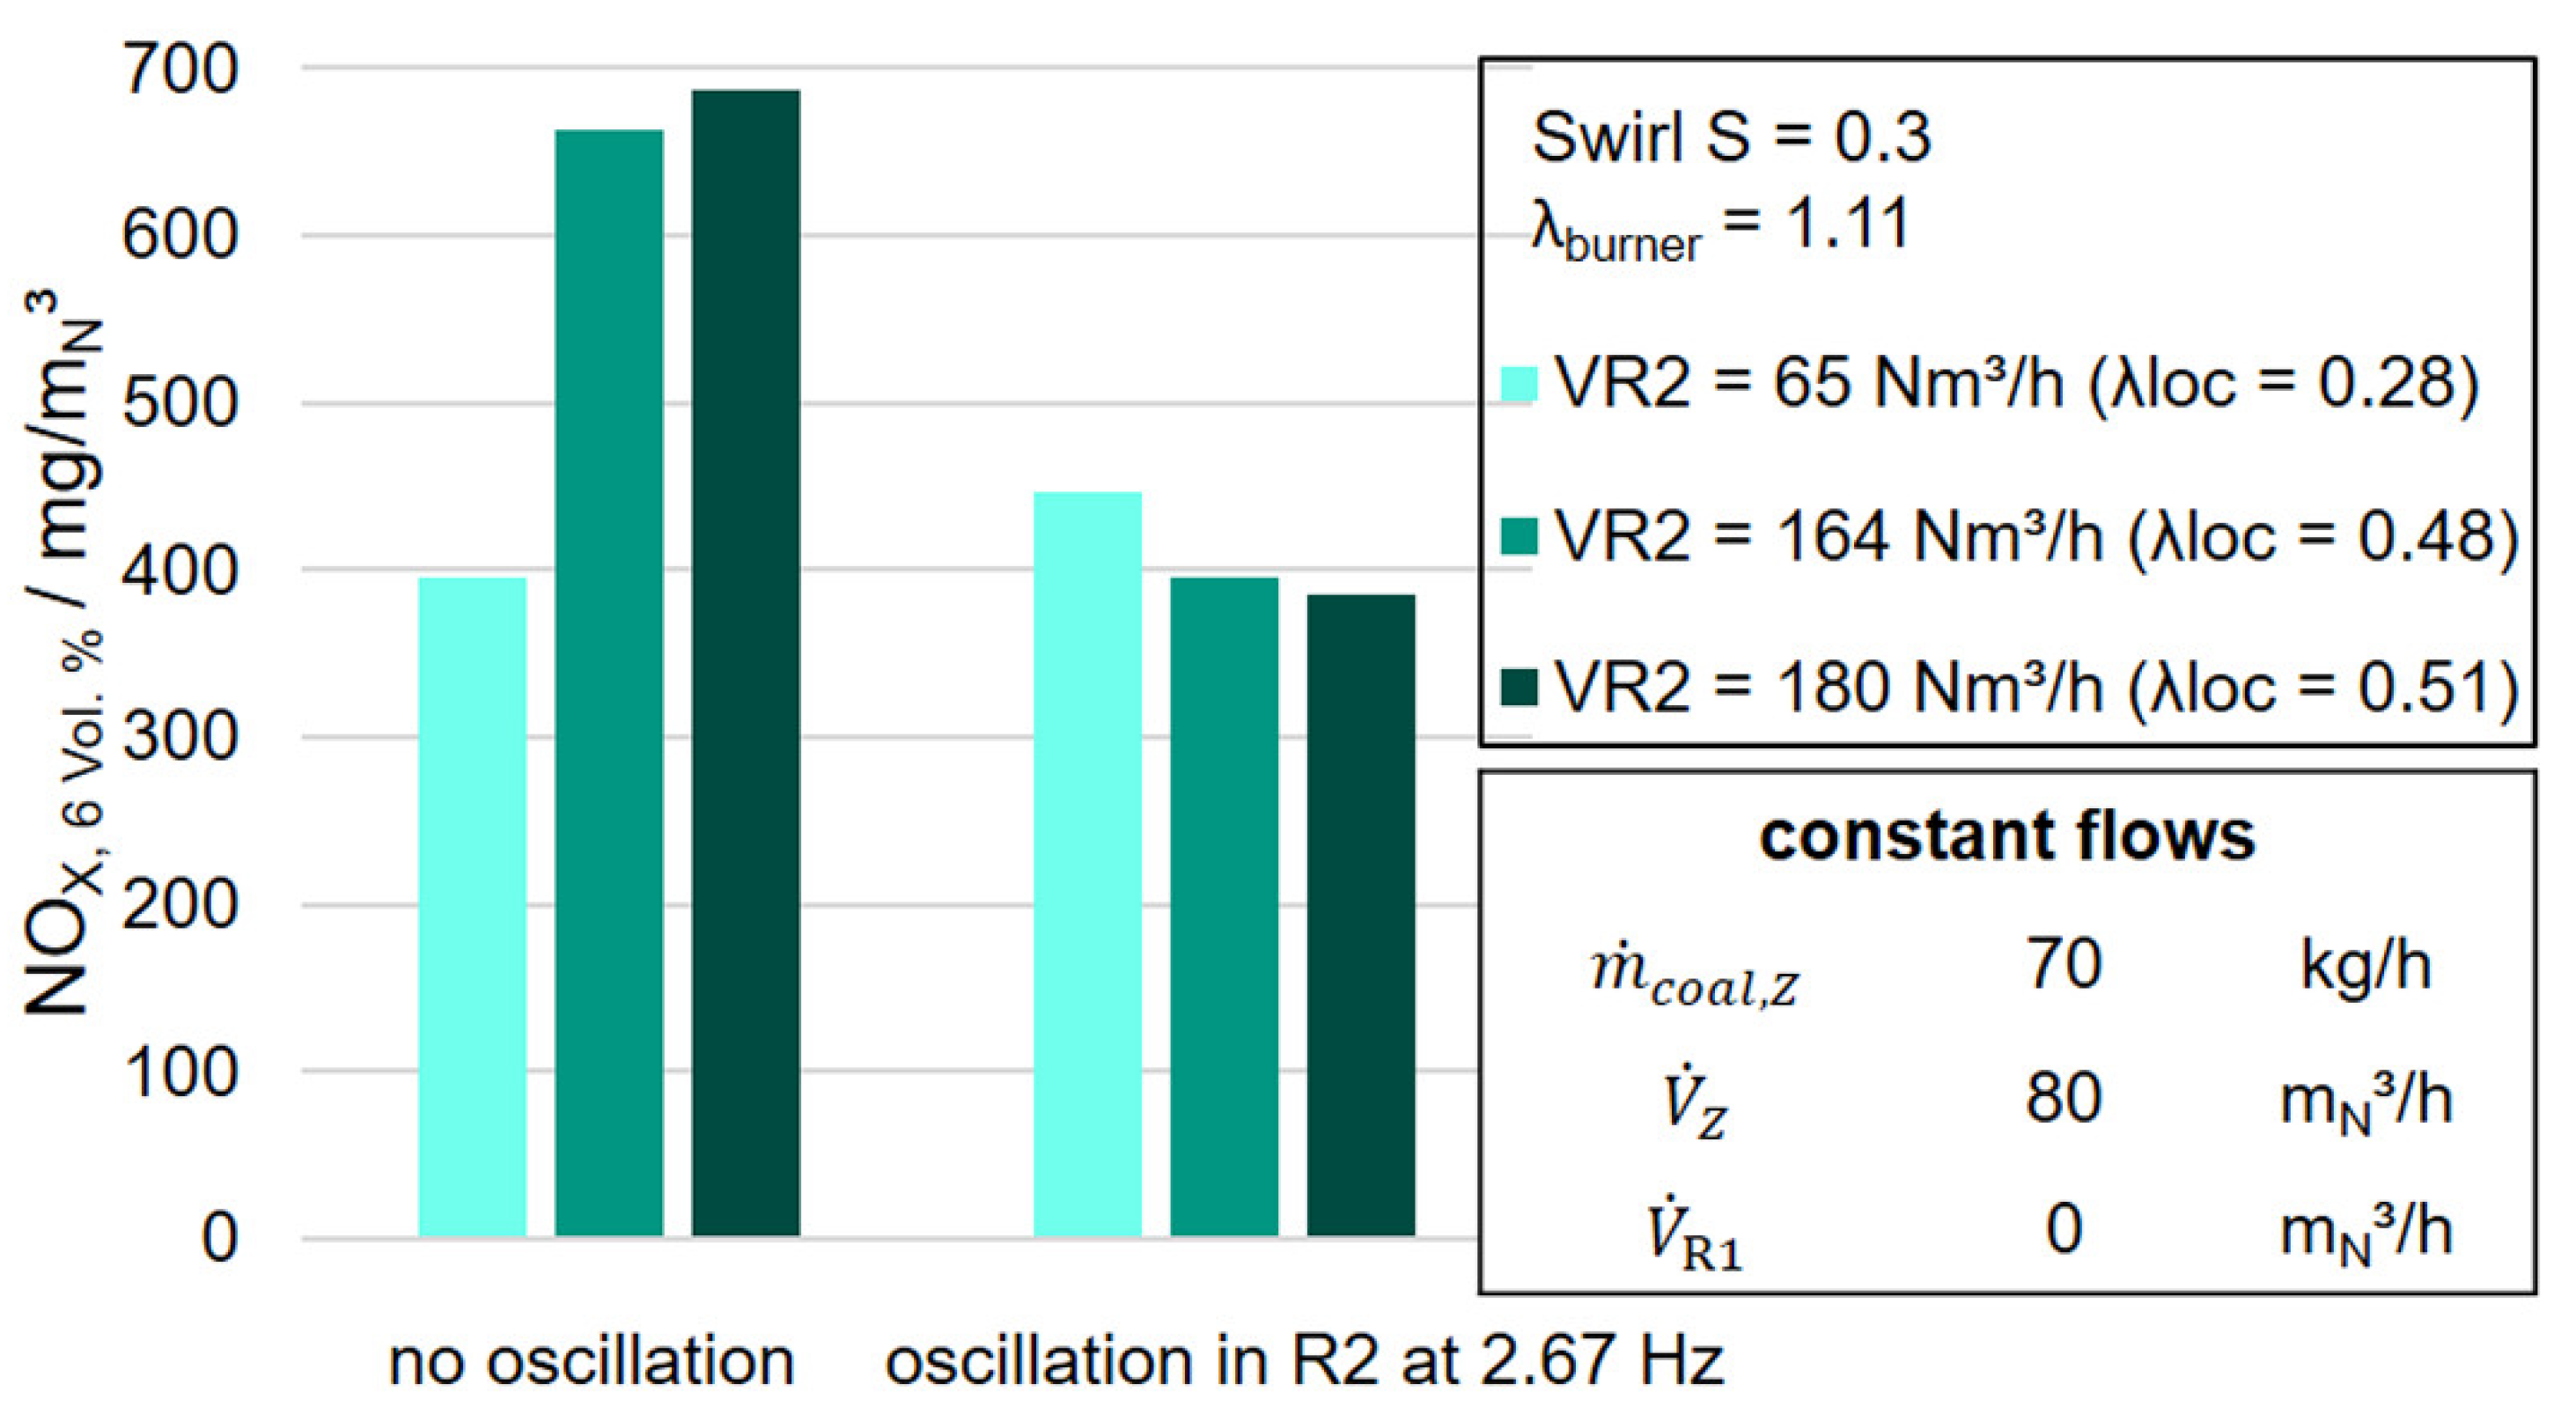
Figure 10 the dependence of NO
X emissions on the level of the oscillated volume flow in R2 and the oscillation frequency at a constant swirl and a constant air ratio at the burner
is shown. The reference value is the NO
X concentration at the respective non-oscillated state. The further parameter settings of the constant incoming flows can be seen on the side of the figure and in
Table 3. The nitrogen oxide emissions at a volume flow of 65 m
N3/h increase slightly due to the oscillation of 2.67 Hz. By increasing the volume flow entering the annular gap R2 to 164 m
N3/h, the nitrogen oxide emissions in the non-oscillated state are significantly increased. On the other hand, the oscillation of this volume flow shows a significant reduction in nitrogen oxide emissions. For a volume flow of 180 m
N3/h, the nitrogen oxide emissions in the non-oscillated state are somewhat higher than for a volume flow of 164 m
N3/h, but a similar behavior in NO
X reduction can be observed here regarding the oscillated state.
As a result of the increased oxygen supply in the flame associated with the increase in the volume flow in R2, the nitrogen oxide emissions in the tests increase to 164 and 180 m
N3/h in the oscillated state. Reference [
19] emphasizes the careful coordination of the different flow fields of the fuel-related primary air streams and the fuel-remote secondary air streams in a pulverized coal burner. Accordingly, the increase in the nitrogen oxide concentration in the flue gas during the shift of the combustion air into the annular gap R2 is explained by a worse preheating of the coal mass flow. This leads to an unfavorable combustion behavior of the coal dust. At the same time, a swirl number of 0.3 is not enough to create a recirculation area which would guarantee better preheating of the fuel flow.
According to the literature of [
2,
10,
20], the backflow area for Type I and II flames only develops at a critical swirl number of S
theo ≈ 0.5. However, at the prevailing temperatures the formation mechanisms are limited to the fuel N mechanism. According to
Figure 1, an increase in oxygen concentration leads to the preferred reaction path from HCN via NH
i to NO. Since there are no reducing conditions at an increased oxygen supply in the flame, the reaction of NH
i with already formed NO to N
2 is inhibited. Although
< 1 applies to the local stoichiometries of all investigated test settings,
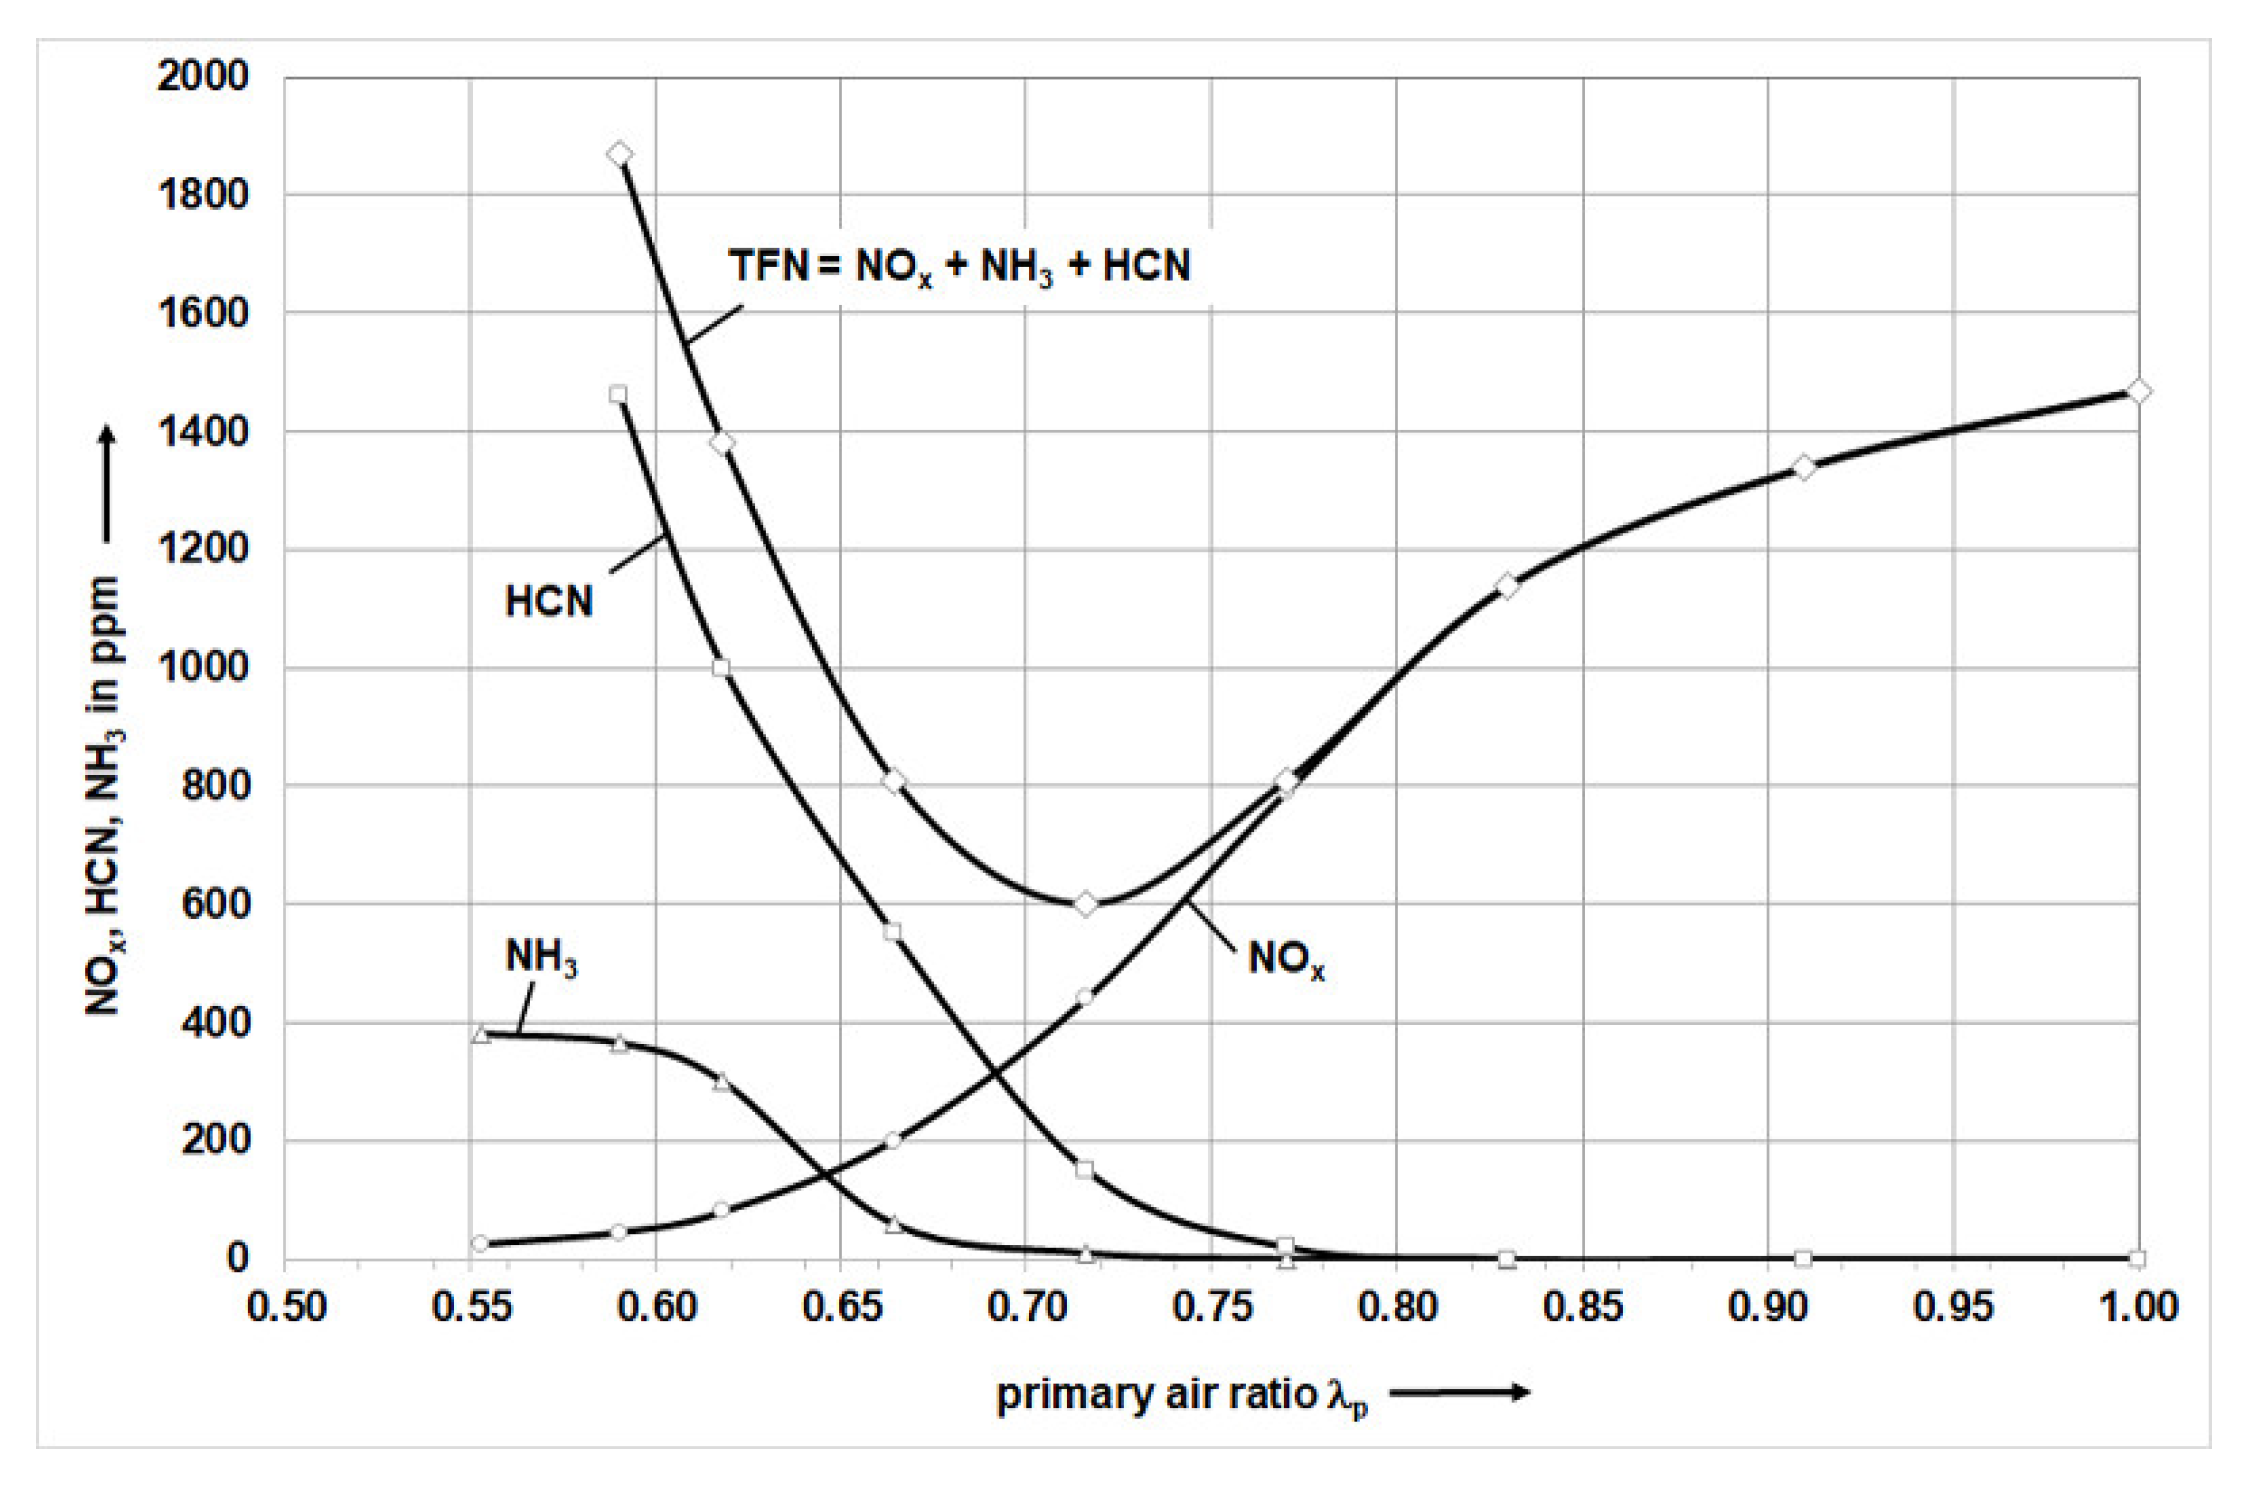
is significantly larger at the higher volume flows in R2. If one now compares the local stoichiometry with the TFN curve shown in
Figure 2, the NO
X concentration increases with increasing air ratio. In addition, the exhaust gas mixture contains more HCN and NH
3 at the local air ratios of 0.28 to 0.51. The concentration of HCN and NH
3 in the exhaust gas mixture increases with the local air ratios of 0.28 to 0.51. For both N-species, the residence time in the post-combustion chamber is enough to react to NO
X at a total air ratio in the post-combustion chamber of 1.1 to 1.4 up to the measuring point of the nitrogen oxide concentration. From consideration of the oscillation effect of the two high oscillated volume flows of 164 and 180 m
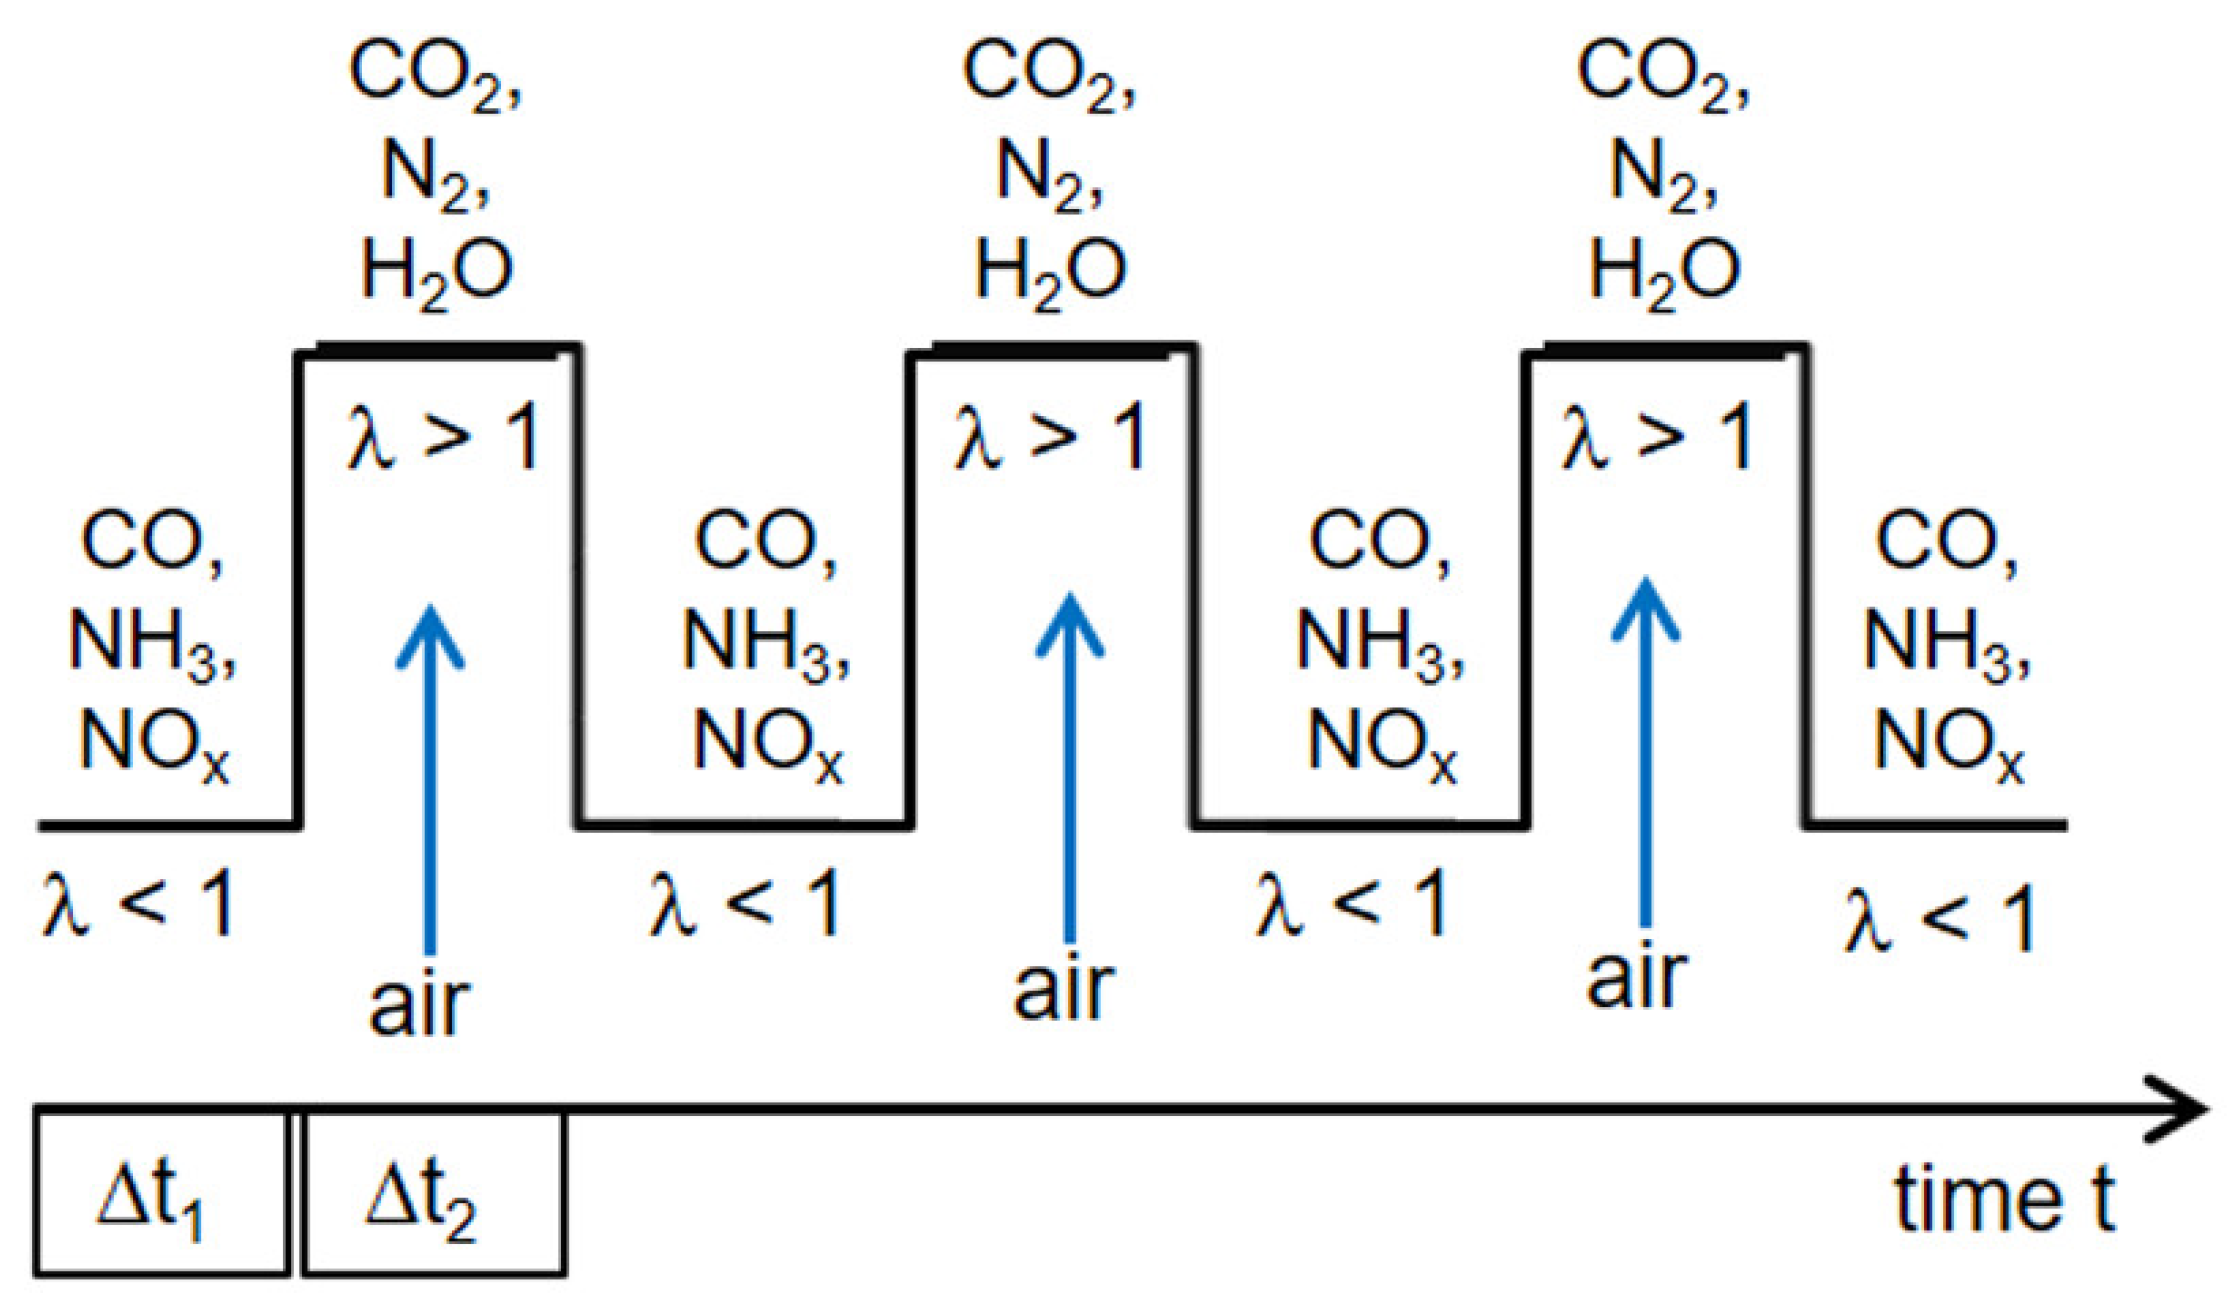
N3/h at 2.67 Hz, the nitrogen oxide emission can be reduced despite the high local air ratios. The interruption of the volume flow thus leads to alternating reducing and oxidizing conditions in the flame, resulting in a NO
X reduction. Considering
Figure 1, more NO is produced under oxidizing conditions. Under the reducing conditions the NO is reduced to N
2. In parallel, NO molecules can be returned to the reaction path of the fuel-N mechanism via the NO-Recycle mechanism. These two mechanisms explain the lower nitrogen oxide emissions. In further considerations, it would be useful to measure the local concentrations of the N-species in order to obtain more conclusions about the formation mechanism under oscillating conditions. Related to the reference value of the nitrogen oxide concentration at 65 m
N3/h and without oscillating addition of air, no reduction of the nitrogen oxide emissions can be observed at the selected test settings, but the results show that the NO
X formation mechanisms can be substantially reduced by oscillation.
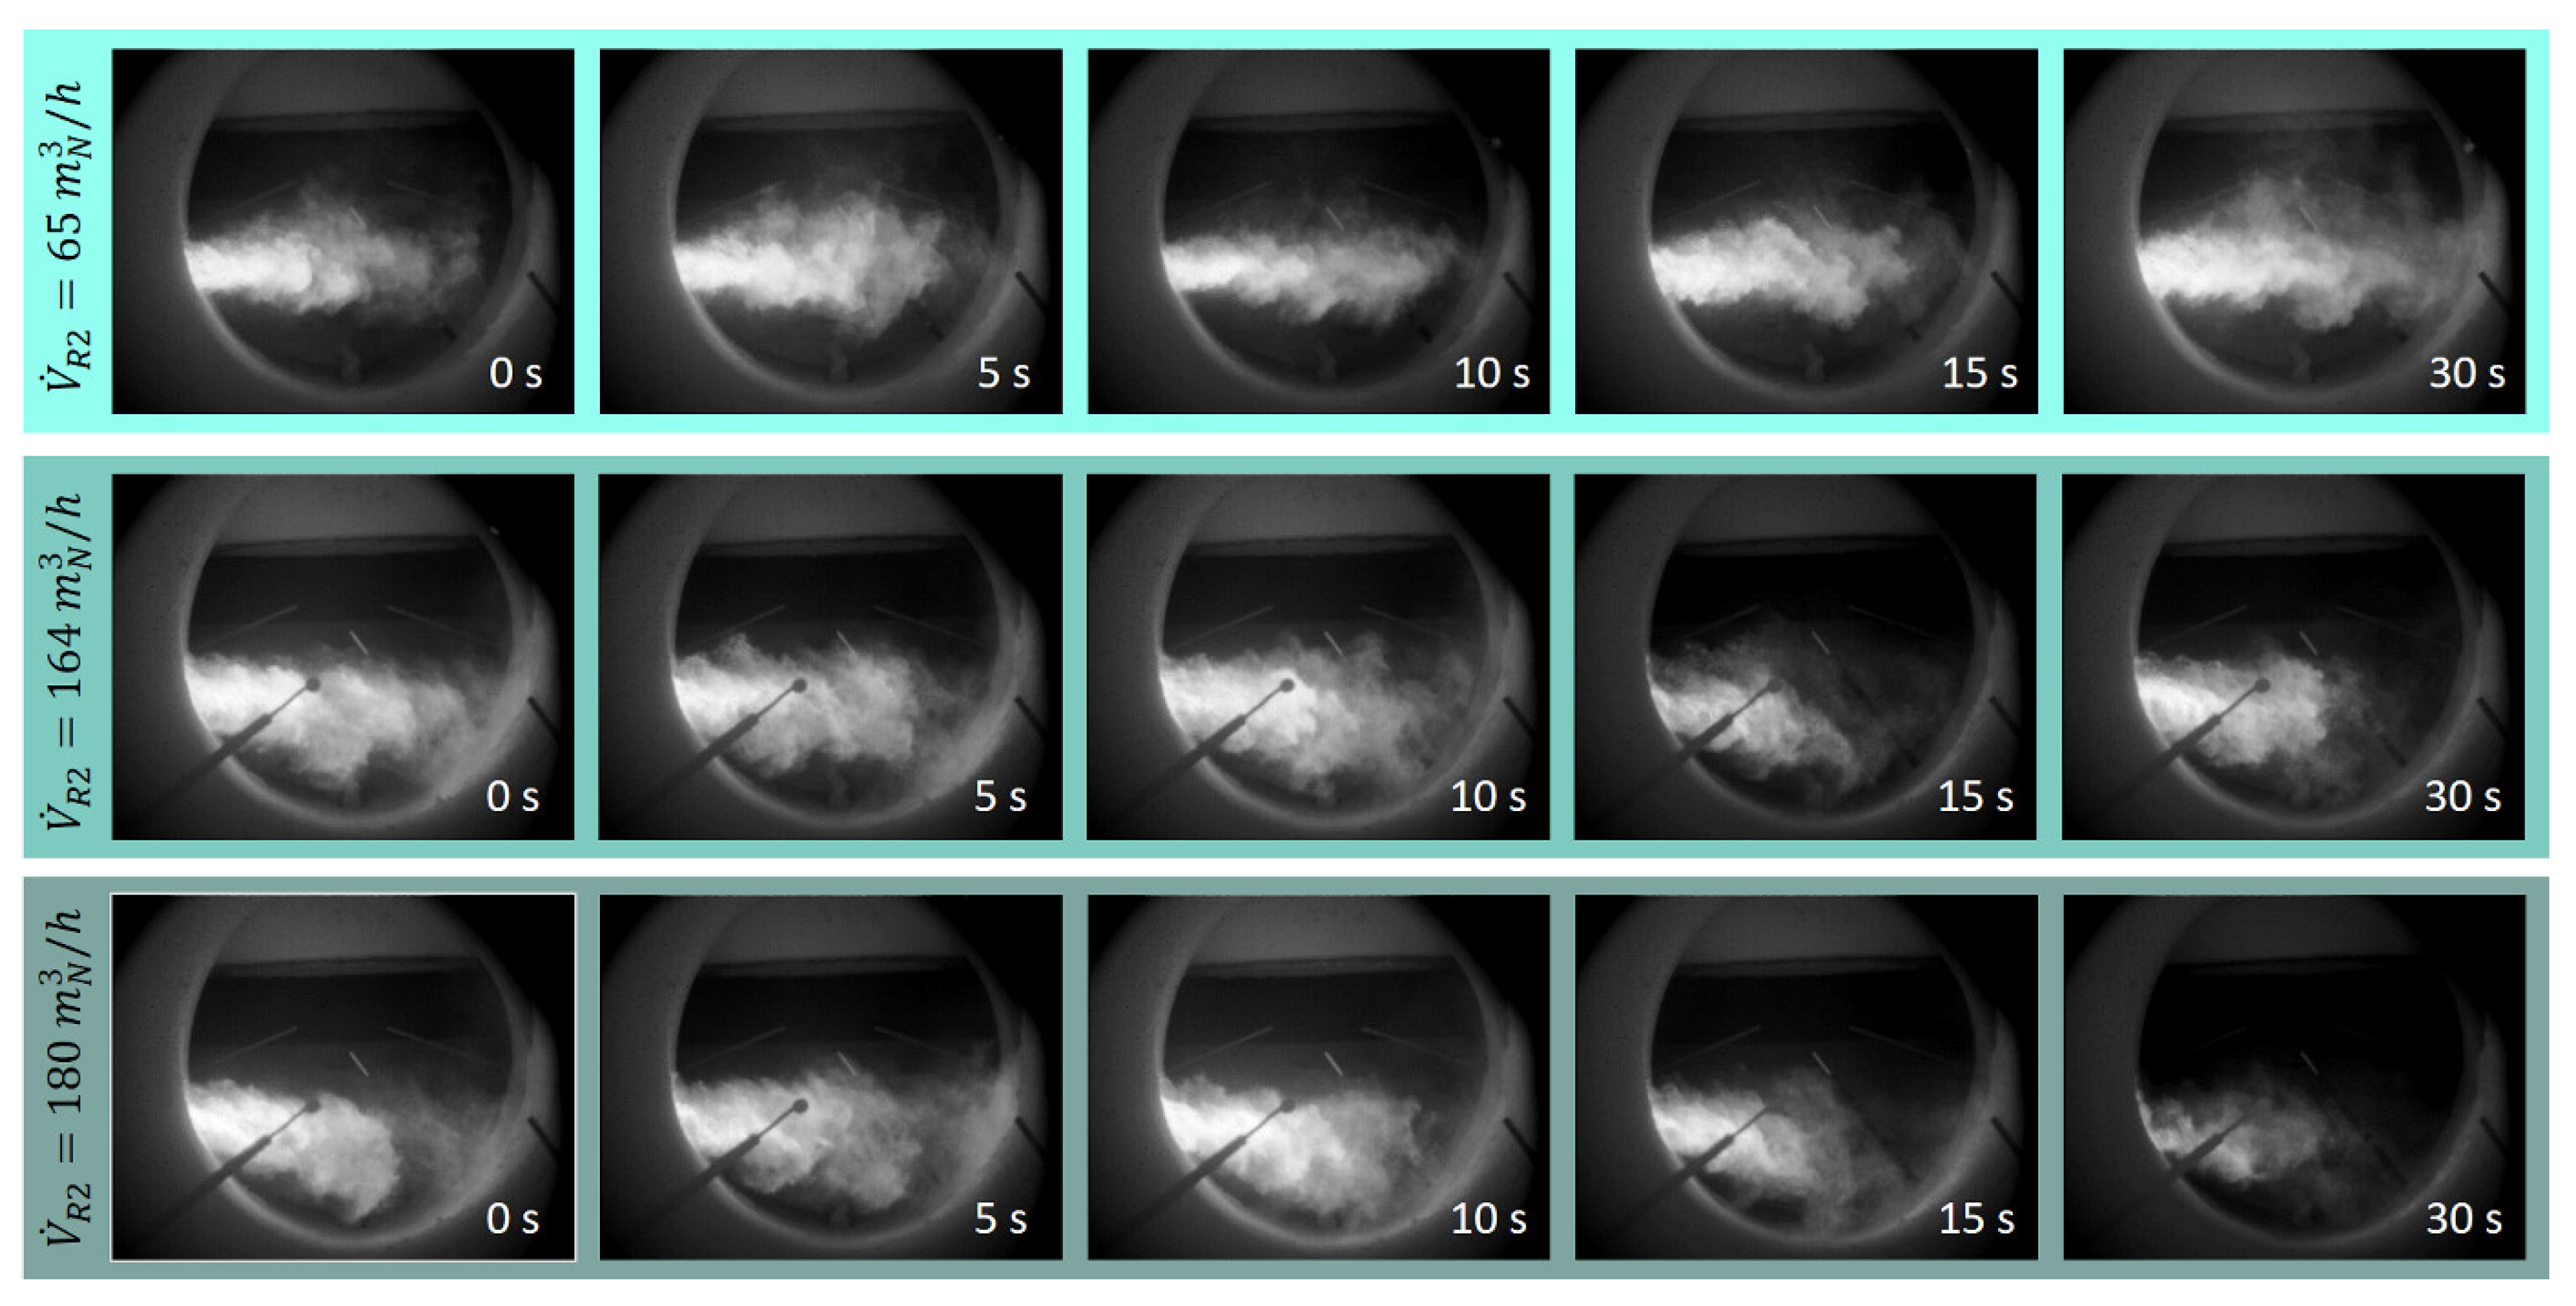
A more detailed analysis of the flame pattern for the phenomenon of increasing the nitrogen oxide concentration in the flue gas by shifting the air volume flow from the combustion air into the annular gap R2 with oscillation-free process control is explained in more detail below. The optical observation of the flames of the non-oscillated test settings is shown the photo series of 0. 5, 10, 15 and 30 s of the test time in
Figure 11. With a volume flow from R2 of 65 m
3N/h, a longer flame and a more uniform distribution of the bright flame range over the entire length of the flame result. The higher volume flow in the tangentially introduced combustion air leads to a more stable, elongated flame pattern.
The two lower photo series at a volume flow in R2 of 164 and 180 m
N3/h show a higher flame brightness in the area near the flame root than in the burnout area of the flame. Here the volume flow of combustion air is significantly reduced (cf.
Table 3), which leads to a shorter and bushier flame.
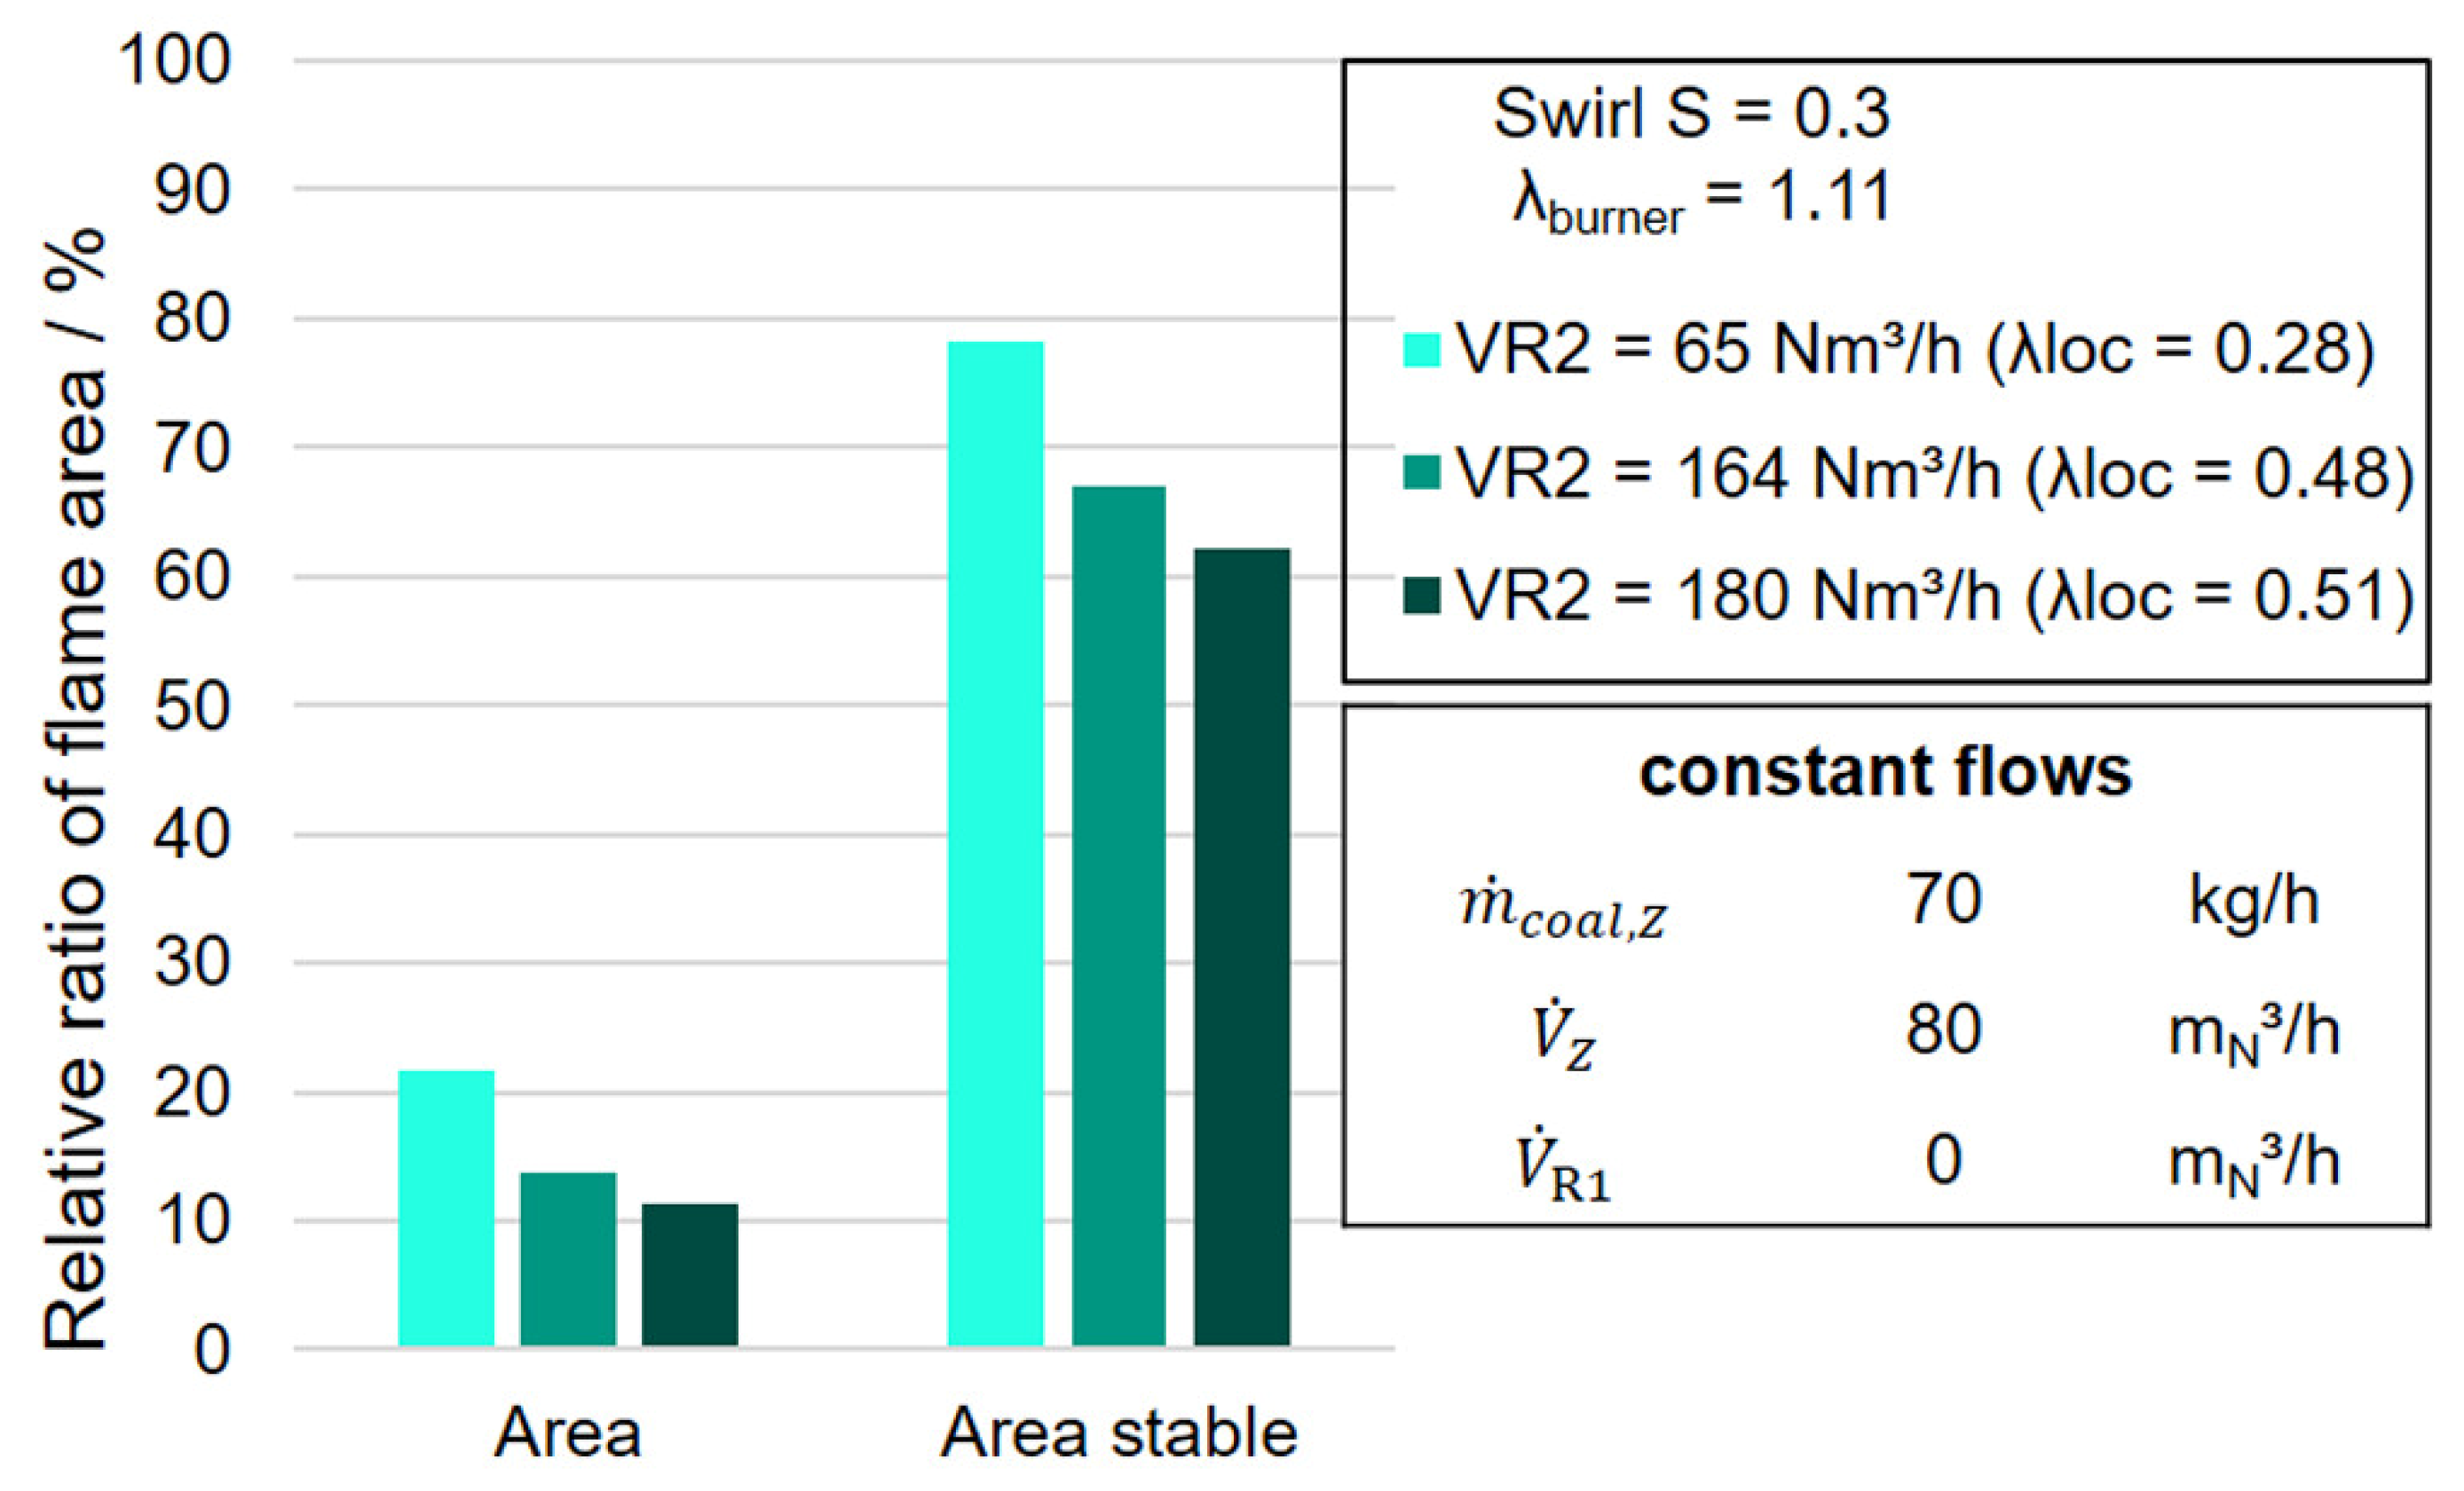
The evaluations with the IAI program from
Figure 12 confirm this fact for the shorter and bushier flame shapes observed in
Figure 11 for the high-volume flows in R2 of 164 and 180 m
3N/h, since both the relative flame fraction area and the relative stable flame fraction area stable are significantly lower for the two flames.
Consequently, for the longer flame at a non-oscillated volume flow in R2 of 65 m
3N/h, a more uniform burnout of the combustion gases along the flame length is possible, which is associated with a lower nitrogen oxide concentration in the flue gas (cf.
Figure 3). At Definition there are no Type I/II flames due to the too low swirl number, which means that the results cannot be compared with the previous studies of [
10]. However, the influence of the flame shape on the nitrogen oxide concentration in the flue gas can be clarified from the optical evaluations discussed above.
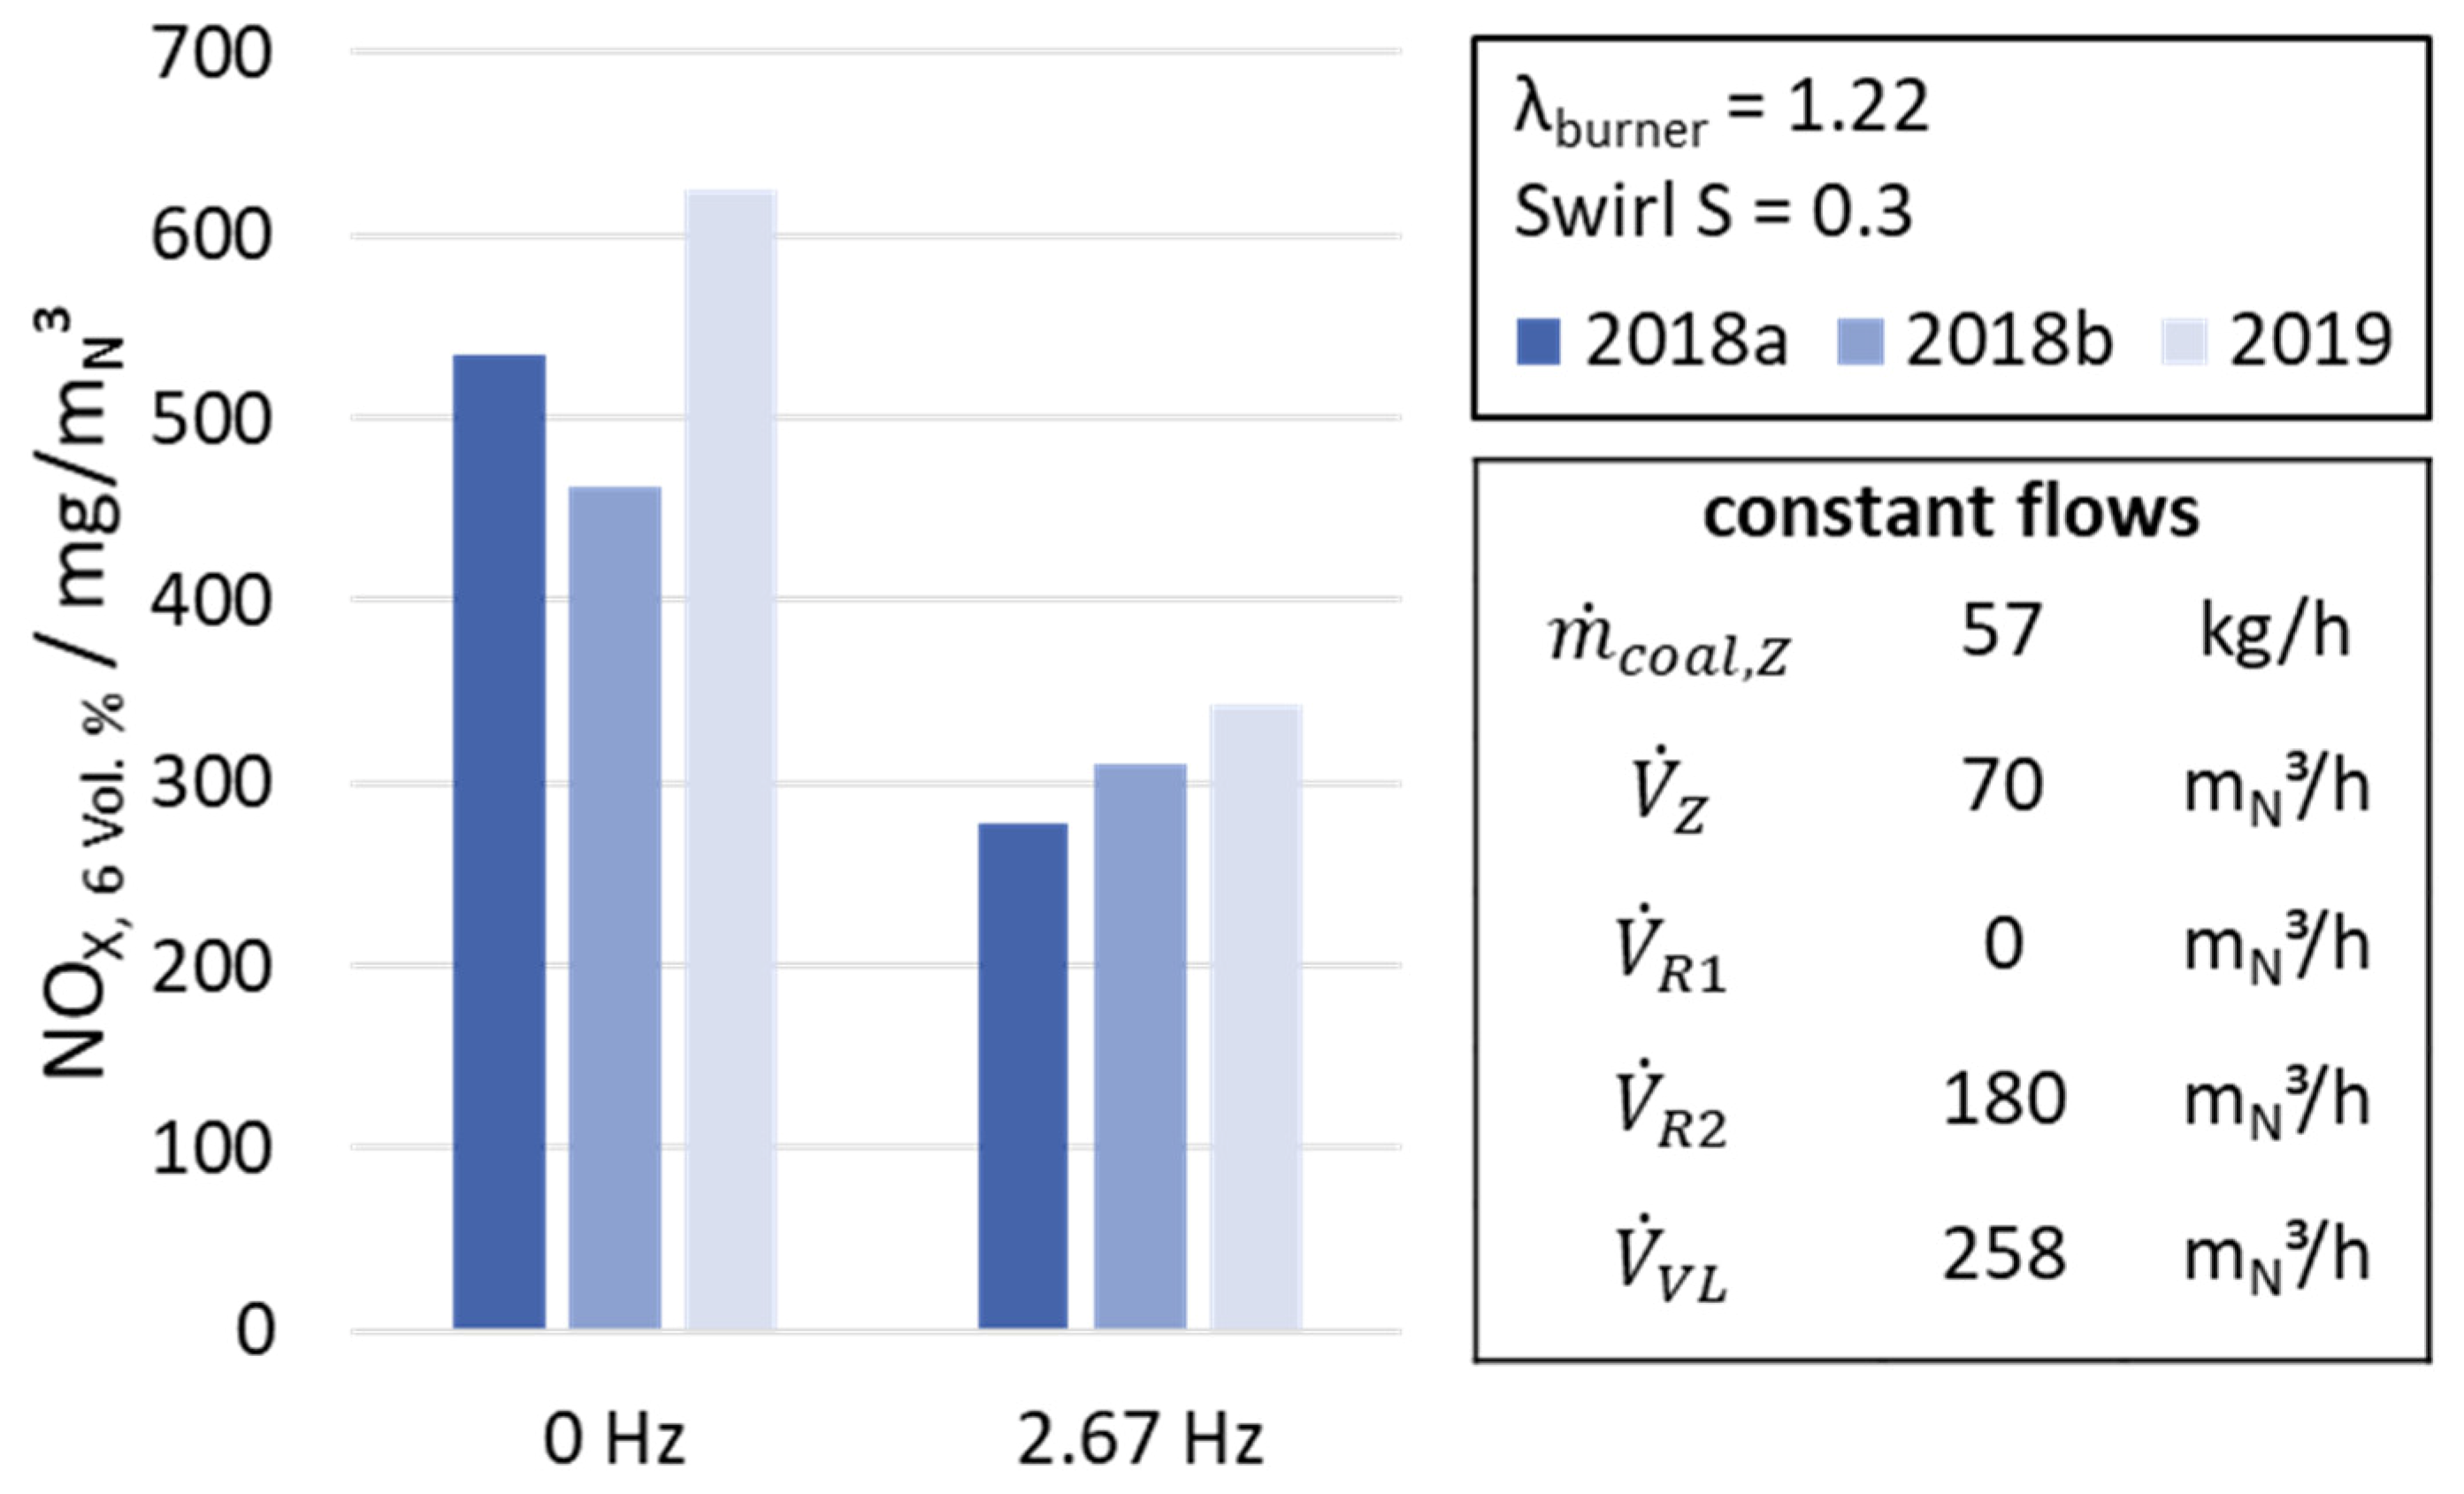
The second part of the test campaign B focused on the reproducibility of specific test settings when a high-volume flow in R2 was oscillated. The measured concentrations of nitrogen oxide, oxygen and CO in the experiments carried out are shown in
Figure 13 over the test period of 60 min per setting. The constant currents are shown sideways in the figure.
The reduction in NOX emissions due to oscillation of the volume flow in R2 at 2.67 Hz is clearly visible. For the two experiments a constant nitrogen oxide concentration of 620 mg/mN3 for the oscillation-free and 350 mg/mN3 N for the oscillating process control is achieved over the 60-min test period. Accordingly, the nitrogen oxides in the flue gas are reduced by 45%.
This represents the best measurement result of the tests carried out in this paper regarding nitrogen oxide reduction by oscillation of the air volume flows. The oxygen and carbon monoxide concentrations remain constant over the entire period shown. This indicates a stable combustion process during the experiments.
In order to prove the reproducibility of the results from
Figure 13, the measured NO
X concentrations of the trials from 2018 are compared to the results from 2019. The settings of the parameters in
Figure 14 are according to
Table 4.
The results from
Figure 14 underline the previously discussed findings and show that the reproducibility of the trial is high, leading to an average reduction of the NO
X concentration by −43%.
