2.1. Materials and Experimental
Slime (also called Flubber) refers to a particular borax hydrogel formed by crosslinking of PVA with a boron compound in water [
13,
14]. Slimes containing higher water content with a consistency similar to chum gum can flow under gravitational force and “self-heal”. Furthermore, it displays soft and ductile behavior and is easy to deform under low-speed stretching, however, upon high-speed stretching, it tends to display hard and brittle behavior and fracture at a small strain. The observed shear-thickening effect is more apparent when the water content is relatively higher. With a decrease in water content, Slime becomes increasingly difficult to flow under the gravitational force. Similar to many hydrogels, dried Slime intrinsically has the heating and water/moisture responsive shape memory effect (SME), i.e., it is able to recover its original shape only if a particular stimulus (e.g., heat and/or water/moisture) is applied [
15,
16,
17]. The SME in a piece of dried Slime is demonstrated in
Figure 2, in which (a) to (c) demonstrates the heating-responsive shape recovery in the first round of shape memory cycle, and (c) to (e) reveals the water/moisture-induced shape recovery in the second round of shape memory cycle.
Here, Elmer’s clear glue was utilized for PVA and 20 Mule Team Borax Detergent Booster for borax. The inclusion of additional chemicals in these commercial products were meant to fine-tune certain performance characteristics for the targeted functions of these commercial products and not necessarily intended for the borax hydrogel investigated. Local tap water in Singapore was used without any further treatment. Seven different types of samples were prepared. In this study, the weight ratio between borax and PVA glue was kept as 7:10, while the amount of tap water varied from 10% to 70% in weight percentage. Herein, unless otherwise stated, the water content in % is meant for tap water in wt%. Refer to
Table 1 for the ingredients for 500 g of each type of sample.
For the preparation of hydrogel samples, first, the measured amount of borax was mixed with the required amount of tap water, and then stirred for good dissolving. Then, the predetermined amount of PVA glue was added to the mixture. The mixture was further stirred and rolled, if necessary, for one hour to ensure good homogeneity. Then, the resulted hydrogel was aged at a room temperature of about 20 °C and an atmospheric pressure of 758.00 mmHg, for 24 h, in dark, enclosed and sealed conditions to release the residual stress and to enhance homogeneity. Hydrogel samples of two geometrical dimensions, i.e., cylindrical (diameter 68 mm and height 20 mm) and in blocks (104 × 104 mm, 36 mm thick), were prepared and used for characterization.
For non-Newtonian fluids, their flow properties cannot be described by a single constant viscosity. For this hydrogel, when shear stress is applied, it thickens and becomes more viscous. The time taken for a 9.6 mm diameter steel ball (weight 4 g and density 7.8 g/cm
3) to sink from the surface to the base (20 mm) of the hydrogel was measured using a digital stopwatch. Viscosity (
) was calculated according to [
2] as:
where
g is 9.81 m/s
2,
1 is the density of hydrogel,
2 is the density of the sphere (7.8 g/cm
3),
υ is the falling time over the fixed distance of 20 mm,
r is the radius of the steel ball (4.8 mm), and
R is the radius of the cylindrical hydrogel sample (34 mm).
Only the cylindrical samples with 50% tap water content or more were tested. For the hydrogels with less water content, i.e., 10% to 40% tap water, they were able to retain their shapes under gravitational force for long periods, and it would take a very long time for the ball to sink by using its weight. Thus, block-shaped samples of these hydrogels were tested for their stress versus strain relationship under quasi-static uniaxial compression. They were loaded with a deadweight of 250 g in the first loading step, and then the load was gradually increased with an increment of 100 g in each following step. Unloading was applied after about 1950 g was reached. The height change was recorded immediately after the required load was reached.
For the rebound test to evaluate the energy recovery, a 36 mm diameter spherical steel ball (weight 23 g) was dropped from a height of 100 cm onto the surface of the block-shaped samples. The rebound height (
h) was measured from the highest point achieved by the sphere’s lower surface from the first rebound. Thus, energy recovery ratio (in %) can be calculated according to Equation (2):
where the drop height is 100 cm.
While a higher rebound height value suggests better energy recovery, the shear-thickening effect is meant for shear-induced significant strengthening, i.e., a striking increase in hardness. Except for the loading/unloading tests, all other experiments were repeated a few times. Herein, the stress and strain are meant for the engineering stress and engineering strain.
2.2. Results and Analysis
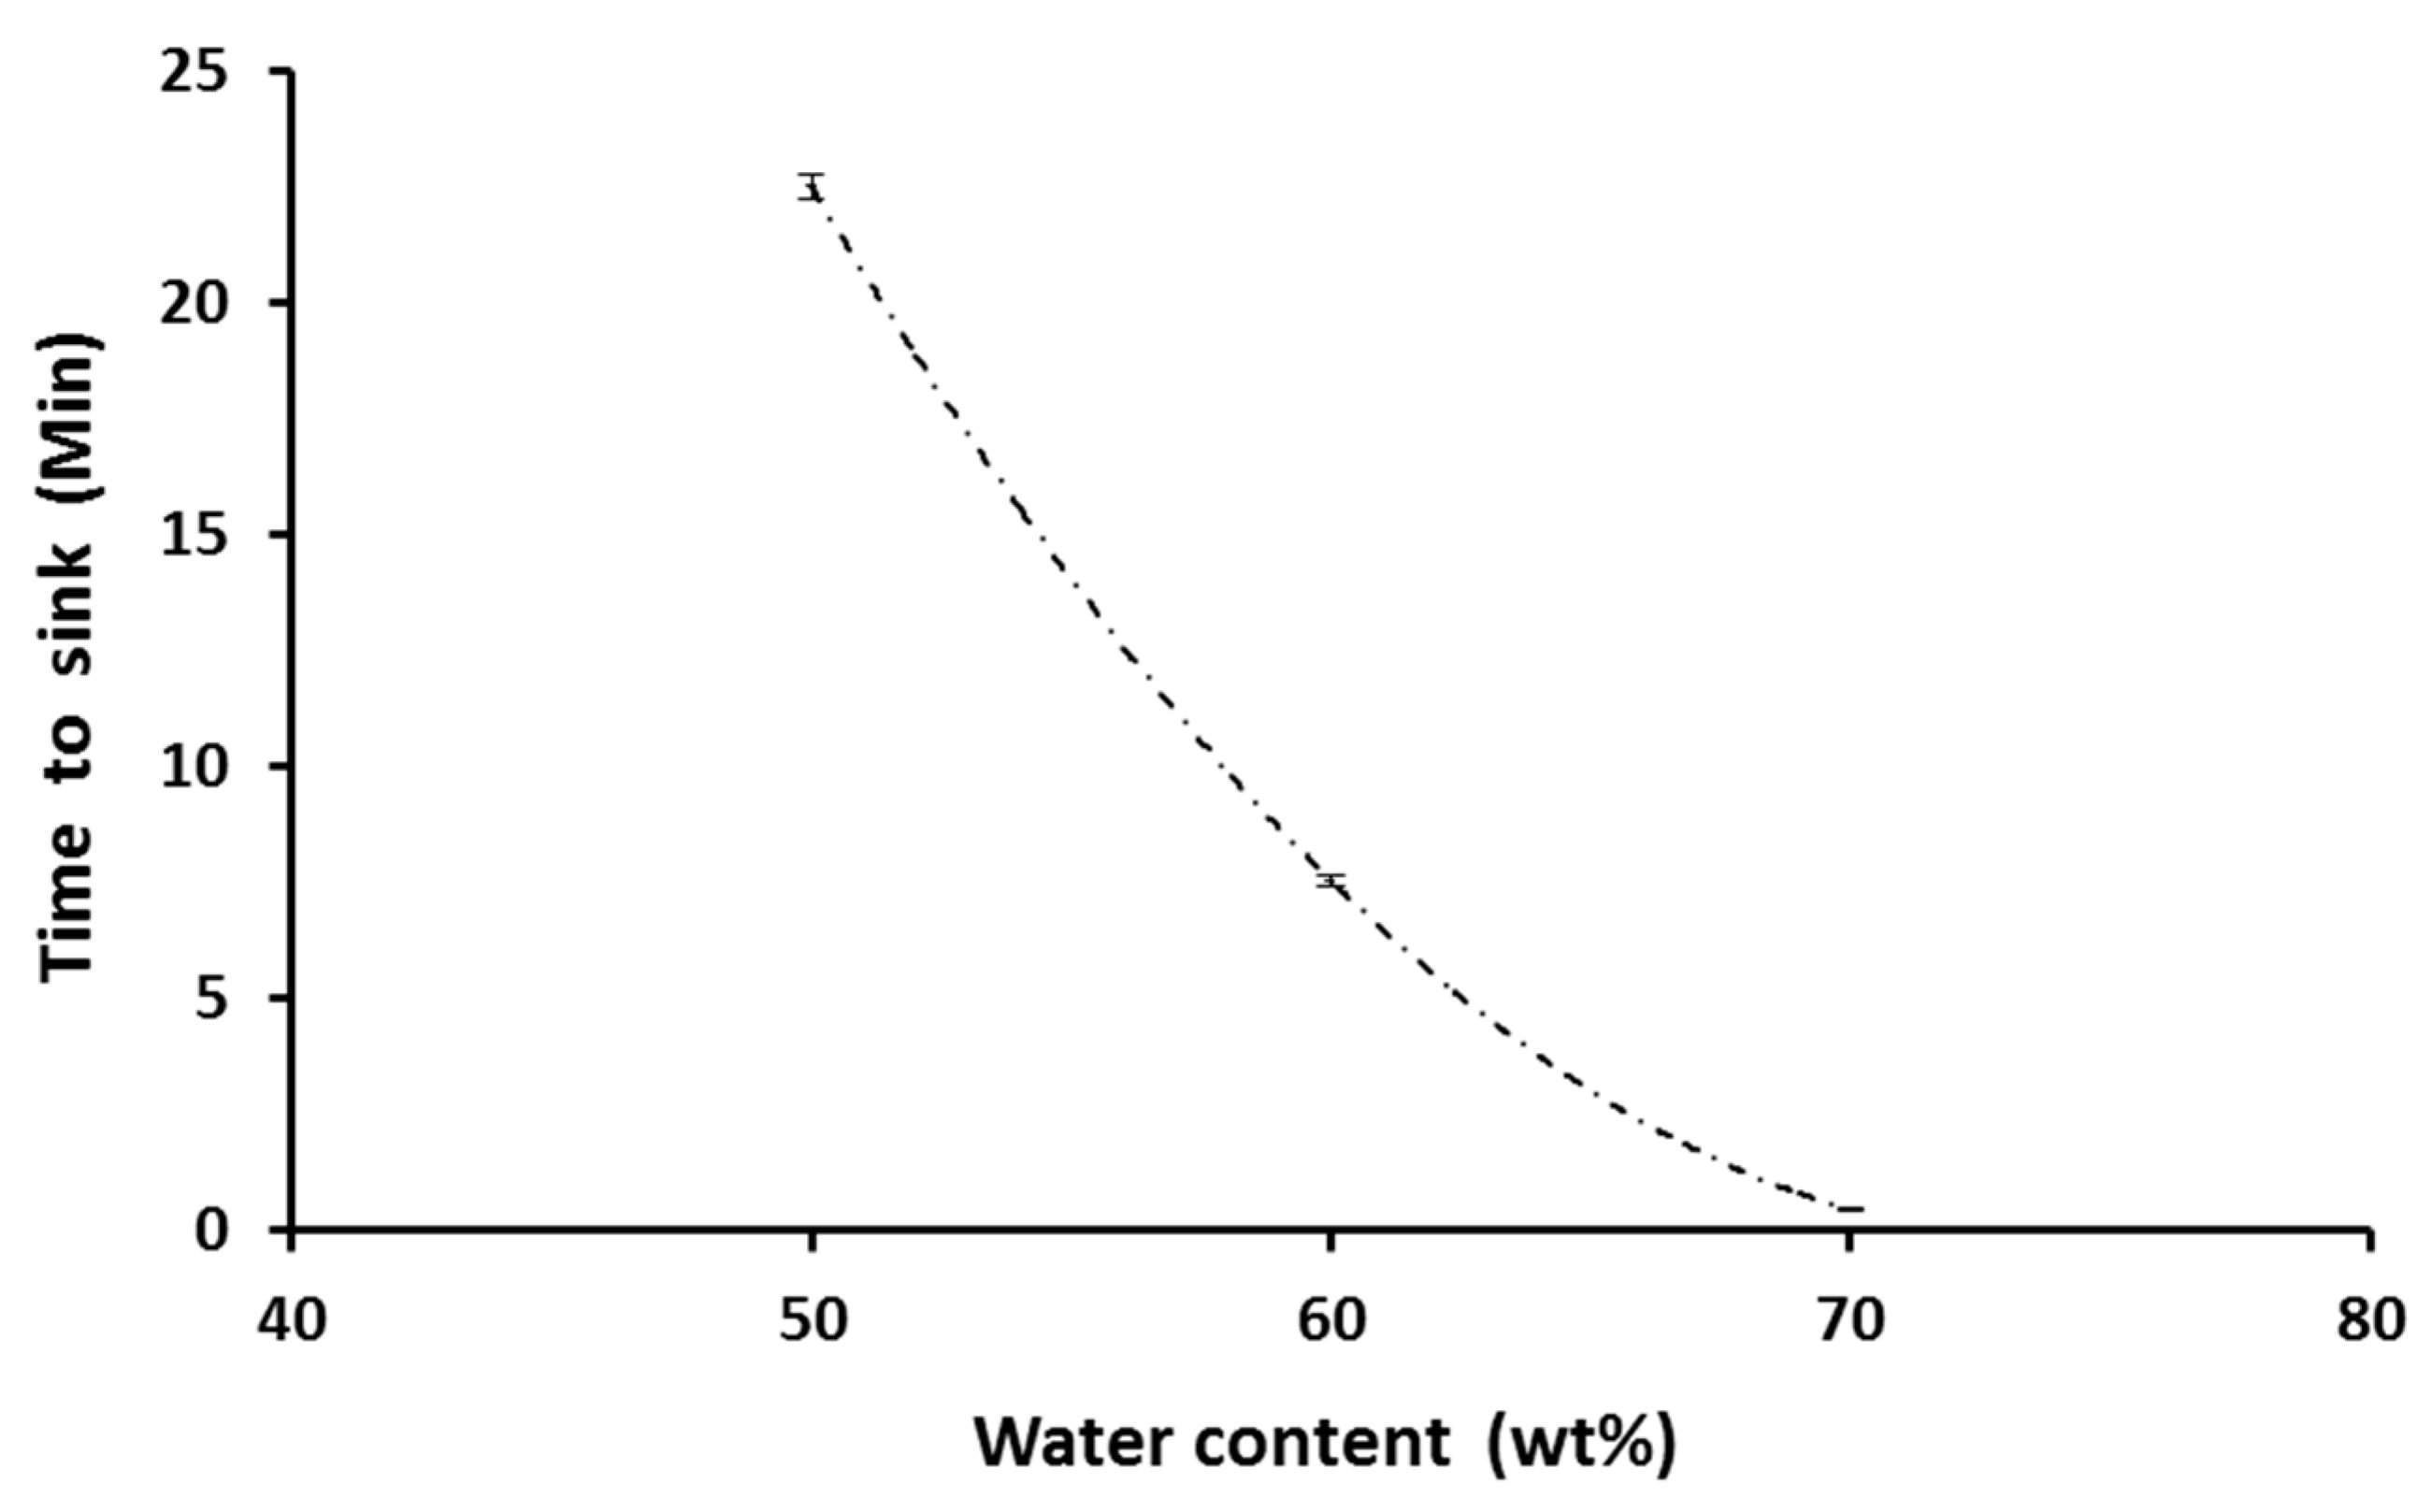
In
Figure 3, the relationship between the time to sink and water content of the hydrogels with 50%, 60%, and 70% tap water content are plotted. The results are consistent as the error bar is very small. Within the tap water content range 50%–70%, the sink time decreases rapidly, from about 22 min to less than one min. Subsequently, in
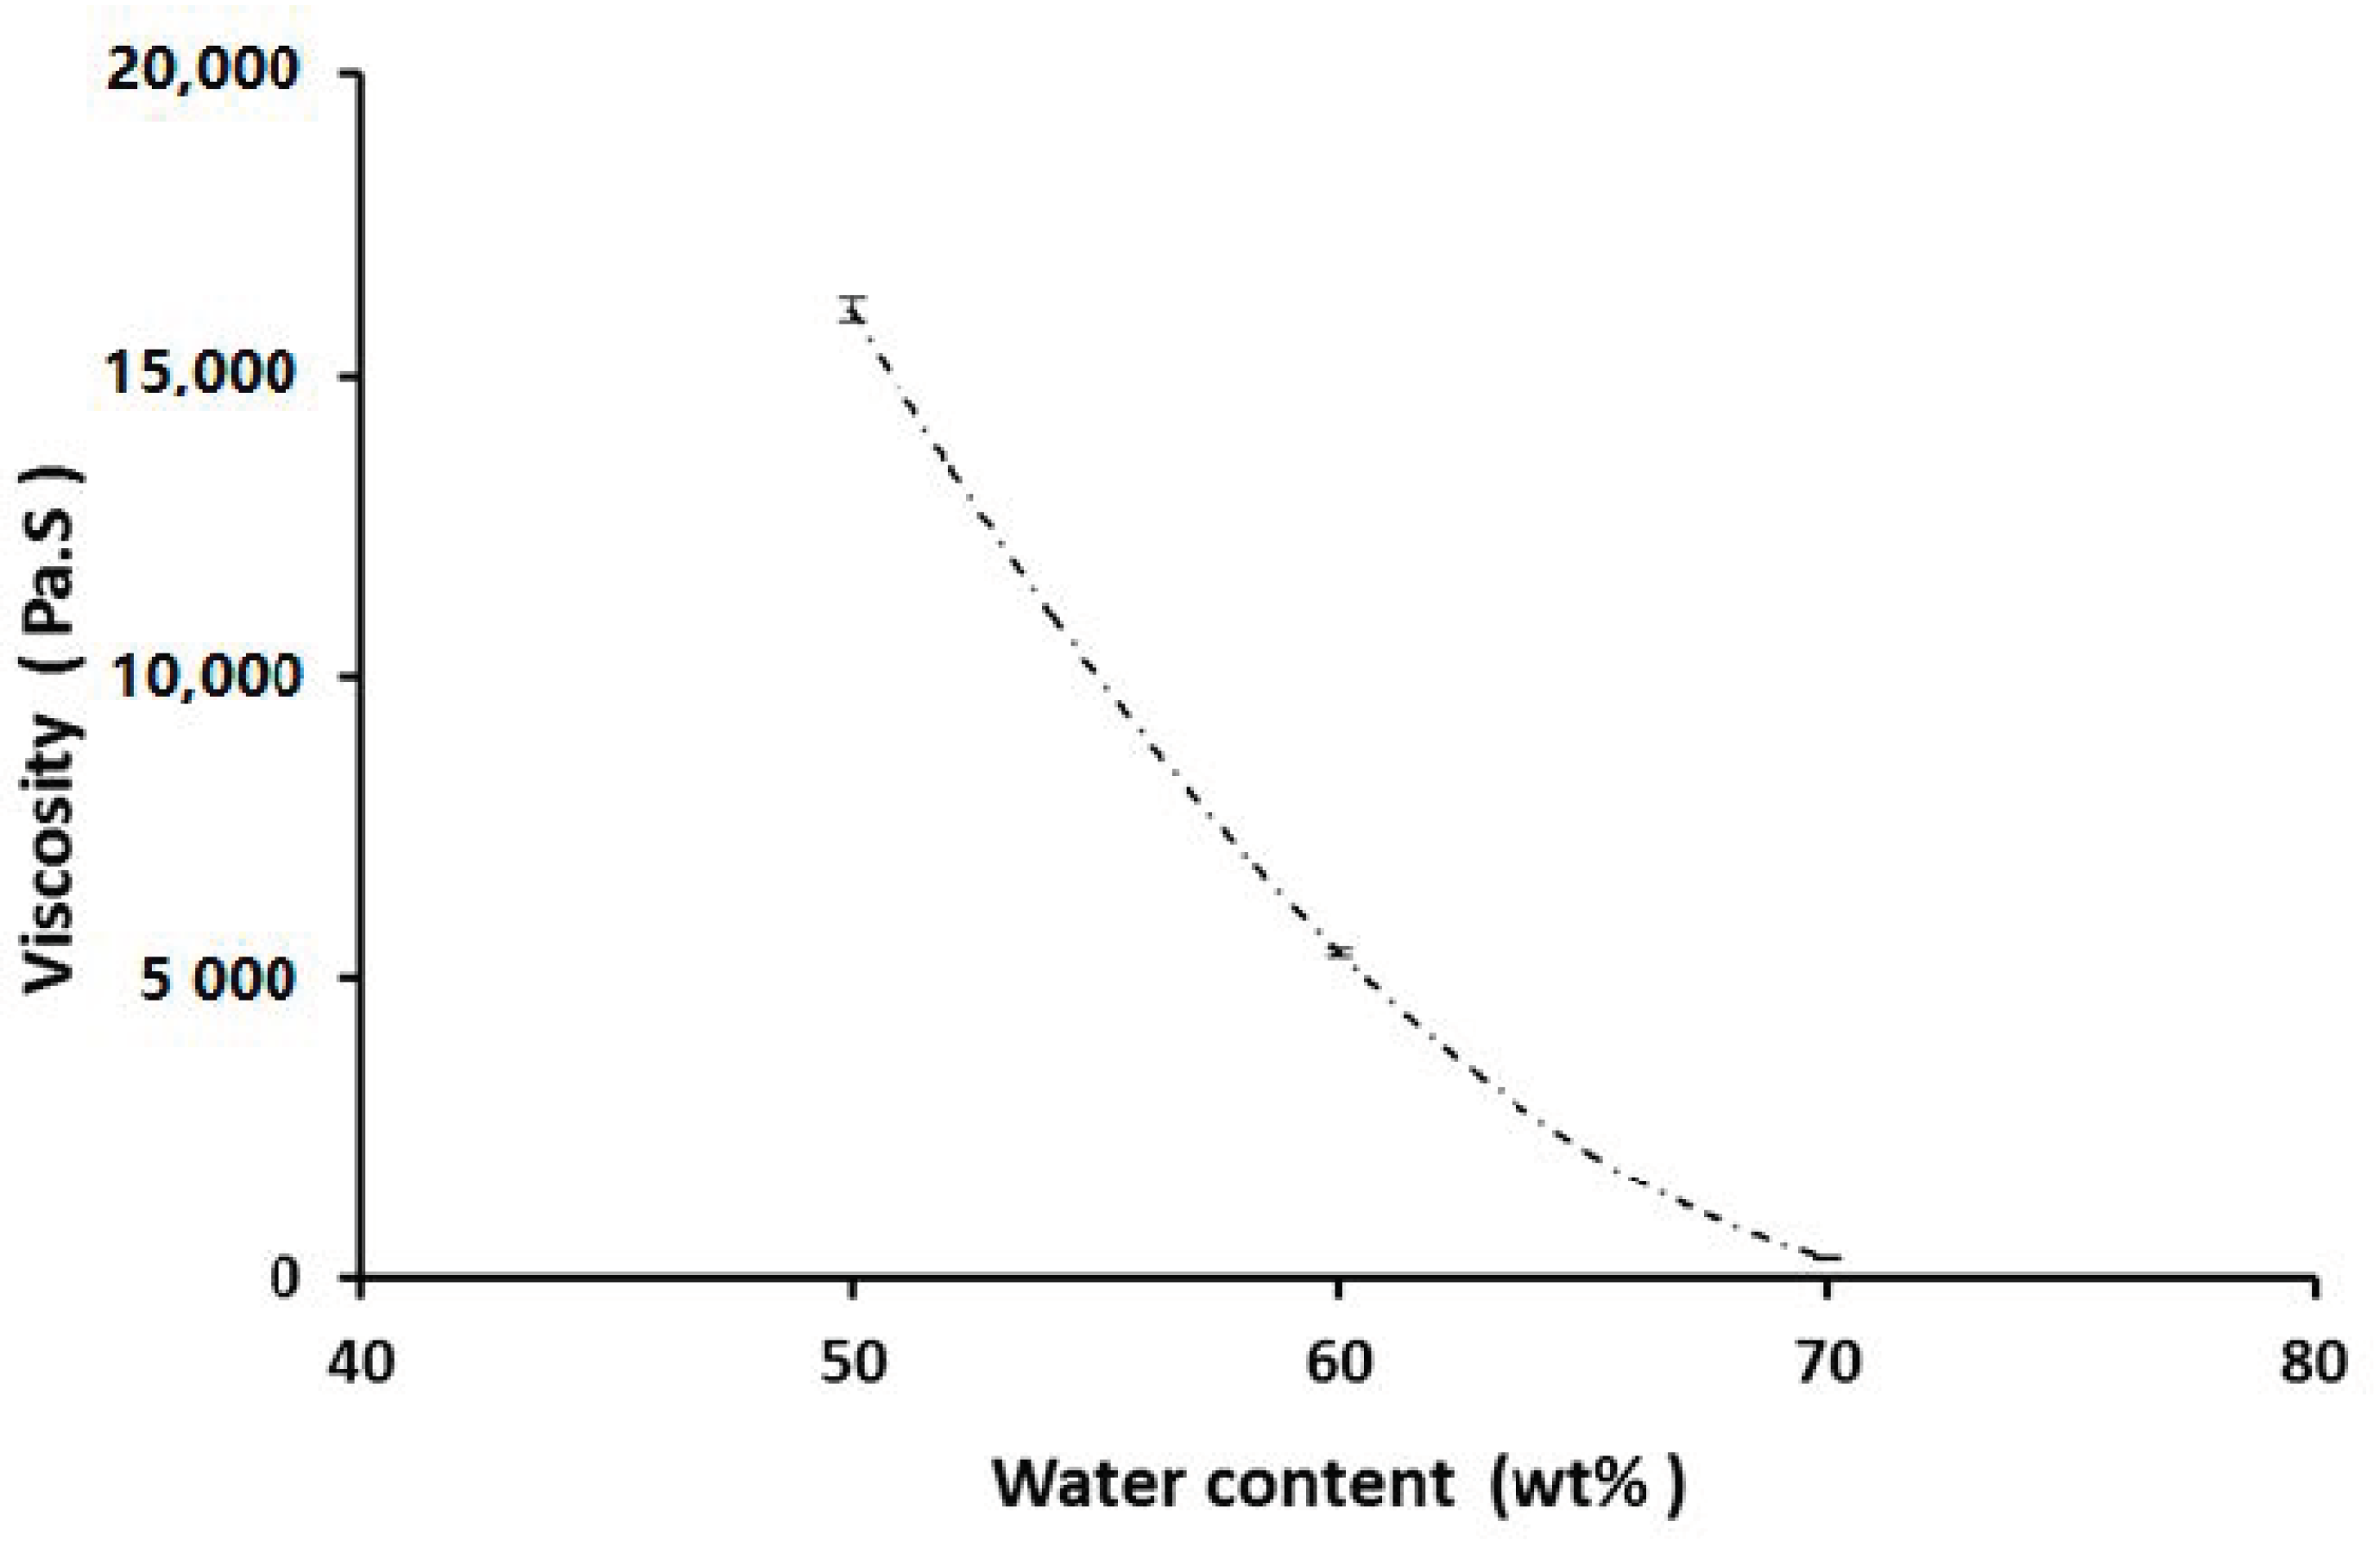
Figure 4, the relationship between viscosity and tap water content is presented, which essentially shares the same trend as that of the relationship between the time to sink and water content in
Figure 3. The drop in viscosity is about 50 times, from 16,115 to 334 Pa.s, when the tap water content is increased from 50% to 70%.
Figure 5 (left) presents the stress versus strain relationship in loading/unloading in a step-by-step manner (quasi-static) for the hydrogels with a tap water content from 10% to 40%. It is apparent that these hydrogels are much softer than normal commercial EVA insoles [
18], and with an increase in water content, the hydrogel softens under uniaxial compression (
Figure 5, right).
The hydrogels with 10% and 20% tap water content appear to be highly linear elastic after the applied load is over a limit. Before this limit is reached, the strain is negligible. It is also noticed that cracks tend to appear in these hydrogels, and these cracks cannot be easily self-healed.
For the hydrogel with 30% tap water, this limit is found at a lower compressive stress level. Upon further loading, the stress versus strain curve appears to be linear until in the last loading step, where apparent softening appears. In the following process of unloading from about 20% strain, which is reached at the maximum load, the stress versus strain relationship is linear until the applied load is fully removed in the last unloading step. A small amount of residual strain is observed, and a small gap between the loading and unloading curves is also observed. The slopes in loading (c) and unloading (c’) are about the same (refer to
Figure 5, right). It appears that in the early unloading stage, the strain largely remains the same. It suggests a kind of friction-like energy dissipation inside of the material.
The hydrogel with 40% tap water starts to deform from the beginning of loading in a quasi-linear manner, and hardening starts from about 35% strain. In the unloading process, there is no apparent change in strain at the beginning, which is the same as that in the hydrogel with 30% tap water, but this unloading range is much larger in this hydrogel. The later unloading curve is more or less linear, and a significant amount of residual strain is observed. The comparison of the slopes in unloading shows that the hydrogels with 30% tap water and 40% tap water are about the same.
It can be concluded that, with the increase in water content, the hydrogel changes from hard and elastic to soft and viscous. The gap between loading and unloading curves, which indicates a kind of energy dissipation, increases with an increase in water content. If the tap water content is 50% or more, referring to the relationship between the sinking time and water content in
Figure 3, “plastic” flow becomes more and more dominant.
The decrease in the load limit to initiate remarkable deformation upon compression appears to be associated with the water content. The hydrogen bonding between the borate ions and PVA chains may be weakened with an increase in water content, so that internal sliding starts at a lower stress level and the hydrogel appears to be softer. However, once over compressed, strain hardening occurs. It suggests that with a decrease in water content, the hydrogel becomes similar to Bingham fluid [
12]. The hardened hydrogel does not soften upon unloading, which results in remarkable residual strain in the hydrogel with 40% tap water.
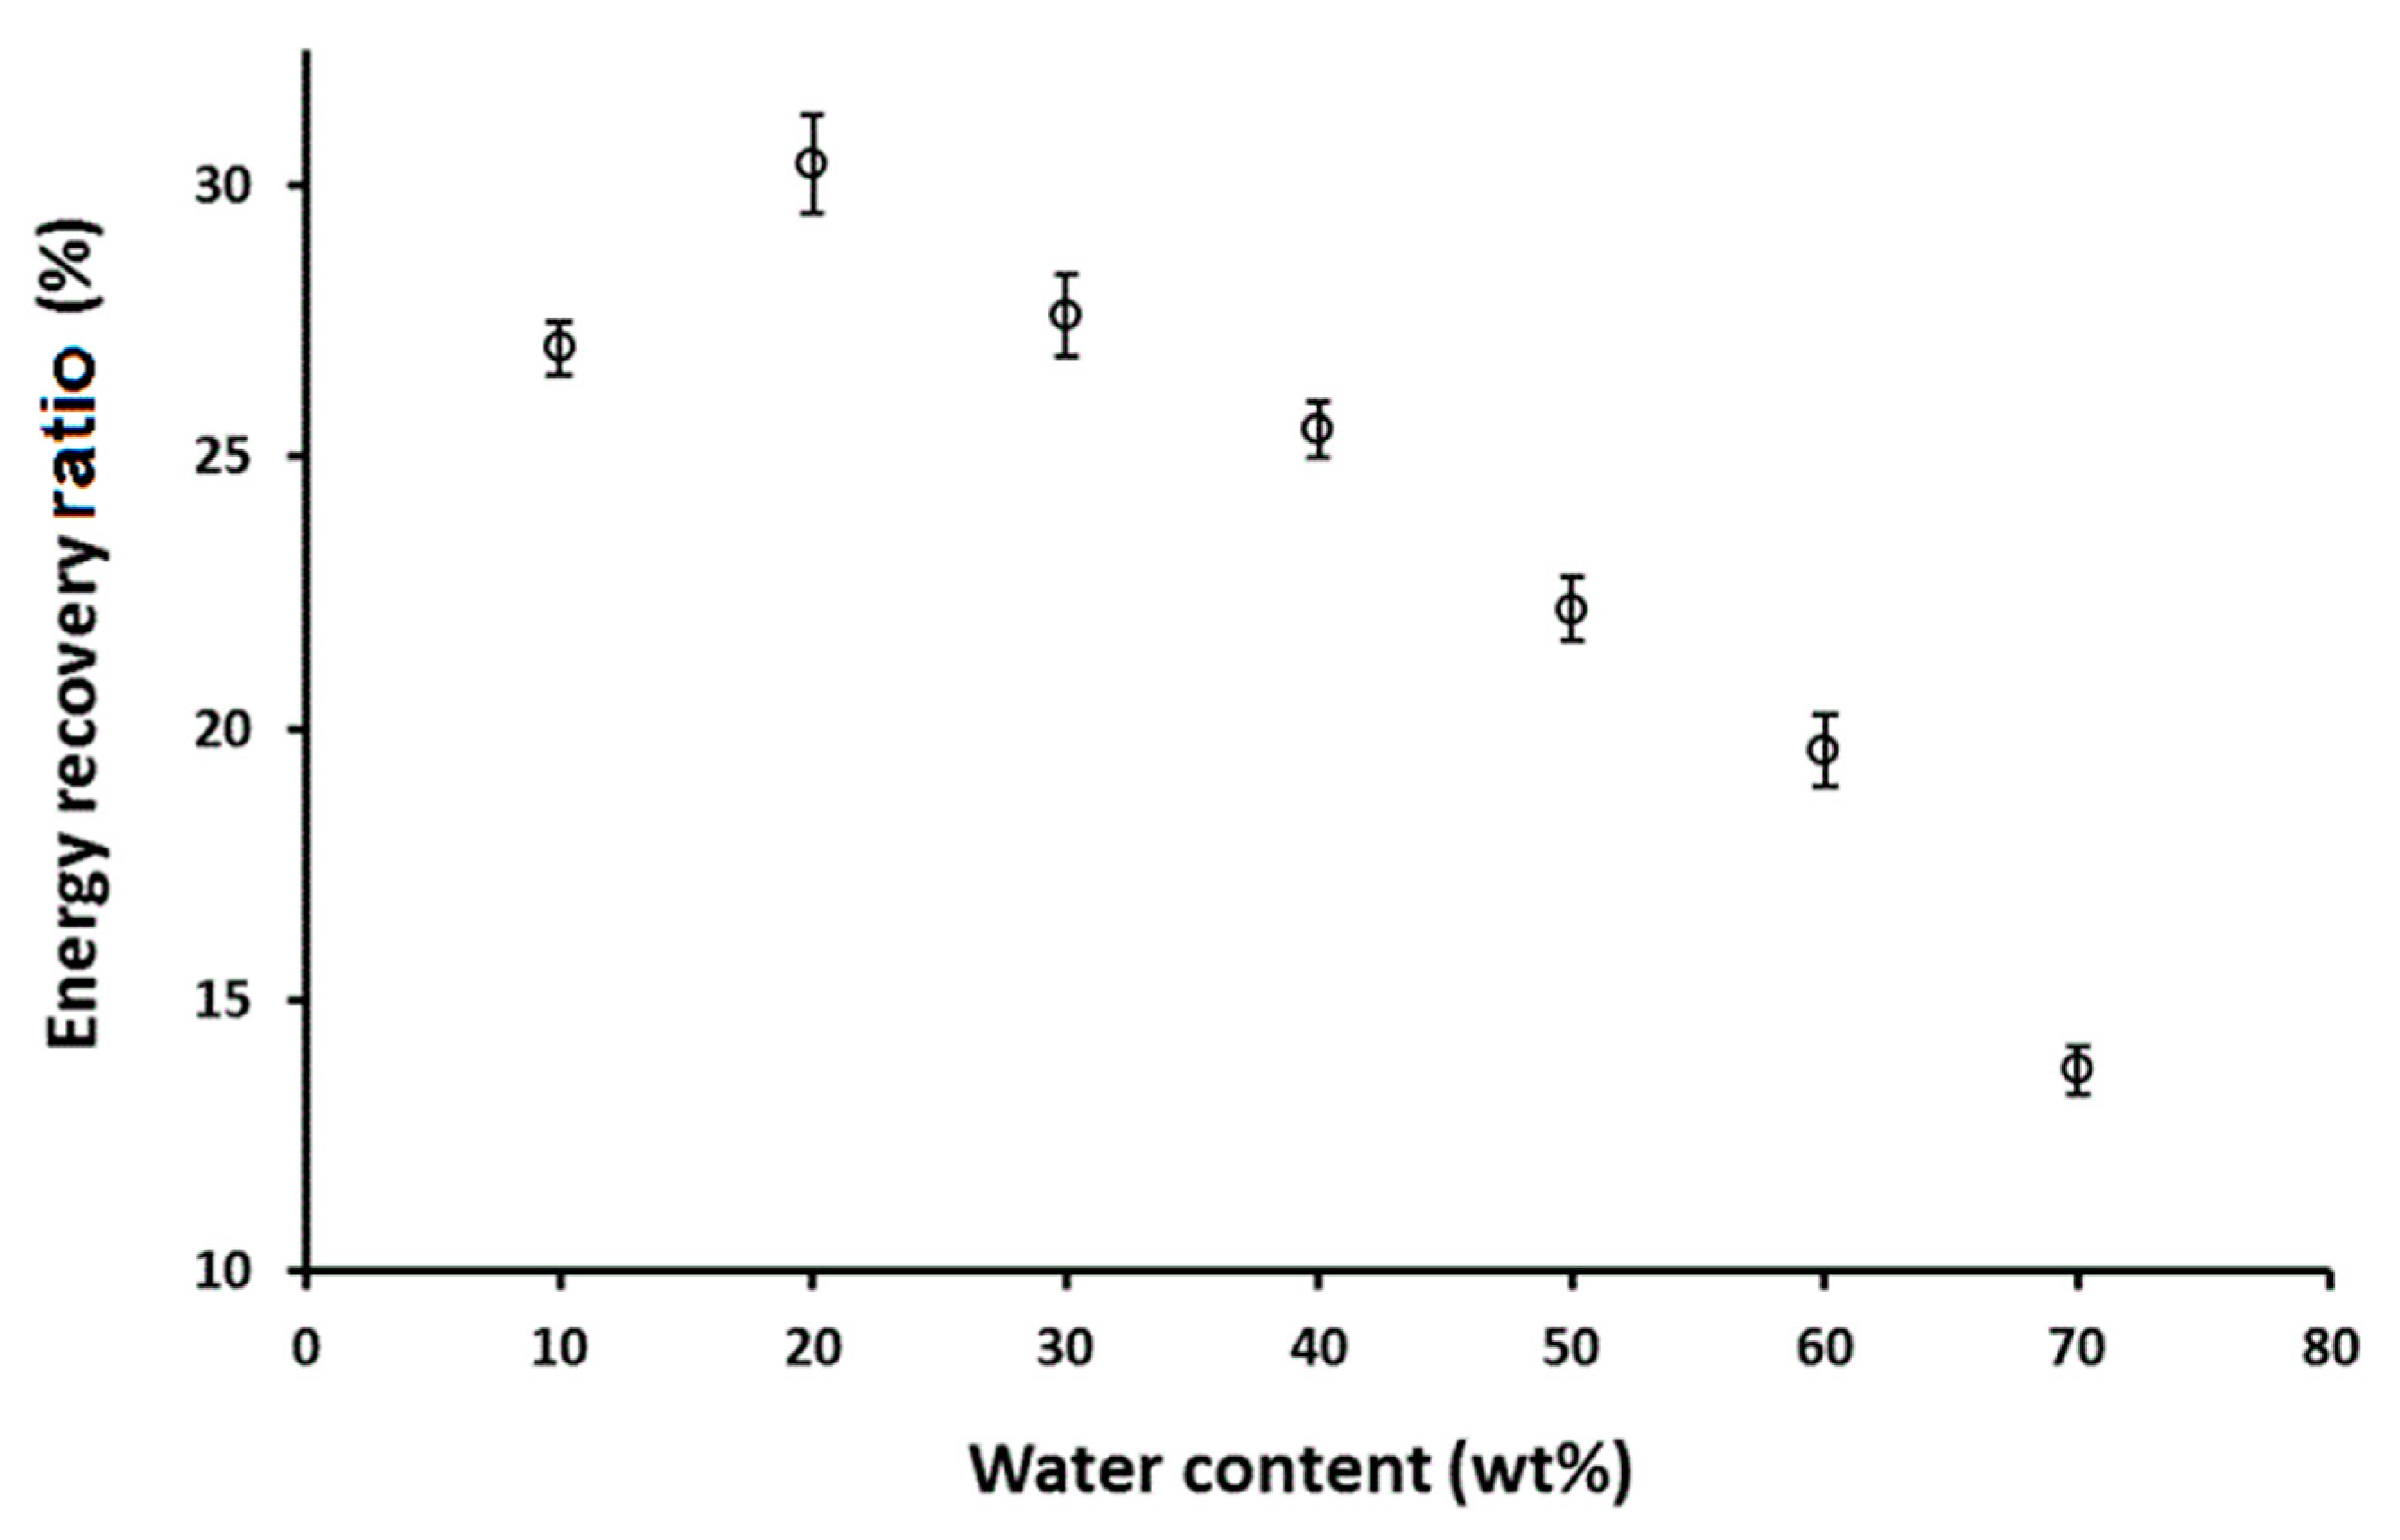
The energy recovery ratio (in %) as a function of tap water content is plotted in
Figure 6. For the particular setup in the current rebound test, the maximum energy recovery, about 30%, seemingly appears in the hydrogels with about 20% tap water content. As mentioned above, with an increase in water content, the response of the hydrogel shifts from hard and elastic to soft and viscous. While the shear-thickening effect is meant for significant hardening under impact loading, which appears to be more apparent in these hydrogels with more water, in terms of energy recovery measured by the rebound performance, relatively harder hydrogels (i.e., with less water), but still much softer than the EVA sole, appear to be better. Hence, for the intended application of this study, we should select the shear-thickening materials that have better rebound performance, instead of remarkable shear-thickening effect.
2.3. Shear-Thickening Composites
Hydrogels with a 25% and 37% water content were employed in the investigation of integration with EVA insoles and were prepared in the same approach as mentioned in
Section 2.1. These two samples were selected for further testing since harder hydrogels with 20% water content or less tend to crack upon compression, which has self-healing difficulties due to low water content while softer hydrogels with 40% water content or more possess unsatisfactory energy recovery even with a striking change in hardness against impacts.
Figure 7a shows the shape and dimensions of the designed insole. The insole is designed to have a surrounding ring of EVA, which can be trimmed to tailor-fit various foot sizes and shapes or bent around the foot curvature to form a foam cage within the shoe lining and provide enhanced protection. There is 10 mm diameter through holes at the insole middle area to enable unconstrained stretching at high temperatures for exploiting the SME properties of EVA to achieve comfort fitting purposes [
18,
19].
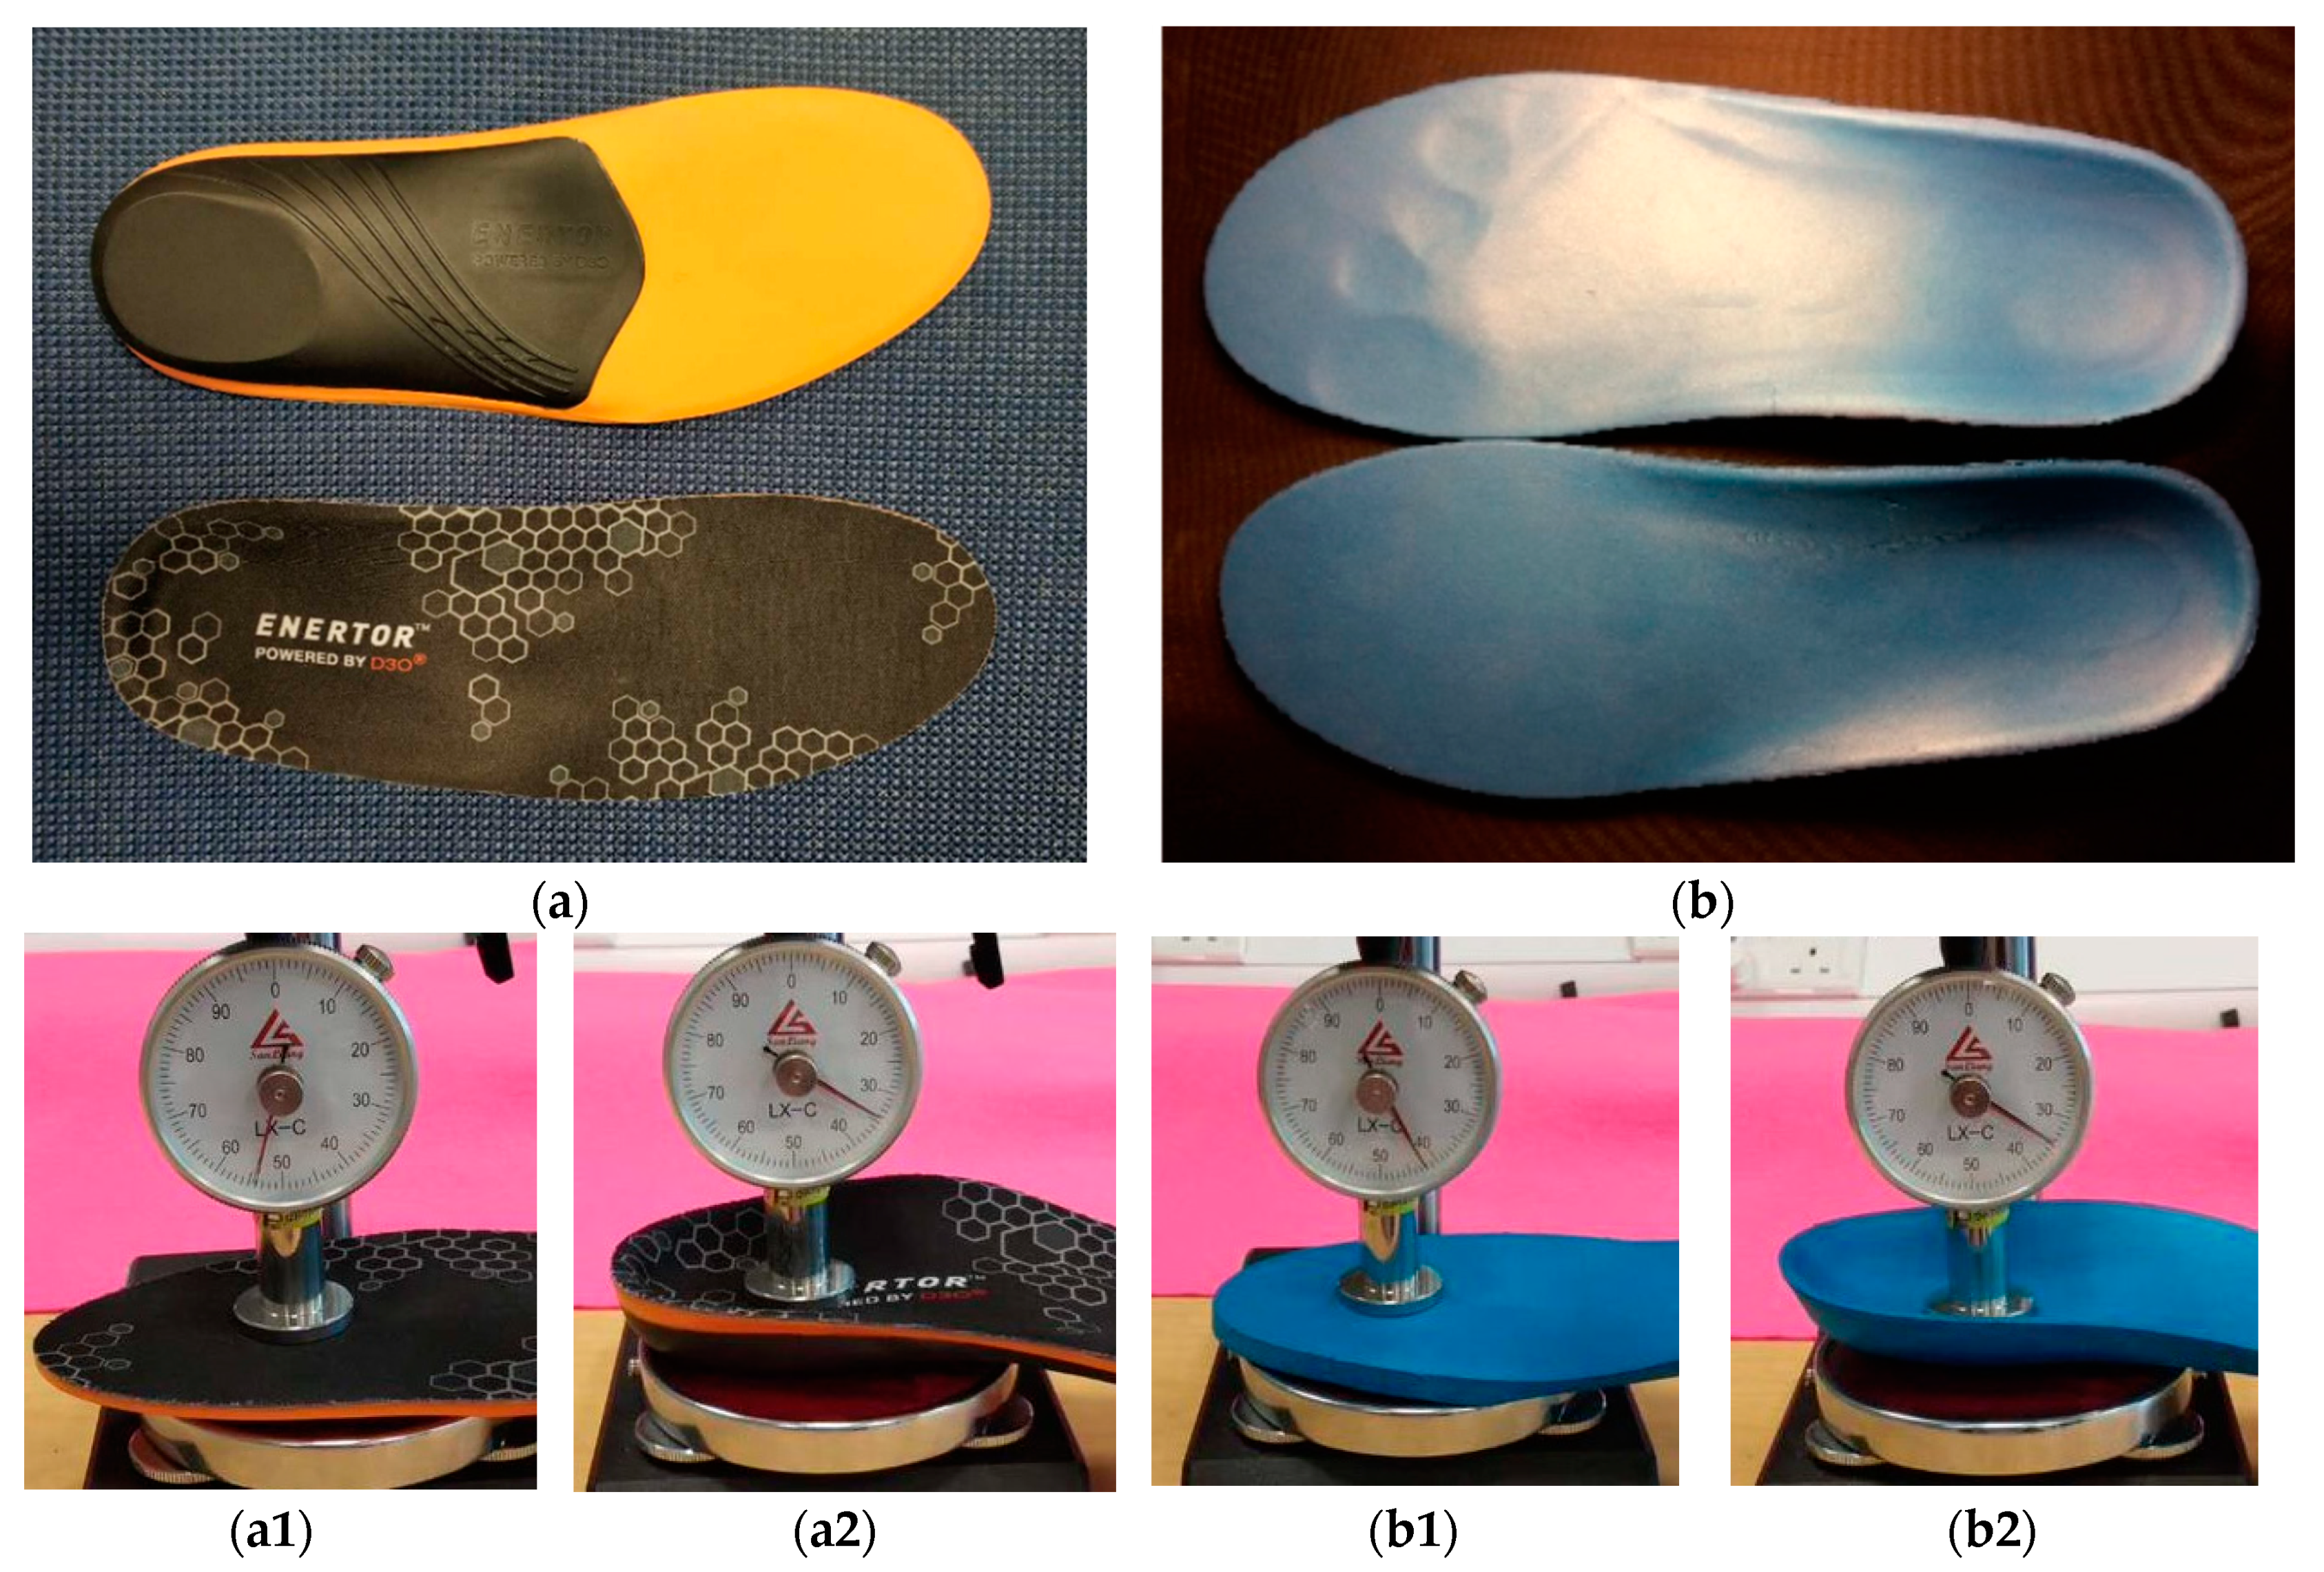
Figure 7b shows an as-fabricated elastic EVA sole produced by Dong Guan Bid Ace Co. Ltd. with the density of the fabricated EVA sole at about 105 kg/m
3. Since the density of EVA is between 926 and 950 kg/m
3, the porosity ratio of the EVA sole is about 90%. The Shore hardness for the insole’s forefoot area is measured to be around 45C while the heel area is about 50C.
Without the surrounding ring, as shown in
Figure 8, the middle portion of the insole with an array of holes can be easily stretched at around 55 °C, which is the glass transition temperature of the EVA material. After cooling the insole back to room temperature, the length of the middle area increases from 60 to 75 mm. The length extension of the insole can be mostly remedied upon heating to above 55 °C, again using a hair dryer [
18]. Additional 10 mm diameter through holes at the insole forefoot and heel areas were produced by drilling to fill the hydrogel material, as shown in
Figure 7c for the location of the holes.
The drilled holes within the insole were filled with Slime hydrogel and a two-dimensional (2D) highly stretchable elastic cloth was used to cover the top and bottom surfaces of the insole to securely house the hydrogel inside. Two insole samples were manufactured for further testing, which involved the utilization of 25% and 37% water content Slime hydrogel.
Figure 9 shows the stress versus strain relationships of the 2D elastic cloth in uniaxial stretching along two directions on the cloth surface. One side of the elastic cloth was coated with a very thin layer of commercial thermoplastic polyurethane TPU 265 which worked as melting glue to firmly bond the elastic cloth and EVA insole together, while preventing the hydrogel from leaking through the elastic cloth and water in the hydrogel from evaporation [
20].
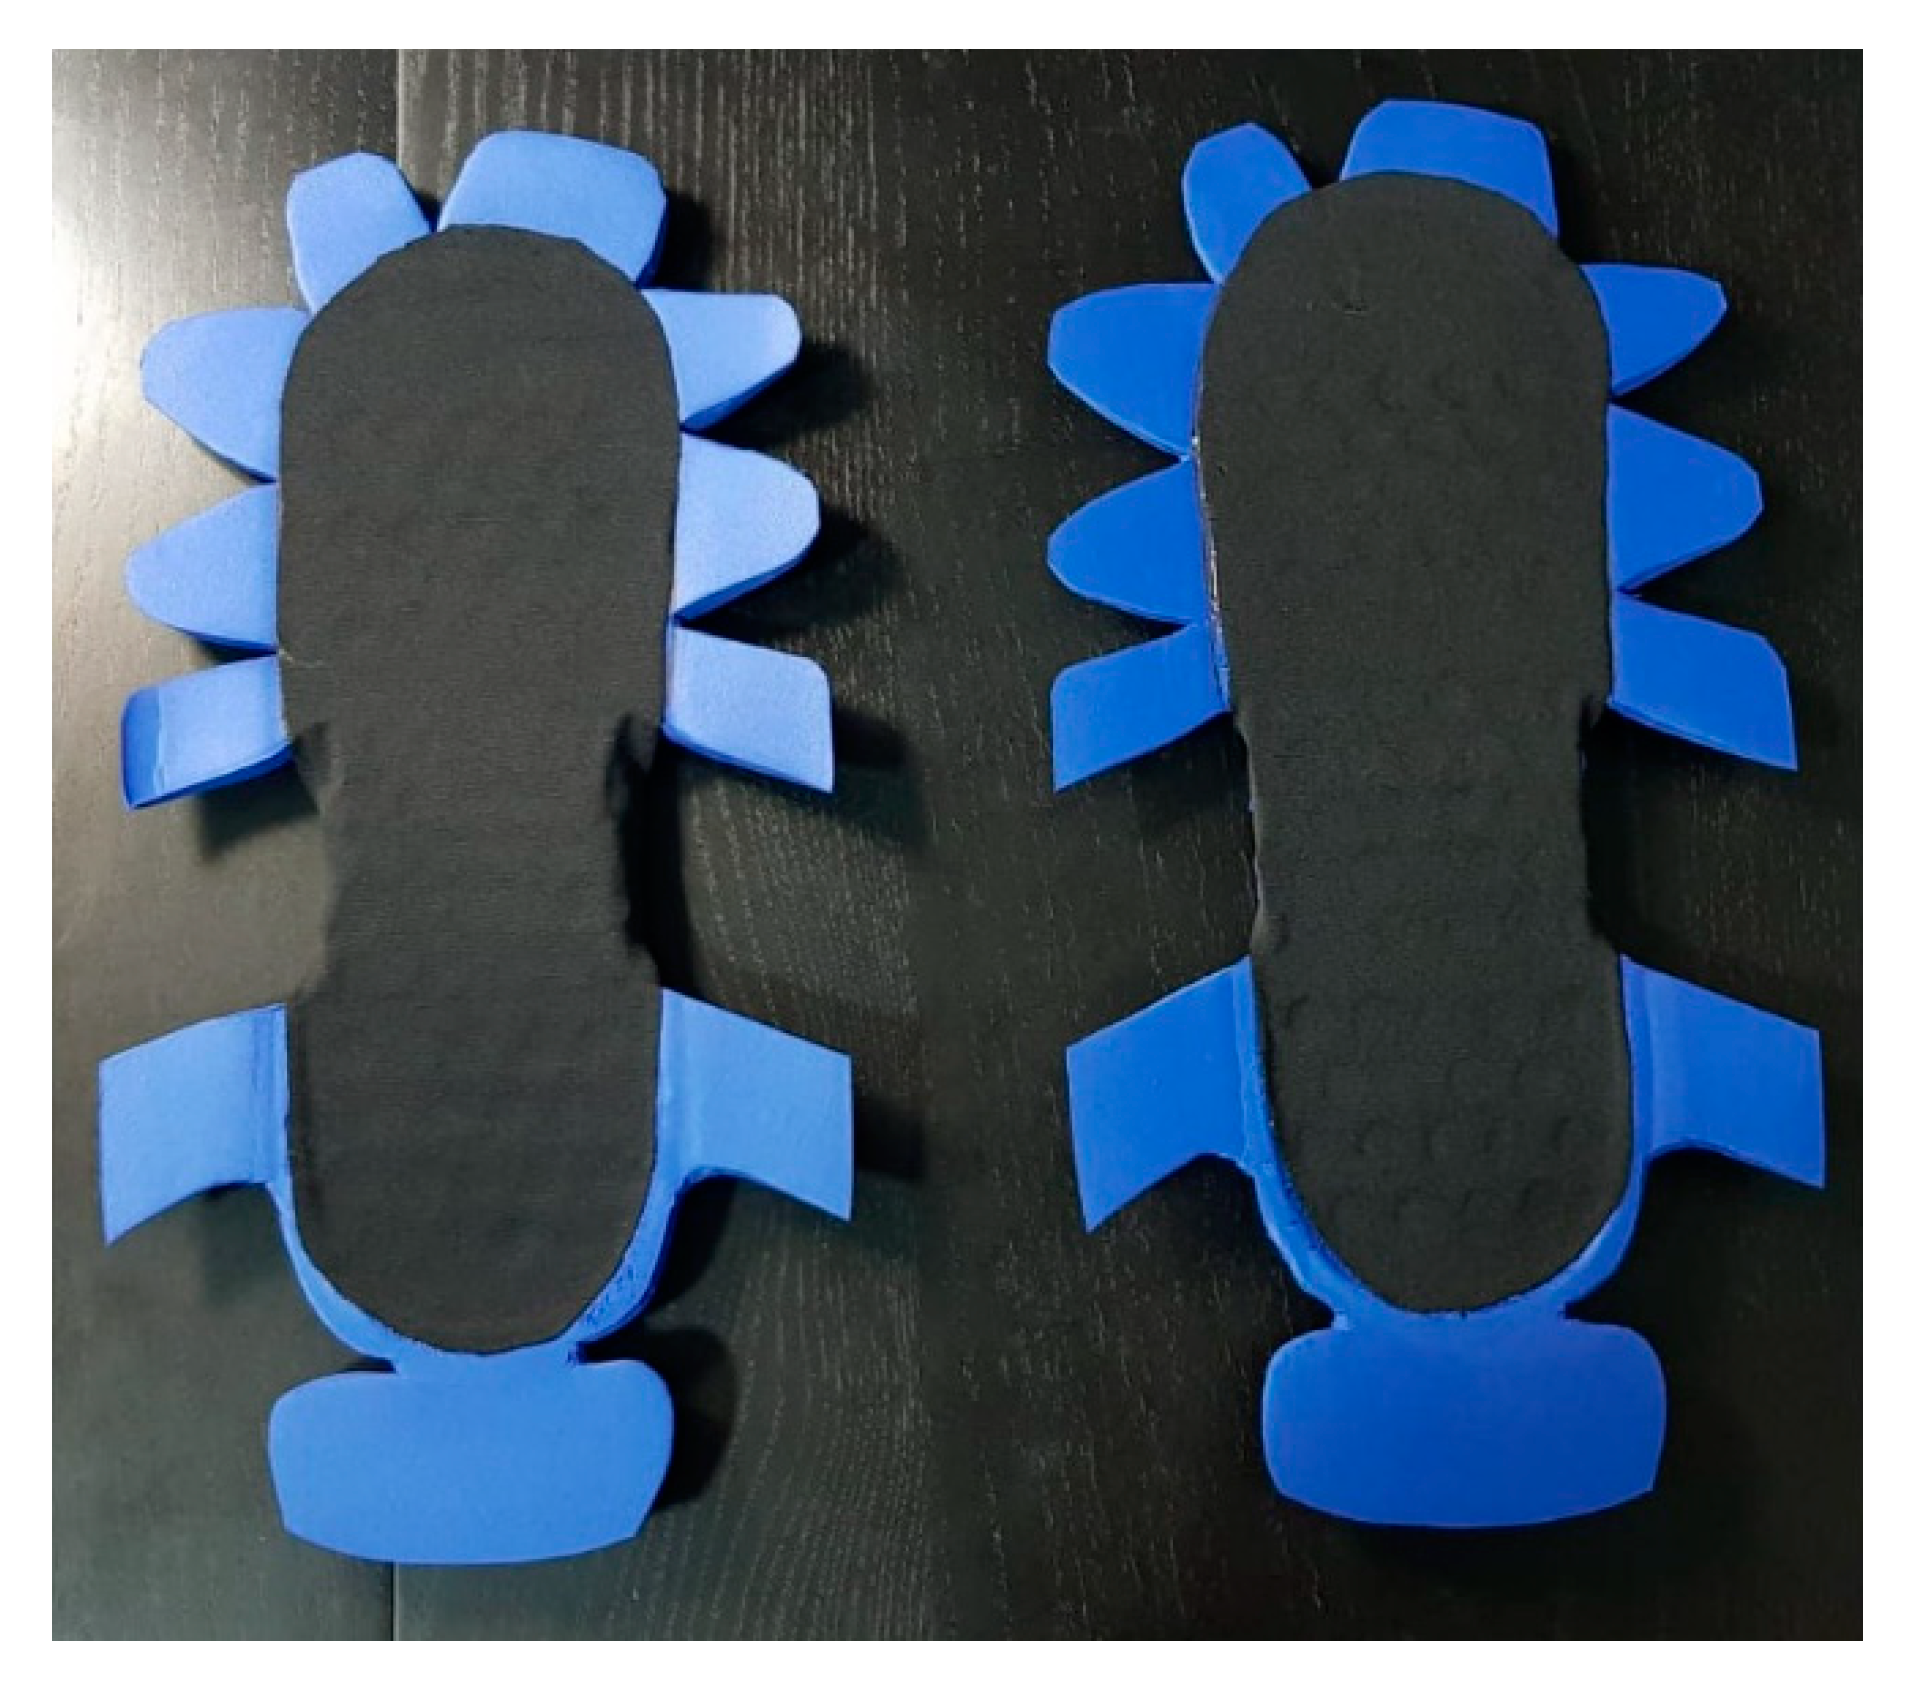
Figure 10 presents the top view of the two modified EVA insoles, where the surrounding rings were partially cut out such that the residual flaps can easily fold up to bond with the shoe upper in the next development stage of shape memory shoes. Since the standalone hydrogel is much softer than the EVA insole (refer to [
18] for the mechanical behavior of typical EVA insole), the modified EVA hybrid insole integrated with hydrogel is expected to be softer than the original EVA sole.
2.4. Rebound Performance and Comparison
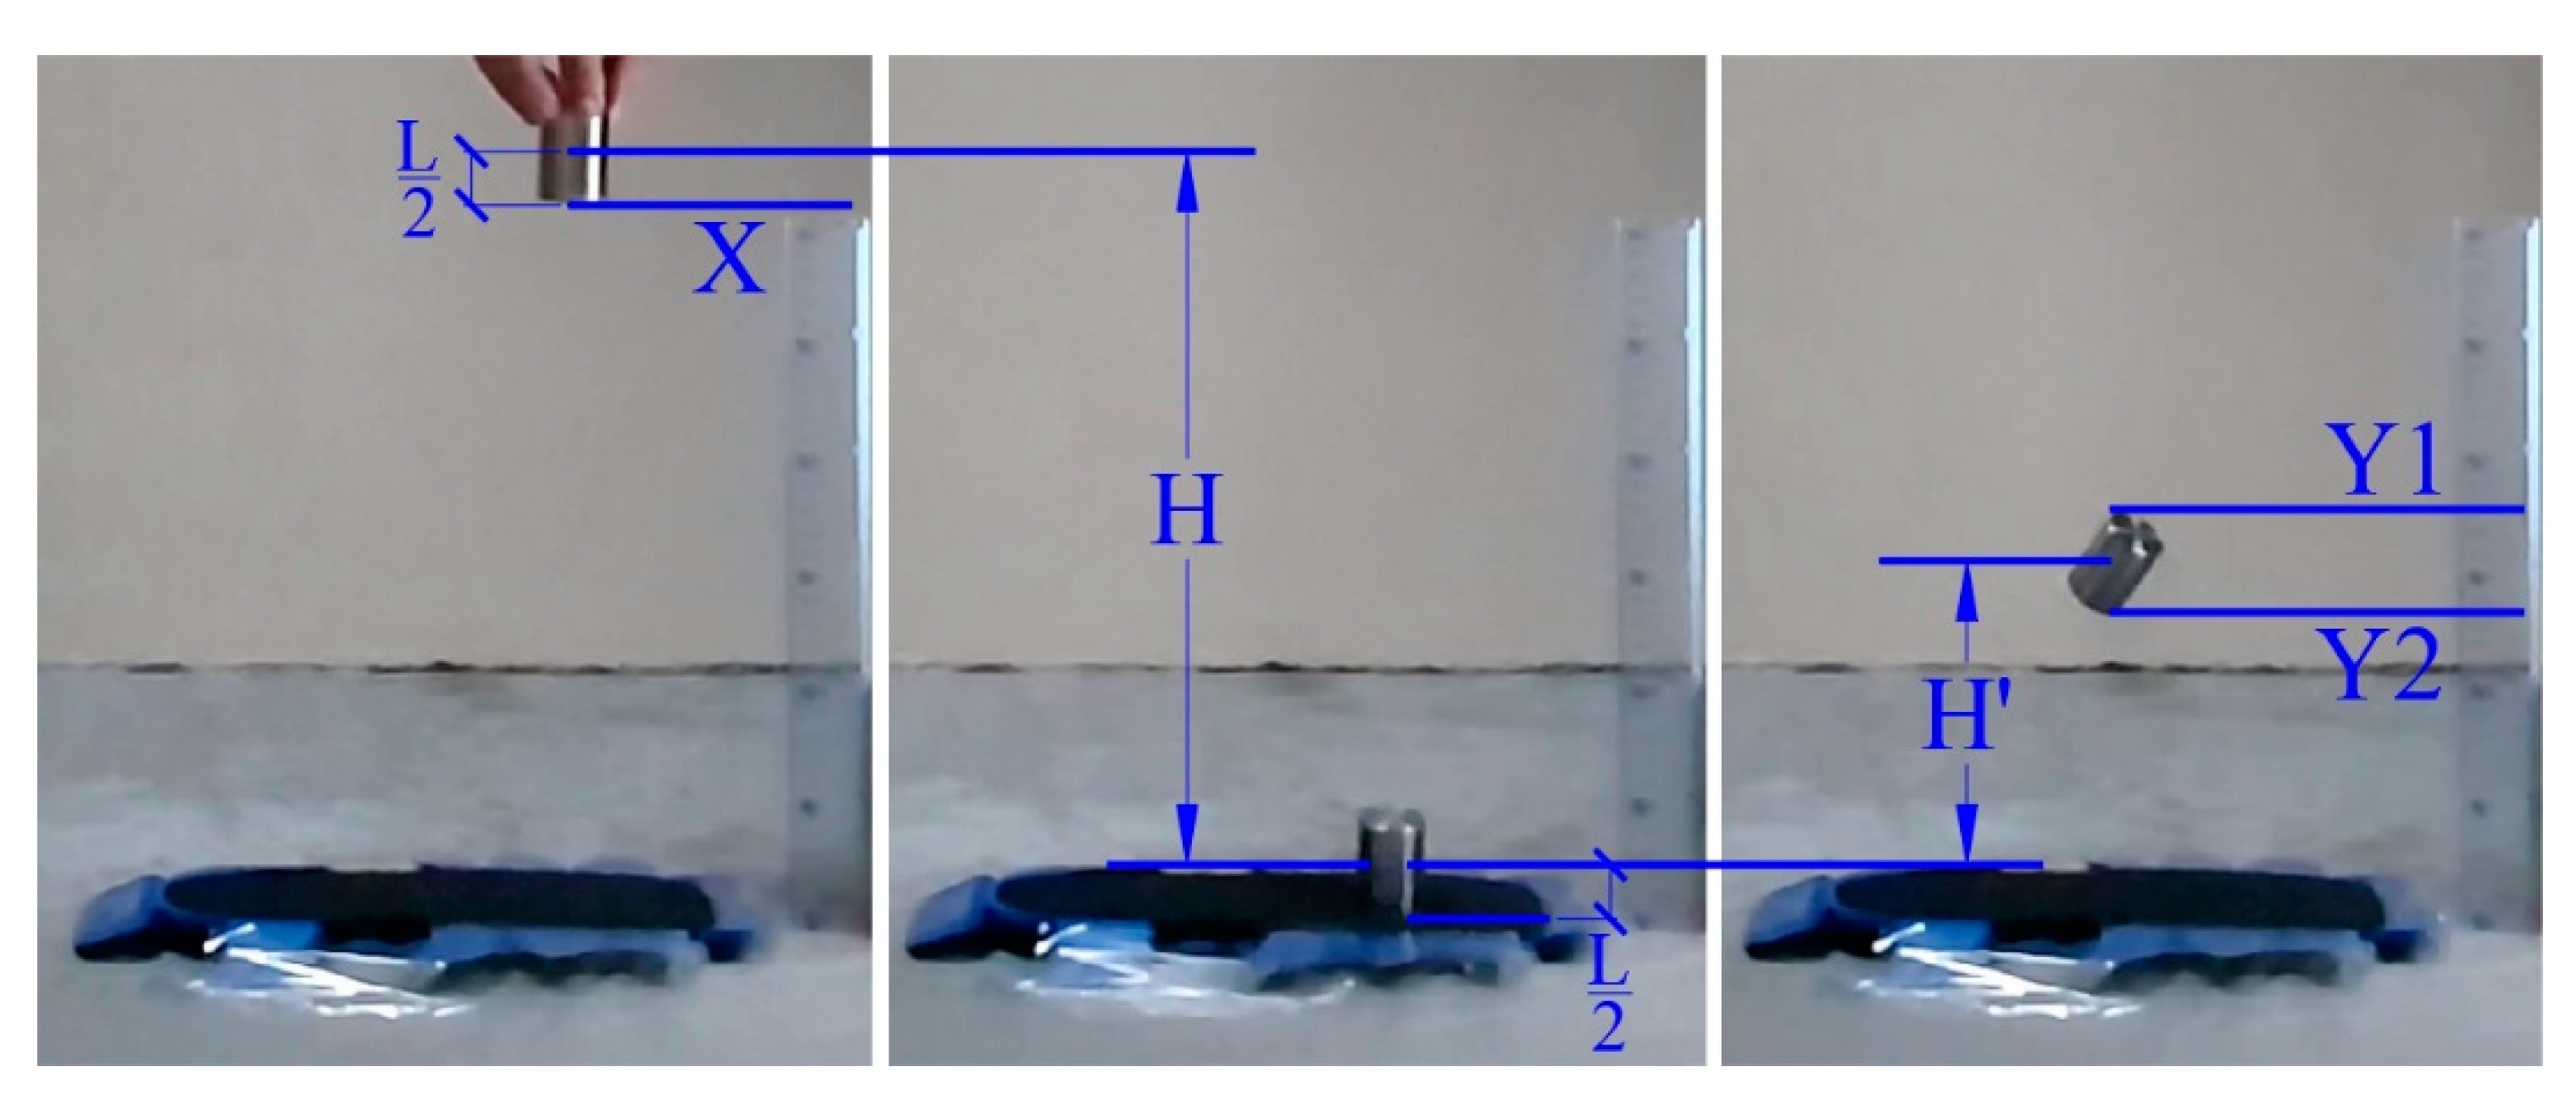
The setup of the rebound performance test is illustrated in
Figure 11. The tested insole was firmly stuck to the ground using a strong double-sided tape with a piece of ruler vertically placed near the tested insole. A video camera was used to record the whole process including the release of cylinder mass onto the test insole and the subsequent rebounds. A stainless-steel cylinder mass weighing 222.4 g of 30 mm diameter and 40 mm length was released from a distance
H of approximately 300 mm above the top surface of the insole to hit the forefoot or heel area. Since the 30 mm diameter of the cylinder mass is far larger than the 10 mm diameter of the drilled holes, the contact area for a normal direction impact consists of one or more hydrogel filled holes and the enclosing EVA material when the bottom surface of the cylinder mass impacts the top surface of the modified EVA insole. The maximum rebound height
H’ was obtained from the video recording via frame-by-frame analysis of the cylinder mass trajectory. Since a variation of falling trajectories is expected, only the results of tests in which the bottom side of the steel cylinder vertically hit the top surface of the sole are valid and included in the analysis.
The energy recovery ratio (in %) is calculated by,
In addition to the original EVA insole and two modified insoles containing 25% and 37% water content hydrogels, respectively, a commercial shear-thickening insole Enertor
TM from D3O Lab, as shown in
Figure 1, was also tested for comparison.
In
Figure 12, the energy recovery ratios (in %) of the original EVA insole, EVA modified insoles with two types of hydrogels containing 25% and 37% water content, and D3O insole are compared for both the forefoot and heel areas. For the testing conditions applied in the current investigation, the rebound performance of EVA modified insole with hydrogel (25%) is outstanding among all the tested materials. The average energy recovery ratio for both its forefoot and heel area is over 40%, well above that of the original EVA sole, EVA sole modified with hydrogel (37%), and D3O insole. Regarding
Figure 6, the rebound performance of the EVA modified insole with hydrogel (25%) is superior to the pure hydrogel, whose rebound performance was at best 30%. Comparing between the original EVA insole and the D3O insole, it can be observed that the rebound performance of the original EVA insole forefoot area outperforms that of the D3O insole, but its heel area rebound performance is inferior to the D3O insole. After applying modification with a hydrogel of 37% water content, the rebound performance of the forefoot area slightly declines but still outperforms the D3O insole, while the rebound performance of the heel area has significant improvements, and therefore is superior to the D3O insole. It suggests the importance of shear-thickening material selection with optimized compositions tailored to achieve the best performance for the composite.
With the current approach of modification via filling of holes with shear-thickening hydrogel, the modified EVA insole with shear-thickening composite is softer than the original EVA sole and is mostly able to keep the original elasticity under slow speed loading. However, the partial replacement of EVA foam with hydrogel is at the expense of increased weight. Furthermore, it is problematic to preserve the water content in hydrogel, and hence there could be longevity concerns for the insole application despite potential performance advantages. Commercial shear-thickening insoles, such as TAICHI 1.0 and EnertorTM, are foam composites with high porosity ratios, and the embedded shear-thickening materials are not sensitive to water/moisture. Despite these challenges that could be explored in future studies, the experimental investigation reported here demonstrates that the energy recovery ratio is the key parameter in the selection of the shear-thickening material to achieve enhanced rebound performance of the composite that outperforms the elastic foam and shear-thickening material, while being softer than the elastic foam.
