Article

Detection of Material Extrusion In-Process Failures via Deep Learning

1
Department of Mechanical Engineering, College of Engineering, Tennessee Tech University, Cookeville, TN 38505, USA
2
Department of Manufacturing and Engineering Technology, College of Engineering, Tennessee Tech University, Cookeville, TN 38505, USA
3
Department of Mathematics, College of Arts and Sciences, Tennessee Tech University, Cookeville, TN 38505, USA
*
Author to whom correspondence should be addressed.
Inventions 2020, 5(3), 25; https://doi.org/10.3390/inventions5030025
Submission received: 7 May 2020 / Revised: 19 June 2020 / Accepted: 29 June 2020 / Published: 1 July 2020
(This article belongs to the Section Inventions and Innovation in Advanced Manufacturing)

Abstract

:
Additive manufacturing (AM) is evolving rapidly and this trend is creating a number of growth opportunities for several industries. Recent studies on AM have focused mainly on developing new machines and materials, with only a limited number of studies on the troubleshooting, maintenance, and problem-solving aspects of AM processes. Deep learning (DL) is an emerging machine learning (ML) type that has widely been used in several research studies. This research team believes that applying DL can help make AM processes smoother and make AM-printed objects more accurate. In this research, a new DL application is developed and implemented to minimize the material consumption of a failed print. The material used in this research is polylactic acid (PLA) and the DL method is the convolutional neural network (CNN). This study reports the nature of this newly developed DL application and the relationships between various algorithm parameters and the accuracy of the algorithm.

1. Introduction

Additive manufacturing (AM) is a set of technologies used to produce three-dimensional (3D) objects from computer-aided design (CAD) models [1]. The term 3D printing (3DP) is used interchangeably with AM [2]. Various methods are used in AM technologies, including material extrusion (ME), selective laser sintering (SLS), selective laser melting (SLM), stereolithography (STL), etc. [3]. However, the ME technique is of particular interest to this research project since it is the most widely used [4]. In the ME process, the material is melted and extruded on the printing bed to build the parts layer by layer [1,3]. Applications of these AM technologies can be seen in biomedical engineering, like 3D printed alloy implants [5], liquid metal extrusion for coatings [6], smart manufacturing for Industry 4.0 [7], and new technologies for energy conservation [8,9].
Machine learning (ML) involves using computer algorithms and statistical models to perform a specific task without explicit instructions [10,11]. Deep learning (DL) is one of the most popular ML methods and has many applications in different areas [11,12,13,14]. DL is a class of ML algorithms that uses a cascade of multiple layers of nonlinear processing units for feature extraction and transformation [15]. Each successive layer uses the output from the previous layer as an input, allowing for learning in supervised (e.g., classification) and/or unsupervised (e.g., pattern analysis) ways. In recent years, ML has received much attention in relation to AM because of ML’s ability to help detect failure during printing while also optimizing the process [11,16,17,18]. The model of DL used in this research is the convolutional neural network (CNN), which is a class of deep neural networks. CNN is a widely used technique in image classification [16,19]. In this kind of model, convolutional layers and pooling layers are used to select the features of an image. The pooling layers do not have any learning function, they only reduce the dimensions of the feature map and reduce the computational complexity of the model.
Ensuring the quality of printed parts is a major challenge in AM processes [20]. Quality control is important and ML is a helpful solution to improve the overall performance of the part-building process [21]. In the area of ME, the monitoring of the printing process and the maintenance of the machine are equally important for getting high-quality finished parts [22]. A number of control parameters are used for obtaining good-quality parts and the cost factors associated with the adjustment of these factors are significant [23].
Today, ME is one of the most widely used AM processes with an increasing number of applications in manufacturing parts [24]. However, when failures happen during ME processes, defective parts are a concern for the industry [25]. Monitoring in-process ME conditions has been studied in the past in order to maintain smooth operating conditions [26]. For an ME printer, it is clear that trouble-free operation is an essential factor which can affect the quality of the printed parts [27].
Failure detection is a challenge in AM [27] and is worth investigating because the detection of failures helps eliminate waste material, shortens production time, and therefore saves money [27]. Failure detection is especially important in mass production, as the elimination of failures can help improve the process [28]. An ML algorithm can be used to automatically detect failed AM parts [27] and help in classifying them as good or bad [29]. In this process, a camera is used to detect and compare the printed part to the data set in order to predict whether the part will print successfully [30]. Failure detection in parts produced through AM is crucial to broadening AM industrialization [31] because of the need to reduce the process time, cost, and energy, which failure detection ensures. An examination of the current literature shows that there is a limited number of studies that have used DL for failure detection during the AM process. There is a need to do further research in this area.
The failures identified in this study essentially originate from the following conditions.
  • When the temperature in the print head is too high for the material being used, the filament becomes too viscous and watery and leaks out of the print nozzle.
  • If the nozzle is too far away from the bed, the bottom surface often shows unwanted lines, and/or the first layer does not stick, and if the nozzle is too close, blobs may be the result.
  • Ringing (or ripples or shadowing or ghosting or echoing) is a surface finish defect in 3D prints that is created by the sudden acceleration of the printer’s moving parts, and this shaking can become visible as ripples in the surface of the print, which are particularly visible next to a corner or a surface feature.
  • Layer shifting is a printing issue, which causes the layers of the printed object to shift from their intended positions, and it is usually associated with improper movement of the X-axis and/or the Y-axis, leading the extruder head to be misaligned mid-printing.
  • Warping occurs due to material shrinkage while 3D printing, which causes the corners of the print to lift and detach from the build plate, because the plastics first expands slightly and then contracts during cooldown, and if the material contracts too much, the print bends up from the build plate.

2. Materials and Methods

In this study, the DL algorithm was applied to an Ultimaker 3 3D printer (headquartered in the Netherlands) [32], and the results were analyzed. A schematic of the system is shown in Figure 1. The slicer software (Cura, developed by David Braam who was later employed by Ultimaker) and the DL algorithm (code) were installed on a laptop. Then, the digital file of the part to be 3D printed was translated into a printable instruction set via the slicer software. After this process, the g-code was generated and sent to the 3D printer, which ran the commands and extruded the material. The images of the print were taken with a GoPro (headquartered in CA, USA) camera that was held by a frame and focused on the printing plane while the part was 3D printed [33]. These images were then sent to the computer and the DL algorithm was used to classify the unfinished parts by analyzing the images based on their geometrical shape. Ideally, the 3D printing parts were classified as success or failure after each layer.
The DL algorithm was run on a Microsoft Surface Book laptop with an Intel(R) Core(TM) i7-8650U processor with installed RAM of 8.00 GB [34]. The DL algorithm was run in the R language for statistical computing and graphics [35].
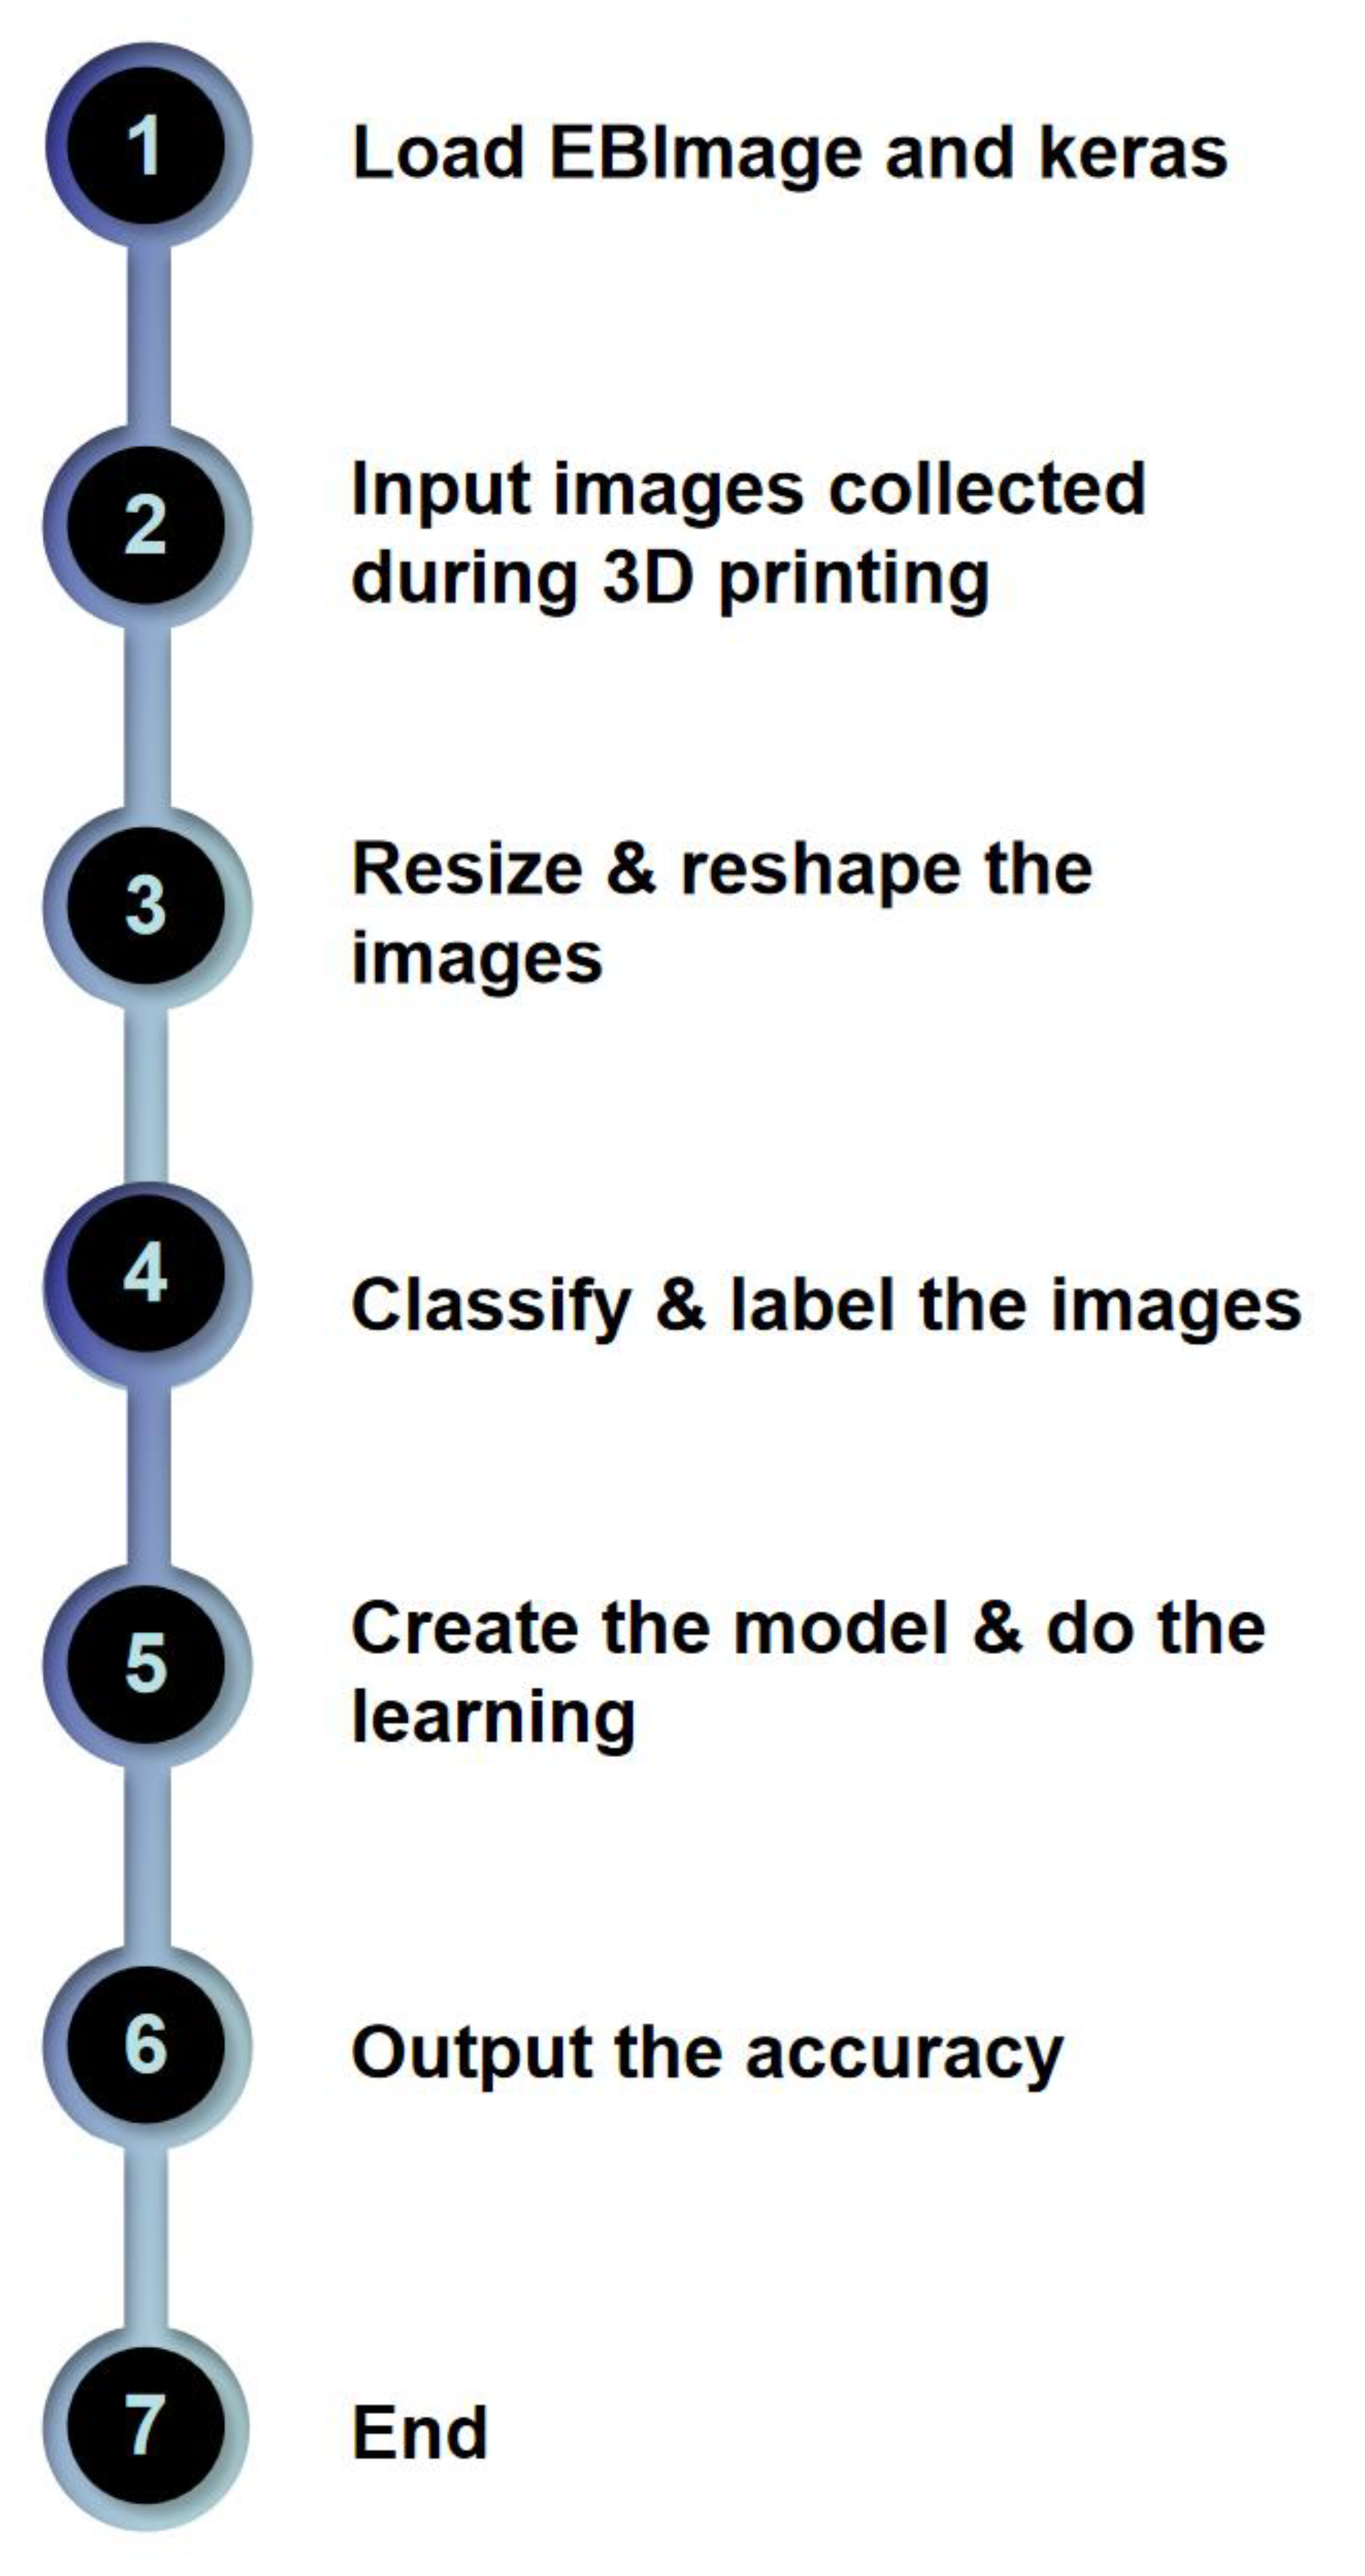
A flowchart of the code is shown in Figure 2.
As shown in Figure 2, EBImage and keras were the packages used in R to read, label, and classify the input images. CNN was the model used in this algorithm since it is widely used in image classification [19]. Accuracy and processing time data were collected to determine whether the algorithm was useful or not.
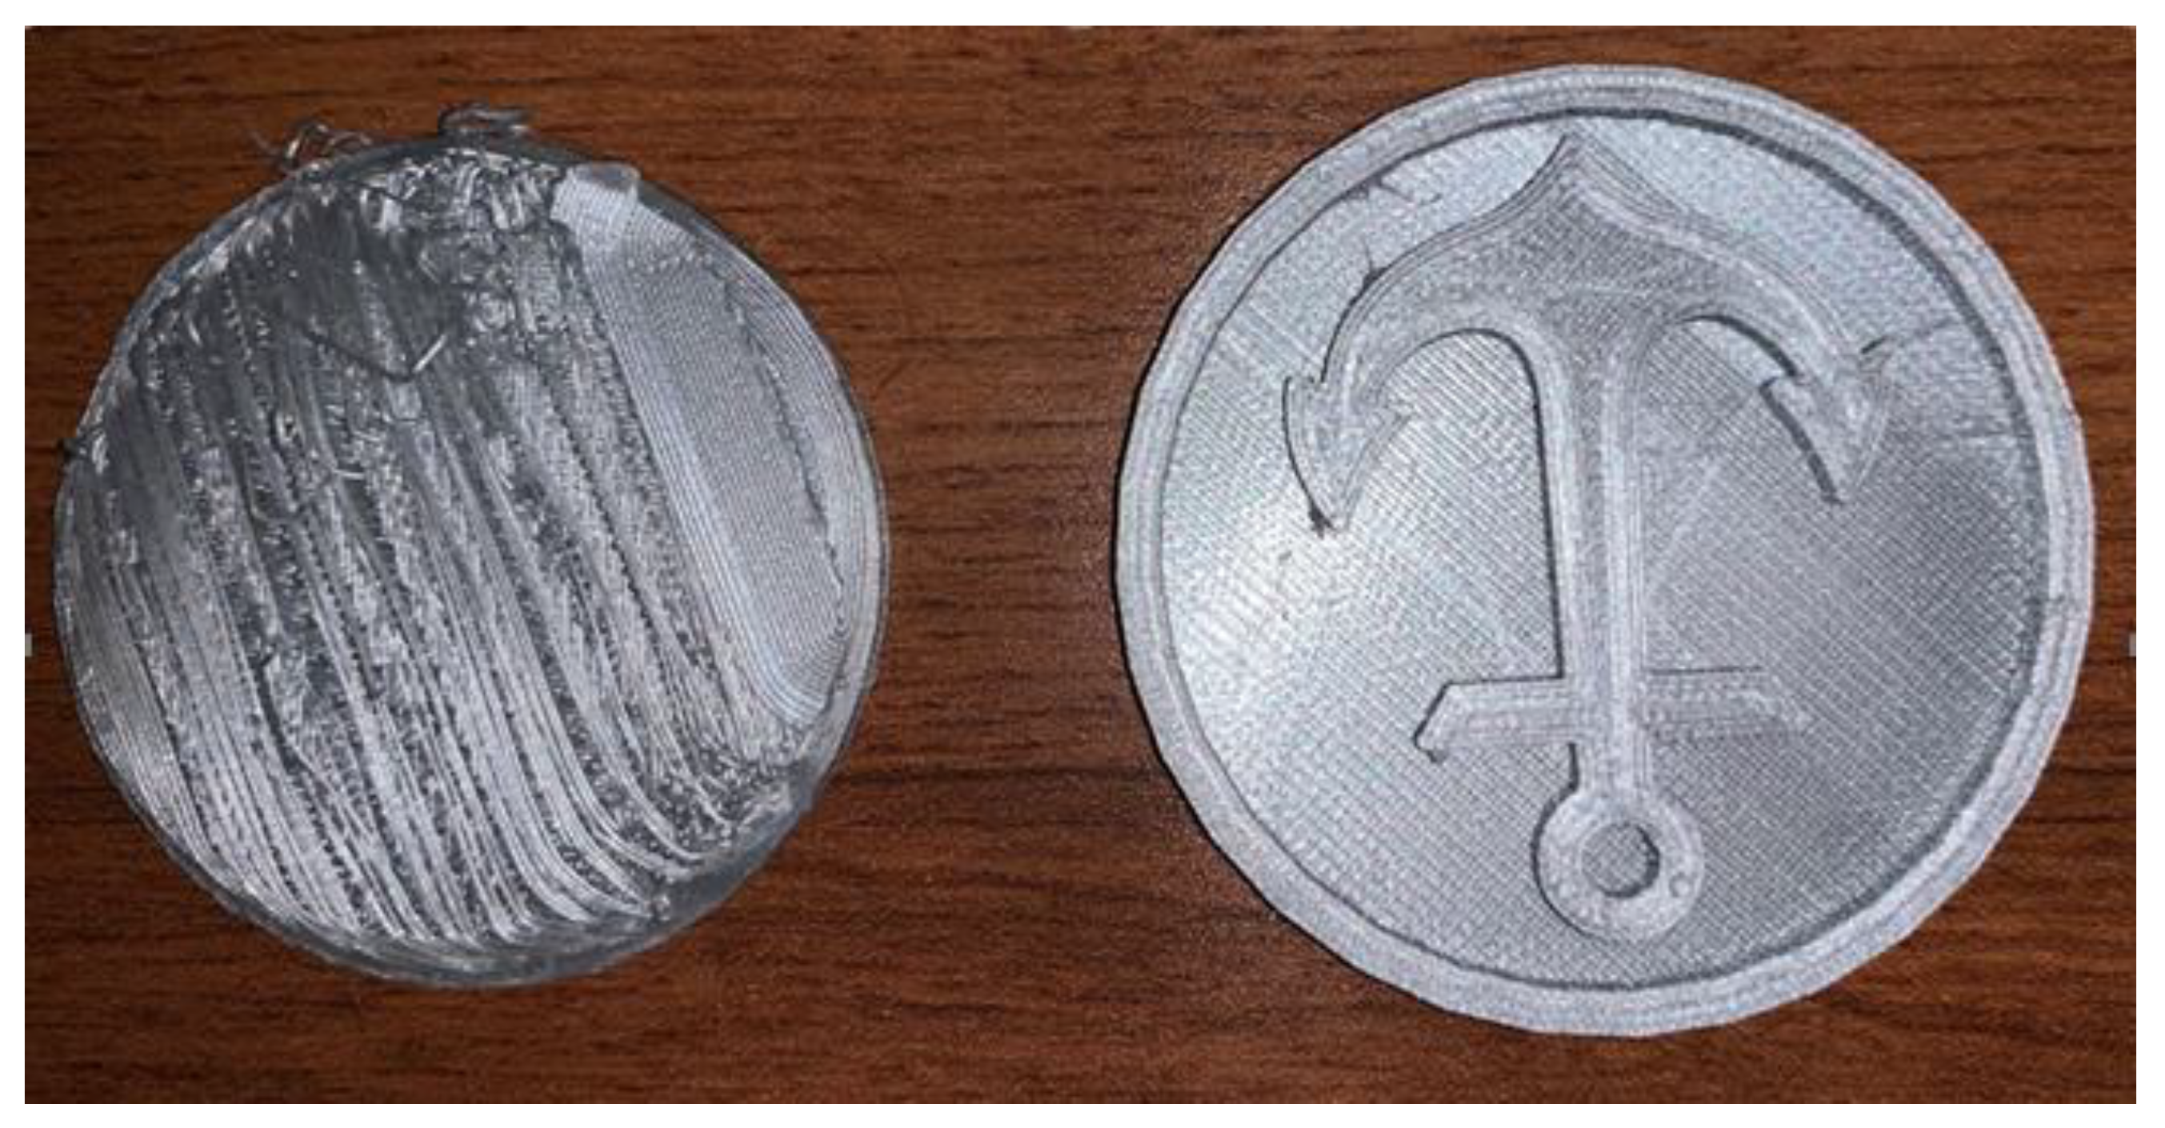
In the DL algorithm, two convolution layers were developed; after that, there was a pooling layer to reduce the complexity of the model and a dropout layer to avoid overfitting. In addition, the number of filters in each convolution layer, the number of epochs, and the number of images used in the training data were parameters under researcher control and affected the accuracy of the model (rate of correct judgements in all judgements during the training process) and processing time (time spent to do one analysis). During the model-building step, the original image was divided into smaller patches, or filtered, with the range of filters revealing more details of the image but also increasing CPU time [19]. Next, one epoch corresponded to one full read of the entire data set (all images collected by the GoPro camera) with the number of epochs again increasing CPU time [33]. In the analysis phase of the DL process, the images were classified as valid or invalid. If the image of an unfinished part was declared valid, the printing process continued; if not, the printing process paused or stopped. An example of valid and invalid images is shown in Figure 3.

3. Results

In Figure 4, the accuracy of the DL algorithm under various conditions is shown. First, an explanation of the nomenclature of the number of training points is in order. The letter g represents a valid printing process, while b represents an invalid printing process. Hence, the value 40g/40b denotes 80 images, 40 successful prints and 40 failed prints. Next, in plots 1, 2, 3, and 4 of Figure 4, the y-axis is the accuracy of the algorithm while the x-axis is the number of filters (22 to 52 filters), the number of epochs (20 to 50 epochs), the number of (training) data (80 to 200 data), and the number of (training) data (80 to 200), respectively. In each plot, the third algorithm parameter is set to a specified value. In plots 1 and 3, the number of epochs is set to 30. In plots 2 and 4, the number of filters is set to 32.
As can be seen in plot 1, with the number of epochs held at 30, there was a slight increase in the accuracy of the algorithm as the number of filters increased. Likewise, in plot 2, with the number of filters held at 32, there was an increase in the accuracy of the DL algorithm. Plots 3 and 4 show no significant increase in accuracy with an increase in the number of data. The research group focused on the relationship between accuracy and number of data since as the number of data increased, the time increased. If the algorithm takes too much time, the total printing time will be prolonged, which is not economical.
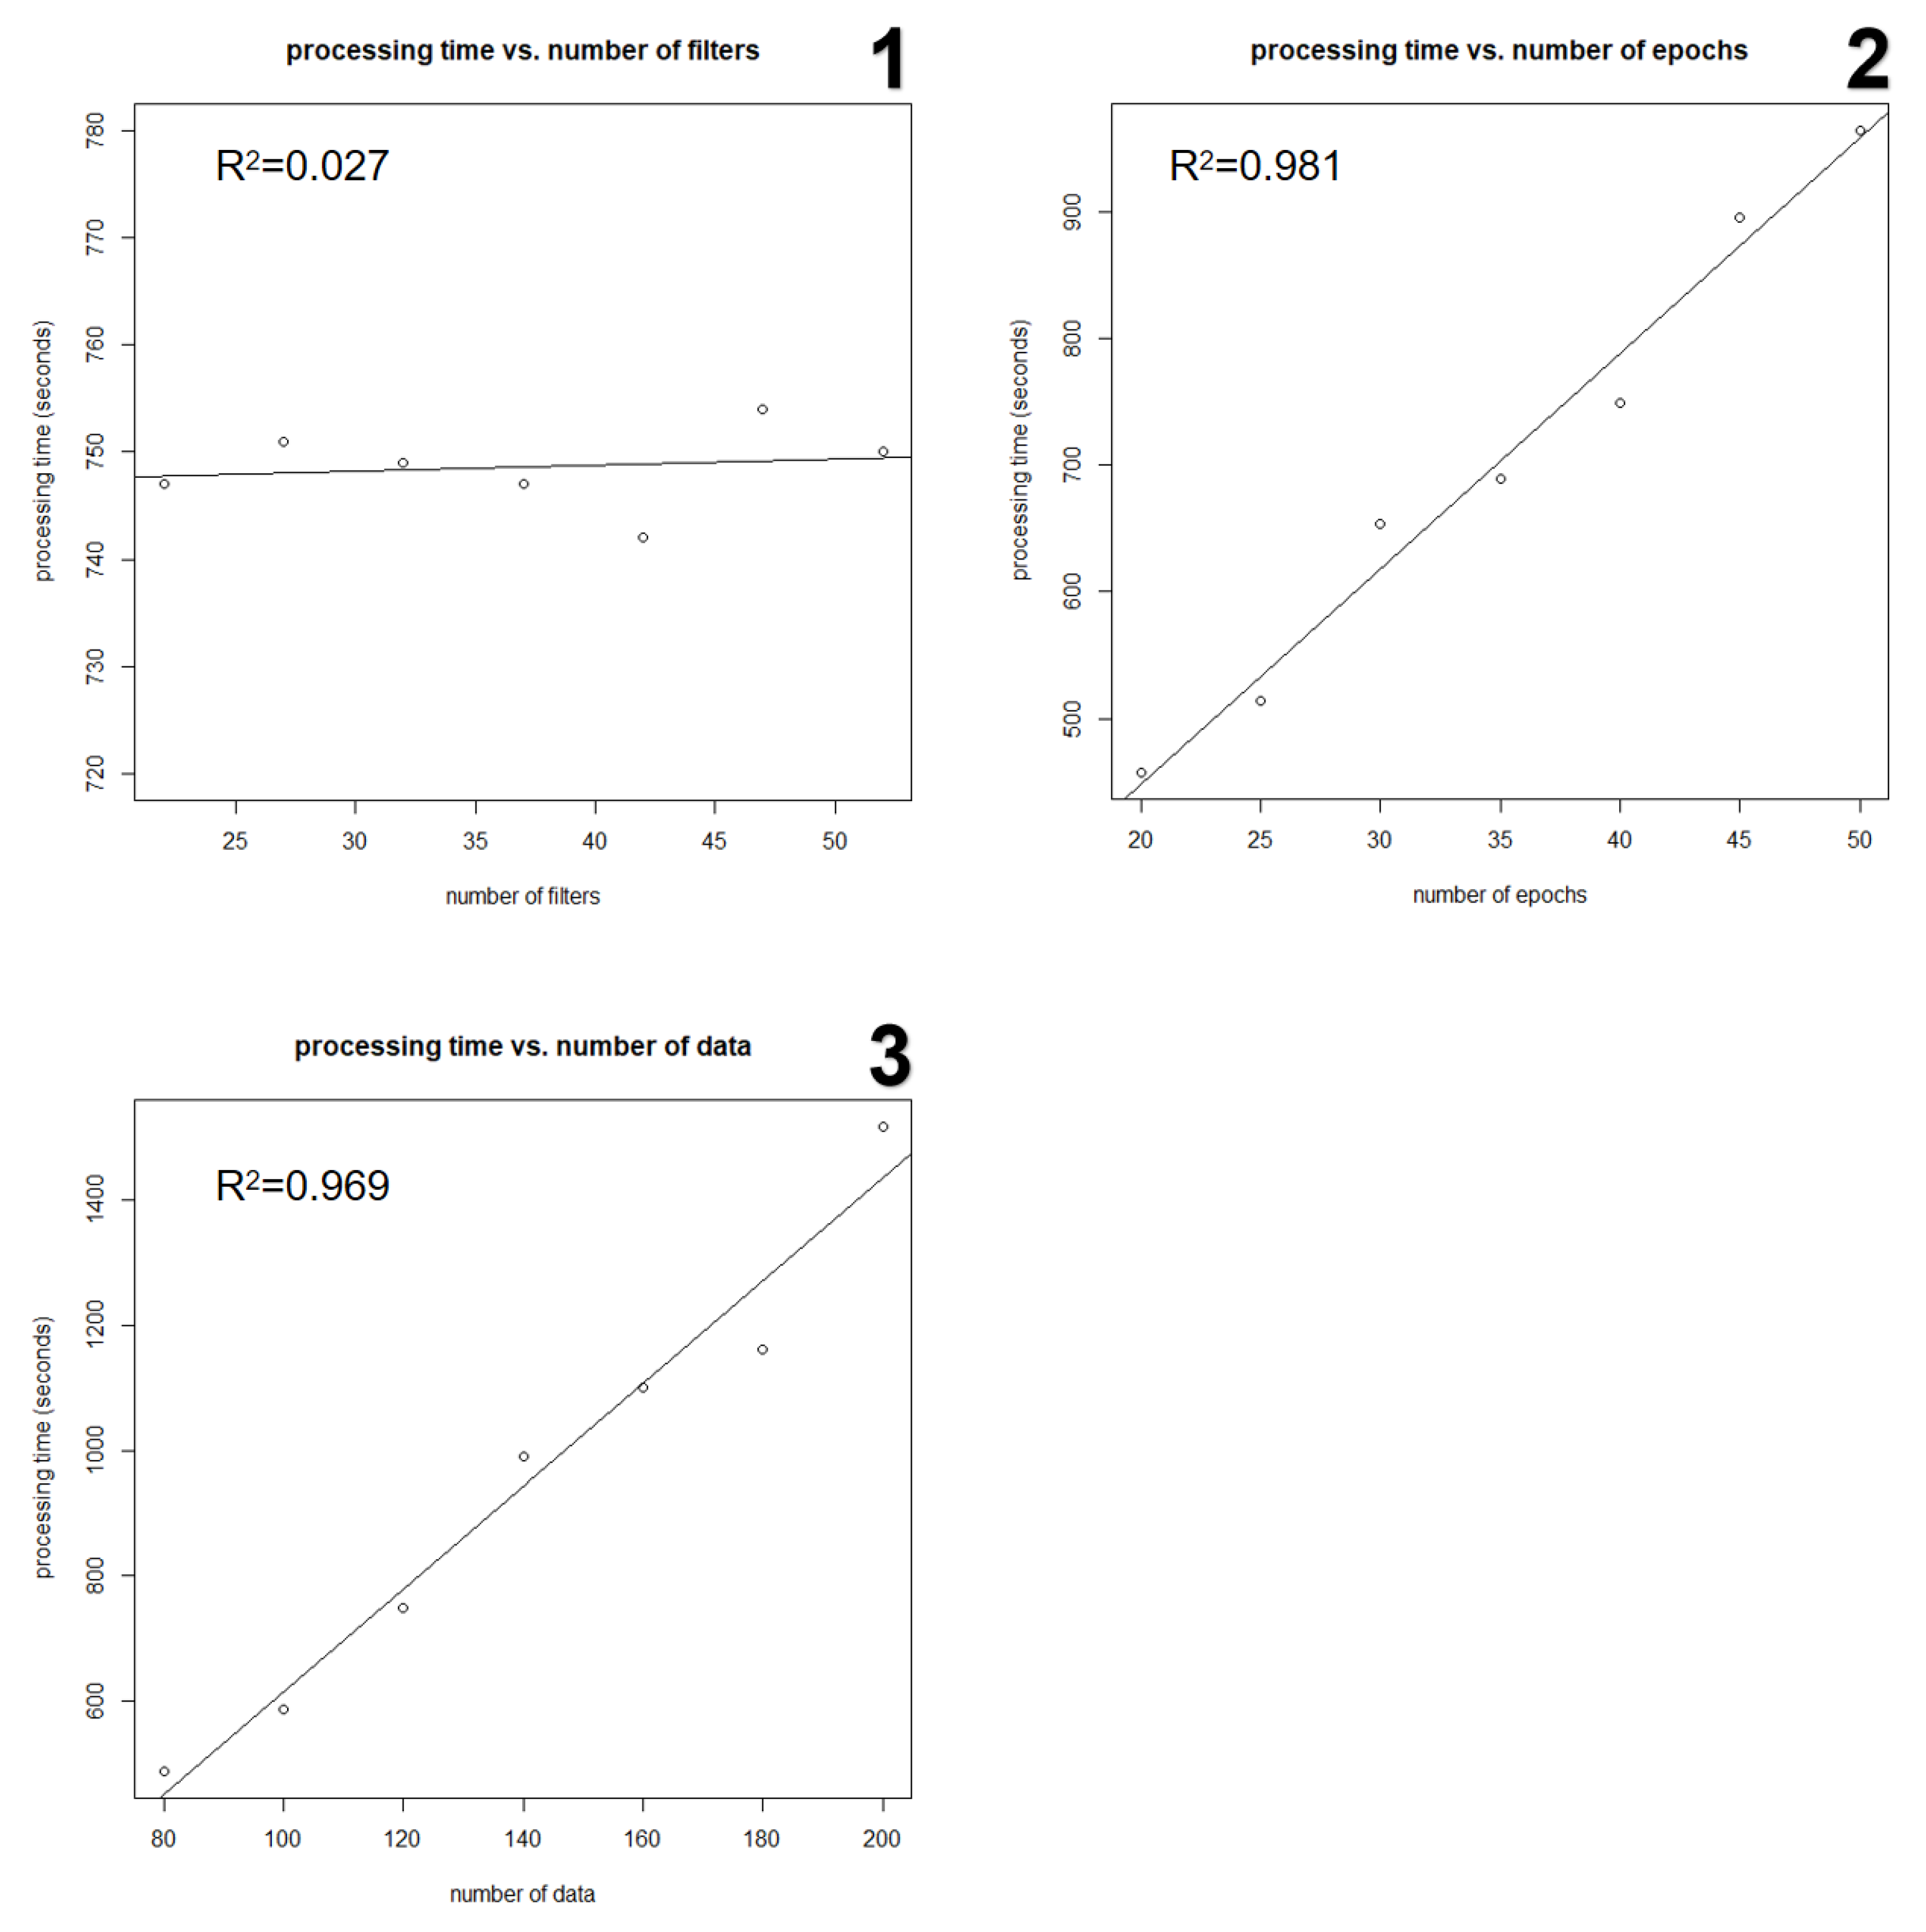
Next, the plots in Figure 5 show the linear relationships between processing time and the DL algorithm parameters. The correlation coefficient is also given to show the strength of the linearity. As can be seen in plots 2 and 3, processing time increased significantly with the number of data (R2 = 0.981) and the number of epochs (R2 = 0.969). Plot 1 shows that there was no relationship between processing speed and the number of filters (R2 = 0.027).

4. Discussion

From the previous results regarding accuracy and processing time, there exist obvious relationships between accuracy and the number of filters and epochs but not between accuracy and the number of data. Likewise, there are definite linear relationships between the algorithm processing speed and the number of epochs and data, but not between processing speed and the number of filters.
Based on these results, if a researcher wants the best accuracy without regards to processing time, they should set the number of filters to 52 and the number of epochs to 50. The 3D printer can be set to pause while the algorithm finishes processing the latest image. However, if the researcher needs the processing speed to be as quick as possible and the accuracy as good as possible, the number of filters can still be set to 52 with the number of epochs set to 40 and the number of data set to 80. To understand why 40 was chosen for the number of epochs, in plot 2 of Figure 4 the accuracy of the algorithm appears to find an equilibrium at 40.

5. Conclusions

In this project, a deep learning algorithm was implemented that would detect failure in a 3D printing process by categorizing the latest photo of an unfinished 3D printed part. In the DL algorithm, the number of filters in each convolution layer, number of epochs, and the number of images used in the training data were the parameters under research control and affected the accuracy of the model and processing time.
A number of conclusions can be drawn from this research study. As the number of epochs, data, and filters is increased, the accuracy always presents an increasing trend. As a result, adding more epochs, filters and data into the algorithm will lead to better accuracy. As for the processing time, it appears that this will remain constant for the range of filters used in this research, but further experimentation is needed. However, when the number of epochs and data is increased, the processing time increases too. Overall, the data analysis process will take plenty of time if we use a huge number of epochs and data. Therefore, a suitable number of epochs and data should be found to obtain a balance between high accuracy and shorter processing time.
The overall average accuracy of this method is 0.7, which shows that most failures during the printing process can be detected by this algorithm, thus helping to eliminate waste generated by unsupervised invalid part printing. The DL application developed in this project can help the manufacturers save energy, time, and money during the ME printing process.
Also, this research shows that by changing the number of epochs, filters, and data, higher accuracy or a shorter processing time can be achieved. Manufacturers have the ability to boost accuracy and thus save even more waste, but such parameter changes do come at a cost of processing speed.
In the future, the research could be extended to obtain higher accuracy by increasing the number of epochs. Thus, more failures would be detected. However, more epochs lead to longer processing times. With such an intensive processing requirement, it is recommended that further experimentation be done using a computer with a faster processor or a parallel processing cluster.

Author Contributions

Conceptualization, Z.Z.; methodology, Z.Z.; validation, Z.Z.; formal analysis, Z.Z.; investigation, Z.Z.; resources, Z.Z.; data curation, M.A.; writing—original draft preparation, Z.Z., I.F.; writing—review and editing, I.F., M.A.; supervision, I.F., M.A.; project administration, I.F. All authors have read and agreed to the published version of the manuscript.

Funding

This research received no external funding.

Acknowledgments

The technical and editorial support provided by Mahmoud Nabil, Mahdi Mohammadizadeh, and Amy Hill is greatly appreciated.

Conflicts of Interest

The authors declare no conflict of interest.

References

  1. Wong, K.V.; Hernandez, A. A review of additive manufacturing. ISRN Mech. Eng. 2012, 2012, 208760. [Google Scholar] [CrossRef] [Green Version]
  2. Weller, C.; Kleer, R.; Piller, F.T. Economic implications of 3D printing: Market structure models in light of additive manufacturing revisited. Int. J. Prod. Econ. 2015, 164, 43–56. [Google Scholar] [CrossRef]
  3. Gibson, I.; Rosen, D.W.; Stucker, B. Additive Manufacturing Technologies; Springer: New York, NY, USA, 2014; Volume 17. [Google Scholar]
  4. Redwood, B. Additive Manufacturing Technologies: An Overview. Available online: https://www.3dhubs.com/knowledge-base/additive-manufacturing-technologies-overview. (accessed on 6 May 2020).
  5. Dehghanghadikolaei, A.; Ibrahim, H.; Amerinatanzi, A.; Hashemi, M.; Moghaddam, N.S.; Elahinia, M. Improving corrosion resistance of additively manufactured nickel–titanium biomedical devices by micro-arc oxidation process. J. Mater. Sci. 2019, 54, 7333–7355. [Google Scholar] [CrossRef]
  6. Gannarapu, A.; Gozen, B.A. Micro-extrusion-based additive manufacturing with liquid metals and alloys: Flow and deposition driven by oxide skin mechanics. Extreme Mech. Lett. 2019, 33, 100554. [Google Scholar] [CrossRef]
  7. Mehrpouya, M.; Dehghanghadikolaei, A.; Fotovvati, B.; Vosooghnia, A.; Emamian, S.S.; Gisario, A. The potential of additive manufacturing in the smart factory industrial 4.0: A review. Appl. Sci. 2019, 9, 3865. [Google Scholar] [CrossRef] [Green Version]
  8. Terry, S.; Lu, H.; Fidan, I.; Zhang, Y.; Tantawi, K.; Guo, T.; Asiabanpour, B. The Influence of Smart Manufacturing towards Energy Conservation: A Review. Technologies 2020, 8, 31. [Google Scholar] [CrossRef]
  9. Fidan, I.; Imeri, A.; Gupta, A.; Hasanov, S.; Nasirov, A.; Elliott, A.; Alifui-Segbaya, F.; Nanami, N. The trends and challenges of fiber reinforced additive manufacturing. Int. J. Adv. Manuf. Technol. 2019, 102, 1801–1818. [Google Scholar] [CrossRef]
  10. Mohri, M.; Rostamizadeh, A.; Talwalkar, A. Foundations of Machine Learning; MIT Press: Cambridge, MA, USA, 2018. [Google Scholar]
  11. Zhang, Z. Detection of the Additive Manufacturing In-Process Failures via Deep Learning. Master’s Thesis, Tennessee Technological University, Cookeville, TN, USA, August 2019. [Google Scholar]
  12. Ching, T.; Himmelstein, D.S.; Beaulieu-Jones, B.K.; Kalinin, A.A.; Do, B.T.; Way, G.P.; Ferrero, E.; Agapow, P.M.; Zietz, M.; Hoffman, M.M.; et al. Opportunities and obstacles for deep learning in biology and medicine. J. R. Soc. Interf. 2018, 15, 20170387. [Google Scholar] [CrossRef] [Green Version]
  13. Najafabadi, M.M.; Villanustre, F.; Khoshgoftaar, T.M.; Seliya, N.; Wald, R.; Muharemagic, E. Deep learning applications and challenges in big data analytics. J. Big Data 2015, 2, 1. [Google Scholar] [CrossRef] [Green Version]
  14. Mamoshina, P.; Vieira, A.; Putin, E.; Zhavoronkove, A. Applications of deep learning in biomedicine. Mol. Pharm. 2016, 13, 1445–1454. [Google Scholar] [CrossRef]
  15. Deng, L.; Yu, D. Deep learning: Methods and applications. Found. Trends Signal Process. 2014, 7, 197–387. [Google Scholar] [CrossRef] [Green Version]
  16. Khanzadeh, M.; Rao, P.; Jafari-Marandi, R.; Smith, B.K.; Tschopp, M.A.; Bian, L. Quantifying geometric accuracy with unsupervised machine learning: Using self-organizing map on fused filament fabrication additive manufacturing parts. J. Manuf. Sci. Eng. 2018, 140, 031011. [Google Scholar] [CrossRef] [Green Version]
  17. Baumann, F.; Roller, D. Vision based error detection for 3D printing processes. MATEC Web Conf. 2016, 591, 1–7. [Google Scholar] [CrossRef]
  18. Delli, U.; Chang, S. Automated process monitoring in 3D printing using supervised machine learning. Procedia Manuf. 2018, 26, 865–870. [Google Scholar] [CrossRef]
  19. Krizhevsky, A.; Sutskever, I.; Hinton, G.E. Imagenet classification with deep convolutional neural networks. Adv. Neural Inf. Process. Syst. 2012, 25, 1097–1105. [Google Scholar] [CrossRef]
  20. Liu, C.; Law, A.C.C.; Roberson, D.; Kong, Z.J. Image analysis-based closed loop quality control for additive manufacturing with fused filament fabrication. J. Manuf. Syst. 2019, 51, 75–86. [Google Scholar] [CrossRef]
  21. Gardner, J.M.; Hunt, K.A.; Ebel, A.B.; Rose, E.S.; Zylich, S.C.; Jensen, B.D.; Wise, K.E.; Siochi, E.J.; Sauti, G. Machines as Craftsmen: Localized Parameter Setting Optimization for Fused Filament Fabrication 3D Printing. Adv. Mater. Technol. 2019, 4, 1800653. [Google Scholar] [CrossRef] [Green Version]
  22. Li, Y.; Zhao, W.; Li, Q.; Wang, T.; Wang, G. In-Situ Monitoring and Diagnosing for Fused Filament Fabrication Process Based on Vibration Sensors. Sensors 2019, 19, 2589. [Google Scholar] [CrossRef] [PubMed] [Green Version]
  23. Salmi, M.; Ituarte, I.F.; Chekurov, S.; Houtilainen, E. Effect of build orientation in 3D printing production for material extrusion, material jetting, binder jetting, sheet object lamination, vat photopolymerisation, and powder bed fusion. Int. J. Collab. Enterp. 2016, 5, 218–231. [Google Scholar] [CrossRef]
  24. Turner, B.N.; Strong, R.; Gold, S.A. A review of melt extrusion additive manufacturing processes: I. Process design and modeling. Rapid Prototyp. J. 2014, 20, 192–204. [Google Scholar] [CrossRef]
  25. Wayne, W.M.; Rowell, M.; Deason, B.; Eubanks, M. Comparative evaluation of an open-source FDM system. Rapid Prototyp. J. 2014, 20, 205–214. [Google Scholar]
  26. Zhang, S.; Sun, Z.; Long, J.; Li, C.; Bai, Y. Dynamic condition monitoring for 3D printers by using error fusion of multiple sparse auto-encoders. Comput. Ind. 2019, 105, 164–176. [Google Scholar] [CrossRef]
  27. He, K.; Yang, Z.; Bai, Y.; Long, J.; Li, C. Intelligent fault diagnosis of delta 3D printers using attitude sensors based on support vector machines. Sensors 2018, 18, 1298. [Google Scholar] [CrossRef] [Green Version]
  28. Faes, M.; Abbeloos, W.; Vogeler, F.; Valkenaers, H.; Coppens, K.; Goedemé, T.; Ferraris, E. Process monitoring of extrusion based 3D printing via laser scanning. arXiv 2016, arXiv:1612.02219. [Google Scholar]
  29. Sirinukunwattana, K.; Raza, S.A.; Tsang, Y.-W.; Snead, D.R.J.; Cree, I.A.; Rajpoot, N.M. Locality sensitive deep learning for detection and classification of nuclei in routine colon cancer histology images. IEEE Trans. Med. Imag. 2016, 35, 1196–1206. [Google Scholar] [CrossRef] [Green Version]
  30. Wu, M.; Song, Z.; Moon, Y.B. Detecting cyber-physical attacks in CyberManufacturing systems with machine learning methods. J. Intell. Manuf. 2019, 30, 1111–1123. [Google Scholar] [CrossRef]
  31. Ahuja, B.; Karg, M.; Schmidt, M. Additive Manufacturing in Production: Challenges and Opportunities. Laser 3D Manufacturing II. Int. Soc. Optics Photonics 2015, 9353. [Google Scholar] [CrossRef]
  32. Ultimaker 3 Manual (EN).pdf. Available online: https://ultimaker.com/download/61355/Ultimaker%203%20manual%20%28EN%29.pdf (accessed on 6 May 2020).
  33. UM_HEROPlus_ENG_REVA_WEB.pdf. Available online: https://gopro.com/content/dam/help/heroplus/manuals/UM_HEROPlus_ENG_REVA_WEB.pdf (accessed on 6 May 2020).
  34. Surface-Book-User-Guide-EN.pdf. Available online: https://download.microsoft.com/download/7/B/1/7B10C82E-F520-4080-8516-5CF0D803EEE0/surface-book-user-guide-EN.pdf (accessed on 6 May 2020).
  35. What is R? Available online: https://www.r-project.org/about.html. (accessed on 6 May 2020).
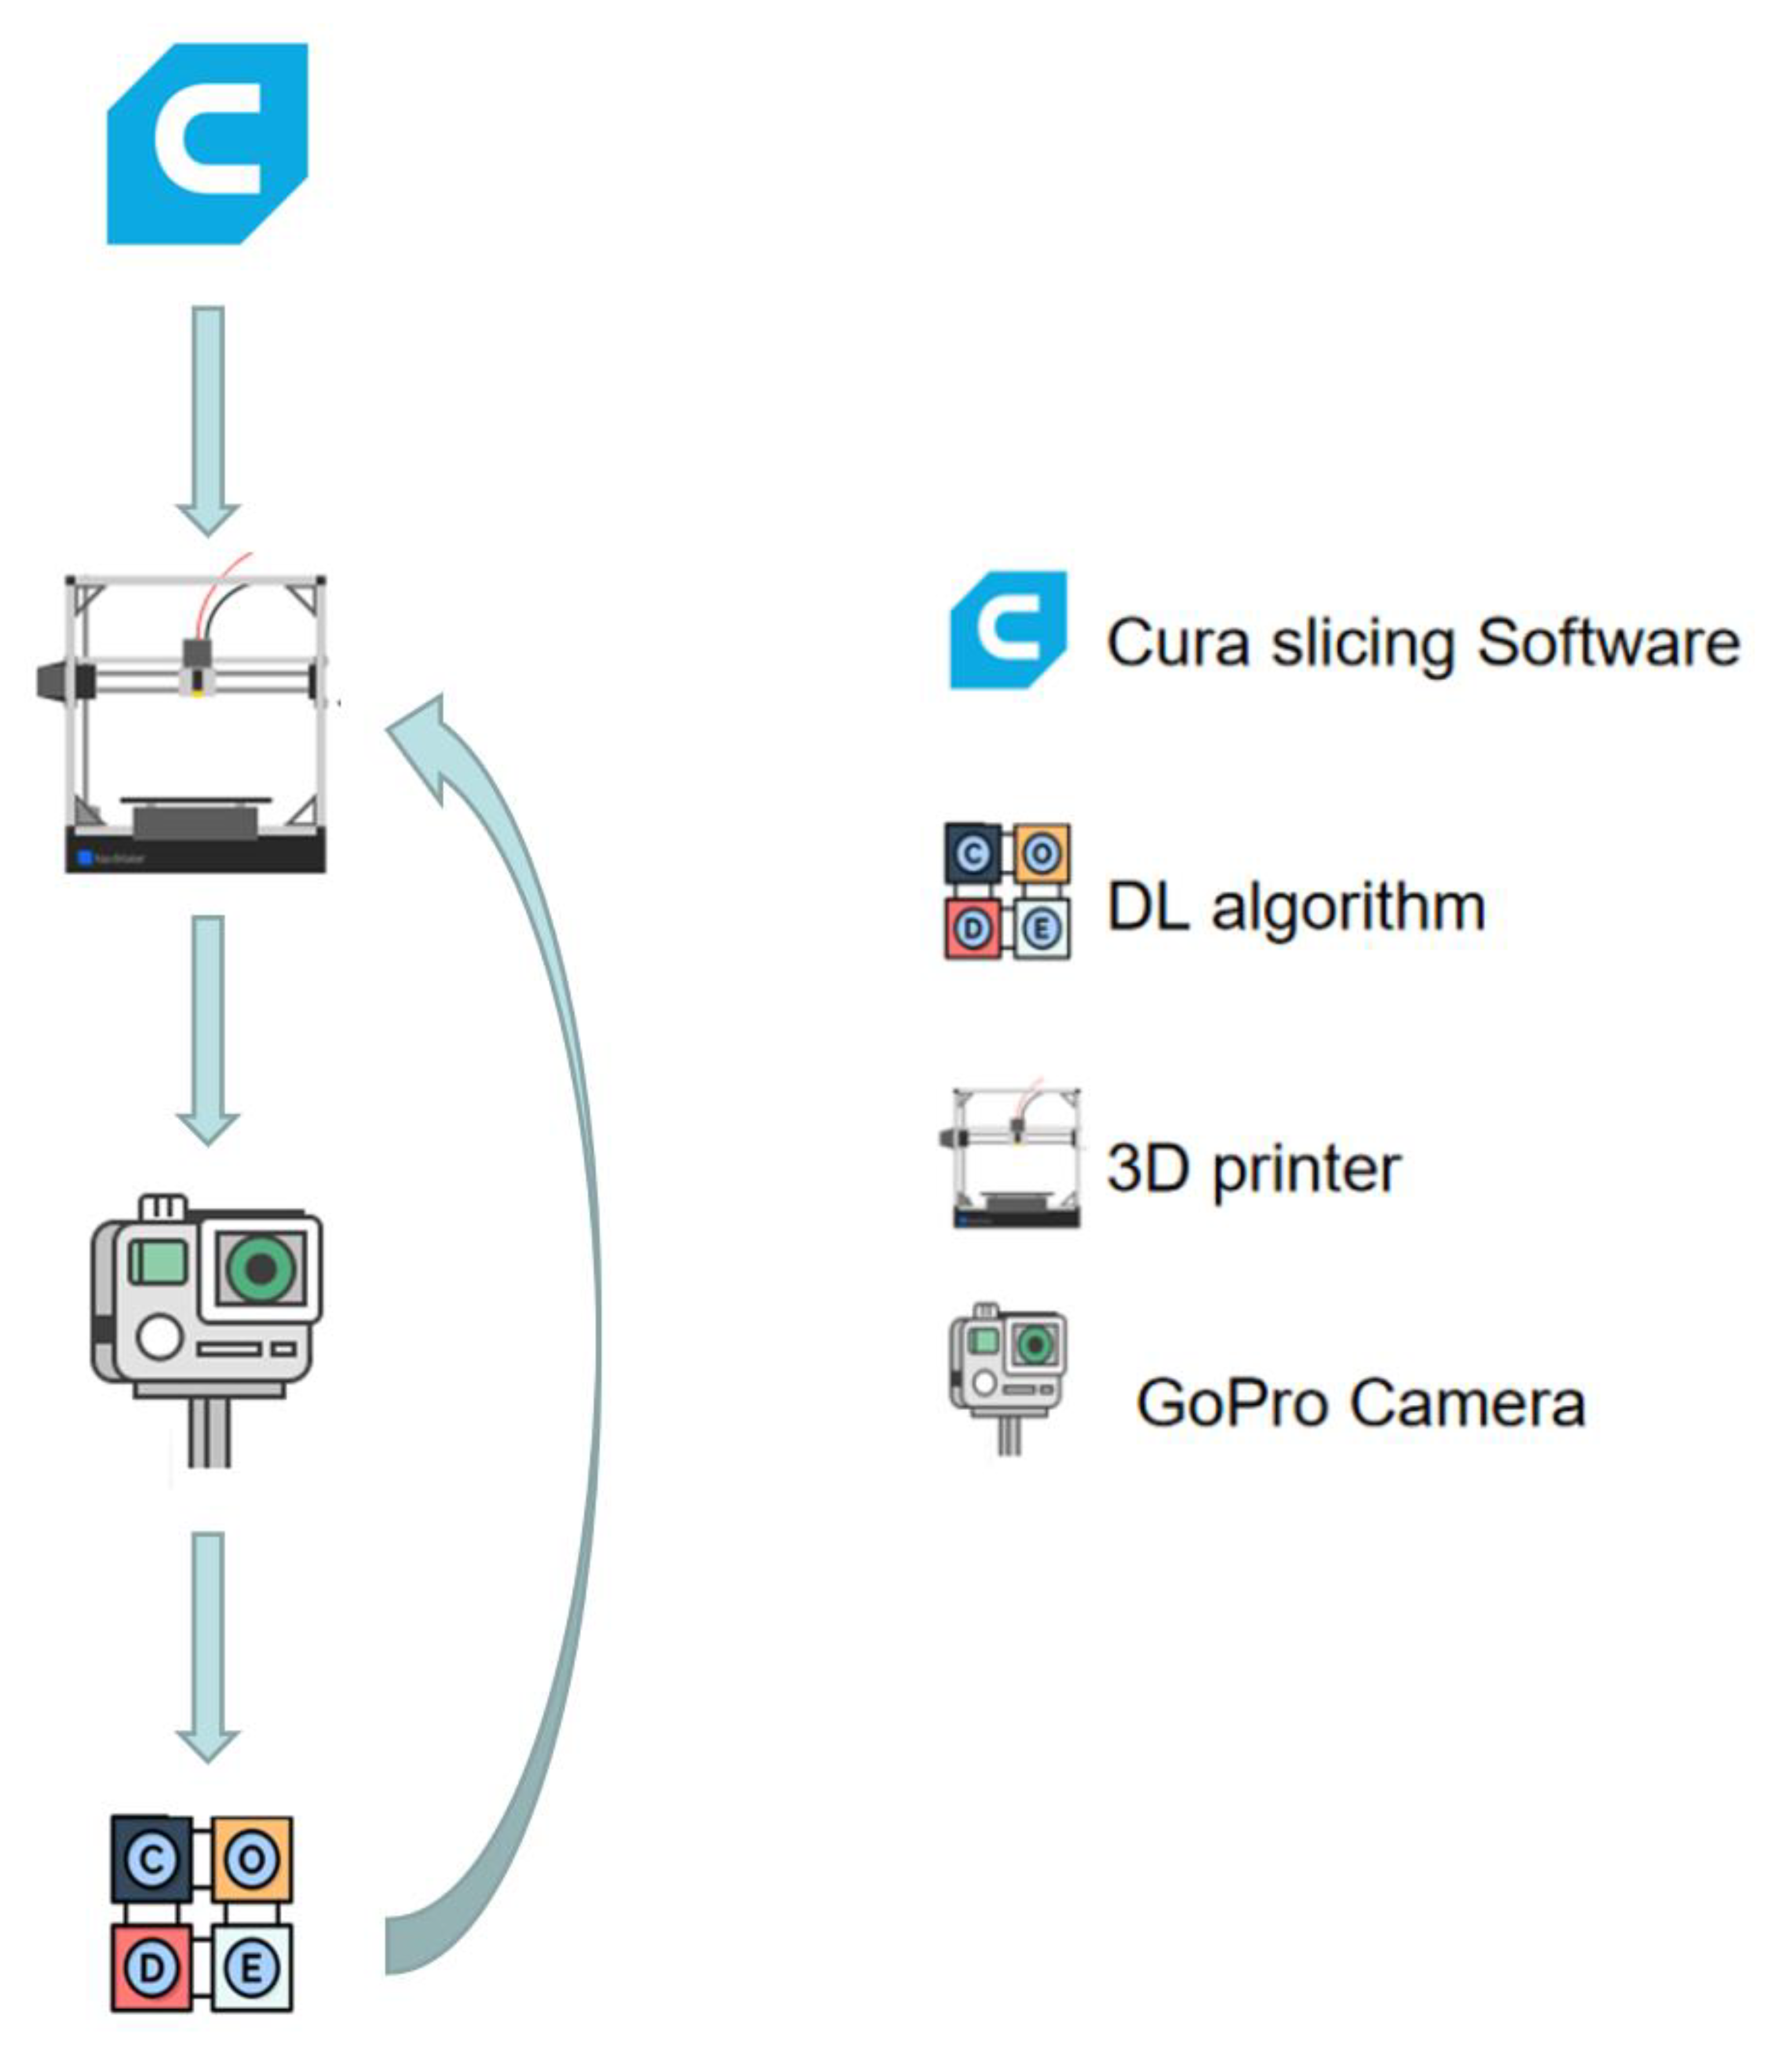
Figure 1. Schematic of the system. Abbreviations: DL, deep learning; 3D, three-dimensional.
Inventions 05 00025 g001
Figure 2. Structure of the code created in this research.
Inventions 05 00025 g002
Figure 3. Example of valid and invalid printed parts.
Inventions 05 00025 g003
Figure 4. Changes of accuracy based on different numbers of parameters: Plot 1, Changes of accuracy based on different numbers of filters with constant 30 epochs; Plot 2, Changes of accuracy based on different numbers of epochs with constant 32 filters; Plot 3, Changes of accuracy based on different numbers of data with constant 30 epochs; Plot 4, Changes of accuracy based on different numbers of data with constant 32 filters.
Inventions 05 00025 g004
Figure 5. Changes of processing time based on different numbers of parameters: Plot 1, Changes of processing time based on different numbers of filters; Plot 2, Changes of processing time based on different numbers of epochs; Plot 3, Changes of processing time based on different numbers of data.
Inventions 05 00025 g005