1. Introduction
Nowadays, the development of marine renewable energy sector is at its take-off point. Tidal energy is one of the resources which, due to its nature, is at the first position to be highly exploited. Despite this, as it can be for other renewable energy resources, a main disadvantage of using such resource concern variability [
1,
2]. Nevertheless, contrarily to other renewable energy resources, tidal energy is cyclical and predictable. In fact, tidal energy output can be characterized by different harmonic components; these determine cyclical variations between high, low and nil power output values.
Not many cost effective solutions exist to deal with renewable energy sources variability and intermittency. Conventional energy storage systems are often not suitable to handle large amounts of renewable power produced and these normally are expensive. At the present time, frequently the renewable energy produced is directly delivered into the electricity network and no energy storage system is available. But as the renewable energy share is rapidly increasing, the electricity network infrastructure in many cases cannot deal with the high input of power [
3]. In various locations, due to economics and resources available, coupling a tidal power with energy storage plants could reasonably reduce the final local cost of energy and also provide economic advantages. Therefore, by linking a tidal plant with a storage utility, community-wide benefits would occur. These, for instance, may regard energy self-sufficiency matters and profits from possible export of the locally produced energy.
A limited number of studies were carried out focusing on general aspects concerning applying tidal power for coastal settlements [
4,
5]. Further studies were dedicated to the specific topic about short-term energy storage with tidal power plants [
6,
7,
8]. In Canada, researchers studied a way for increasing renewable energy production with tidal power by developing an energy storage system [
9]. Differently, in the UK, an earlier study focused on energy storage in the context of a tidal barrage [
7]. More recently, the improvement of the short-term inherent energy storage of tidal farms in channels by varying somehow the farms’ drag coefficients, were also discussed [
8].
Few projects concerning energy storage generated from tidal power have recently begun. An energy storage project based on hydrogen production from tidal power has been initialized in the Orkney Islands by the European Marine Energy Centre (EMEC) [
10]. The purpose of the plant is to use the tidal energy to produce hydrogen when the electrical network cannot absorb the excess power from tidal turbines. Similarly, a company based on the Shetland Islands developed a project regarding the integration of a tidal farm with a battery storage utility for allowing delivery baseload power to the community exclusively from the tidal energy resource [
11].
In general, for remote communities located in areas where tidal power resources are abundant, it is crucial to find practical solutions to deal with tidal power variability. A number of possible energy storage technologies can be used to balance the tidal power output. Energy can be stored in form of mechanical, chemical or thermal energy. For what concerns electricity, storage techniques can be divided into four categories: low power applications; medium power application; network connection applications with peak levelling; and power control applications [
2].
Existing energy storage technologies vary from simple pumped hydro storage to high-tech hydrogen production systems. Obviously, every type of technology has its advantages and its disadvantages; while complex methods such as hydrogen or flow batteries energy storage systems are very expensive to be developed, mechanical energy storage methods in certain contexts may be a more cost-effective option but often involve technical challenges.
Another type of energy storage technology is thermal energy. Nowadays, thermal energy storage is mostly applied to solar thermal power plants. An example is the 50 MW power station named Andasol 1 in Spain. Also, when for eight hours there is no direct sun radiation at the power plant, thanks to 28,000 metric tons of hot molten salt, constant power output from the station is guaranteed [
12]. Energy storage facilities can be used for storing energy for different scales of time. Most common cases concern energy storages that are designed to store energy for relatively short periods, e.g., a few hours. On the other hand, there are also other kinds of long period thermal storages that are capable of storing heat for entire seasons. This refers to seasonal thermal stores [
13].
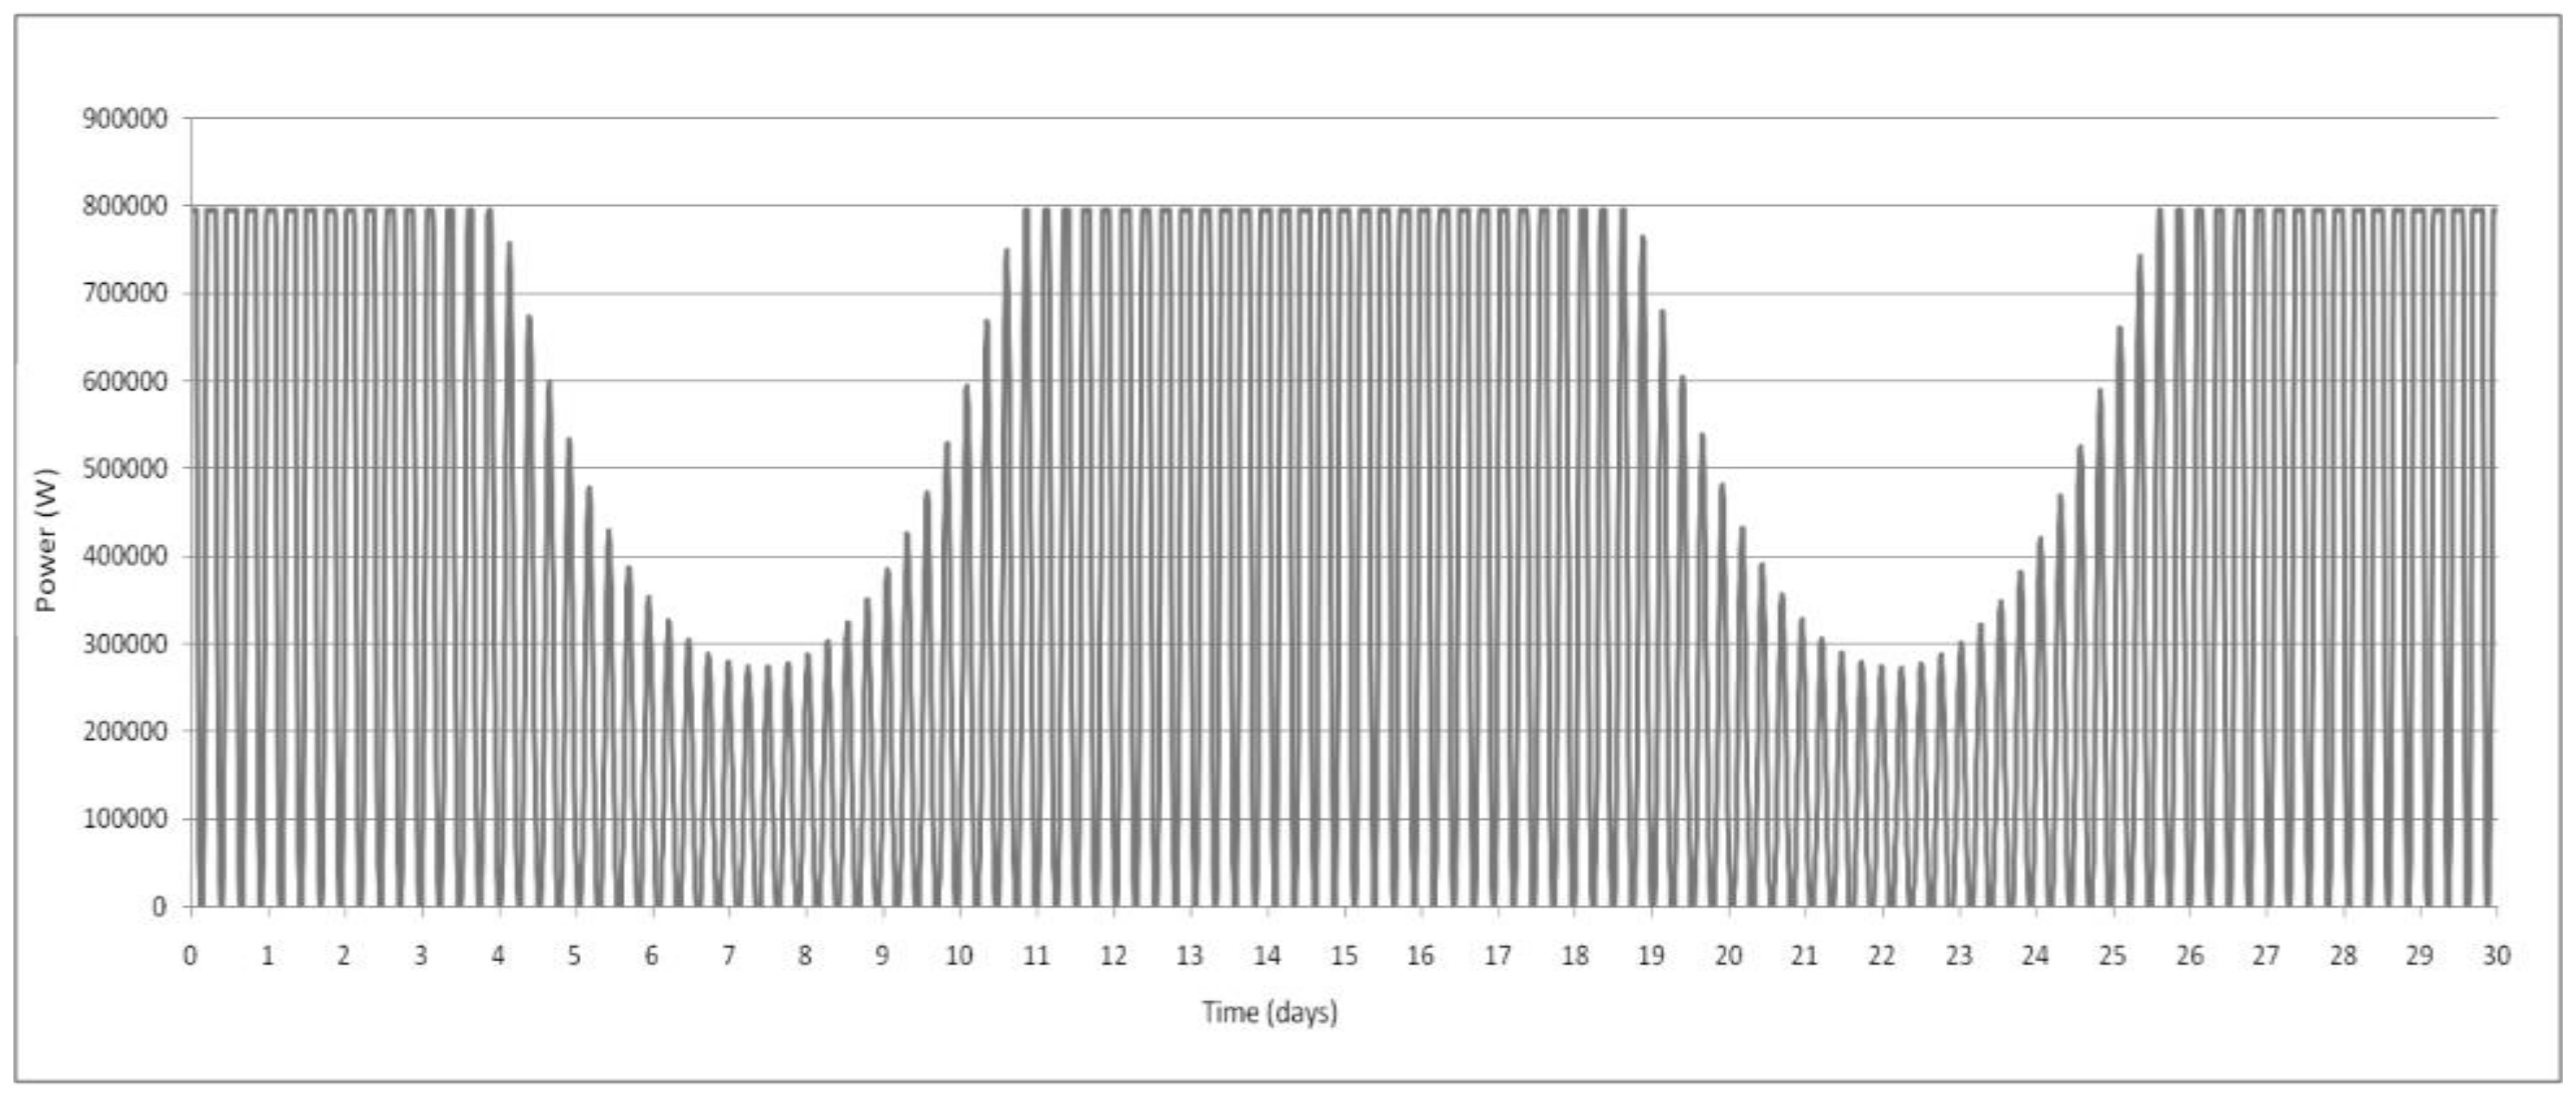
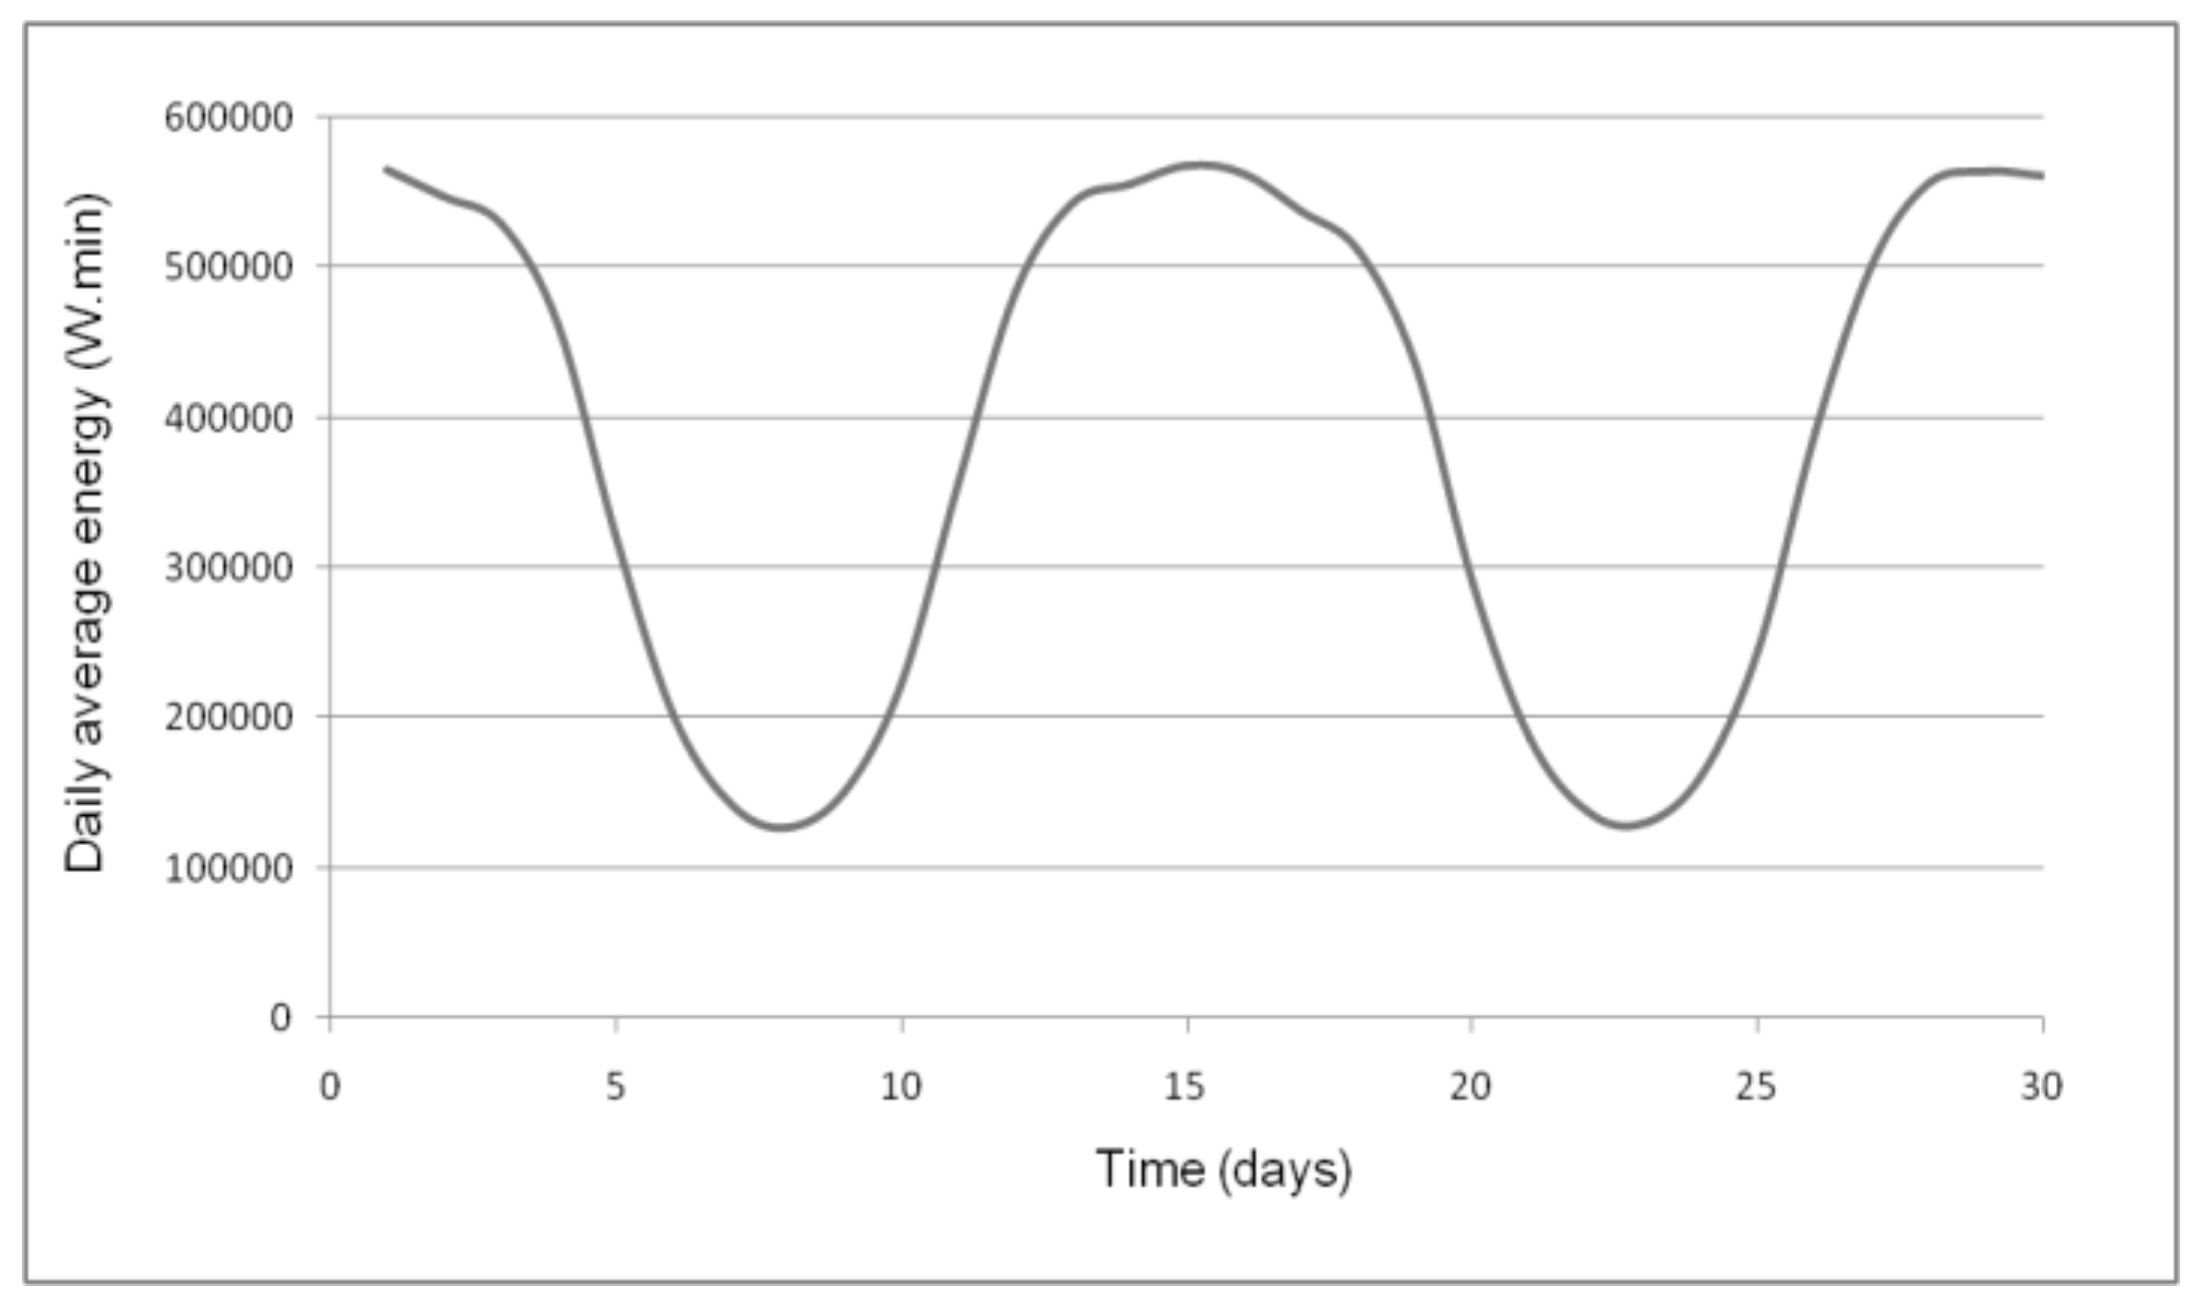
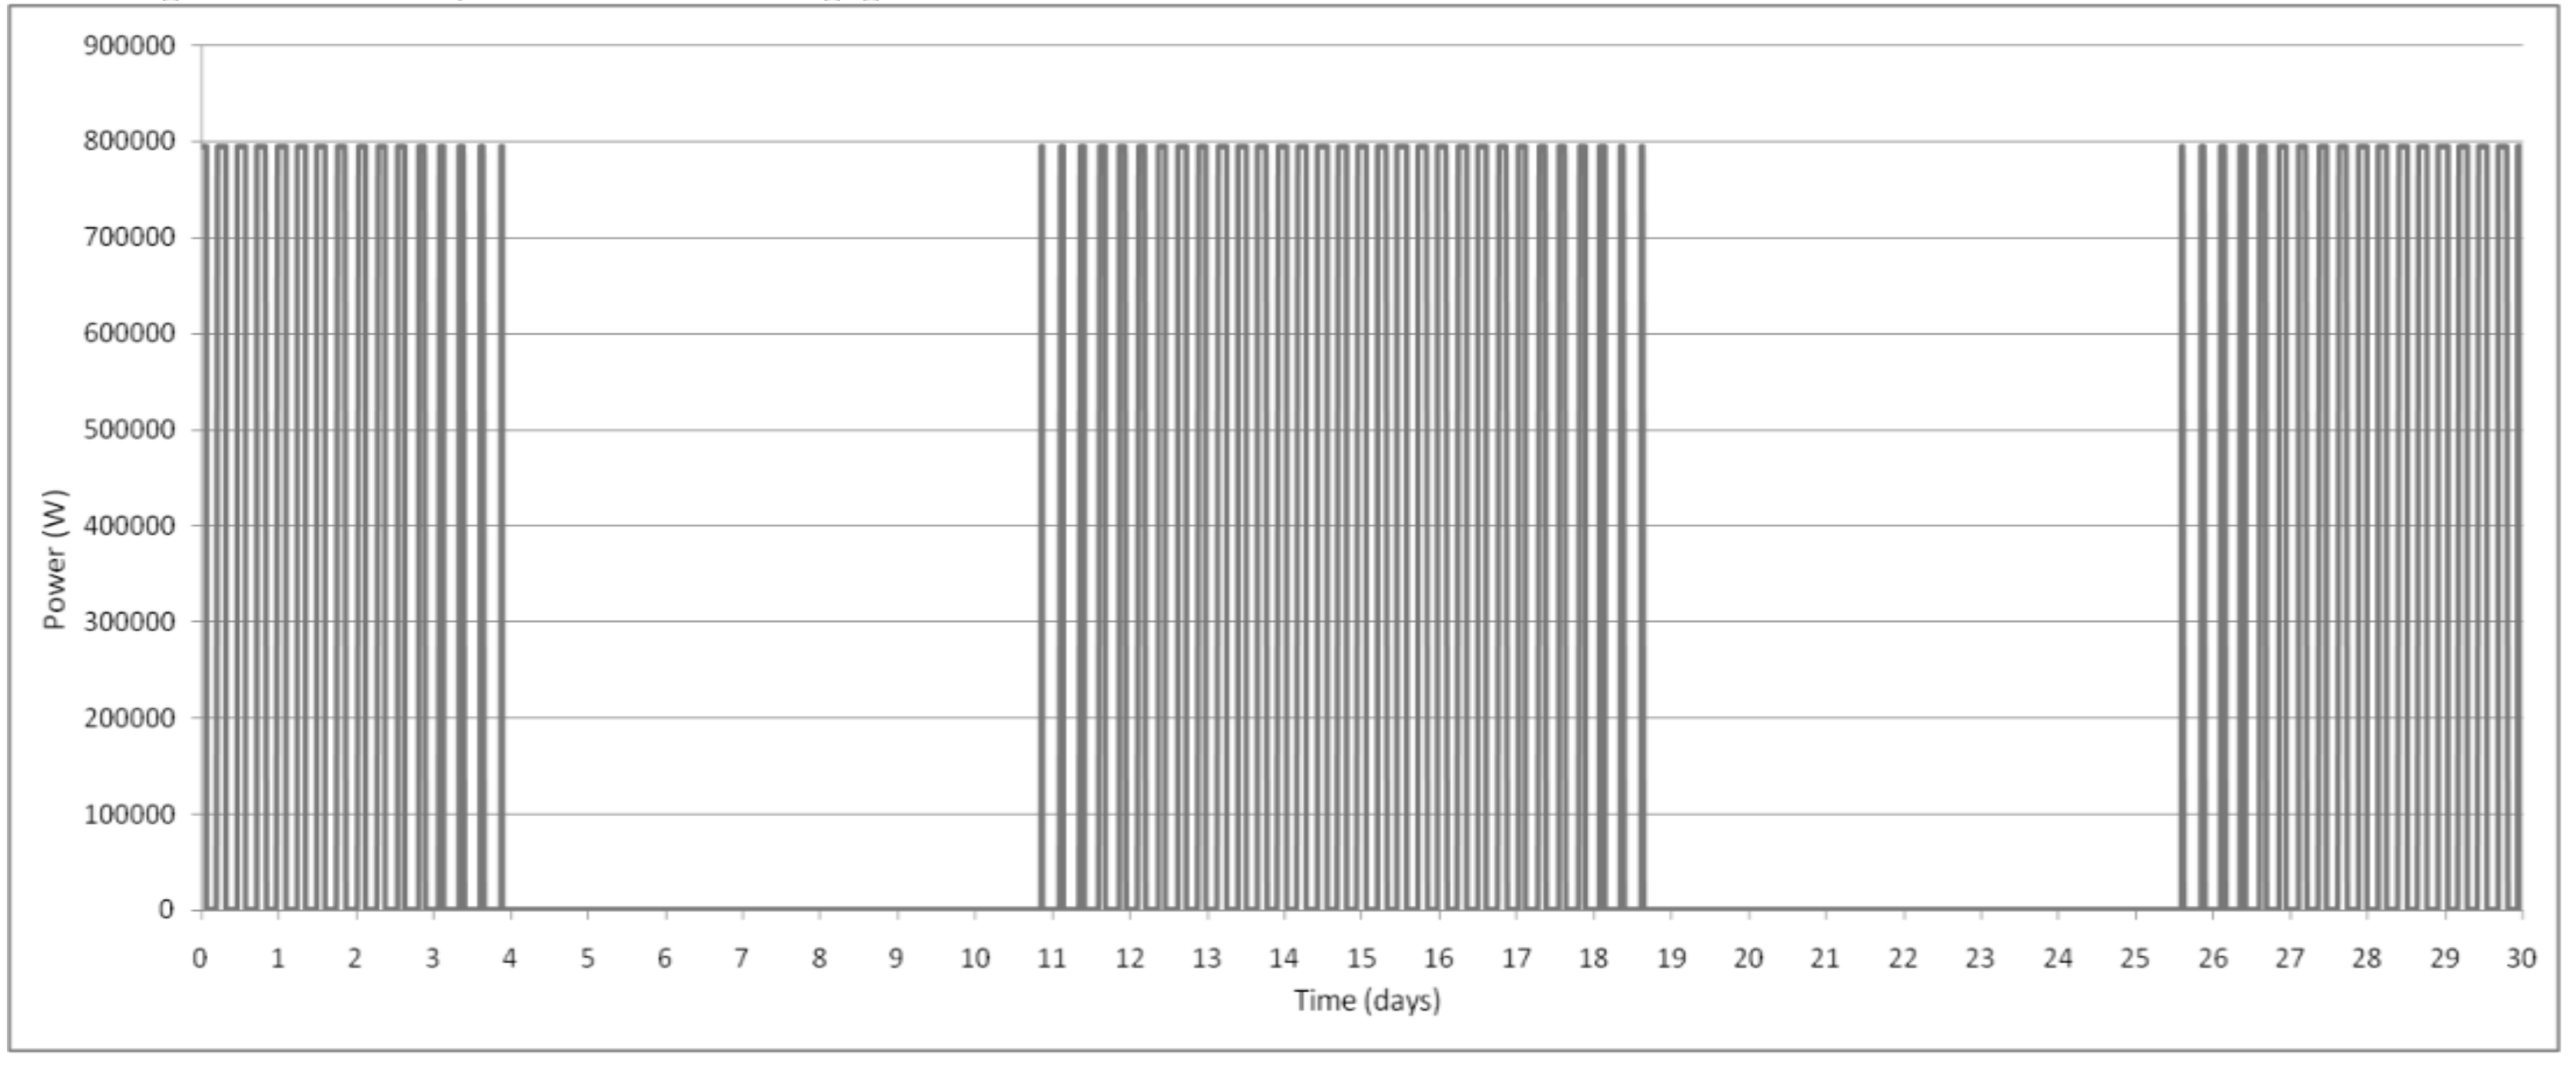
The main objective of this paper is to evaluate an idea based on smoothing out the large dynamic range of tidal power output by using a thermal energy storage system over a period of about 14 days, corresponding to the neap-spring tidal cycle. In particular, the option of storing thermal energy in the form of hot water is proposed. The context of where to implement this type of energy storage arrangement is given to be single households or small residential buildings. The energy exploited from tidal streams is planned to be stored and used for domestic purposes only. Communities that can benefit from the proposed tidal energy storage utility can be any coastal or island settlements located close to places where tidal resources are economically viable.
In particular, the idea investigated in this study could be applied to every region close to consistent tidal stream energy resources, e.g., the UK’s north coastal communities. The concept is assessed for three hypothetical scenarios. The first two concern storing energy just for satisfying the hot water consumption demand. In the third scenario, the energy stored is supposed to be used also for satisfying the thermal energy demand of a single house situated in a high latitude location. Taking into consideration that normal households located in such areas consume a large amount of thermal energy, the type of buildings considered for this last scenario, was given to be a low-energy house.
3. SIMULINK Models
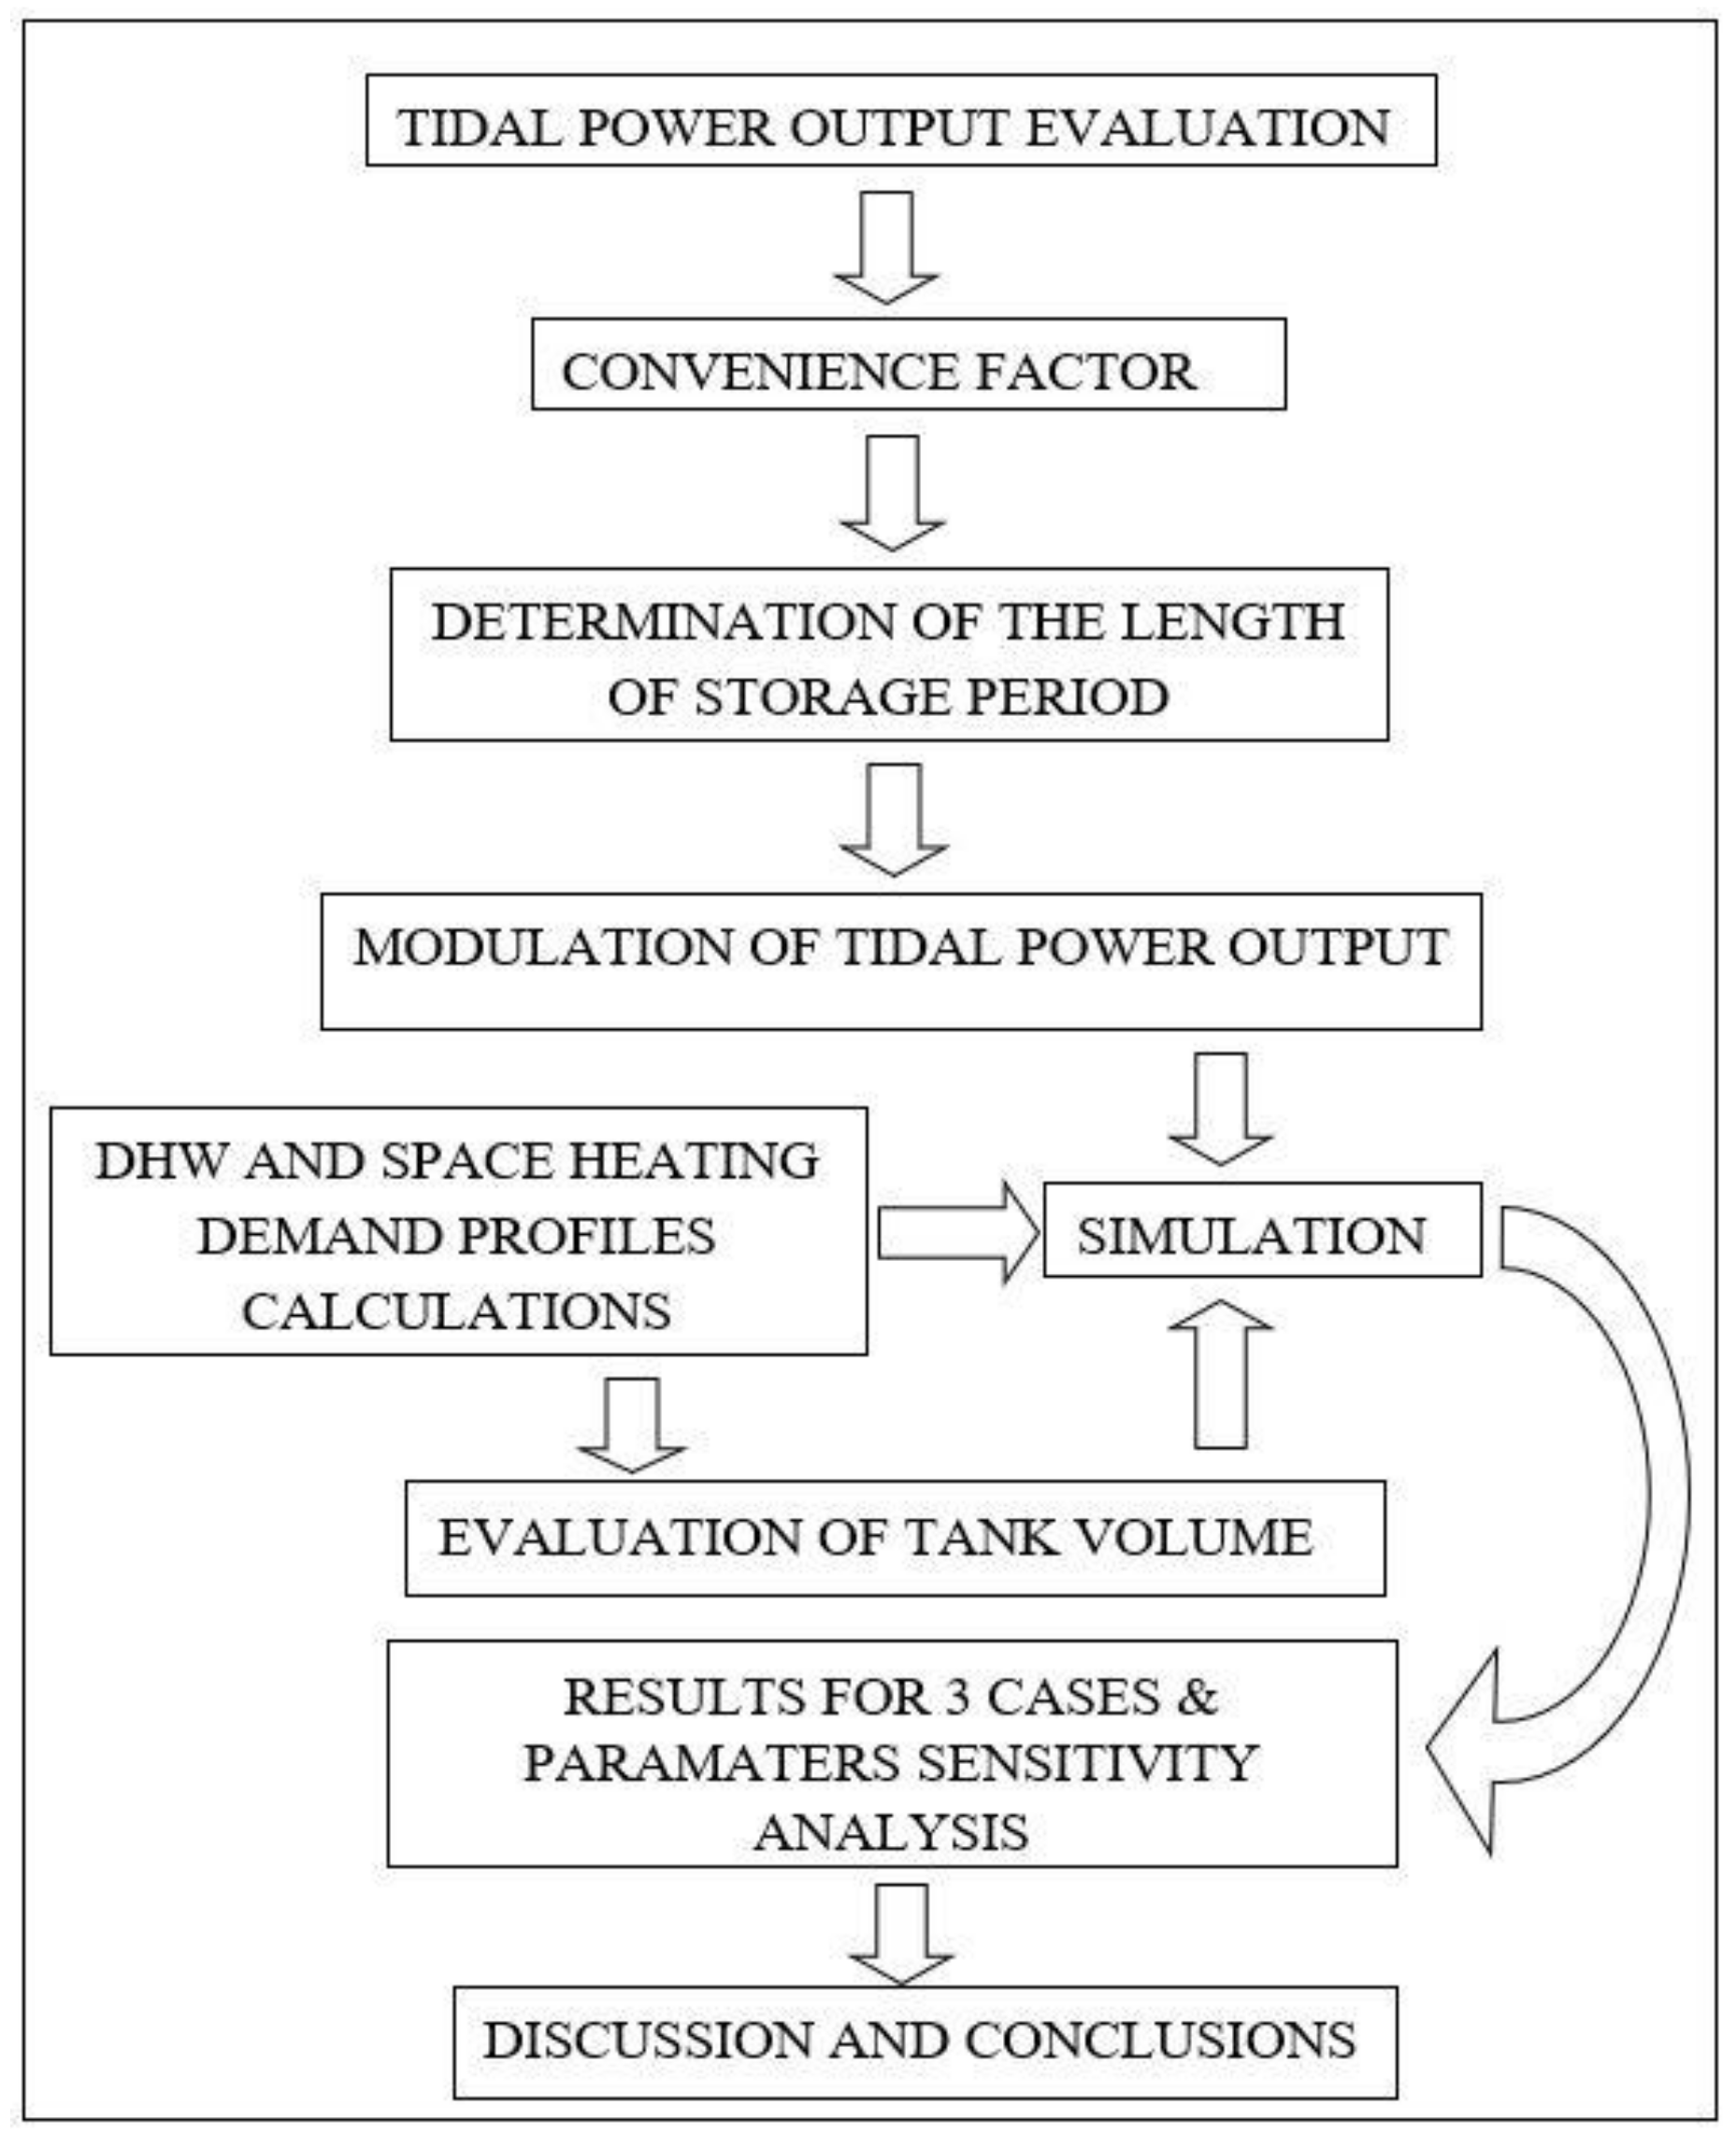
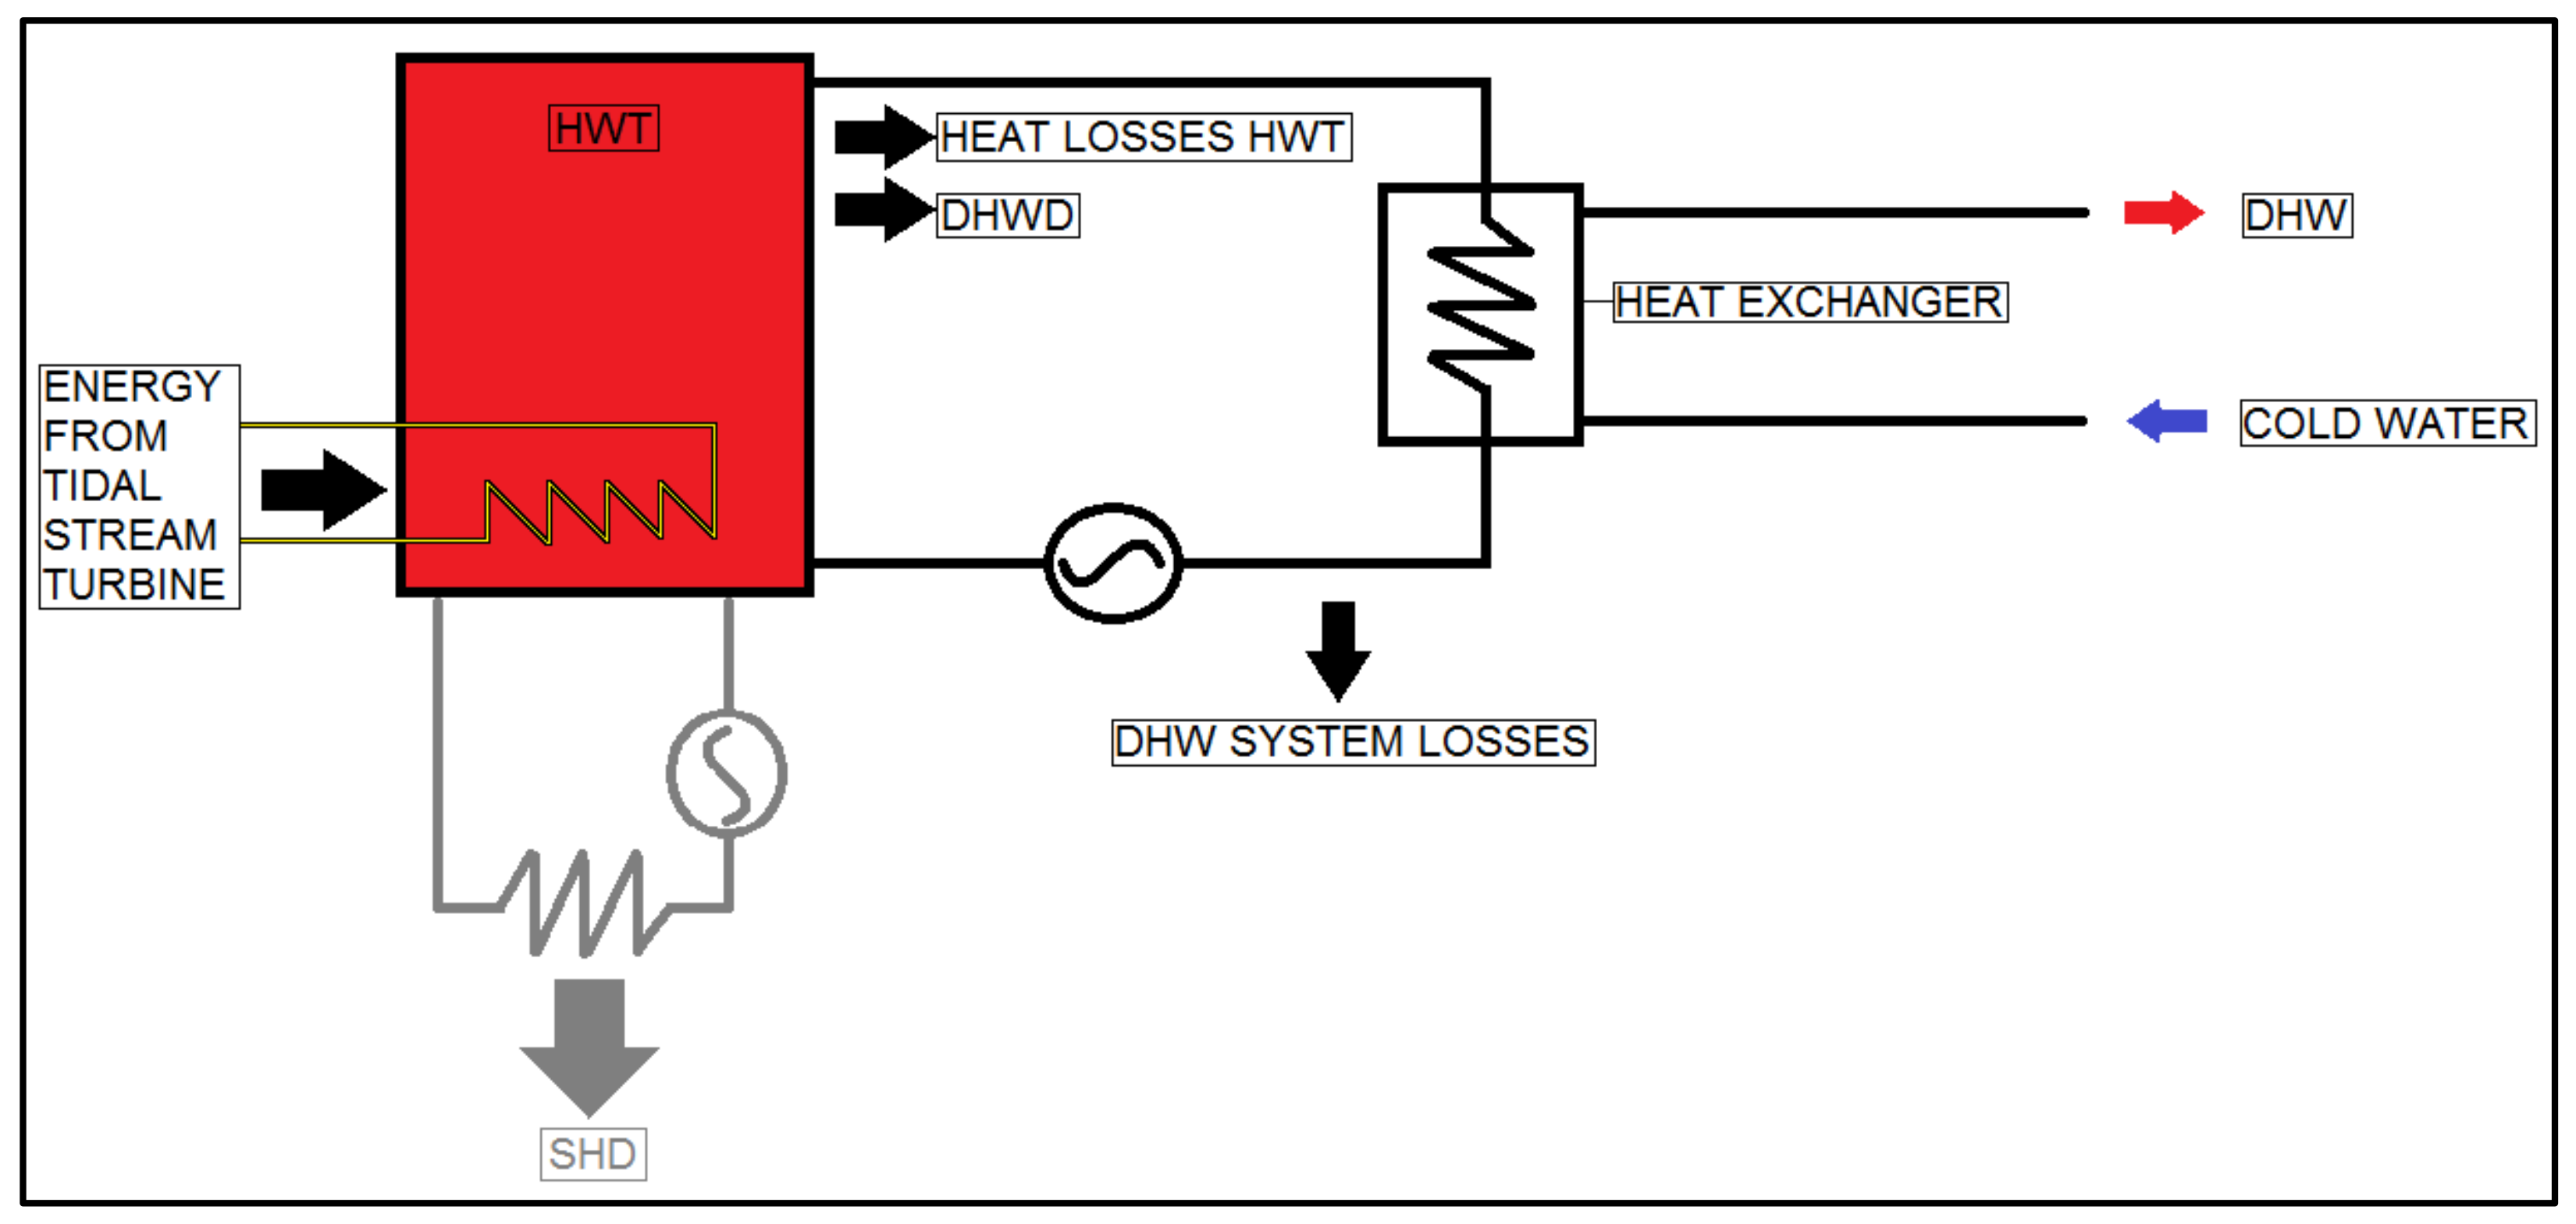
For three scenarios investigated, a generic model was at first defined. The generic model was applied for all systems numerically investigated, this is schematised in
Figure 8. The first scenario represents a single household where only energy for DHW consumption is stored and space heating demand is not considered. The second scenario concerns a ten families building option. The last scenarios relate to a single household for which the space heating demand was also estimated. Two specific SIMULINK models were defined. While the first SIMULINK model was used for assessing the first and second scenarios, the second was used for evaluating the third scenario.
In all the three options the hot water system is given to be closed and the temperature, for all regions inside the tank, is given to be uniform. Thus, the same water re-circulates in pipes and in the HWT. Tap water, coming from the aqueduct, through heat exchangers is heated up. In order to permit that domestic heat exchangers to work in an efficient way, a minimum of about 20 °C difference between the water inside the tank and the tap water was preserved.
Energy losses in the pipes, heat exchangers and components of the hot water system are given to be a percentage of the demand. These last factors were taken into account by adding an estimated quantity to the total energy demand. In particular, for the first model, losses were defined as 10% of demand. For the second and third models, losses equal to 15% of the demand were instead assumed.
3.1. Single Household Model for DHW Demand (First Scenario)
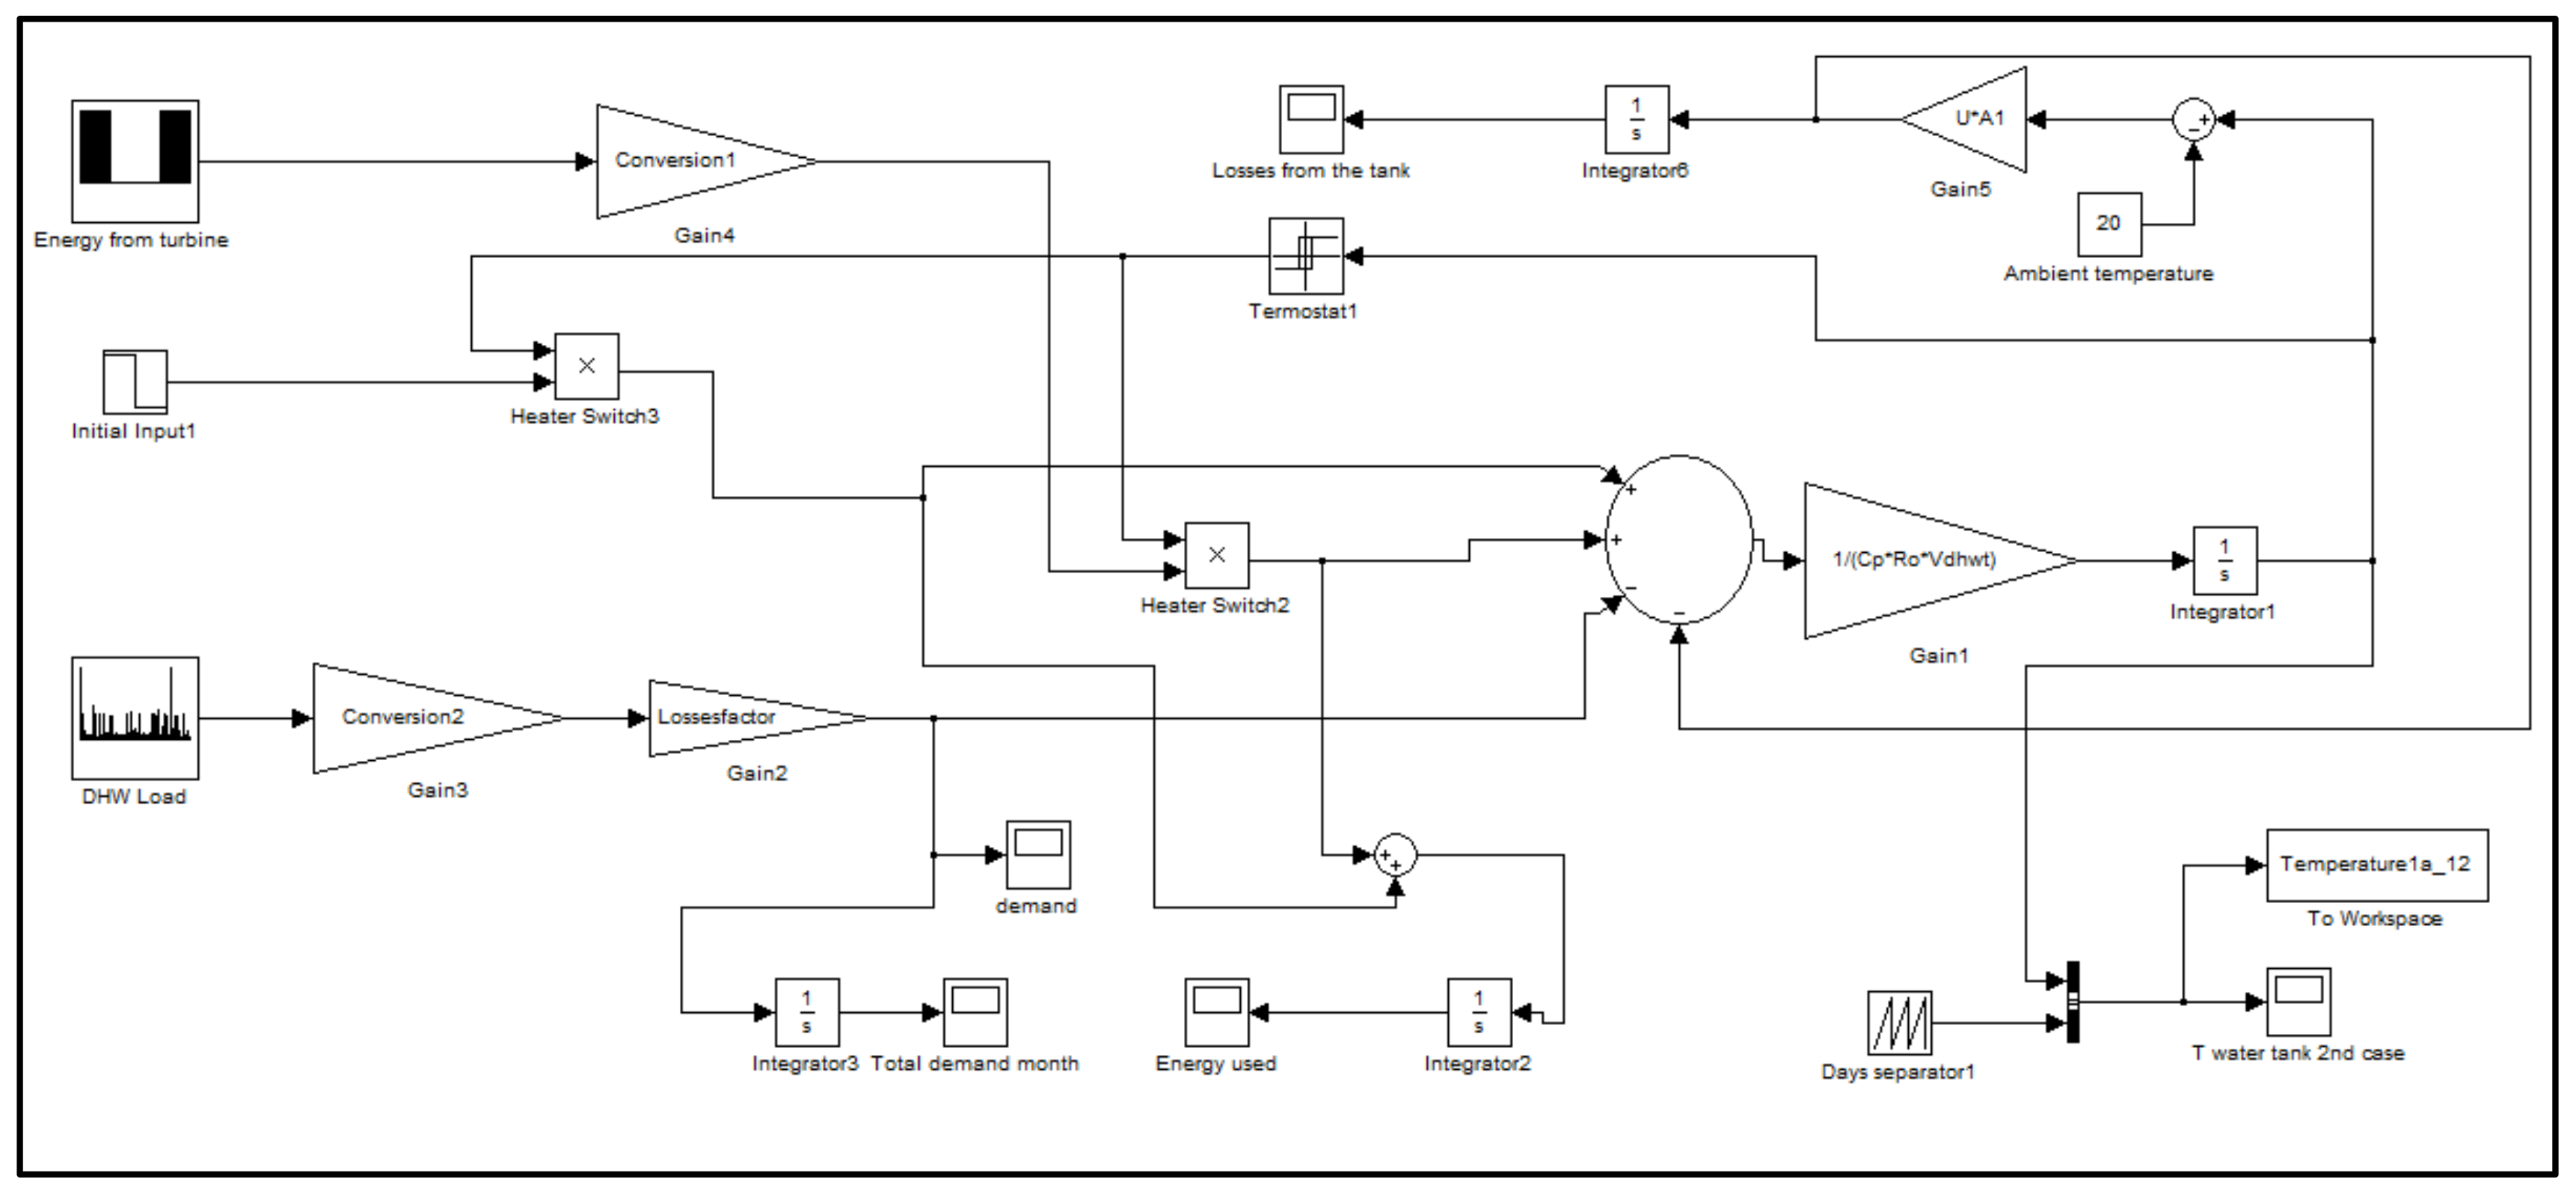
The first model created in SIMULINK is reported in
Figure 9. This represents the energy balance defined by the first law of thermodynamics, i.e., given by Equation (5).
where,
is the mass of water in the HWT (kg),
is the specific heat capacity of water (J/(kg K)),
is the HWT temperature (C°),
is time (min),
is the tidal generator power output profile + initial input (J/min) and
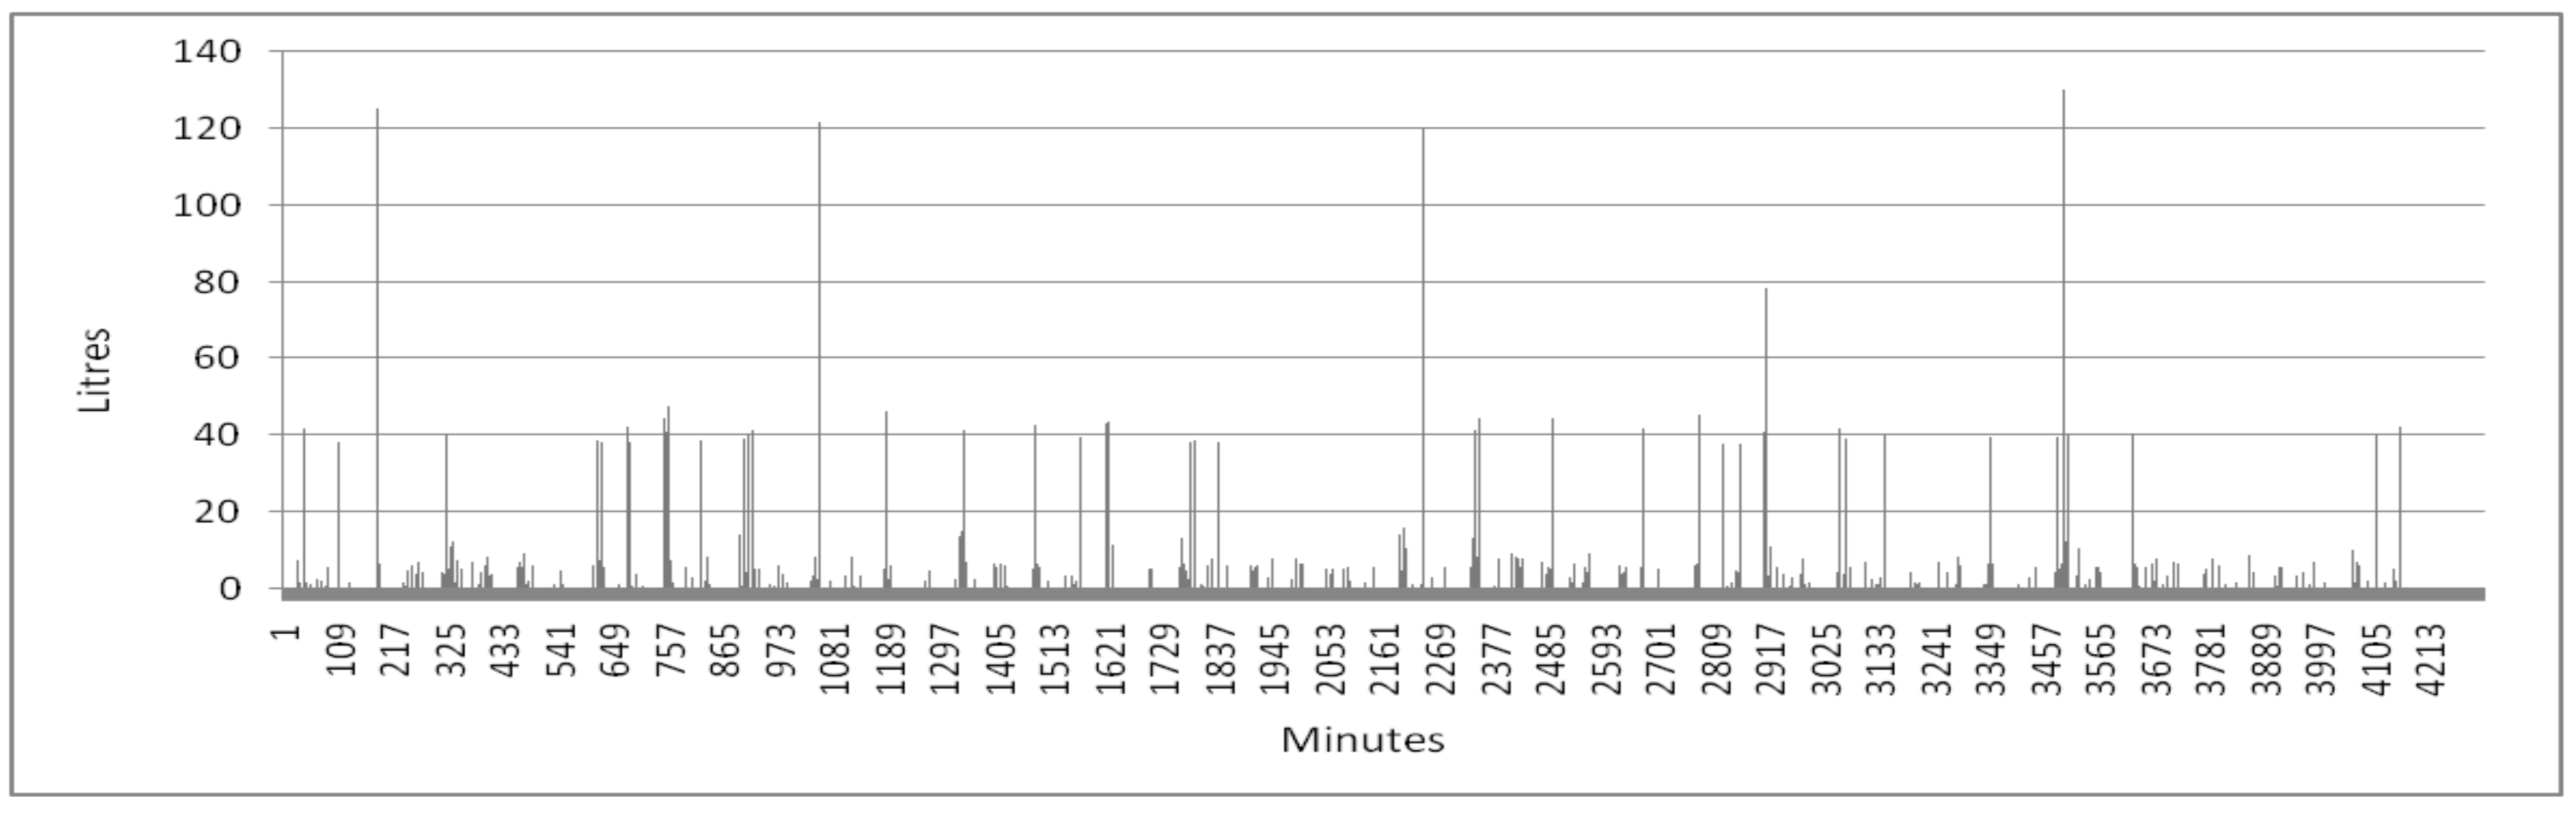
is the DHW load profile + heat losses HWT (J/min).
Heating losses of HWT, by the following formula were defined as:
where,
is the U-value of the HWT, (W/m
2 K)
is the external area of the HWT, (m
2)
is the water temperature inside the HWT and (C°)
is the house ambient temperature (20 °C). Equation (8), after integration, gives temperature values for each time step.
3.2. Ten Families Model for DHW Demand (Second Scenario)
After having calculated different DHW demand profiles and used the first SIMULINK model, the ten families option was evaluated. For this scenario the HW demand was found by summing up forecasted draw-offs for 30 people. The input power was increased to a reasonable value.
3.3. Single Household Model For DHW And Space Heating Demand (Third Scenario)
While for the first model the specific characteristics of the house were not necessary, in the second SIMULINK model, a simple household with characteristics reported in
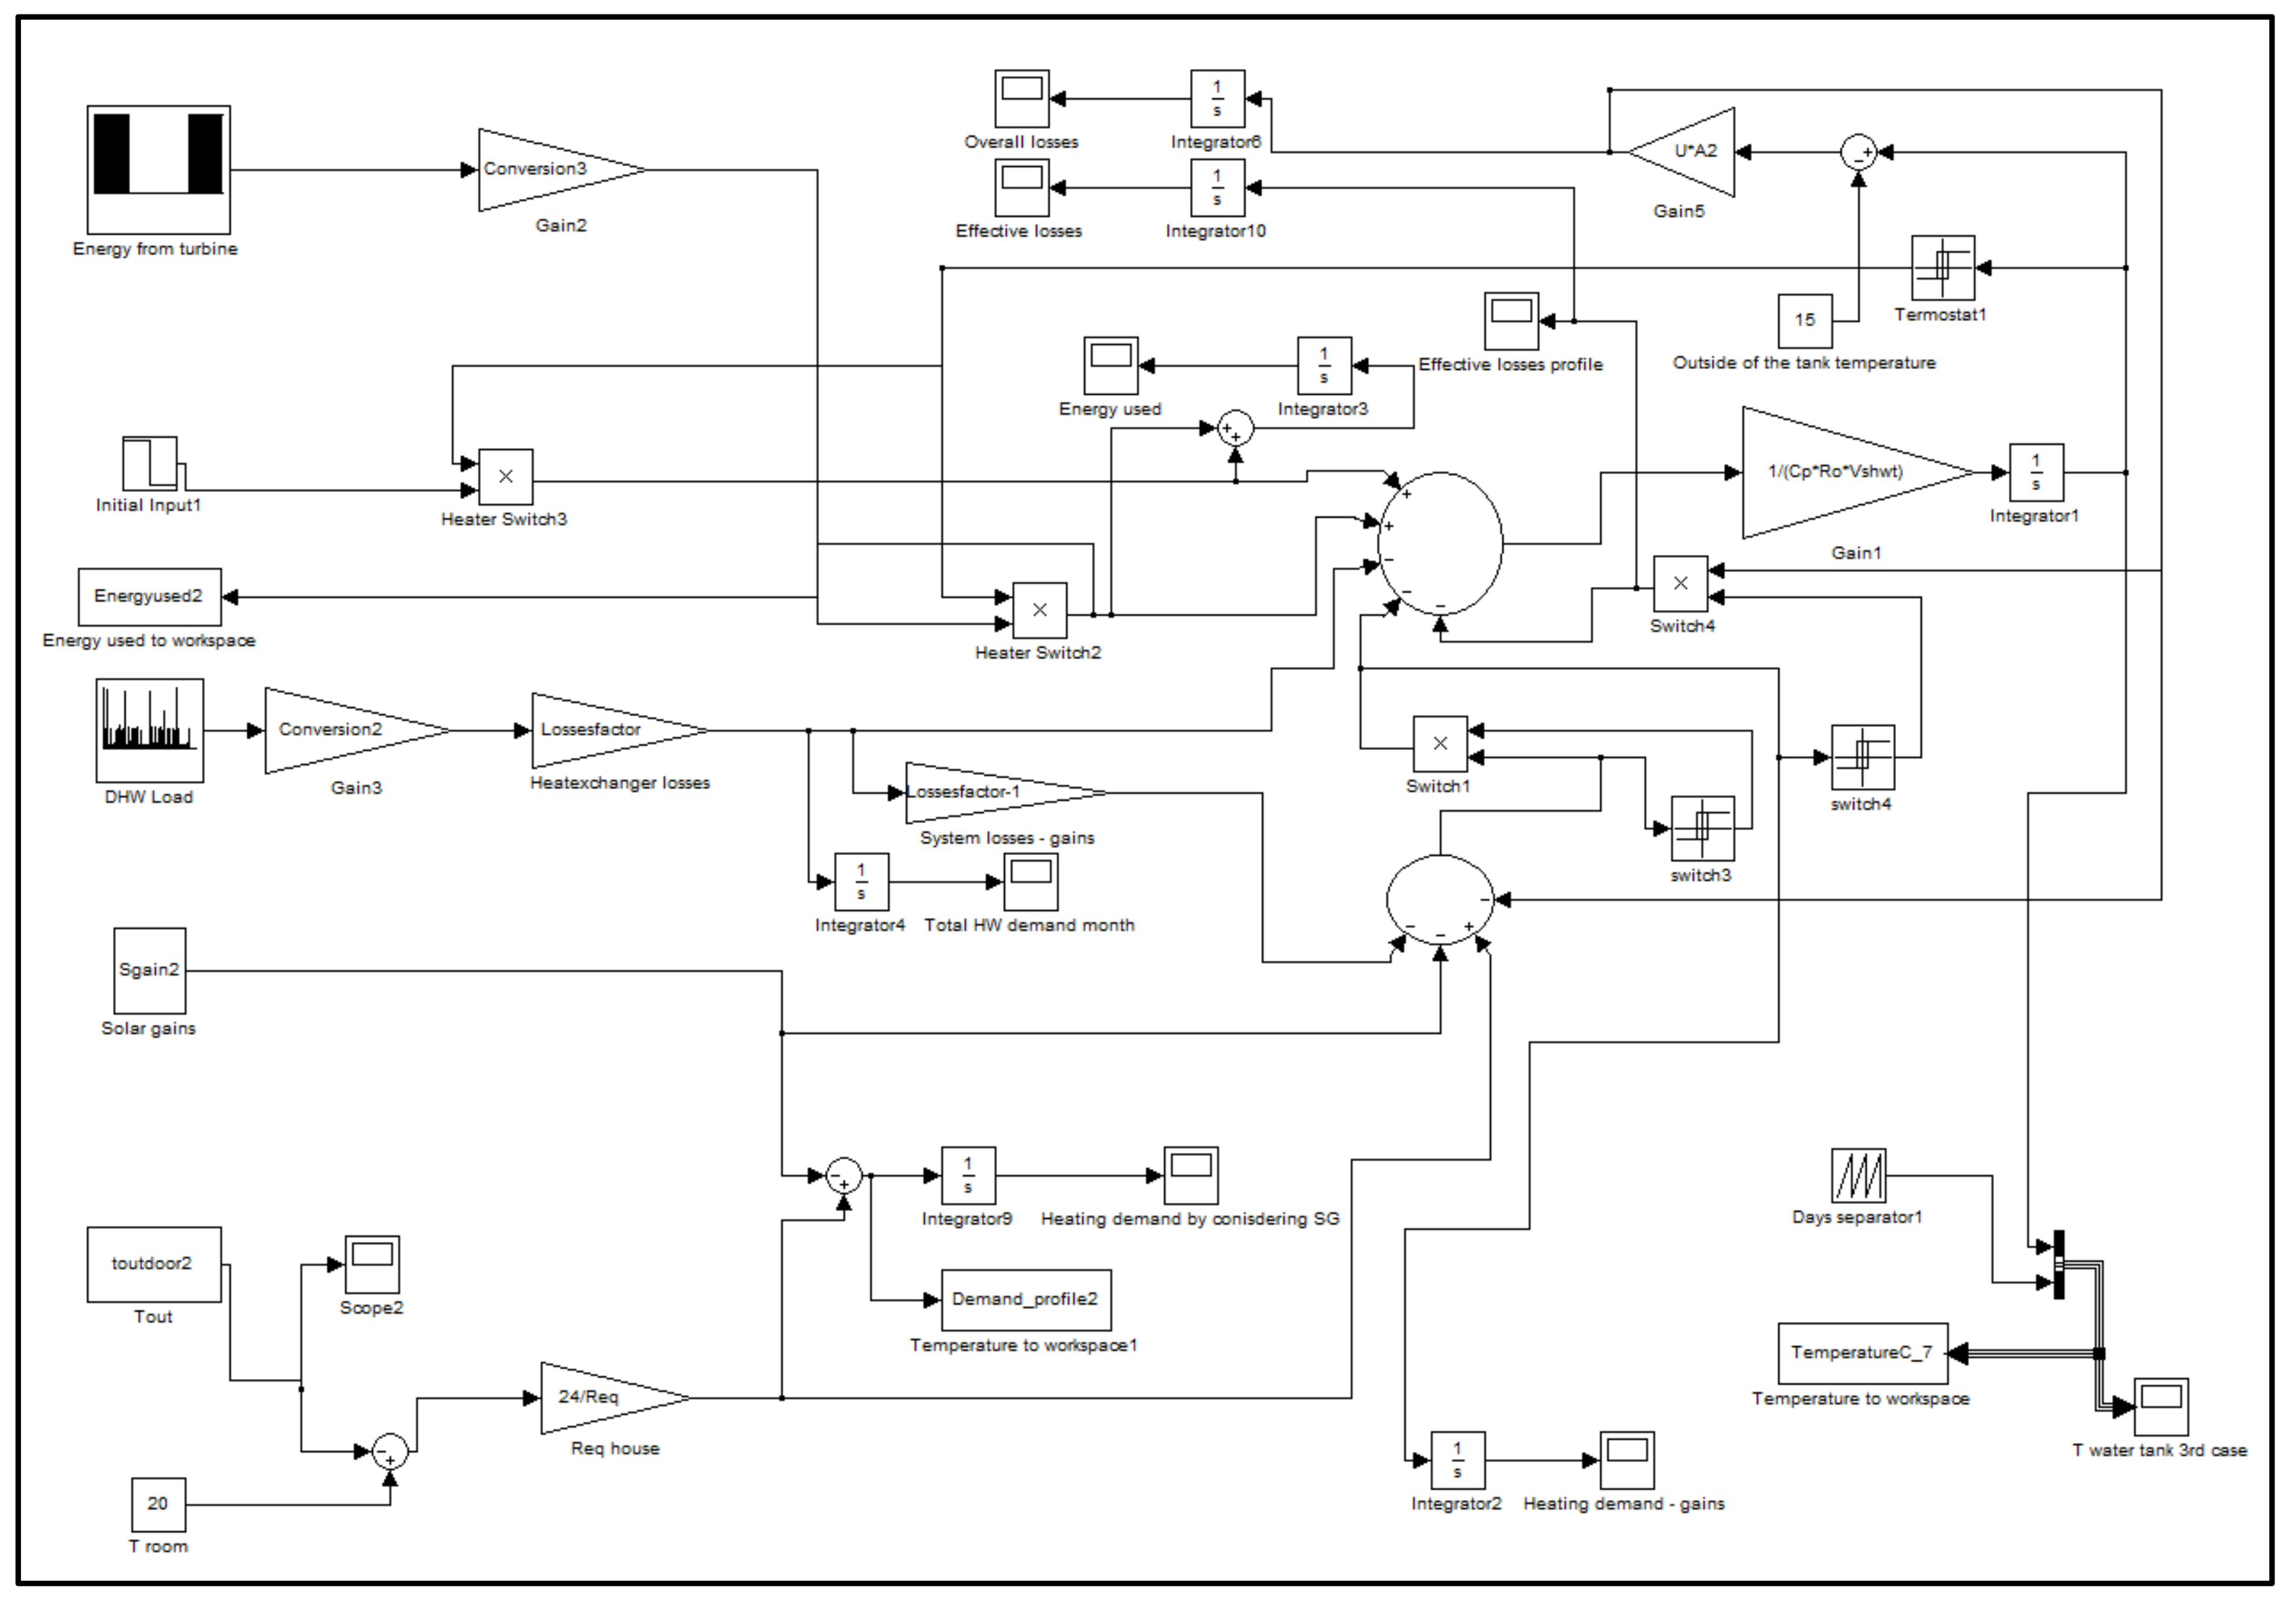
Table 4, was modelled. The SIMULINK model, in this case, is an extension of the previous model. This is illustrated in
Figure 10. After a number of preliminary simulations, it was found that for normal houses, due to the high energy consumption requirements, an unrealistically large hot water tank was necessary. Therefore, the house considered in the study was set to be low-energy (well insulated), with consumption of space heating of less than 30 kWh year per m
2 [
21].
In this option, the model was developed by adding the heating demand and heat gains to the first model which were taken as a template. In particular, it was considered that the water tank was installed inside the house or in a basement where the air is circulating. Thus, heat losses from the HWT become internal gains and these contribute to space heating.
In order to simulate the option considered, again Equation (8) was implemented. However, in this circumstance,
was specified differently. The third SIMULINK model, (
Figure 10) represents Equation (8) and relations defined by Equations (10)–(12).
where,
is the domestic hot water energy demand (J/min),
is the space heating energy demand (J/min),
is the hot water tank losses (J/min),
is house heat losses (J/min) and
is solar gains (J/min).
3.4. Characteristics Of Systems Modelled And Limitations
In order to define the models used in this study, the proposed design was simplified, and particular assumptions were implemented. The following are the major characteristics and limitations of the models developed:
The power needed for actuating the water pumps of the hot water systems is low. Thus, the energy required for the pumps is assumed to be negligible compared to the energy in form of heat needed to satisfy the hot water and heating demands. For instance, a hot water recirculation pump for a single household consumes in the order of about 3 kWh/year [
22]. Compared to an estimated value of 1460 kWh/year of energy required for DHW production, the energy absorbed by the pump would be less than about 0.3% of the thermal energy demand. For simplicity, this little extra energy requirement is given to be available from other external energy sources. These may be any extra renewable energy sources coupled with batteries or be of conventional type (i.e., a grid connection or a diesel generator). In fact, in all cases, it is expected that extra sources of energy in form of electricity are needed for all other domestic applications such as lights and other electric appliances.
HWT losses are given by simply considering a heat transfer coefficient. Thus, the tanks are given to be ideally insulated (no other type of heat exchanges are existing, except heat losses considered by a linear transmission coefficient). However, if tanks are not perfectly insulated, losses can be as much as five times higher [
23].
Real DHW storage tanks usually are regulated for the temperature range of 80 to 60 °C. However, as this project does not focus on system specification, a maximum temperature of 95 °C was considered feasible.
Concerning the third model, internal house air circulation is given to be adequate and the energy required for ventilation is coming from external sources. Consequently, heat losses of the HWT contribute to space heating demand. The energy required for ventilation is assumed to be insignificant.
The ambient temperature, by a thermostat, at 20 °C is maintained. Therefore, hot water will circulate in the heating system if the ambient temperature is below 20 °C. If the temperature is higher than this value, the water pump will be closed.
In the third model, external temperature data input has daily resolution. By assuming that the building maintains heat during periods when the temperature drops down, hourly variations, due to change of temperature, are being neglected.
Concerning solar gains, these were included with months-long average values. Hence, simulations did not reproduce daily and hourly related effects.
In all options, temperature rise data was constant for each entire month. Consequently, models do not take into account minimal changes of the tap water temperature, which during a month, can slightly differ from one day to another.
The temperature inside DHW tanks is uniform (no stratification assumption).
It was expected that for the purpose of the study the above limitations and characteristics of the models do not affect the resulting findings.
3.5. Simulations
System components were sized by running a set of simulations and systematically regulating system parameters. In order to evaluate systems’ performances, the resistance coil value and DHW tank volume parameters were optimized for the coldest month. Successively simulations for each month of the year were run. The MATLAB ode-45 solver in all options was used. Following this, different output results concerning HWT temperature and losses were registered.
Concerning the first two models, by taking into account a storage period of 7 days and DHW average maximum consumption per occupant, different HWT volume values were evaluated. In particular, by taking into account a DHW system sizing criteria [
24], dimensions of the tanks were initially calculated with Equations (13) and (14).
where,
is the energy needed daily per occupant (J),
is the length of storage period (days),
is the maximum temperature ranges in the HWT (C°),
is the design purposes water consumption volume per day per occupant (m
3) and
is the maximum temperature rise value during the year (occurring during February in C°) (see
Table 3).
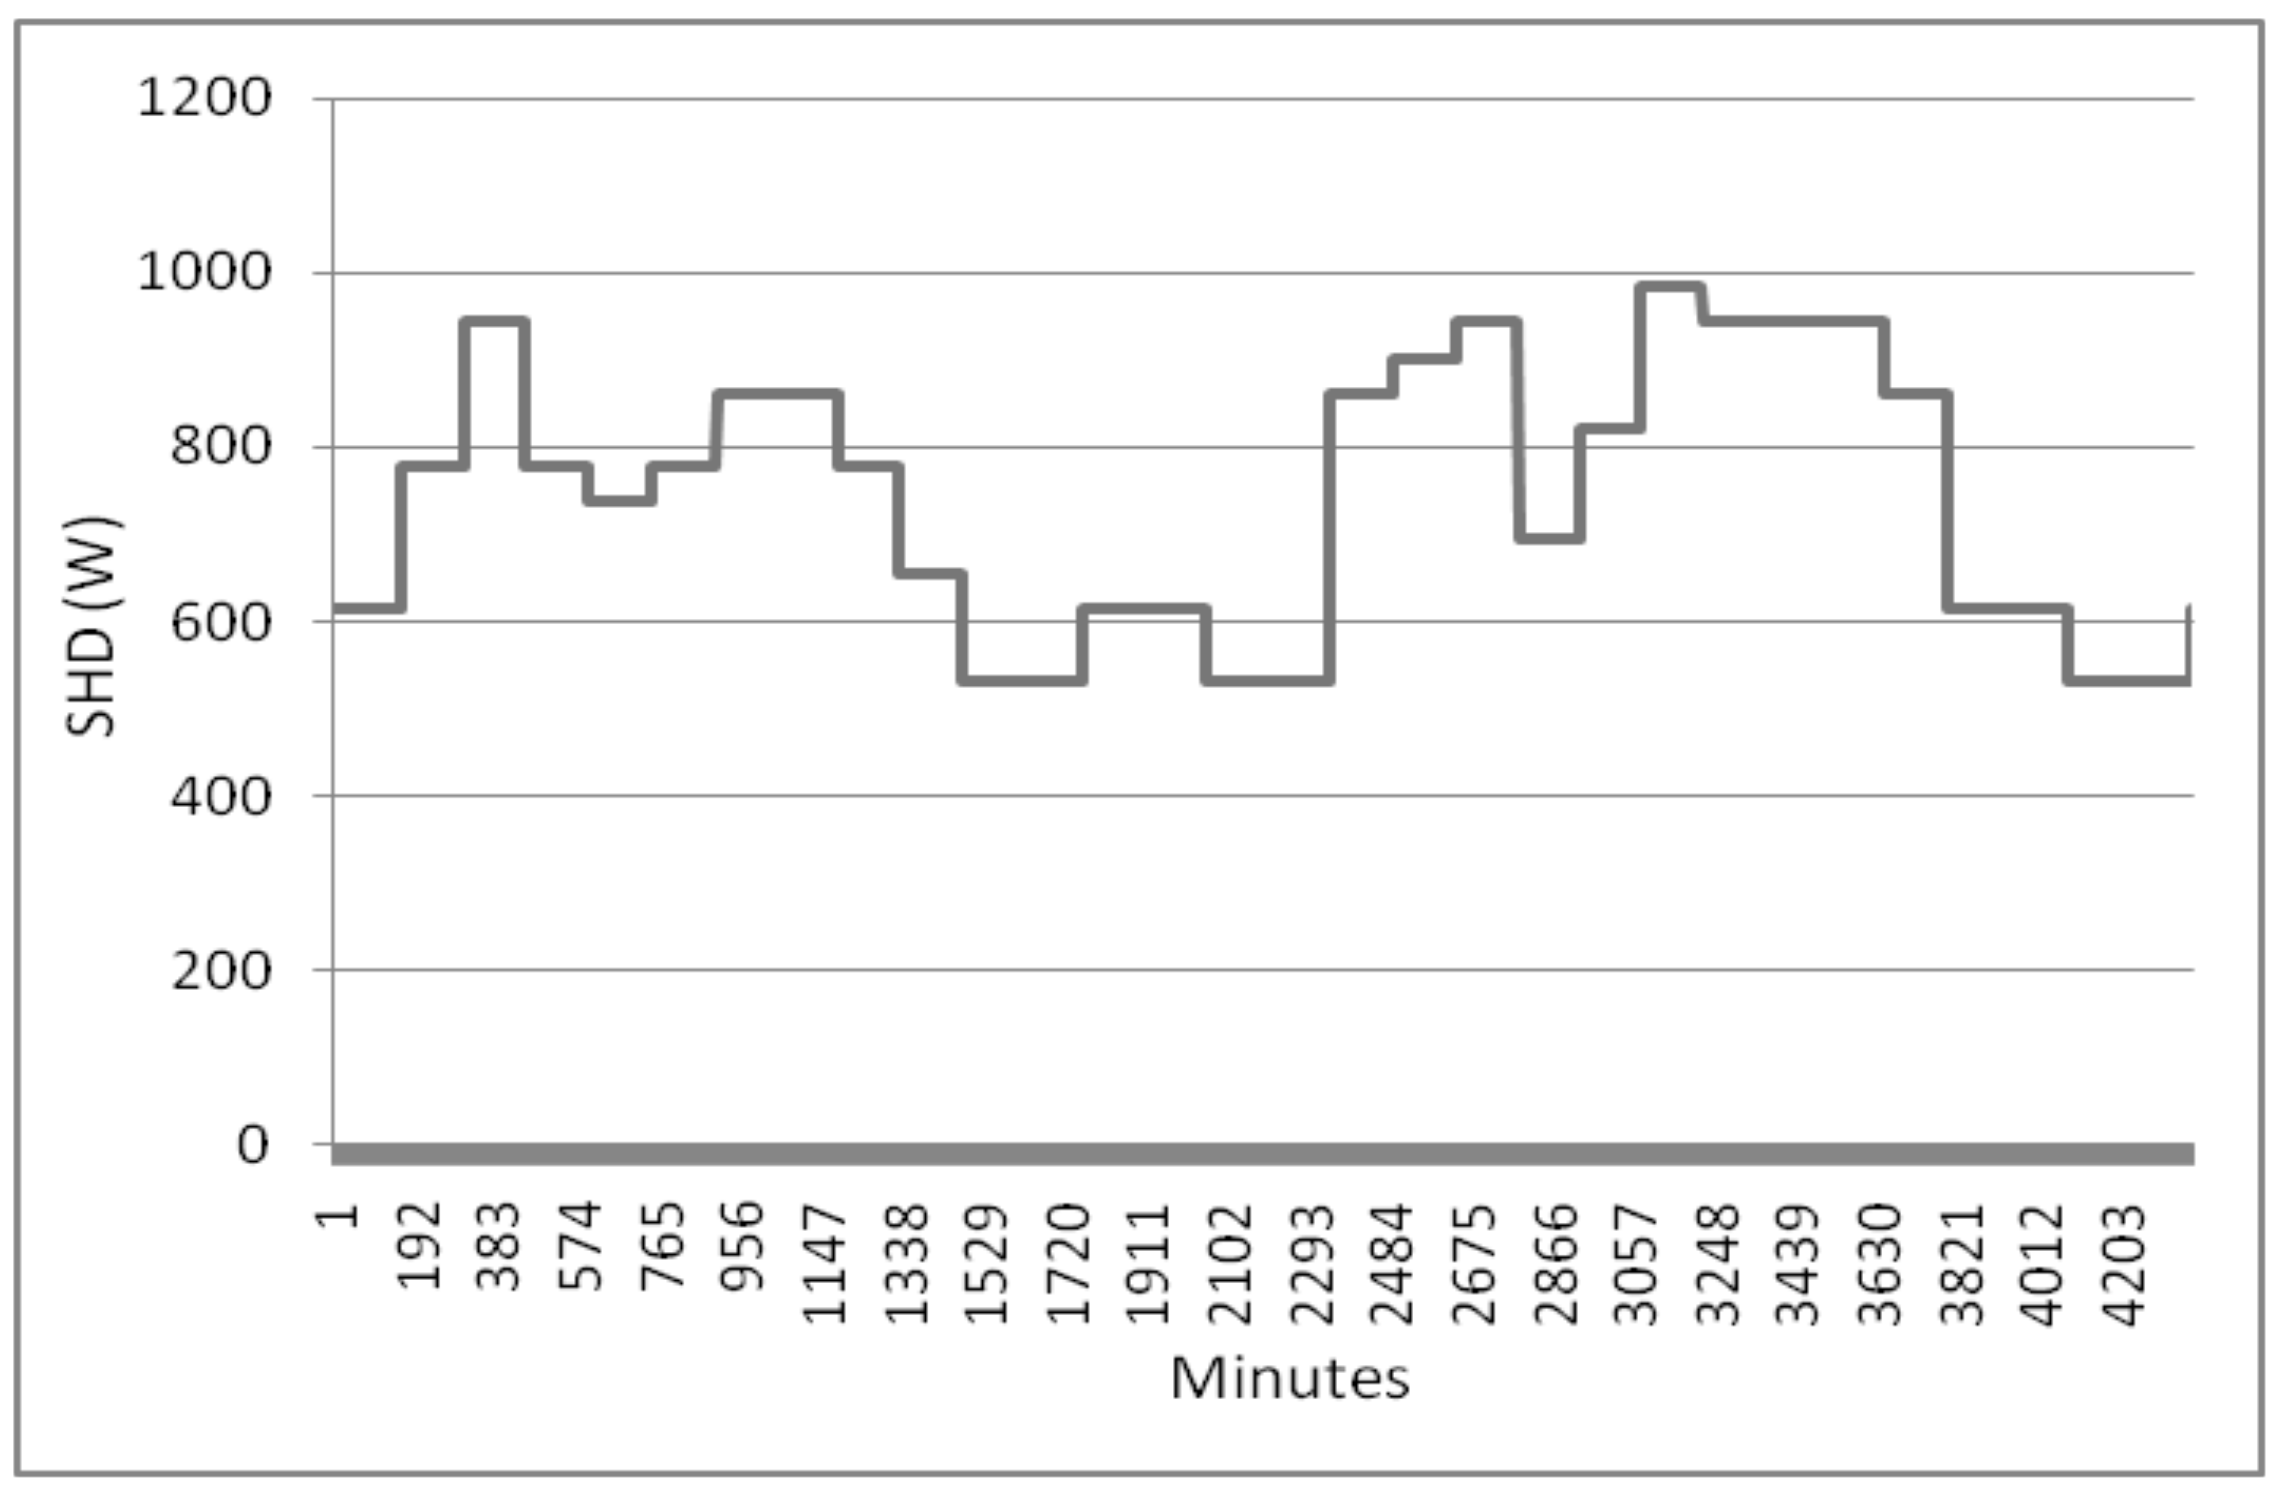
Only one size of HWT was evaluated for the third scenario where also space heating demand (SHD) was considered.
5. Discussion
Factors, which determine the effectiveness of a HWT energy storage medium coupled with a tidal energy source are various, and these affect, in different ways, performance of the proposed system. One of the main problems to consider is the one related to heat losses. In fact, regarding all examined cases, it was found that losses are relatively large compared to demand. By implementing energy-saving systems, reducing wasted energy in the house and implementing heat recovery systems, the HWT volume can be significantly reduced. Consequently, as losses are reduced, with smaller HWT the proposed system could be much more technically feasible.
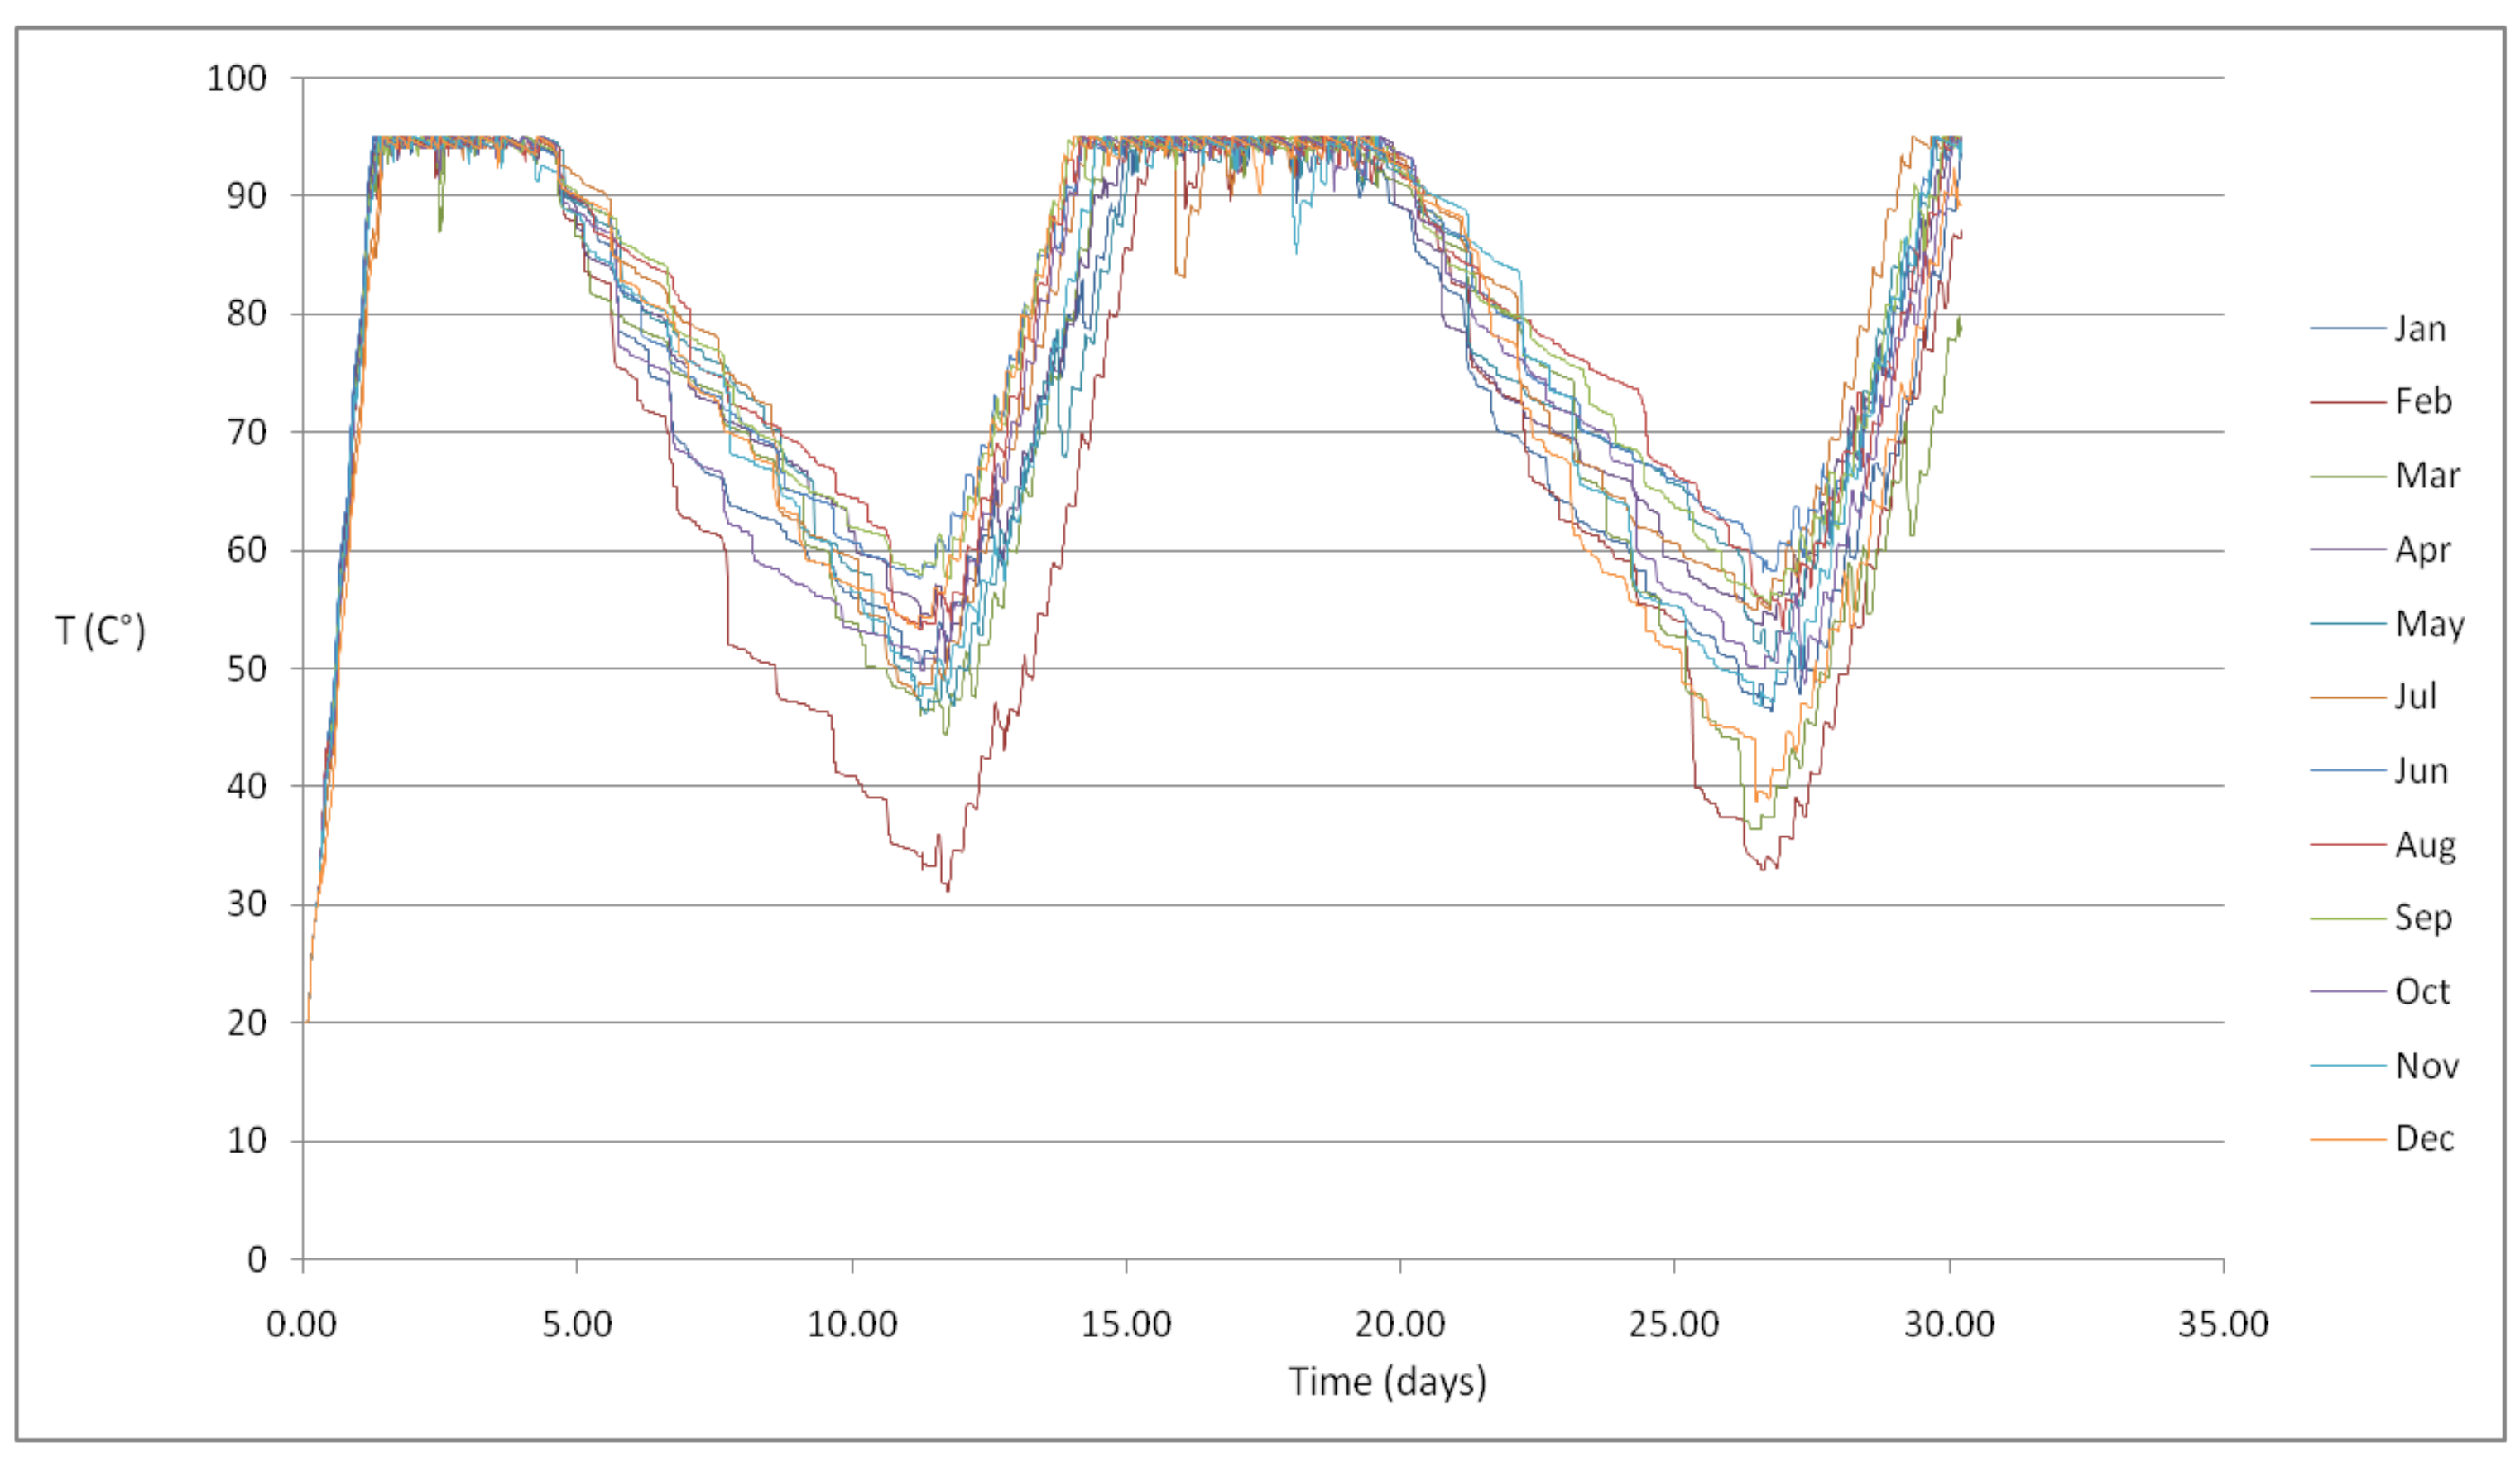
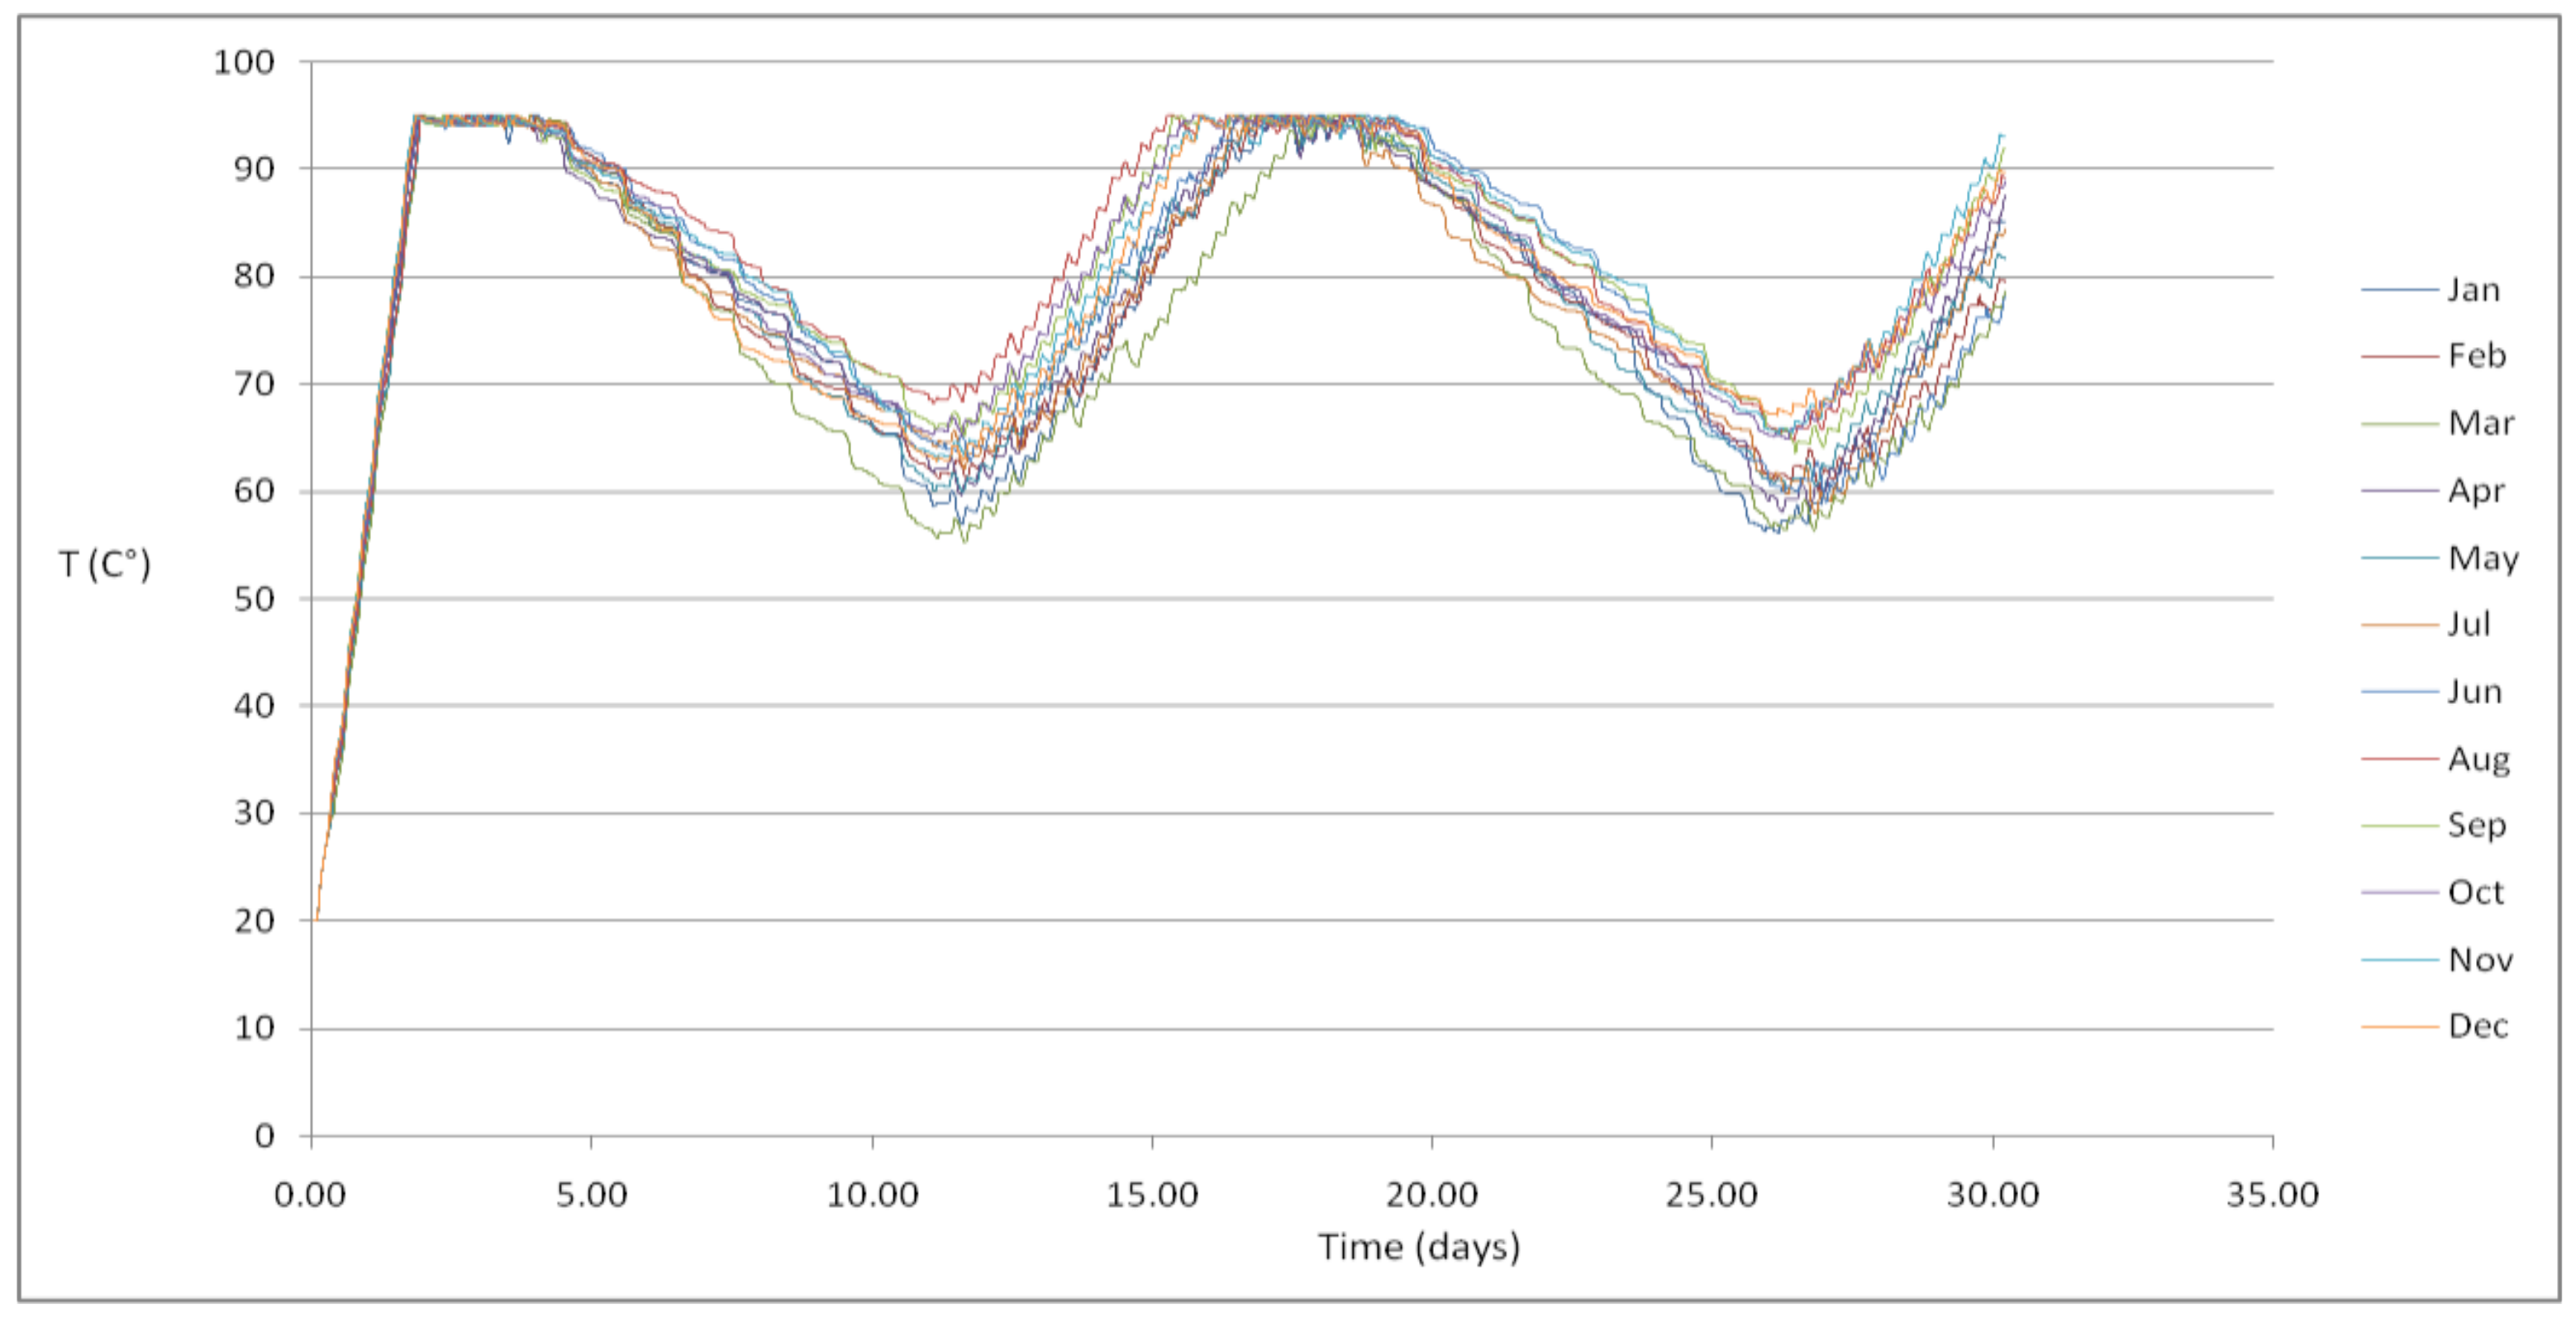
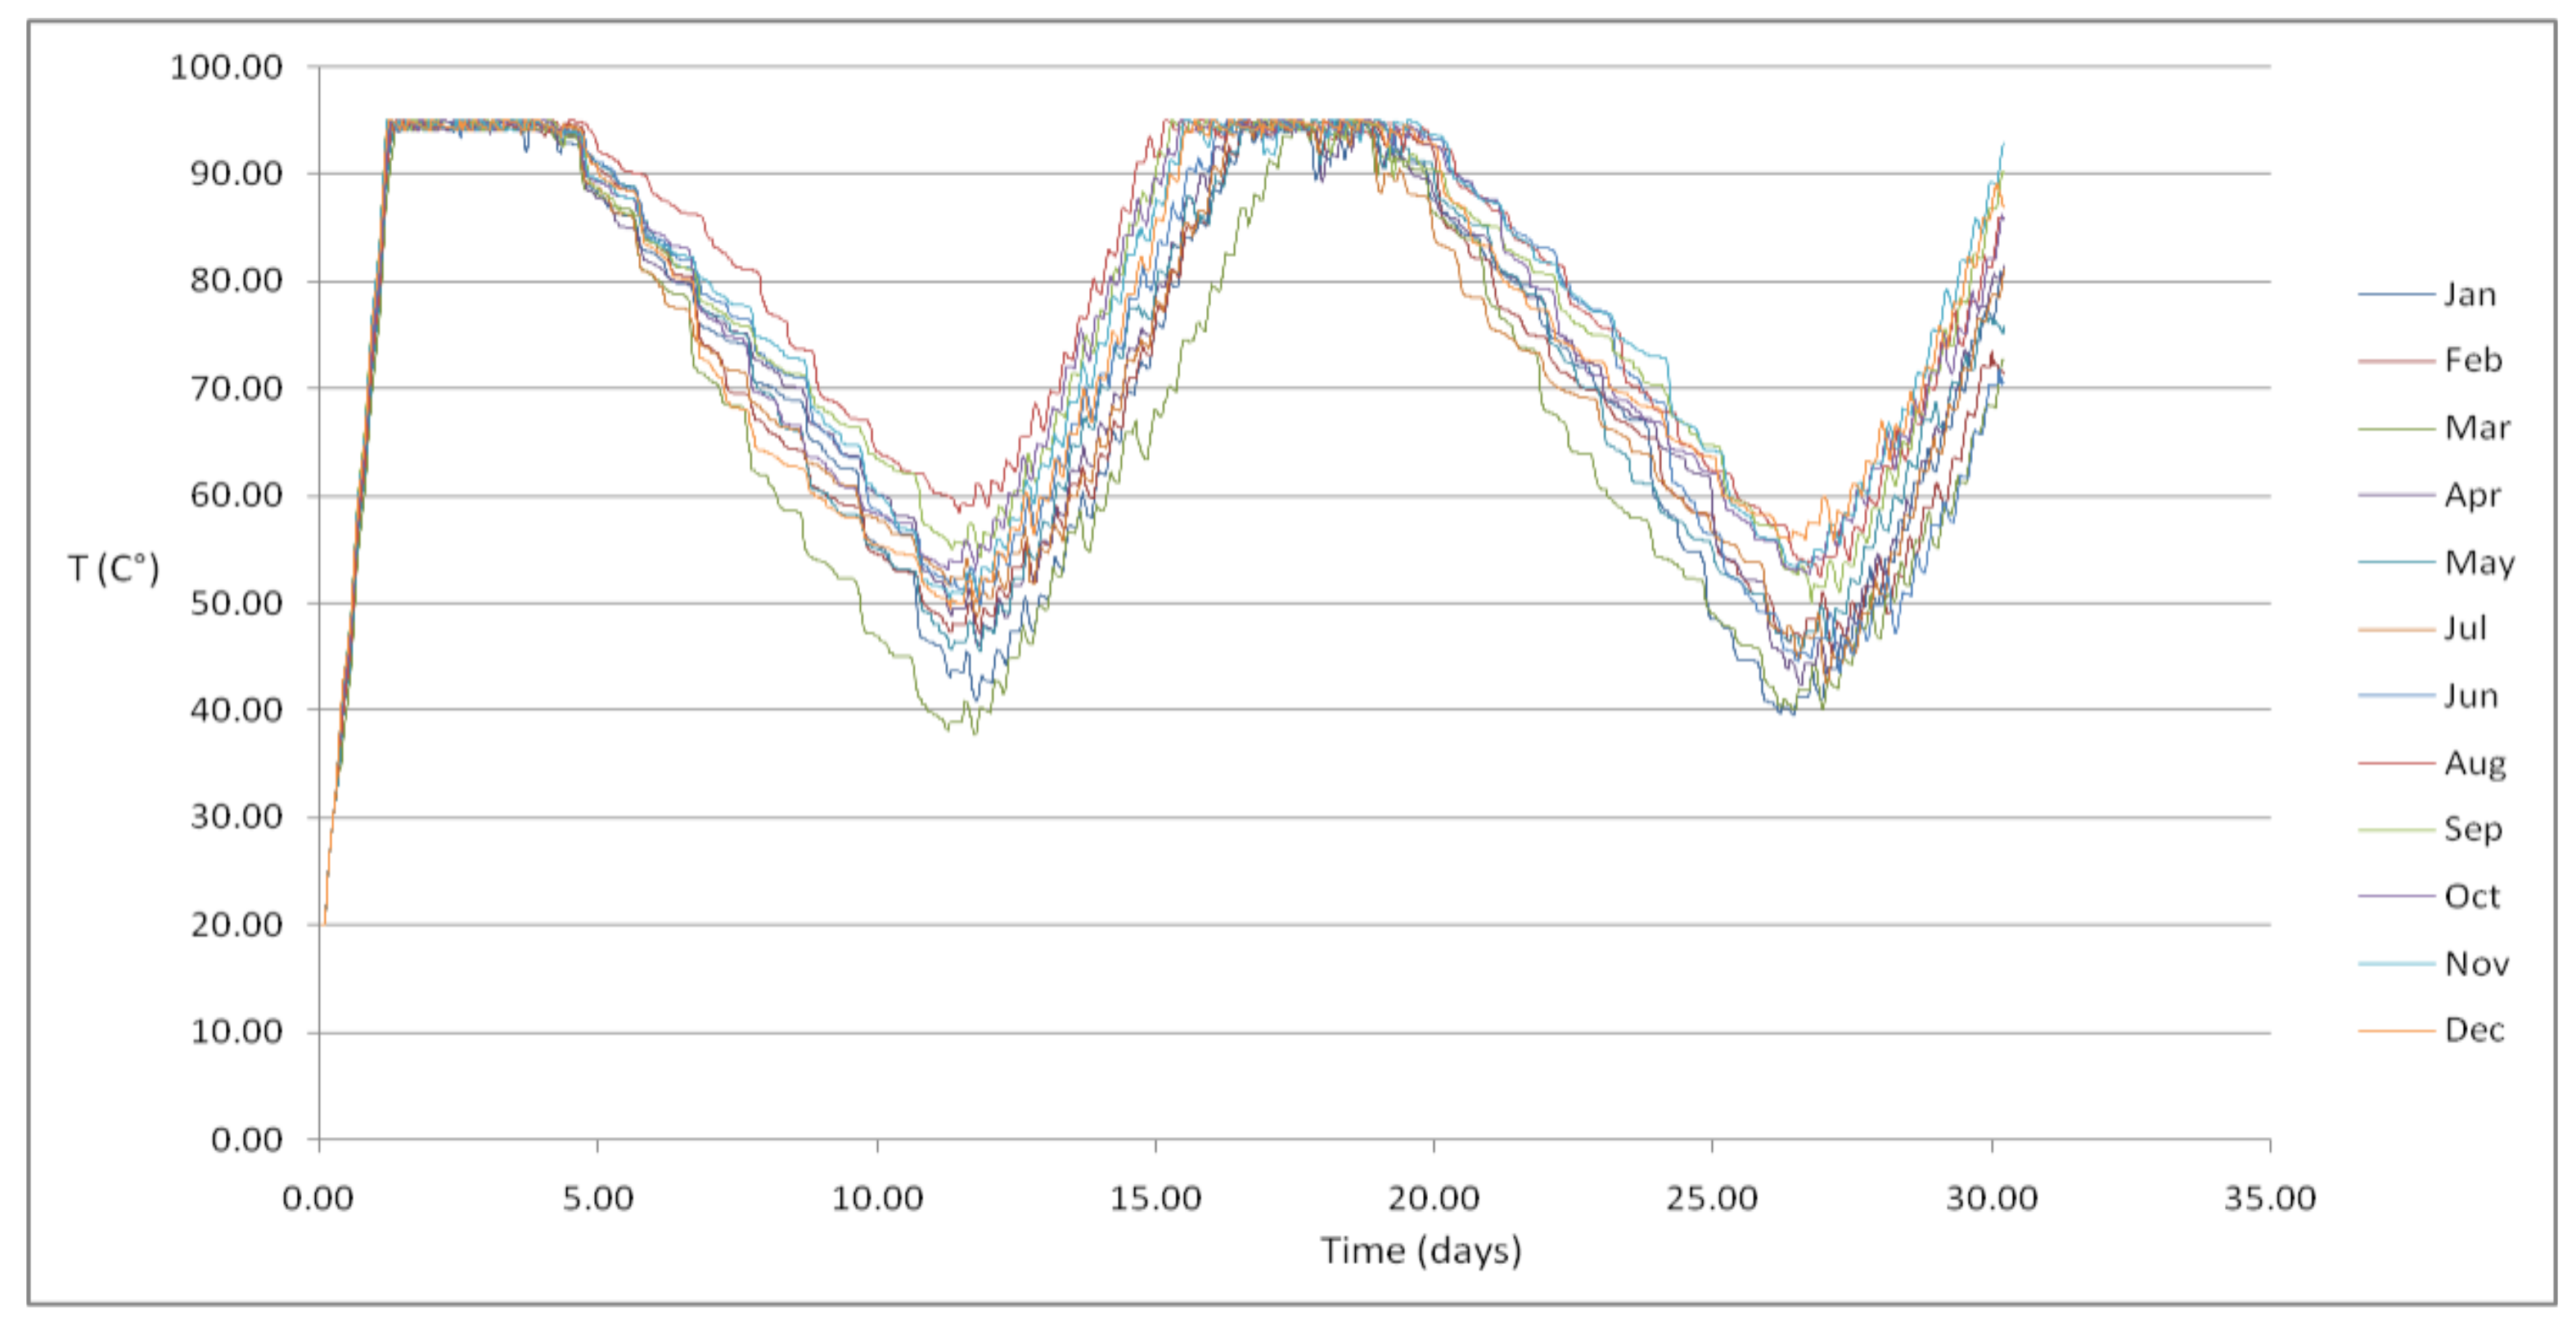
The temperature profile of the first model HWT varies on the hourly scale more than the other cases. This is happening because the HWT for the first model is considerably smaller compared to the HWTs of the second and third models. For what concerns the third case, due to the large volume of water, the temperature varies mainly because of the effect of space heating (SH) demand and losses. Thus the effect of the DHW demand, in this latter case, has little significance.
Concerning the third case, the heat demand consumption for the whole year was found to be 26 kWh year/m
2. This value indicated that the model correctly reproduced a low-energy houses SH demand (30 kWh year/m
2) [
21]. However, even by implementing the basic control strategy, losses in HWT are relatively high, especially when the energy demand is less (during summer). Consequently, the temperature inside the house may be too high. This characteristic may be a problem of the proposed system that needs to be addressed. Practical solutions to overcome this problem may concern increasing the insulation of tanks or ensuring good air circulation and natural cooling during warmer periods, e.g., by implementing smart actuators that open windows when refreshing is needed.
Given a specific system design, the aspects that determine the energy available for all the storage periods are very dependent on demand profiles. In order to successfully keep a minimum temperature value, the extreme heating demand periods should be somehow minimized. While, for space heating there is nothing to do except improving house designs, concerning DHW demand appropriate other actions for limiting the consumption could be taken. For example, a mechanism of local tariffs, by which minimum heat requirements can be guaranteed, could be created. In particular, if customers use much more energy than what is needed, prices of energy should progressively increase. The solution could eventually be implemented by installing smart meters.
It should be noted that the indicative thermal conductivity U-value equal to 0.23 W/m2K for the HWT was assumed; this is a common value for a well-insulated tank. However, thermal insulation can be higher if better and extra insulation is added. But this latter option would involve extra major costs.
In order to maximize heat stored in the HWT during a certain period, the range of feasible temperatures in HWT should be as large as feasible. If heat exchangers are used for heating water, as for the case of this study, a minimum temperature should not be less than about 50 °C. On the other hand, the maximum temperature could not exceed 100 °C, otherwise, a pressurized HWT is needed and this could be less feasible in economic terms. The maximum range of HWT temperature depends also on the systems’ sub-components.
In order to implement a HWT for storing tidal energy, solutions on how to warm up the DHW at various temperature differences have to be found. A possible solution could be the one of implementing smart high rated heat exchangers, by which even with smaller temperatures differences water can still be heated up. Another aspect to be considered concerns how to practically deliver water at the right temperature. For example, a solution would be to install automatic temperature controller faucets. In this way, energy could be saved and high domestic water temperatures dangerous to users could be avoided.
5.1. HWT Control Strategy
Depending on the month or occupancy, in order to reduce losses and to increase the functionality of the HWT medium, a control system would be beneficial. This was proved by results of simulations run with a basic control strategy implemented. More in detail, for investigating to which extend HWTs losses could be reduced, a second set of simulations regarding same 6 cases (by controlling maximum temperature) were run. The aim of the control strategy implemented was to raise the temperature to a tuned maximum value of HWT temperature. This indicated that losses could be slightly reduced when the control strategy is applied. Results for this case are reported in
Table 6. In particular, daily ranges of temperature were calculated for establishing the minimum heat to store, this later needed to satisfy the demand during energy storage days.
5.2. Viability
Depending on particular remote communities, different implementations of the idea proposed could be developed. In order to quantify the viability and potential economic advantages of the proposed idea, various factors must be investigated individually.
Tidal power, thanks to its characteristics, can be a very valuable form of renewable energy source. Differently, to other clean energy resources, tidal energy can provide a minimum of base load and predicted firm power. These characteristics could give a particular community very low dependence on conventional resources. Nevertheless, various obstacles exist; these are mainly: technical; economical; consensus; and political issues.
Technically, the idea of storing tidal energy for neap days can be more feasible if consumption is reduced as much as possible and large enough HW volume is used. In order to accomplish this, relatively large volumes of HW are needed. Due to the fact that the cost per cubic meter of storage unit highly depends on HWT dimensions, the cost could decrease significantly if enough large HWTs are used [
25]. Therefore, tidal energy storage could be feasible if large reservoirs of HW are chosen, and these used for satisfying the total demand of a certain number of households. In this circumstance, district heating schemes with tidal energy integration may definitely be more feasible. However, the efficiency of a wide pipe network and the performances of the HWT storage facility should be precisely assessed. In practice, if users are located too distant from the central HW reservoir the feasibility of such a possibility could be less.
Considering the case of applying the proposed idea in a community which is poorly connected to the electricity network, this would also bring other potential benefits. For example, in the case that multiple renewable energy intermittent generators exist, and these are combined with the thermal energy storage facility. Assuming that a number of remotely opportunely controlled HWTs are available, these could be used to absorb the extra power and directly stabilize the grid. In this way, expensive infrastructure can be avoided. Thus, community interests may be satisfied and large HWTs investment could be more realistic. In order to make this possible, a local incentive mechanism may be necessary.
On the other hand, day scale (short term) variability of tidal power can be highly reduced if HW storage is used in a large number of single houses. This will not require oversized HWTs but it will require merely specific smart timers or remote control systems to be implemented on commercially available electric boilers. This has already been done for stabilizing the grid and the technique is normally referred to as demand-side management or peak levelling methods. Nevertheless, if storage volume of traditional HWTs is not increased, the variability related to neap-spring tidal cycle cannot be locally reduced.
5.3. Economic Reflections
Energy storage with tidal energy could be applied in different circumstances and, depending on characteristics of the context, the scale of storage utility and logistical scenario, this could be economically viable or not. Economic advantages can be evaluated in terms of capability of tidal power and energy storage utilities to replace conventional generation resources. For instance, the idea may be practical in economic terms for those remote settlements where the price of diesel due to shipping costs is high.
Compared to other renewable energy technologies, the costs of tidal stream power plants are still greater [
26]. In addition, due to the fact that tidal power is a relatively new form of technology, financial risks related to it are still not properly quantified yet. The trend in the industry is to go bigger. For large plans, the technology costs per installed Kilo-Watt of rated power are less. In addition, it has to be considered that the cost of a cubic meter of hot water storage facility rapidly decreases with the increment of the dimensions of the storage medium. For these reasons, the idea proposed would be more feasible in economic terms if large enough both, tidal power and thermal energy storage plants are developed.
If large HWTs are installed, SH and DHW demand could, in theory, be satisfied entirely by tidal power. Consequently, in cold regions where much of the domestic energy is spent on water heating purposes, a large amount of conventional power plants can be replaced. However, due to the costs of tidal power plants and large HWTs, this could be feasible only if large funds with low-interest rates are available for relatively long periods.
A tidal energy storage facility in domestic households could suit remote off-grid communities or in some cases settlements where transmission infrastructure to main electricity network (for instance grid connected islands) has reached its limit of capacity. In this latter case, the proposed idea would be multifunctional. Meaning that on one hand such a system would allow a community to be more self-sufficient for energy production and, on the other hand, the system would help to balance the electrical network. In this way, other expensive systems may not be required.
Indeed, one of the main functionalities of large HWT facilities integrated with tidal energy could concern local electricity network stability and providing community-wide economic benefits. As in the case of particular islands or coastal communities, by remotely controlling HWTs, local electricity networks could be stabilized. The method, known as peak shaving, is used with other forms of renewable energy resources such as wind power. The system could be also systematically extended so to be used for stabilizing the output of other form of renewable energy resources. For instance, considering a scenario where tidal power is highly exploited, taking into account predicted variability of local tidal power resource, a methodology for maximizing the peak shaving functionality of HWT facilities, could be created.
Consequently, by installing HWTs and by implementing adequate control systems the electricity network could be greatly balanced and community-wide compensations may occur. Depending on which percentage of other renewable energy sources exist in a local community energy portfolio, the proposed idea may become more profitable. Indeed, in the case that a properly planned large HW reservoir could be constructed; this could be fed by peak power outputs of tidal and as well by other renewable energy resources such as wind or solar power. Thus, the high variable power output of also other renewable energy generators may be smoothed down by producing and storing hot water so that expensive other storage methods and system infrastructure may not need to be bought. Despite this, various economic factors, such as the one concerning to costs related to thermal and power losses must be weighed against the potential economic benefits that the idea could provide.
Given the predictability of tidal power and its type of variability, precise economic evaluations can be made years in advance and thus investors could have large advantages compared dealing with other renewable fed energy storage plans. Indeed, a company managing a large HW reservoir integrated with tidal energy for domestic use purposes could precisely plan firm power output, which will feed the storage utility. Assuming that the company manages both, the tidal power station and other energy sources, can appropriately decide (considering time-varying costs of electricity and depending on other renewable energy input) to sell or store tidal energy output.
The proposed idea before being applied to a particular community should be carefully assessed also considering local characteristics. A detailed technical and economic study would be required, which should include an extensive cost-benefit analysis. Depending on the local actual cost of energy, on the grid connection availability and on building layout, the idea could be moulded accordingly. For each particular case, the system proposed should be tailored so that the overall system cost can be somehow justified. Given the finding of this study, for economic viability issues, it is indicated that thermal energy losses are an important aspect on which particular focus is required. For instance, considering single houses the system proposed may be more convenient in economic terms if multiple hot water reservoirs, having different insulation characteristics and costs, are installed. The hot water stored in the most insulated tank would be used only during critical days when tidal energy availability is at its lowest. In this way, part of the energy losses may be further reduced. In general, evaluating various options is essential; considering the case of applying the concept to a few isolated buildings, different storing technologies such as conventional large batteries may be more economically viable. Nevertheless, in order to implement the proposed concept, a series of other possibilities exist. These may also concern mixed type of design, which could incorporate classical sources of energy for heating water such as electricity from the grid, from diesel generators, or electricity obtained from other local renewable energy generators as wind turbines or solar panels. Likewise, similar systems including multiple types of energy storage technologies may also be investigated. In any circumstance, a specific technical and economic study, which includes as many as possible details and characteristics of the buildings and the location considered, is essential. Thus, in this way it is possible to identify a specific system design and to optimize and estimate the overall system cost.
6. Conclusions
In this paper, the concept of utilizing and storing tidal energy for domestic use was investigated. A generic system was hypothesized and through a numerical study, this was assessed. For this purpose, time domain simplified SIMULINK models were produced and considerations about possible issues, implementation circumstances, designs, economics and control strategies were discussed.
The simulations of idealized configurations for a year period were run and consequently, it was found that, for using stored energy during low energy output days, relatively larger HWTs rather than the traditional ones are needed. It was found that even solely for domestic hot water (DHW) demand, due to the dimension of the hot water tank (HWT) needed for what concerns single household, the system is less convenient. However, by looking at the performance of a case concerning ten families, it was found that economies of scale could be advantageous. In particular, for the case concerning a single household, HWT losses are high compared to demand and thus the efficiency of the system can be low. On the other hand, depending on the dimensions of the storage utility, the system efficiency can be much higher. Besides, to reduce HWT volume and thus increase efficiency, demand should be reduced as much as possible. As a consequence, it is advised that energy-saving designs and solutions should be implemented to improve the effectiveness of the proposed system.
Concerning the third case related to applying the idea for providing both DHW and space heating demand to a single household, it was found that even for a low-energy house the volume of HWT should be relatively large, i.e., 5 m3. Considering that an oversized HWT is needed for only about 6 months, year-average HWT losses make the solution challenging to be implemented, both in technical and economic terms. However, figures were found that indicated that possible HWT control strategies could slightly reduce losses. In this way, to some extent, the viability of the system could be incremented.
The study indicated that even if the proposed idea may be relatively expensive to implement, this is technically feasible. In addition, considering remote communities, possible potential economic advantages may in some cases exist. Without bearing in mind financial and technical challenges that must be overcome, the most suitable circumstances in which the idea could be reasonably applied are: The one concerning relatively large implementations, such as district heating schemes and for buildings compounds; and the one concerning absorbing local short-time power surplus locally generated.


