Article

An Embeddable Strain Sensor with 30 Nano-Strain Resolution Based on Optical Interferometry

1
Department of Electrical and Computer Engineering, Missouri University of Science and Technology, Rolla, MO 65409, USA
2
State Key Laboratory of Coastal and Offshore Engineering, School of Civil Engineering, Dalian University of Technology, Dalian 116024, China
*
Author to whom correspondence should be addressed.
These authors contributed equally to this work.
Inventions 2018, 3(2), 20; https://doi.org/10.3390/inventions3020020
Submission received: 3 March 2018 / Revised: 28 March 2018 / Accepted: 31 March 2018 / Published: 4 April 2018
(This article belongs to the Special Issue Structural Health Monitoring and Their Applications Across Industry)

Abstract

:
A cost-effective, robust and embeddable optical interferometric strain sensor with nanoscale strain resolution is presented in this paper. The sensor consists of an optical fiber, a quartz rod with one end coated with a thin gold layer, and two metal shells employed to transfer the strain and orient and protect the optical fiber and the quartz rod. The optical fiber endface, combining with the gold-coated surface, forms an extrinsic Fabry–Perot interferometer. The sensor was firstly calibrated, and the result showed that our prototype sensor could provide a measurement resolution of 30 nano-strain (nε) and a sensitivity of 10.01 µε/µm over a range of 1000 µε. After calibration of the sensor, the shrinkage strain of a cubic brick of mortar in real time during the drying process was monitored. The strain sensor was compared with a commercial linear variable displacement transducer, and the comparison results in four weeks demonstrated that our sensor had much higher measurement resolution and gained more detailed and useful information. Due to the advantages of the extremely simple, robust and cost-effective configuration, it is believed that the sensor is significantly beneficial to practical applications, especially for structural health monitoring.

Graphical Abstract

1. Introduction

The measurement of strain is of high importance in many applications, from experimental labs to structural health monitoring (SHM), aerospace, civil engineering, and nanotechnology [1]. Over the past decades, optical fiber strain sensors have attracted much research interest and have been extensively reported in literature [2,3]. In comparison with conventional electromechanical sensors, optical fiber strain sensors offer great advantages, such as small size, high sensitivity, high resolution, immunity to electromagnetic interference, and distributed sensing and multiplexing capability [4,5,6].
One of the most widely-explored optical fiber strain sensors is the fiber Bragg grating (FBG) sensor due to its ultra-high sensitivity and high resolution [7]. A number of high-resolution FBG strain sensors based on complex structures have been developed, including Fabry–Perot configuration [8,9], π-phase shifted gratings [10,11] chirped gratings [12], and sampled structures [13]. For instance, Gagliardi et al. demonstrated a strain measurement at the 10−13 ε·Hz−1/2 scale using an FBG resonator with a diode-laser source which is stabilized against quartz-disciplined optical frequency comb [1]; Huang et al. proposed a static-strain sensor with a resolution of 1.0 nε based on a π-phase-shifted Bragg grating, combined with a wavelet threshold denoising algorithm [11].
Optical fiber extrinsic Fabry–Perot interferometer (EFPI) sensors are also one of the most widely-used optical fiber sensors [14,15,16,17,18]. The majority of reported EFPI strain sensors have a relatively low measurement resolution due to the physical structures of the sensors, such as the well-known fiber-in-capillary structure [19]. From another perspective, EFPI sensors are good choices for ultra-small displacement measurements. Generally, an EFPI consists of two reflecting surfaces, i.e., an optical fiber endface and an external reflecting surface. The distance between the two surfaces (i.e., cavity length) is directly correlated with the output interference signal of the EFPI. If the displacement variation is effectively transferred to the Fabry-Perot cavity length change, which can be typically resolved to one nanometer (nm) or even sub-nanometer [20], a displacement resolution of nm level can be easily achieved. Considering that strain is the fractional length change, with judicious mechanical design and packaging, EFPI sensors can also achieve strain measurements at nano-strain levels.
In this paper, we present, for the first time, a cost-effective, robust, and embeddable optical fiber Fabry–Perot interferometer-based sensor for strain measurements with nanoscale strain resolution. A judicious mechanical structure is constructed in the sensor. The principal sensor part consists of an optical fiber, a one-end gold-coated quartz rod, and two metal shells. The optical fiber endface combines with the gold surface to form an EFPI. The optical fiber is fixed to the left metal shell, while the quartz rod is fixed to the right metal shell. When there is a compressive stress applied to the sensor, the slide will occur between the two metal shells, resulting in a cavity length change of the interferometer. By tracking the change in the reflection spectra, the cavity length change can be determined. Thus, the strain being applied to the sensor can be calculated. The calibration experiment for our prototype strain sensor reveals a sensitivity of 10.01 με/μm with a measurement resolution of 30 nε. An experiment for monitoring the shrinkage strain of a cubic brick of mortar during the drying process was conducted to demonstrate the practicability of the strain sensor. The result was compared with a commercial linear variable displacement transducer (LVDT), demonstrating that our sensor has an excellent performance regarding measurement resolution and reliability.

2. Sensor Structure and Principle

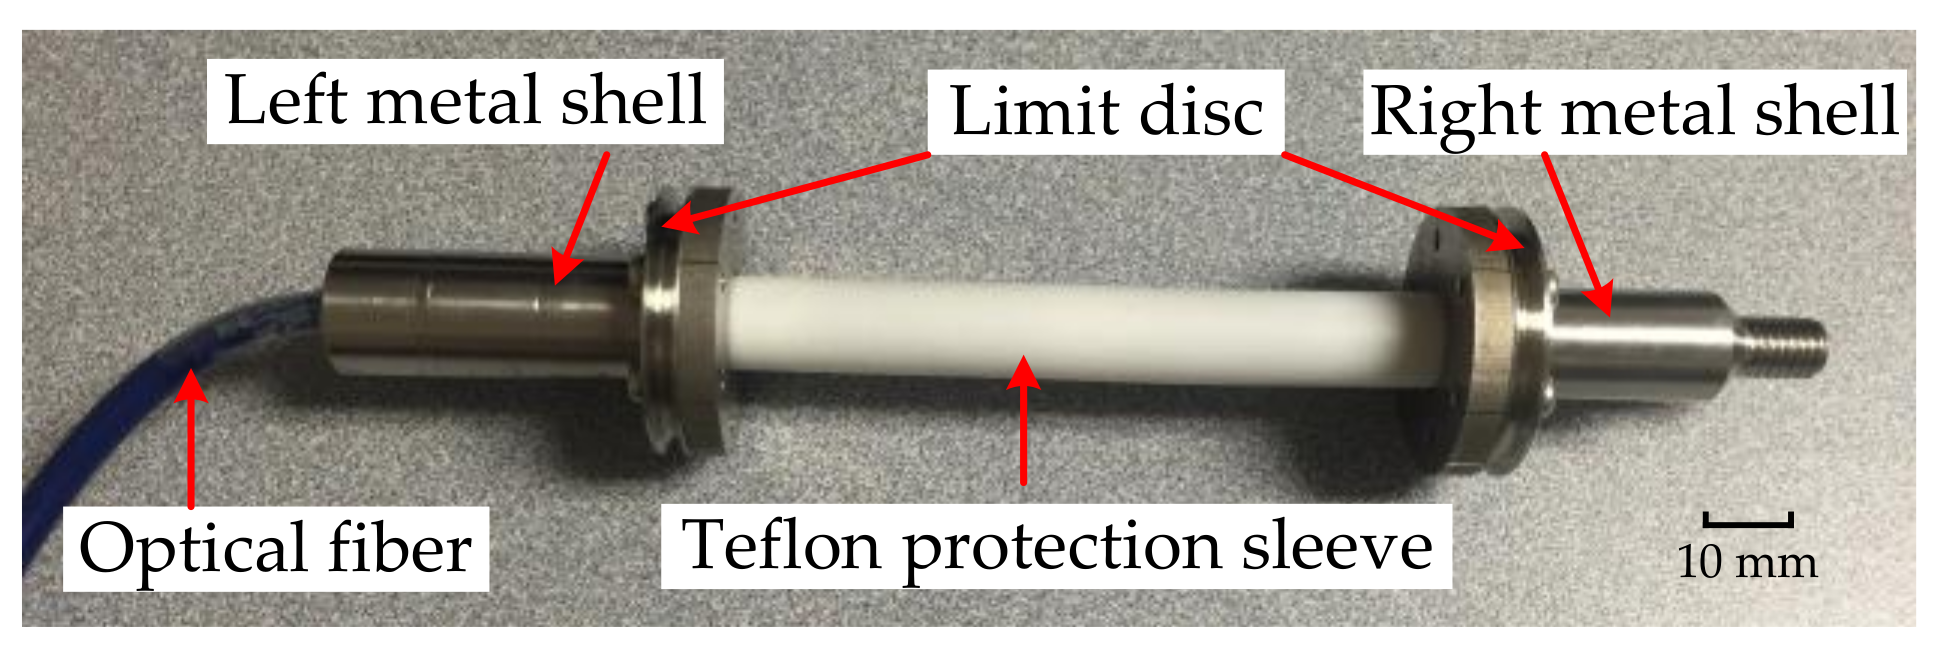
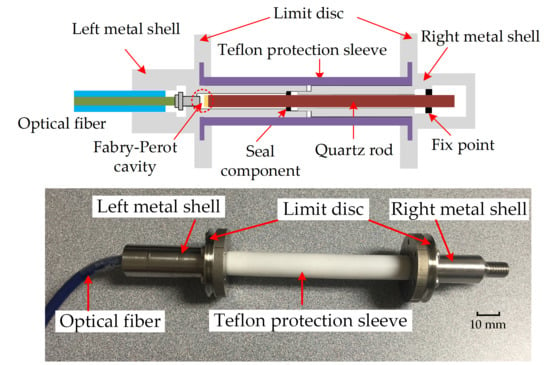
The principal part of the sensor consists of an optical fiber, a quartz rod with one end coated with a thin layer of gold, and two metal shells made of stainless steel. The length of the quartz is 10 cm, and the quartz rod was used due to its small coefficient of thermal expansion (CTE). The quartz rod was fixed to the metal shell at the fix point, which is approximately 4 mm away from the right limit disc, as shown in Figure 1. The gold layer was coated on the endface of the quartz rod by Thermal Evaporation Deposition method, which is about 600 nm in thickness, and has a reflectivity of around 99%. The optical fiber, supported and oriented by an optical fiber ferrule, is inserted into the left metal shell and is permanently mounted to the metal shell; the quartz rod is fixed to the right metal shell. The sensor structure is assembled by inserting the right metal shell into the left metal shell, and the slide between the two metal shells can be considered as a frictionless movement so that the sensor can be used for strain measurements of the materials with low Young’s modulus. As a result, an EFPI with air as the cavity medium is formed by the optical fiber endface and the gold-coated surface on the left end of the quartz rod. When the limit discs on both metal shells are subjected to a compressive stress, the relative slide will occur between the two metal shells, leading to a change in the Fabry-Perot cavity length. The seal component made of rubber and the outer protective sleeve made of Teflon are used to keep the principal sensor structure dust- and water-free. The rubber seal component is also used to avoid the collision between the two metal shells. Figure 2 shows a photograph of our prototype strain sensor. The distance between the two limit discs is 10 cm; the diameters of the limit disc, the Teflon protection sleeve, and the center part of the metal shell are 34 mm, 12 mm, and 8 mm, respectively. It should be noted that the Teflon protection sleeve has little influence on the strain response of the sensor in real-world applications (e.g., mortar shrinkage monitoring) for the following reason. The cross-section areas of the Teflon protection sleeve and the limit disc are 62.8 mm2 and 907.9 mm2; for example, Young’s modulus of Teflon and mortar are 0.5 GPa and 15 GPa, respectively. As a result, the stiffness ratio between the mortar and Teflon protection sleeve can be calculated to be around 430. Hence, the resistance due to the stiffness of Teflon during the mortar shrinkage process can be neglected. The mechanical design and package of the sensor make it capable of being embedded in objects of interest (e.g., mortar, concrete, asphalt, etc.) to continuously monitor the strain in real time. It should be noted that a temperature compensation design is employed in the sensor structure. Considering the right limit disc as a reference position, when the temperature increases, both the metal shell on the right-hand side of the right limit disc and the quartz rod will expand, but in opposite directions (the metal shell will expand to the right, while the quartz rod will expand to the left). Given the coefficient of thermal expansions (CTEs) of the stainless steel and quartz to be 15 × 10−6 K−1 and 0.59 × 10⁻⁶ K−1, respectively, the length of the quartz rod to be 10 cm and the fix point to be 4 mm away from the limit disc, the sensor could theoretically be temperature insensitive.
As stated above, an optical Fabry–Perot interferometer is formed by the two reflecting surfaces, i.e., the optical fiber endface and the gold-coated surface. When an optical signal is coupled into the optical interferometer, multiple reflections occur between the two reflecting surfaces. The reflectance R of this EFPI can be expressed as [21]:
R = R 1 + R 2 + 2 R 1 R 2 c o s Φ 1 + R 1 R 2 + 2 R 1 R 2 c o s Φ ,
where R1 and R2 are the effective reflectivities at the optical fiber endface and the gold-coated surface, respectively; R is the ratio of the power reflected by the EFPI; Φ is the round-trip propagation phase shift of the interferometer. It should be noted that the glass-air interface R1 is ~4%, while the reflectivity of the gold-coated surface is typically greater than 99%. However, the output light from a single-mode fiber (SMF) can be considered as a light ray with a divergence angle (around 8° for an SMF). The larger the cavity length, the smaller the amount of energy reflected back to the lead-in SMF, indicating that the effective reflection intensity of the gold-coated surface (i.e., R2) will be drastically reduced (less than 10%). As such, R1, R2 << 1, Equation (1) can be simplified as:
R = R 1 + R 2 + 2 R 1 R 2 c o s Φ ,
where Φ is the round-trip propagation phase shift of the interferometer, which is given by:
Φ = 4 π n d λ ,
where n is the refractive index of the cavity medium, d is the cavity length, and λ is the optical wavelength in vacuum. According to Equation (3), the round-trip phase shift of the interference signal (4πnd/λ) is directly correlated to the cavity length (d) of the EFPI. The cavity length can be determined by Fourier Transform method. In the sensor design, the change in the distance between the two discs is effectively transferred to the cavity-length change of the EFPI. Once the cavity length variation (Δd) is determined, according to the geometry relationship, the measured strain (ε) can be calculated by:
ε = Δ d L ,
where L is the distance between the two limit discs (i.e., 10 cm). Since the cavity length change of an EFPI can be typically resolved to about 1.3 nm given that the cavity length is 200 µm, the resolution of the OSA is 0.01 nm, and the resonance wavelength is 1550 nm, the theoretical strain resolution of our sensor is calculated to be 13 nε [22].

3. Experimental Results and Discussions

The experimental setup used to calibrate the strain sensor is presented in Figure 3. The optical signal output from a broadband light source (THORLABS, ASE-FL7002-C4) is introduced to the strain sensor through a 2 × 1 3 dB optical coupler, through which the output signal of the sensor is coupled back to an optical spectrum analyzer (OSA, ANDO, AQ6317B, Japan) with a resolution of 0.01 nm. A personal computer (PC) connected to the OSA was used to acquire, record, and analyze the data.
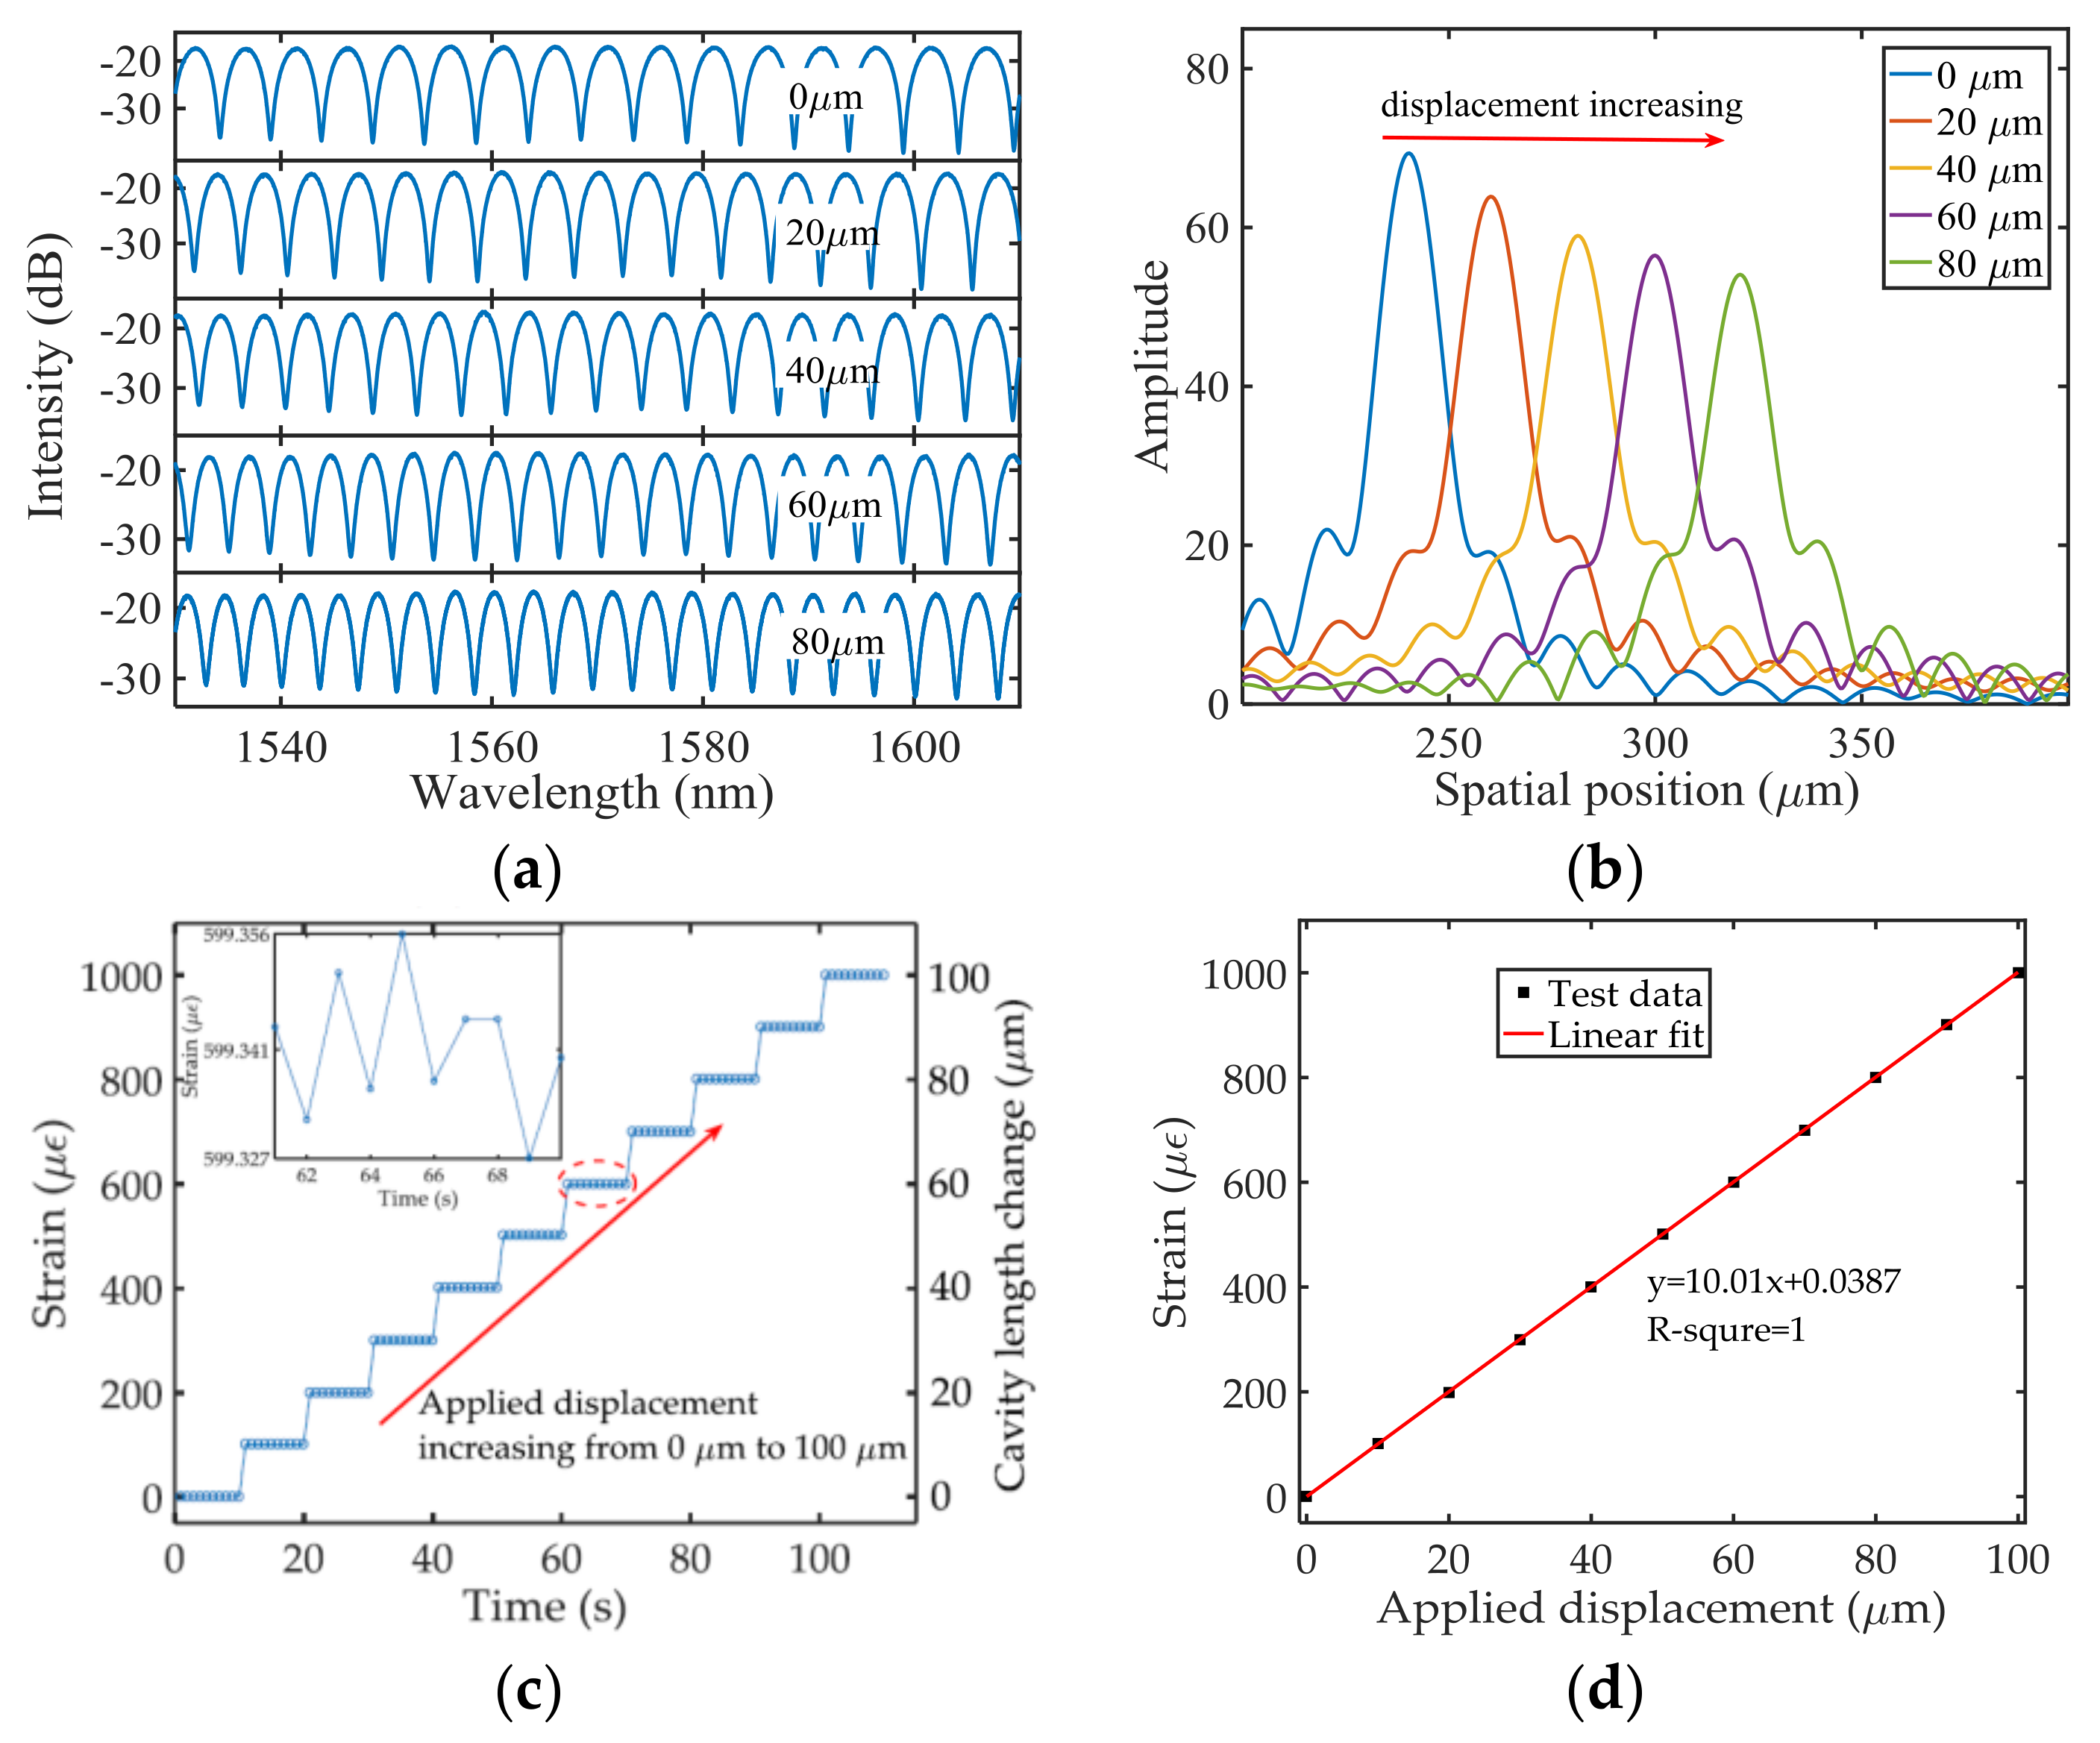
Figure 4 presents the calibration results of the strain sensor. Figure 4a plots the recorded interference spectra for five different displacement measurements. Fast Fourier transform (FFT) was applied to the measured data sets in frequency domain, and Figure 4b shows the results. The peak position (cavity length) shifts to the right, indicating that the cavity length increases with the applied displacement, which matches well with the operation of the experiment. As mentioned above, the larger the cavity length, the smaller the energy reflected back to the lead-in SMF, resulting in a decrease in the peak amplitude in the FFT results. We envision that employing a collimator (e.g., a graded-index fiber with a quarter-pitch length) at the tip of the SMF could improve the fringe visibility and signal-to-noise ratio (SNR) of the sensor, thus increasing the dynamic range of the sensor. The strain is the ratio of the measured cavity-length change to the initial distance between the two limit discs along the quartz rod axis (i.e., 10 cm). In the experiment, the left metal shell part of the sensor was fixed on an optical table, while the right metal shell part was positioned by a translation stage with a step of 10 μm. The translation stage was also fixed on the optical table. During the calibration experiment, we did not assemble the Teflon protection sleeve to the sensor. The displacement applied to the right limit disc was increased from 0 μm to 100 μm. For each setting, 10 measurement data points were recorded. The interrogation unit was set to acquire and record the data every one second. It is obvious that a stair-step response of the sensor was observed. Each step represents a strain response of the sensor. An enlarged part of the measured data is shown as an inset in Figure 4c. As can be seen from the inset, the maximum deviation of the sensor is around 30 nε in a time period of 10 s, indicating that our designed sensor can achieve a nano-strain resolution. The difference between the theoretically calculated measurement resolution (13 nε) and the experimental value (30 nε) is mainly due to the environmental influences, such as temperature variation, vibration, wind flow, etc. In order to minimize the influence of the environmental temperature drift, we kept the measurement time in the calibration experiment as short as possible. Figure 4d plots the measured strain with respect to applied displacement, and a curve fit was applied to the data. The value of R-square equals to 1, revealing a perfect linear relationship between the strain and the displacement applied to the right metal shell. A strain measurement sensitivity of 10.01 με/μm (strain/cavity length change) was achieved by our prototype sensor. The dynamic range of the strain sensor is designed to be 10,000 µε. It should be noted that the strain sensor is user-configurable, meaning that the dynamic range and resolution can be modified by simply varying the gauge length (i.e., distance between the two limit discs).
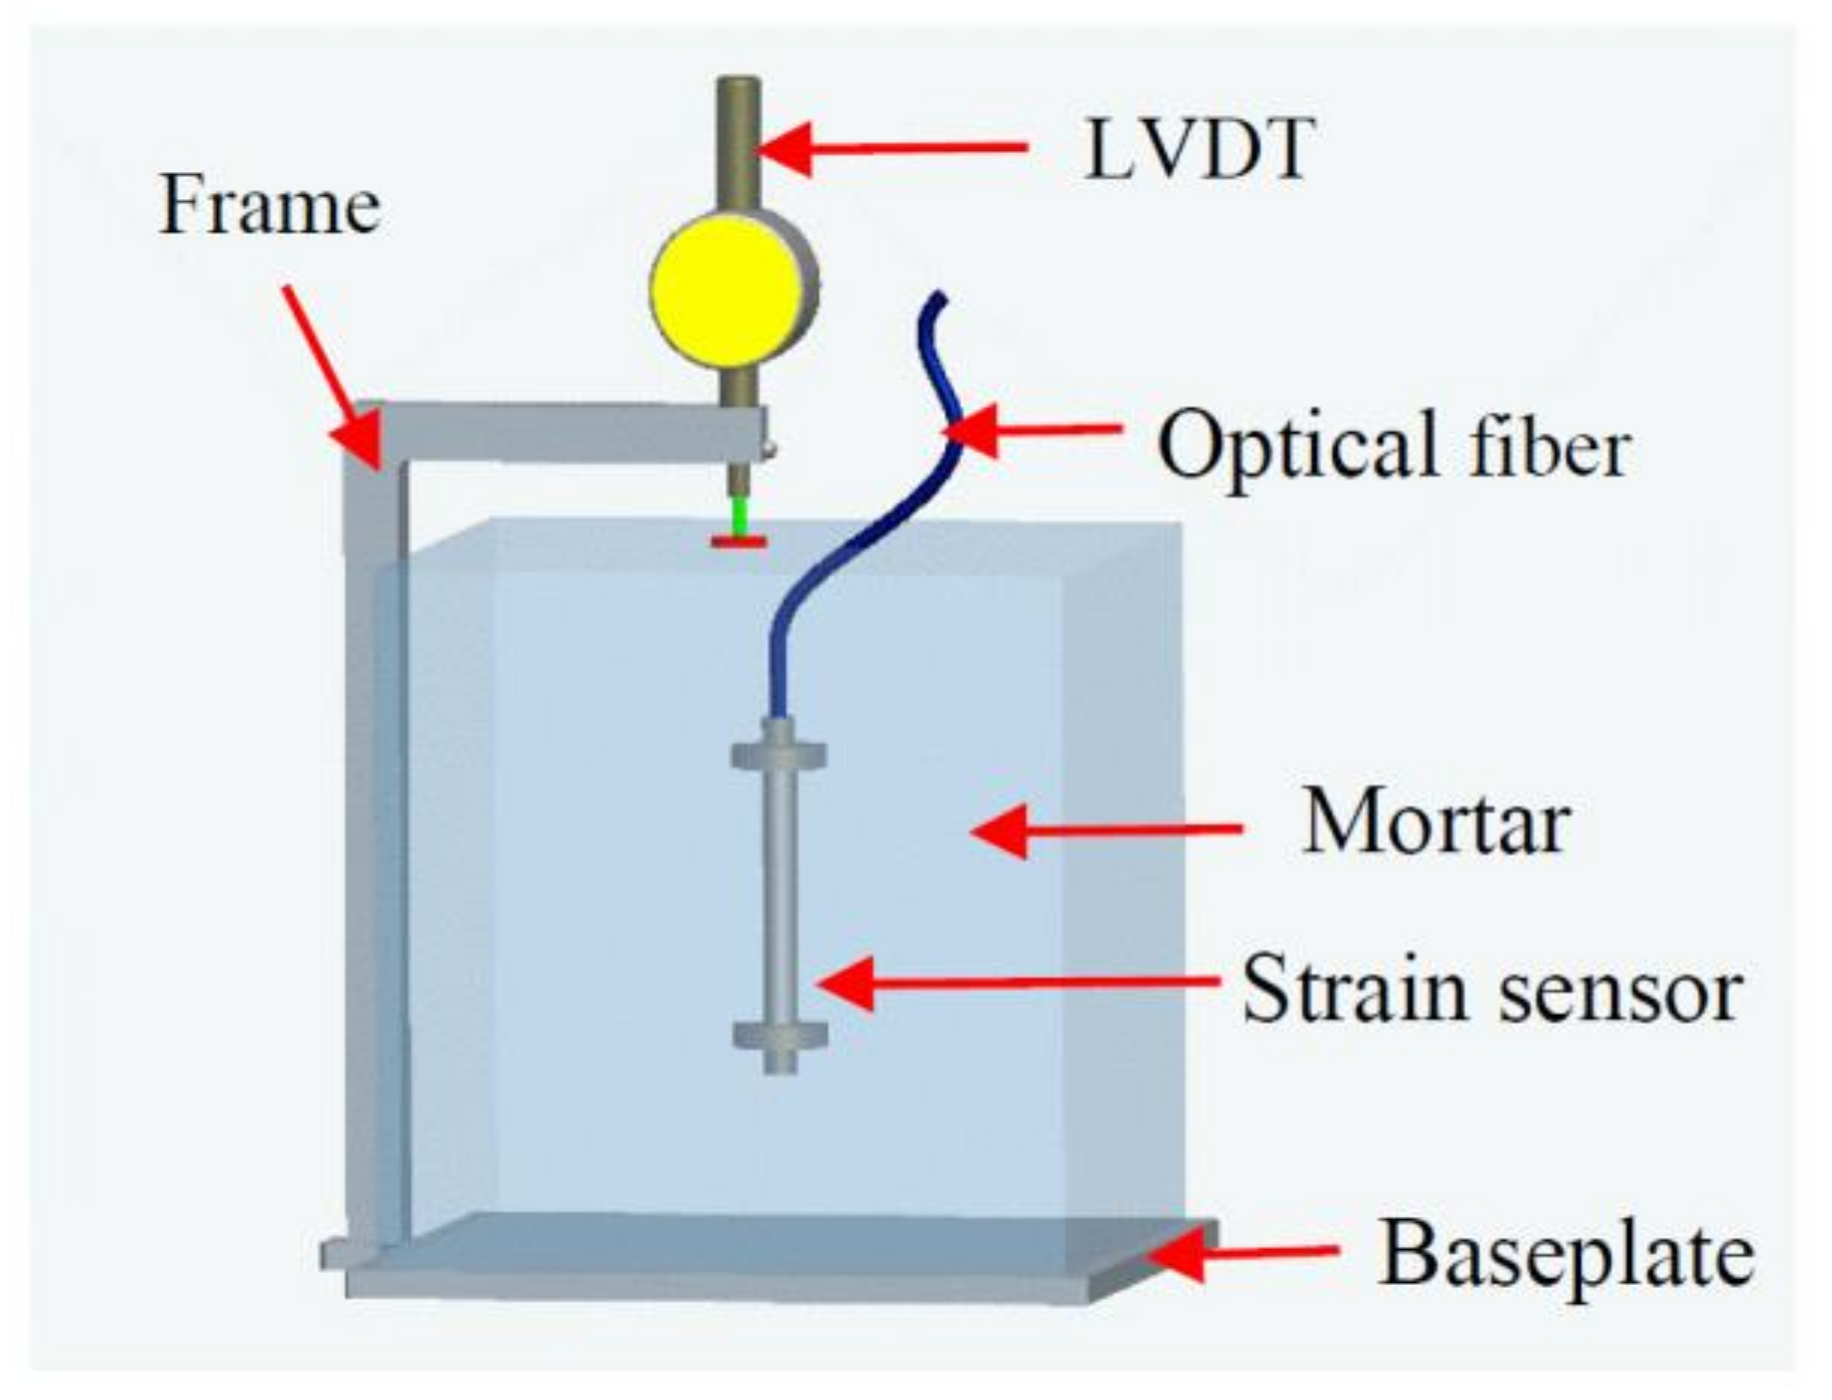
To further demonstrate the utility of our prototype sensor for continuously measuring strain change, an experiment for monitoring the shrinkage strain during the drying process of a cubic brick of mortar was performed. The compositions of the mortar used in the experiment were cement (Sakrete Portland Type-I), tap water, and sand with a weight ratio of 1:0.35:2.81. The mortar was poured into a cubic stainless steel mold with a size of 25 cm × 25 cm × 25 cm. During the pouring, the strain sensor was placed in around the center part of the mold, and the lead in/out optical fiber with the jacket was fixed on a frame to avoid sinking caused by gravity. The Teflon protection sleeve was also assembled to the sensor during embedding. About 3 h later, a stainless steel disk with a diameter of 20 mm and a thickness of 5 mm was put on the center of the top surface of the mortar for holding up against an LVDT in a later experiment. The schematic setup for the shrinkage test of the cubic mortar using our prototype sensor and an LVDT (Eee, QFH-312A, Taipei, Taiwan) is illustrated in Figure 5. The strain monitoring experiment was initiated after the mortar cured for 24 h. Before the experiment, the LVDT was mounted and reset to zero. Throughout the entire period of the experiment, the setup was contained in a temperature-controlled box (±1 °C, KEEN BING, Guangdong, China).
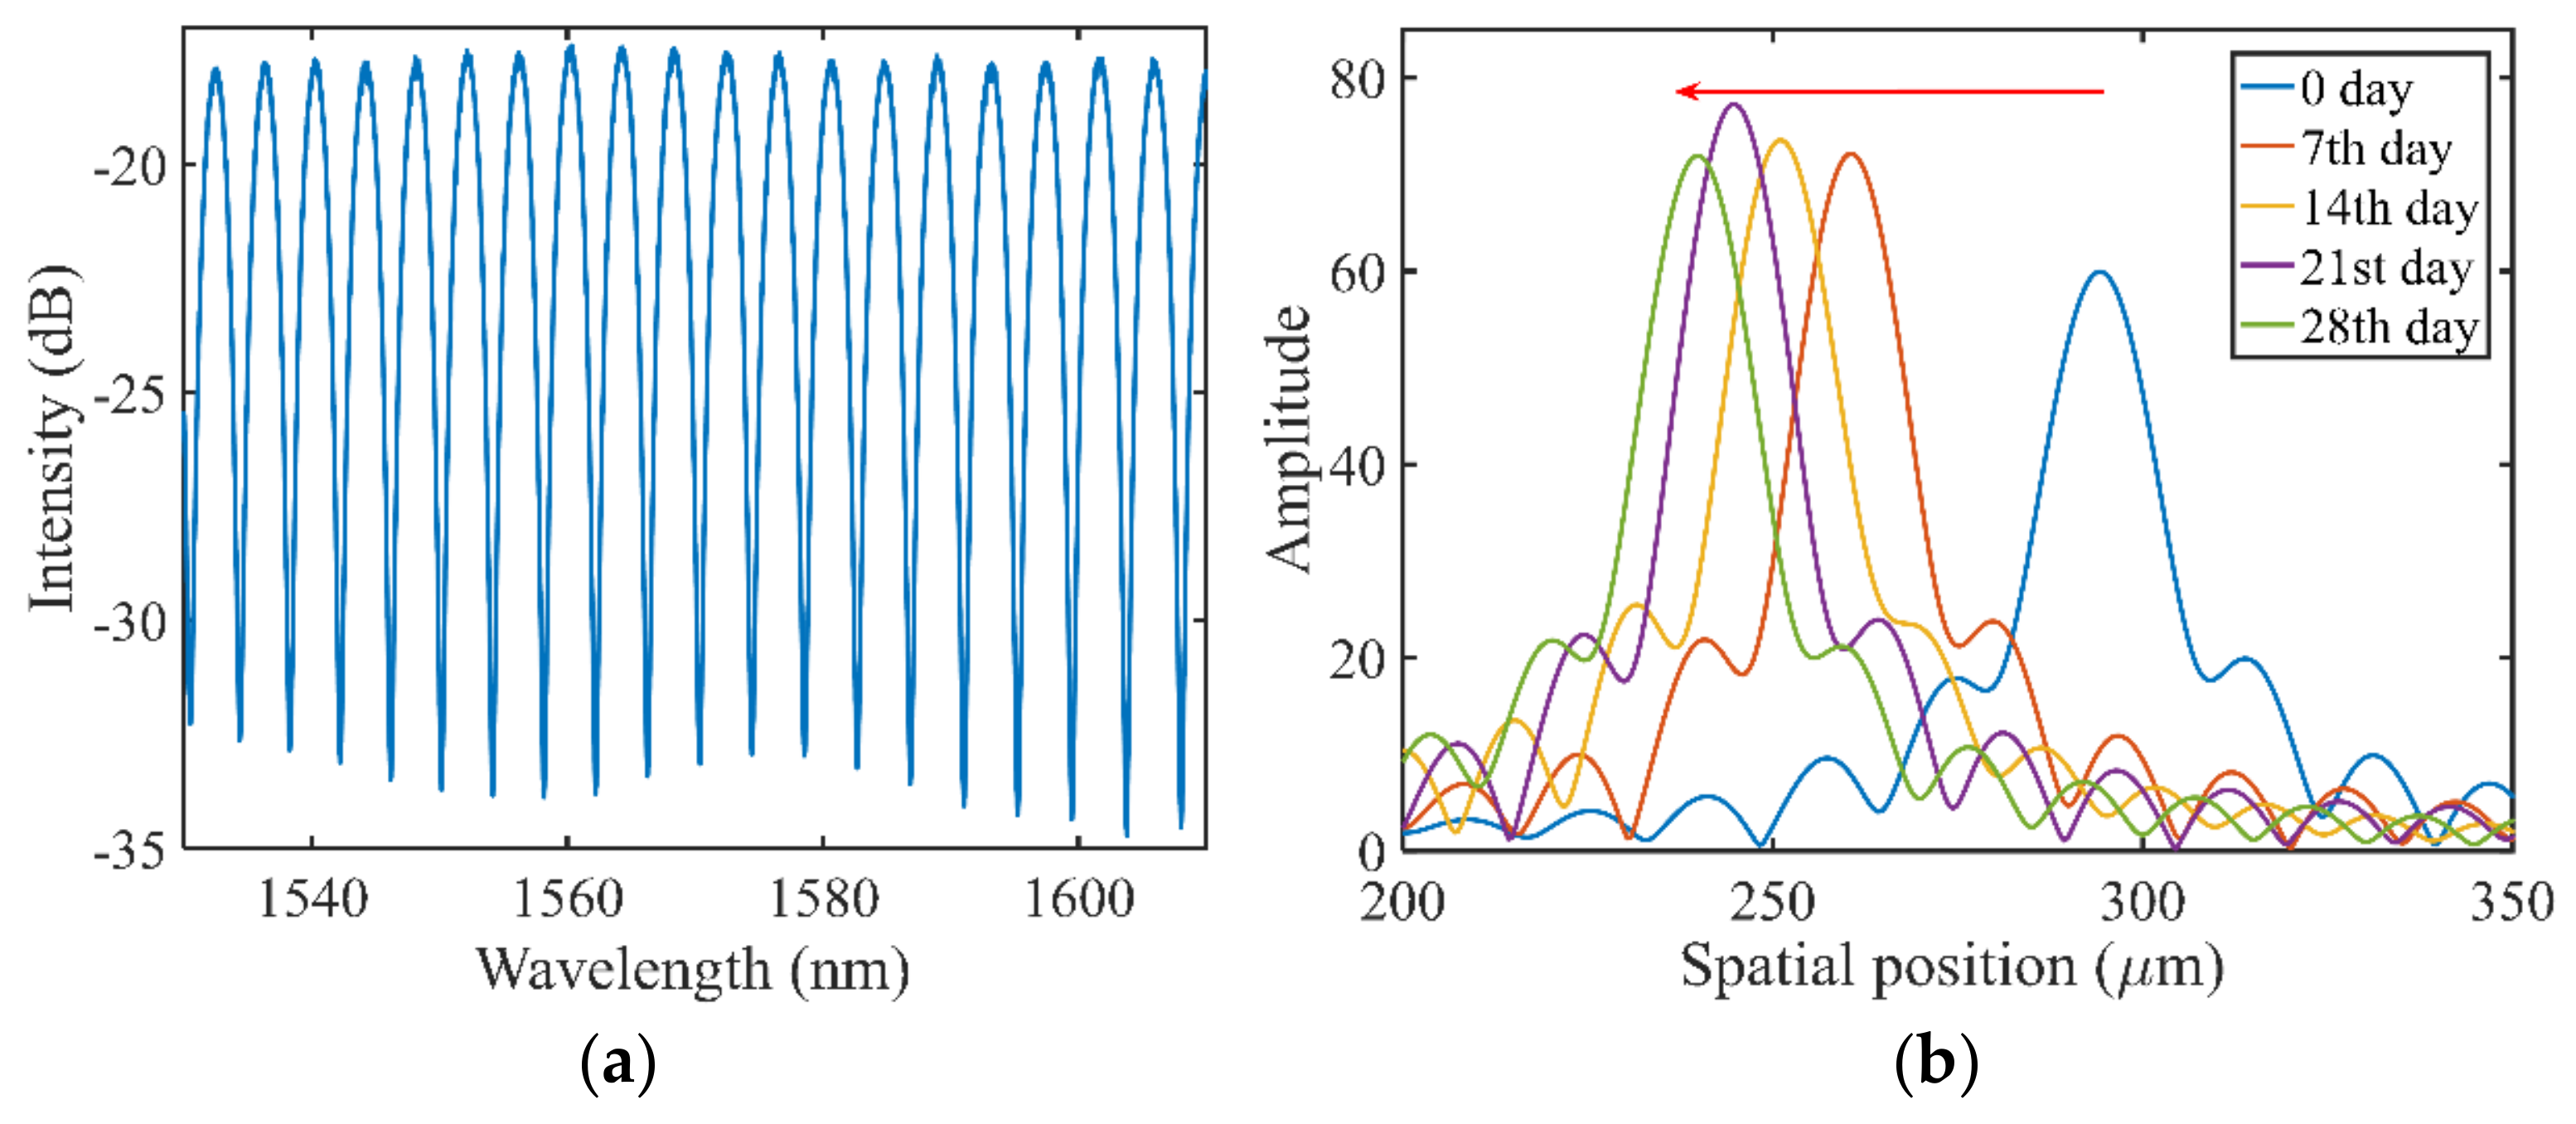
Figure 6a plots the interference spectrum of the strain sensor at the beginning of the shrinkage-monitoring experiment. An interference signal of our sensor with a fringe visibility of more than 10 dB was obtained. As the mortar dried and cured, a compressive stress was applied to the embedded strain sensor, leading to a decrease in the cavity length. A Fast Fourier transform was applied to the interference spectra in the frequency domain. Figure 6b plots the Fourier transform results at five different time points, i.e., 0 day, 7th day, 14th day, 21st day, and 28th day. It can be clearly observed that the peak position (i.e., cavity length) shifts to the left, indicating that the cavity length decreases with time as expected. The air cavity length (i.e., the distance between the optical fiber endface and the gold-coated surface) at these time points are calculated to be 293.7911 μm, 259.6127 μm, 250.5137 μm, 243.7562 μm, and 239.1216 μm, respectively.
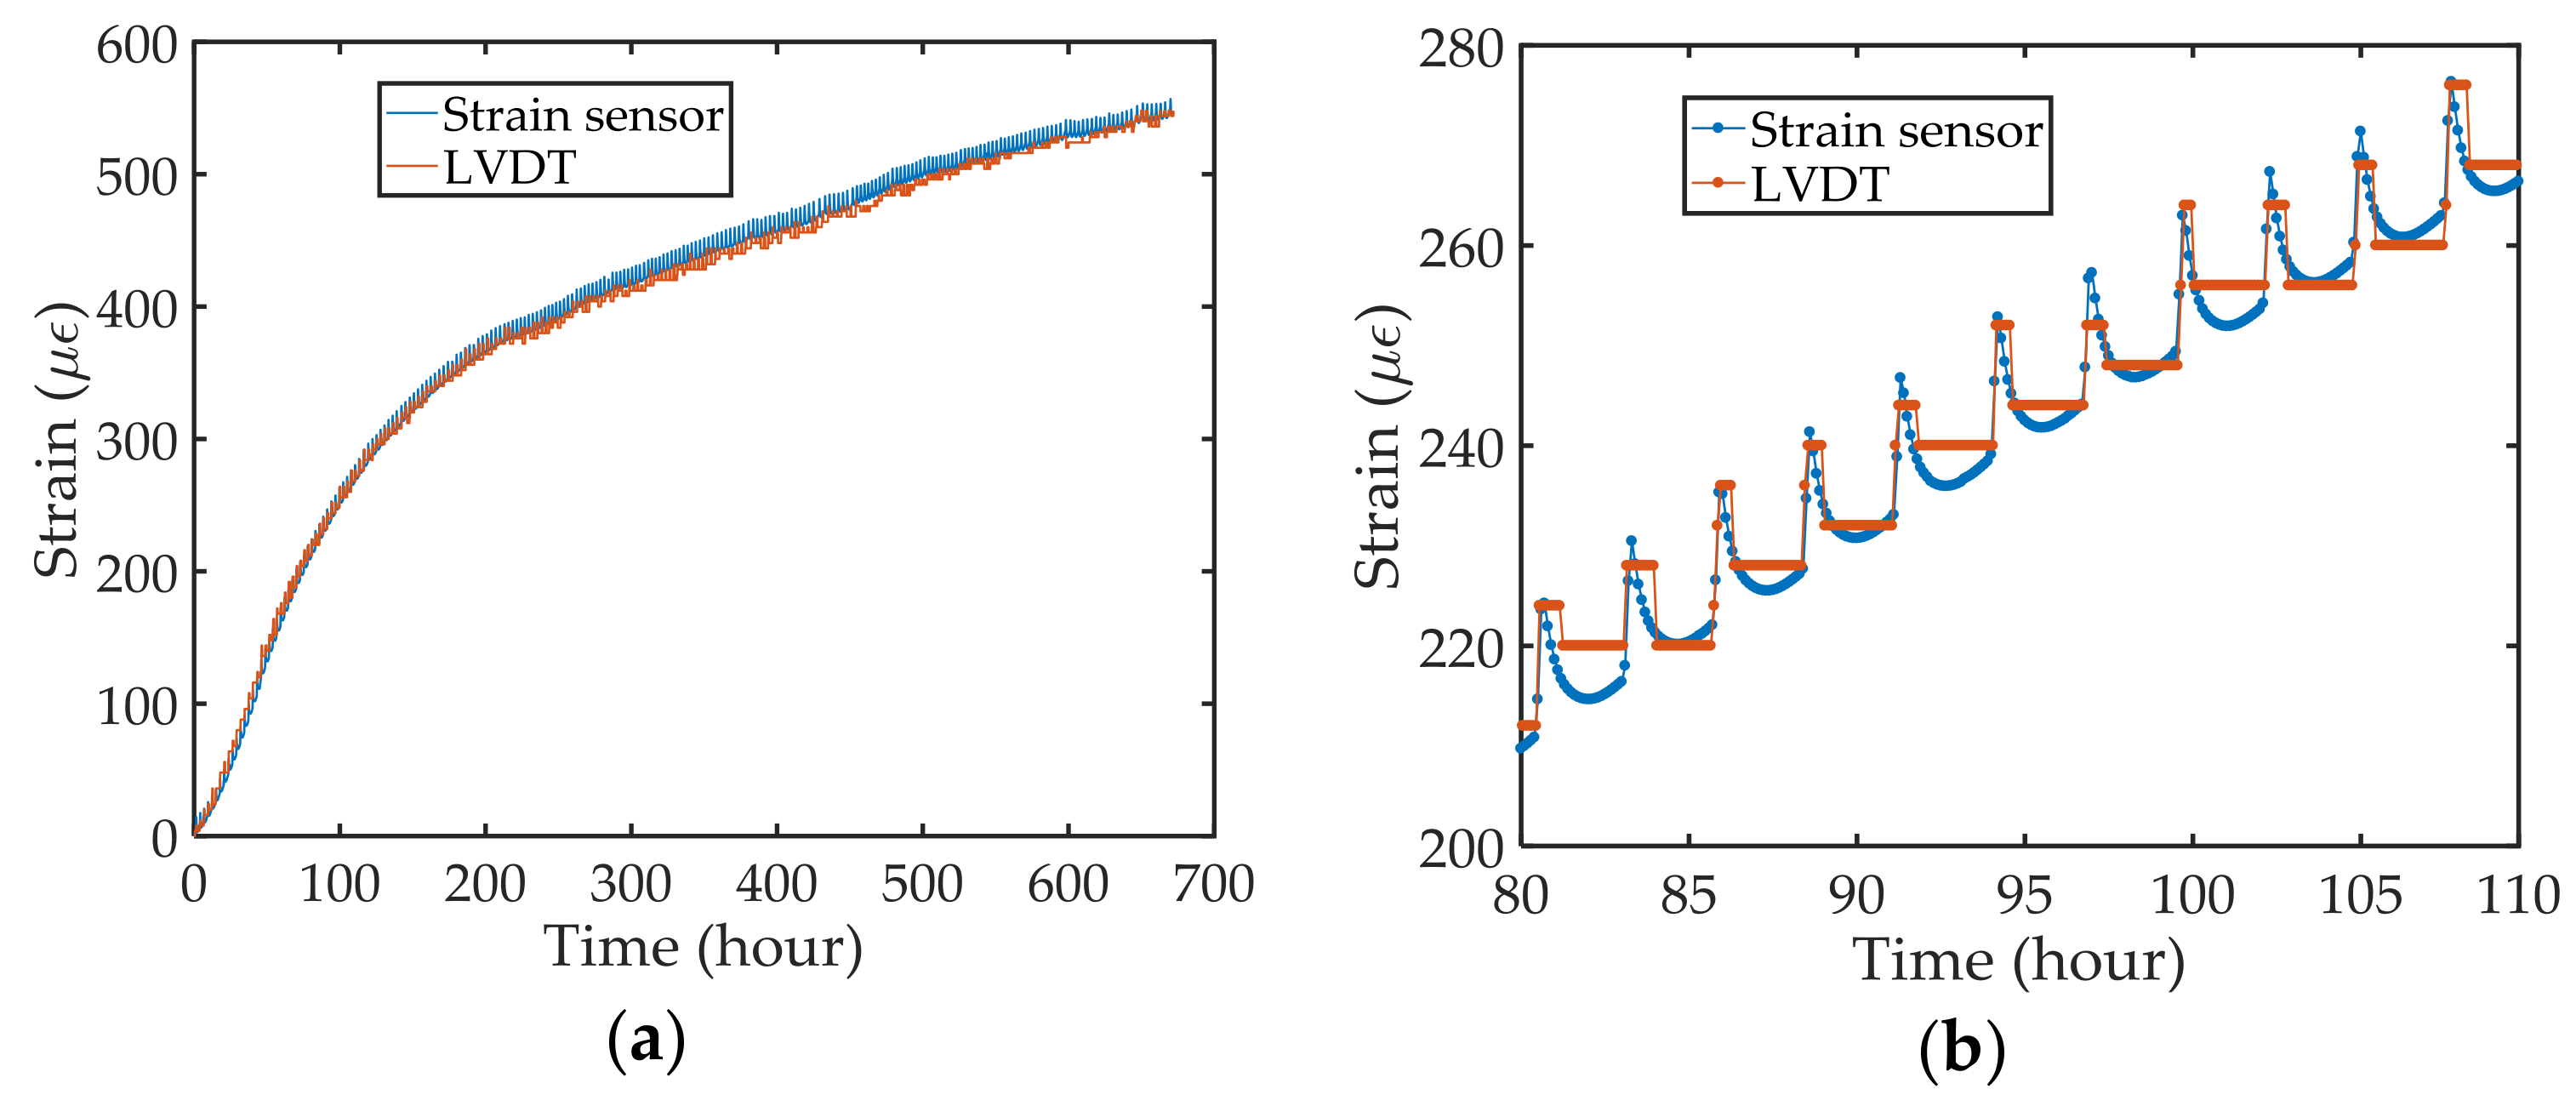
The strain as a function of time monitored by our prototype sensor and the LVDT are shown in Figure 7a. The strain increased as a function of time, which matched well with other research [23]. In the experiment, the sensor and the LVDT were set to record the data every 0.1 h, and the experiment lasted for 28 days. As can be seen from Figure 7a, our strain sensor can continuously work for a long period of time, which is a key factor in real applications, especially in SHM. Figure 7b presents a zoom-in strain data measured by the strain sensor and the LVDT for a period between 80 h and 110 h, respectively. Obviously, our strain sensor has a much better measurement resolution than the LVDT, and it can perfectly quantify the strain-increasing process with a continuous and reliable output, while the LVDT data only shows discrete data points displaced back-and-forth every several microstrains. This is reasonable since our sensor has a strain resolution of around 30 nano-strains, while the LVDT has a displacement resolution of 1 μm, corresponding to a strain resolution of 4 microstrains given the length of the mortar (25 cm). The differences in measured strain after 300 h (Figure 7a) between the strain sensor and the LVDT are because the LVDT monitors the whole mortar shrinkage strain in the vertical direction, while our strain sensor reveals the center strain of the mortar. The small ripples in the measured strain data are caused by the periodic temperature variations in the temperature-controlled box, due to the regulation of refrigeration (approximately 2.7-h cycle). The small ripples represent the temperature-induced fluctuations in the dimensions of the cubic brick of mortar. It should be noted that some alternative interrogation system could be used for the proposed sensor, e.g., three-wavelength digital phase demodulation [24], a swept laser and an optical detector [18], or intensity-based demodulation. However, if a single-wavelength light source is used in the intensity-based demodulation system, the dynamic range of the sensor will be limited—less than λ/4 (λ is the light wavelength)—since the linear response region of the sensor will be the rising/falling curve in the interference spectrum, which is a sinusoidal wave.

4. Conclusions

In conclusion, we proposed, constructed, and tested an optical fiber Fabry–Perot interferometer for strain measurements with nano-strain resolution. The principal sensor structure consists of an optical fiber, a quartz rod with one end coated with gold, and two metal shells. The sensing element, the Fabry-Perot interferometer, is formed by the optical fiber endface and the gold-coated surface of the quartz rod. When the sensor is subjected to a compressive stress, the cavity length of the interferometer will decrease due to the relative slide between the two metal shells. The cavity length change can be found out through tracking the change in the reflection spectrum. The calibration results demonstrated that a measurement resolution of 30 nε and a sensitivity of 10.01 με/μm are achieved by our prototype strain sensor. We believe that we have, for the first time (to the best of our knowledge), demonstrated an embeddable optical fiber FPI strain sensor with 30 nε measurement resolution and 1% (10,000 µε) dynamic range. The dynamic range and measurement resolution can be flexibly designed by adjusting the gauge length. It should be noted that the demodulation system involves a dispersive element to acquire the entire interference spectrum, which is costly and not practical in future field applications. A single wavelength laser demodulation method with advanced phase-tracking algorithm can be further developed to lower the interrogation cost. The practicability of our sensor was also demonstrated by monitoring the shrinkage of a cubic brick of mortar during the drying/curing stage within four weeks. The measured strains were compared with the strain measured by an LVDT, and the comparison results confirmed that our sensor performed better and gained more detailed strain information. For its extremely simple, cost-effective, and robust configuration, this high-resolution strain sensor is strongly believed to be significantly beneficial to practical applications, such as SHM.

Acknowledgments

This research did not receive any specific grant from funding agencies in the public, commercial, or not-for-profit sectors.

Author Contributions

Jie Huang guided the research and supervised the overall project; Jie Huang, Chen Zhu and Yizheng Chen designed and performed the experiments; Chen Zhu, Yizheng Chen, Yiyang Zhuang, Fujian Tang, and Jie Huang analyzed the data; Chen Zhu and Jie Huang wrote the manuscript; Chen Zhu and Yizheng Chen contributed equally to this work. All authors contributed to the discussions.

Conflicts of Interest

The authors declare no conflict of interest.

References

  1. Gagliardi, G.; Salza, M.; Avino, S.; Ferraro, P.; De Natale, P. Probing the ultimate limit of fiber-optic strain sensing. Science 2010, 330, 1081–1084. [Google Scholar] [CrossRef] [PubMed]
  2. Huang, J.; Lan, X.; Wang, H.; Yuan, L.; Wei, T.; Gao, Z.; Xiao, H. Polymer optical fiber for large strain measurement based on multimode interference. Opt. Lett. 2012, 37, 4308–4310. [Google Scholar] [CrossRef] [PubMed]
  3. Dong, B.; Hao, J.; Liaw, C.Y.; Lin, B.; Tjin, S.C. Simultaneous strain and temperature measurement using a compact photonic crystal fiber inter-modal interferometer and a fiber Bragg grating. Appl. Opt. 2010, 49, 6232–6235. [Google Scholar] [CrossRef] [PubMed]
  4. Chen, Z.; Yuan, L.; Hefferman, G.; Wei, T. Ultraweak intrinsic Fabry-Perot cavity array for distributed sensing. Opt. Lett. 2015, 40, 320–323. [Google Scholar] [CrossRef] [PubMed]
  5. Huang, Y.; Liang, X.; Galedar, S.A.; Azarmi, F. Integrated Fiber Optic Sensing System for Pipeline Corrosion Monitoring. Pipelines 2015, 1667–1676. [Google Scholar] [CrossRef]
  6. Li, Y.; Wang, X.; Bao, X. Sensitive acoustic vibration sensor using single-mode fiber tapers. Appl. Opt. 2010, 50, 1873–1878. [Google Scholar] [CrossRef] [PubMed]
  7. Kersey, A.D.; Morey, W.W.; Berkoff, T.A. Fiber-optic Bragg grating strain sensor with drift-compensated high-resolution interferometric wavelength-shift detection. Opt. Lett. 1993, 18, 72–74. [Google Scholar] [CrossRef] [PubMed]
  8. Chow, J.H.; Littler, I.C.; De Vine, G.; McClelland, D.E.; Gray, M.B. Phase-sensitive interrogation of fiber Bragg grating resonators for sensing applications. J. Lightw. Technol. 2005, 23, 1881–1889. [Google Scholar] [CrossRef]
  9. Chow, J.H.; McClelland, D.E.; Gray, M.B.; Littler, I.C. Demonstration of a passive subpicostrain fiber strain sensor. Opt. Lett. 2005, 30, 1923–1925. [Google Scholar] [CrossRef] [PubMed]
  10. Gatti, D.; Galzerano, G.; Janner, D.; Longhi, S.; Laporta, P. Fiber strain sensor based on a π-phase-shifted Bragg grating and the Pound-Drever-Hall technique. Opt. Express 2008, 16, 1945–1950. [Google Scholar] [CrossRef] [PubMed]
  11. Huang, W.; Zhang, W.; Zhen, T.; Zhang, F.; Li, F. π-Phase-Shifted FBG for High-Resolution Static-Strain Measurement Based on Wavelet Threshold Denoising Algorithm. J. Lightw. Technol. 2014, 32, 3692–3698. [Google Scholar]
  12. Gillooly, A.M.; Dobb, H.; Zhang, L.; Bennion, I. Distributed load sensor by use of a chirped Moiré fiber Bragg grating. Appl. Opt. 2004, 43, 6454–6457. [Google Scholar] [CrossRef] [PubMed]
  13. Shu, X.; Chisholm, K.; Felmeri, I.; Sugden, K.; Gillooly, A.; Zhang, L.; Bennion, I. Highly sensitive transverse load sensing with reversible sampled fiber Bragg gratings. Appl. Phys. Lett. 2003, 83, 3003–3005. [Google Scholar] [CrossRef]
  14. Zhu, C.; Chen, Y.; Zhuang, Y.; Fang, G.; Liu, X.; Huang, J. Optical Interferometric Pressure Sensor Based on a Buckled Beam With Low-Temperature Cross-Sensitivity. IEEE Trans. Instrum. Meas. 2018, 67, 950–955. [Google Scholar] [CrossRef]
  15. Zhuang, Y.; Chen, Y.; Zhu, C.; Gerald, R.E.; Huang, J. Probing changes in tilt angle with 20 nanoradian resolution using an extrinsic Fabry-Perot interferometer-based optical fiber inclinometer. Opt. Express 2018, 26, 2546–2558. [Google Scholar] [CrossRef] [PubMed]
  16. Zhu, C.; Chen, Y.; Zhuang, Y.; Du, Y.; Gerald, R.E.; Tang, Y.; Huang, J. An Optical Interferometric Triaxial Displacement Sensor for Structural Health Monitoring: Characterization of Sliding and Debonding for a Delamination Process. Sensors 2017, 17, 2696. [Google Scholar] [CrossRef] [PubMed]
  17. Du, Y.; Chen, Y.; Zhu, C.; Zhuang, Y.; Huang, J. An embeddable optical strain gauge based on a buckled beam. Rev. Sci. Instrum. 2017, 88, 115002. [Google Scholar] [CrossRef] [PubMed]
  18. Zhu, C.; Chen, Y.; Du, Y.; Zhuang, Y.; Liu, F.; Gerald, R.E.; Huang, J. A displacement sensor with centimeter dynamic range and submicrometer resolution based on an optical interferometer. IEEE Sensors J. 2017, 17, 5523–5528. [Google Scholar] [CrossRef]
  19. Zhang, J.; Peng, G.D.; Yuan, L.; Sun, W. Composite-cavity-based Fabry-Perot interferometric strain sensors. Opt. Lett. 2007, 32, 1833–1835. [Google Scholar] [CrossRef] [PubMed]
  20. Zhou, X.; Yu, Q. Wide-range displacement sensor based on fiber-optic Fabry–Perot interferometer for subnanometer measurement. IEEE Sens. J. 2011, 11, 1602–1606. [Google Scholar] [CrossRef]
  21. Xiao, G.Z.; Adnet, A.; Zhang, Z.; Sun, F.G.; Grover, C.P. Monitoring changes in the refractive index of gases by means of a fiber optic Fabry-Perot interferometer sensor. Sens. Actuators A Phys. 2005, 118, 77–182. [Google Scholar] [CrossRef]
  22. Huang, Y.; Wei, T.; Zhou, Z.; Zhang, Y.; Chen, G.; Xiao, H. An extrinsic Fabry–Perot interferometer-based large strain sensor with high resolution. Meas. Sci. Technol. 2010, 21, 105308. [Google Scholar] [CrossRef]
  23. Al-Saleh, S.A.; Al-Zaid, R.Z. Effects of drying conditions, admixtures and specimen size on shrinkage strains. Cem. Concr. Res. 2006, 36, 1985–1991. [Google Scholar] [CrossRef]
  24. Schmidt, M.; Fürstenau, N. Fiber-optic extrinsic Fabry–Perot interferometer sensors with three-wavelength digital phase demodulation. Opt. Lett. 1999, 24, 599–601. [Google Scholar] [CrossRef] [PubMed]
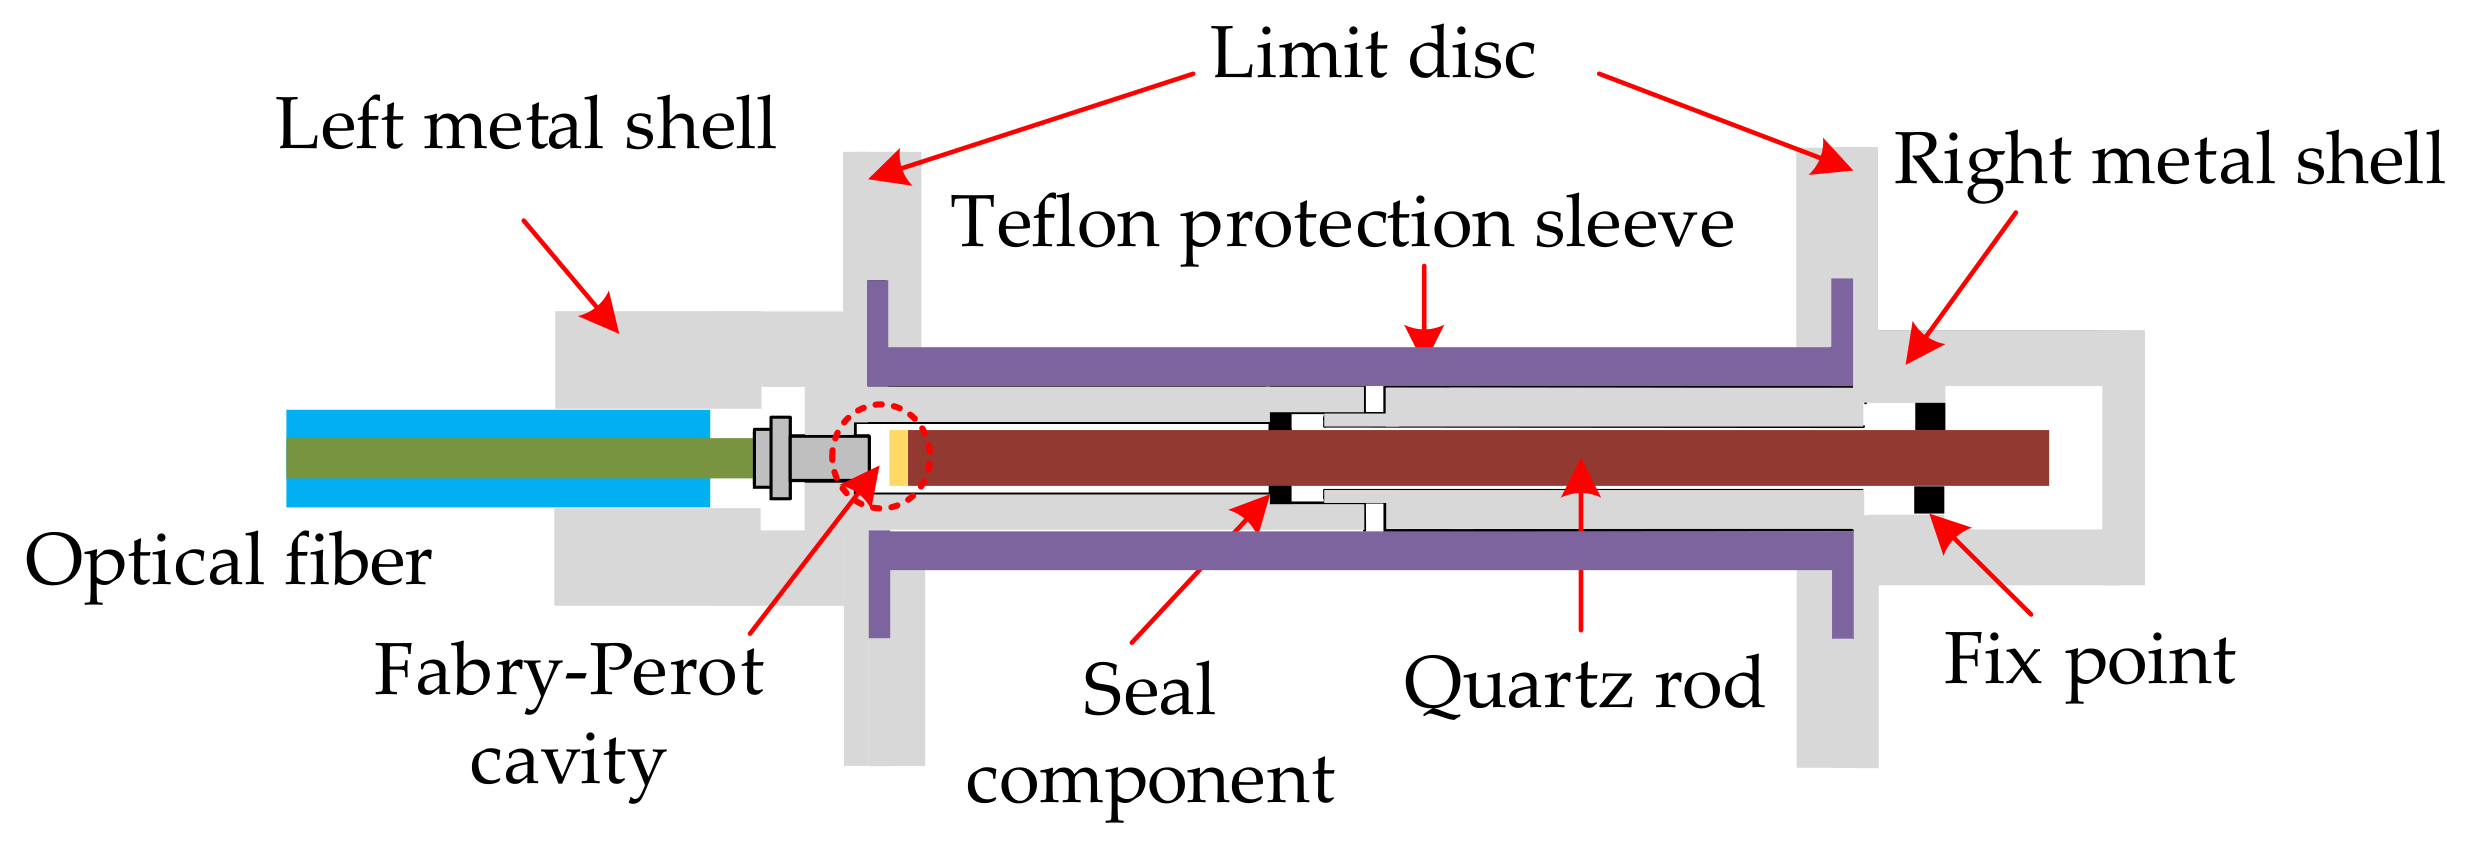
Figure 1. A schematic of the presented strain sensor.
Inventions 03 00020 g001
Figure 2. A photograph of the strain sensor.
Inventions 03 00020 g002
Figure 3. Experimental setup used to calibrate the strain sensor. The left metal shell and the translation stage were fixed on an optical table, while the right metal shell is positioned by a translation stage. PC represents personal computer.
Inventions 03 00020 g003
Figure 4. The calibration result of the strain sensor. (a) The recorded interference spectra for five different displacement measurements: 0 µm, 20 µm, 40 µm, 60 µm and 80 µm; (b) Spatial spectra of the sensor at five different displacement measurements; (c) Cavity length change and strain with respect to applied displacement. In the experiment, the displacement applied to the right limit disc was increased from 0 to 100 μm with a step of 10 μm. In each step, 10 measurement points were recorded. The inset plots the strain under a displacement setting of 60 μm in a time period of 10 s; (d) The measured relationship between the strain and applied displacement. A curve fit was applied to the test data. R-square equals to 1, revealing a perfect linear relationship.
Inventions 03 00020 g004
Figure 5. The setup for the shrinkage test using our prototype sensor and a linear variable displacement transducer (LVDT) for comparison.
Inventions 03 00020 g005
Figure 6. (a) The interference spectrum of the strain sensor at the beginning of the shrinkage monitoring experiment. (b) Spatial spectra of the sensor at five different time points during the monitoring: 0 day, 7th day, 14th day, 21st day, 28th day.
Inventions 03 00020 g006
Figure 7. (a) The strain as a function of time monitored by our prototype sensor and the LVDT, respectively. (b) The strain data measured by our strain sensor and the LVDT at for a period between 80 h and 110 h.
Inventions 03 00020 g007