Article

A Novel Invention for Controlled Plant Cutting Growth: Chamber Design Enabling Data Collection for AI Tasks

by
Jesús Gerardo Ávila-Sánchez
1,2,†,
Manuel de Jesús López-Martínez
1,*,
Valeria Maeda-Gutiérrez
3,†,
Francisco E. López-Monteagudo
3,
Celina L. Castañeda-Miranda
2,
Manuel Rivera-Escobedo
1,
Sven Verlienden
4,
Genaro M. Soto-Zarazua
5 and
Carlos A. Olvera-Olvera
1,2,*
1
Laboratorio de Invenciones Aplicadas a la Industria, Unidad Académica de Ingeniería Eléctrica, Universidad Autónoma de Zacatecas, Zacatecas 98160, Mexico
2
Posgrado en Ingeniería y Tecnología Aplicada, Unidad Académica de Ingeniería Eléctrica, Universidad Autónoma de Zacatecas, Zacatecas 98000, Mexico
3
Unidad Académica de Ingeniería Eléctrica, Universidad Autónoma de Zacatecas, Zacatecas 98000, Mexico
4
Division of Plant and Soil Sciences, West Virginia University, Morgantown, WV 26506-6108, USA
5
Facultad de Ingeniería Campus Amazcala, Universidad Autónoma de Querétaro, Carr. Chichimequillas S/N, Km 1, Amazcala, El Marqués 76265, Mexico
*
Authors to whom correspondence should be addressed.
These authors contributed equally to this work.
Inventions 2025, 10(6), 108; https://doi.org/10.3390/inventions10060108
Submission received: 14 October 2025 / Revised: 14 November 2025 / Accepted: 16 November 2025 / Published: 21 November 2025

Abstract

The Cutting Development Chamber (CDC) design is presented as an innovative solution to crucial human challenges, such as food and plant medicinal production. Unlike conventional propagation chambers, the CDC is a much more comprehensive research tool, specifically designed to optimize plant reproduction from cuttings. It maintains precise control over humidity, temperature, and lighting, which are essential parameters for plant development, thus maximizing the success rate, even in difficult-to-propagate species. Its modular design is one of its main strengths, allowing users to adapt the chamber to their specific needs, whether for research studies or for larger-scale propagation. The most distinctive feature of this chamber is its ability to collect detailed, labeled data, such as images of plant growth and environmental parameters that can be used in artificial intelligence tasks, which differentiate it from chambers that are solely used for propagation. A study that validated and calibrated the chamber design using cuttings of various species demonstrated its effectiveness through descriptive statistics, confirming that CDC is a powerful tool for research and optimization of plant growth. In validation experiments (Aloysia citrodora and Stevia rebaudiana), the system generated 6579 labeled images and 67,919 environmental records, providing a robust dataset that confirmed stable control of temperature and humidity while documenting cutting development.

1. Introduction

With a projected global population of more than 9.7 billion by 2050, traditional farming systems are insufficient to meet demand without compromising limited resources such as water, soil, and energy. This pressure demands technological solutions that maximize production efficiency, reduce waste, and mitigate environmental impact [1]. Methods such as hydroponics, precision agriculture, and the use of artificial intelligence make it possible to optimize growing conditions, adapt to extreme climates, and produce food in urban or arid spaces. Furthermore, innovation not only responds to the quantitative need for food, but also to its nutritional quality. Therefore, 21st century agriculture must integrate science, technology, and sustainability as pillars to ensure a future where humanity’s basic needs are met in a fair and resilient manner [2,3,4]. Propagation by cuttings is a key technique in the vegetative multiplication of plants, used in both commercial horticulture and botanical research. It requires controlled environmental conditions to maximize rooting and shoot growth. For this purpose, specialized chambers provide an ideal environment by precisely regulating variables such as temperature, humidity, and light, adapting to the physiological needs of each species [5].
In recent years, IoT-based monitoring systems have facilitated the continuous measurement of environmental variables such as temperature, humidity, light intensity, and gas concentration within controlled cultivation systems. However, while these technologies allow for data acquisition and remote supervision, they do not inherently provide the analytical capacity to interpret this information or predict plant responses under changing conditions. For this reason, the integration of machine learning models has become essential for transforming raw environmental data into actionable decisions that can optimize growth conditions and resource use in real time [6,7,8,9,10].
Thus, the usefulness of sensors and connectivity technologies in agriculture is strongly linked not only to their capacity to collect data, but to the ability of AI (Artificial Intelligence) systems to analyze patterns, detect anomalies, and support predictive control strategies.
In recent years, AI has become a key tool in modern agriculture, enabling the interpretation of complex environmental and biological data to support real-time decision-making. One of its most prominent applications is the prediction of plant growth under different environmental conditions. Deep learning models have been developed to estimate biomass accumulation, leaf area expansion, and phenological stages using image sequences and climatic variables. This allows researchers and growers to anticipate development patterns and optimize environmental control strategies to improve yield and uniformity in propagation environments [7,11].
Another important application of AI in agriculture is the detection and classification of plant diseases. Convolutional neural networks (CNNs) have demonstrated high performance in identifying disease symptoms directly from plant images, even at early stages where visual symptoms may be subtle [12]. These approaches enable rapid diagnosis and reduce the need for expert inspection, supporting integrated pest and disease management strategies. Real-time monitoring systems, combined with machine learning inference, can trigger alerts and corrective actions in automated growth chambers and greenhouses [13].
Furthermore, AI has been successfully used to predict climatic conditions that can affect plant development in controlled and semi-controlled environments. Recurrent neural networks (RNNs), particularly long short-term memory (LSTM) architectures, have been applied to forecast temperature, humidity, light intensity, and evapotranspiration in greenhouse systems [14]. These predictive models enable adaptive environmental control, helping to reduce energy consumption, prevent stressful conditions, and maintain optimal microclimates for plant propagation and growth [15]. Taken together, these advances demonstrate the importance of AI-driven datasets and controlled experimental environments, such as the cutting development chamber presented in this work.
In this context, plant incubators play a crucial role, providing a controlled environment of factors such as temperature, humidity, light and nutrients, having the ability to be modified at will. These types of systems allow for the study of plants under different conditions, simulating microenvironments that aid in plant reproduction in specific climates and seasons [5]. Focused on the above, the constant current variation in natural climates has increased the importance of using plant incubator systems [7]. These structures allow for the efficient development of plants with specific characteristics and the study of factors that impact growth. These systems allow for the extension of growing seasons, the protection of seedlings, and the study of plant development under precise parameters. This is increasingly relevant given the need for climate adaptation and sustainable production. Although the term “incubator” is often associated with eggs or cell cultures, its environmental control principles apply to plants [16].
Therefore, an adequate design for a plant incubator must respond to the need to accurately maintain and control multiple environmental factors. It has been observed that the optimal combination of temperature, humidity, light, and nutrients can help improve the photosynthetic efficiency of plants, which promotes faster growth. In this regard, the advancement of monitoring technologies has made it possible to integrate real-time sensors for the automated control of environmental variables [17,18,19,20].
One of the challenges faced in the design of plant growth incubators is energy efficiency. This becomes particularly relevant due to the high operating costs associated with climate control and lighting systems. This has led to the exploration of how artificial intelligence algorithms can adaptively regulate environmental conditions, reducing energy consumption compared to traditional methods [21,22]. Table 1 below presents some examples of cutting propagation systems, emphasizing their cost.
Table 1 provides a quick overview of some of the cutting propagation systems found online. The first example (Electric Propagator) refers to a small plastic chamber with features that allow the internal temperature to be raised by approximately 20 °C, but it does not have the ability to lower it [23]. The L Garden HighPro product lacks many features for controlling the chamber’s internal environment; it only has a reflective layer [24]. Like the previous cabinet, the next system (XL Garden HighPro) only has a reflective layer and lacks environmental control features [25]. In contrast, the PERCIVAL E-36L2 system is an advanced tool for seedling development, as it has advanced environmental control features, although its high price is speculated to be a major disadvantage when purchasing it [26].
On the other hand, these incubators do not contain the capabilities for the creation of data sets focused on applications in smart greenhouses, which is why they are searched for on the Internet, where one of the main sources of data sets is Kaggle, this source offers a series of specific data focused on the development of smart greenhouses, these contain detailed information on climate, irrigation, resource consumption and cultivation parameters, all these data obtained from sensors that record variables such as temperature, humidity, light, VOC (volatile organic compounds) and CO2 (carbon dioxide), in defined time intervals, but without relating growth images with these same parameters, below is a summary (Table 2) with the data sets available in Kaggle [27,28].
In contrast to the above, we find data generated synthetically. For this purpose, climate simulators such as TRNSYS, Modelica, and Grinnell (Table 3) stand out. These allow for modeling complex systems and generating data on temperature, humidity, and energy consumption [29,30].
In this sense and trying to solve the problems encountered by databases focused on agriculture and more specifically those related to the training of neural networks that can control intelligent greenhouses. This study presents the design, prototyping, manufacturing and testing of a CDC focused on the creation of databases, with the intention of being used in the training of deep neural networks (DNNs), focused on precision agriculture, all this in relation to the engineering and biology principles that guarantee an optimal environment for plant growth, the key technical components are described, including climate control, lighting and irrigation systems, as well as the advantages and limitations of this technology compared to traditional methods [31]. In addition, the practical implications of the use of cutting development chambers in agricultural production and scientific research are discussed, highlighting their potential to improve efficiency and sustainability in plant propagation [32].

2. Materials and Methods

2.1. Development of the CDC

The design, development, and testing of the CDC were conceived with the primary objective of modifying environmental conditions. This would allow for meticulous experimentation, observation, and recording of changes in cutting growth, thus facilitating optimal root and foliage development in an environment designed and controlled to foster their development.
The proposed methodology focused on creating a comprehensive solution, from its structural design to the implementation of environmental control and monitoring systems. It should be noted that this experiment was developed within the Laboratory of Inventions Applied to Industry at the Autonomous University of Zacatecas.

2.2. Conception and Structural Design

As described in the previous paragraphs, among the problems encountered by users training neural networks targeting agriculture, plant development, and plants are those related to the lack of specific image databases. Focusing on this problem, a prototype to address this issue began to be conceptualized within the industry-focused innovation laboratory.
Previously, to define the functional and operational requirements of the system, consultations were conducted with a group of specialists, consisting of three experts in agroindustry and two experts in neural network applications. The number of experts was determined based on the relevance of their professional experience to the project rather than on conducting a statistical evaluation. Similar methodological approaches, in which small expert panels are used to guide design decisions in early-stage system development, have been reported in the literature [33]. Their contributions were essential for identifying the environmental variables to be controlled, the range of acceptable operating conditions, and the requirements for image acquisition and data annotation.
Current cutting propagation, regardless of scale, faces significant challenges. There is a critical lack of consistent, quantitative data on how specific environmental conditions such as temperature, humidity, light, and CO2 directly influence the individual growth of each cutting. This lack of accurate information prevents the establishment of optimal protocols and, consequently, results in inconsistent propagation results. Uncontrolled environmental variations, lack of individual monitoring, and the absence of detailed history for each cutting lead to low success rates and heterogeneous growth, generating economic losses and delays in research.
Without systematic recording of environmental parameters and cutting development, it becomes extremely difficult to correlate the exact causes of poor rooting or slow growth, limiting producers’ ability to adjust and optimize their methods. Additionally, manual monitoring and tracking of cuttings are inefficient and highly labor-intensive processes, making them prone to error. Following this problem, a survey of 50 users was conducted to determine user needs. This was carried out during the first stage.
Based on the interviews and analysis carried out with the domain specialists, a structured list of requirements was generated. These requirements were grouped into five main functional categories, resulting in a total of 37 basic needs associated with the environmental, structural, operational, and monitoring aspects of the chamber. Table A1 (Appendix A) provides a detailed description of these categories, including the justification and relevance of each need to the controlled development of plant cuttings. Because this table served as the foundation for the conceptual and design decisions presented in this work, it is considered a key element in the methodology and is referenced throughout the manuscript.
Based on the results obtained from the survey, and to define the scope of the design, it was decided to select needs with an average greater than 4.0. Therefore, a modular, digitally controlled chamber is proposed, with an emphasis on data collection, capable of covering 27 needs (Table A1). The conceptualization emphasized not only the functionality of the system but also practical aspects such as robustness, durability, energy efficiency, ease of cleaning and disinfection, and the use of non-toxic internal materials to ensure plant safety. In addition, considerations were given to aesthetics and professional appearance, silent operation, and the possibility of easy replacement of the main components, thereby ensuring minimal maintenance requirements and long-term reliability (Table A1).
Said the above, and in order to facilitate the reproducibility of the chamber, a compact, rectangular, sealed, and opaque enclosure for light control, with a transparent front door for observation. Modularity allows for stacking or connecting multiple units. The transparent front door was also conceived to make access to the cuttings easy and unobstructed while maintaining a professional and aesthetic design suitable for laboratory or industrial environments (Table A1).
The chamber is built with an insulated PLA (polylactic acid) plastic skeleton, internal surfaces made of reflective, non-porous acrylic to maximize light and facilitate cleaning, thermal insulation, and sealed electronic components for protection against moisture [34]. The choice of PLA and acrylic ensured robust and durable construction while also enabling easy disassembly and replacement of components. All internal materials were selected for being inert and not-toxic to plants, thus eliminating the risk of contamination (Table A1).
The chamber integrates various key technologies designed to maintain precise environmental control and enable continuous data acquisition. It includes internal and external temperature sensors, relative humidity sensors, and light intensity sensors, which allow for real-time monitoring and stable regulation of the internal environment (Table A1). The full-spectrum LED lighting system, with individually controllable diodes, enables precise adjustment of photoperiod and light intensity, ensuring an optimal spectrum for photosynthesis while minimizing heat generation and maintaining energy efficiency. Additionally, a programmable misting or drip irrigation system automates humidity cycles, preventing excessive condensation inside the chamber. Active ventilation is provided through filtered extractors and fans that ensure uniform air circulation, dissipate excess heat, and operate at minimal noise levels (Table A1).
To facilitate growth monitoring and data management, the chamber incorporates a movable computer vision camera that periodically captures images to measure parameters such as plant height, leaf number, and leaf area, as well as to detect anomalies.
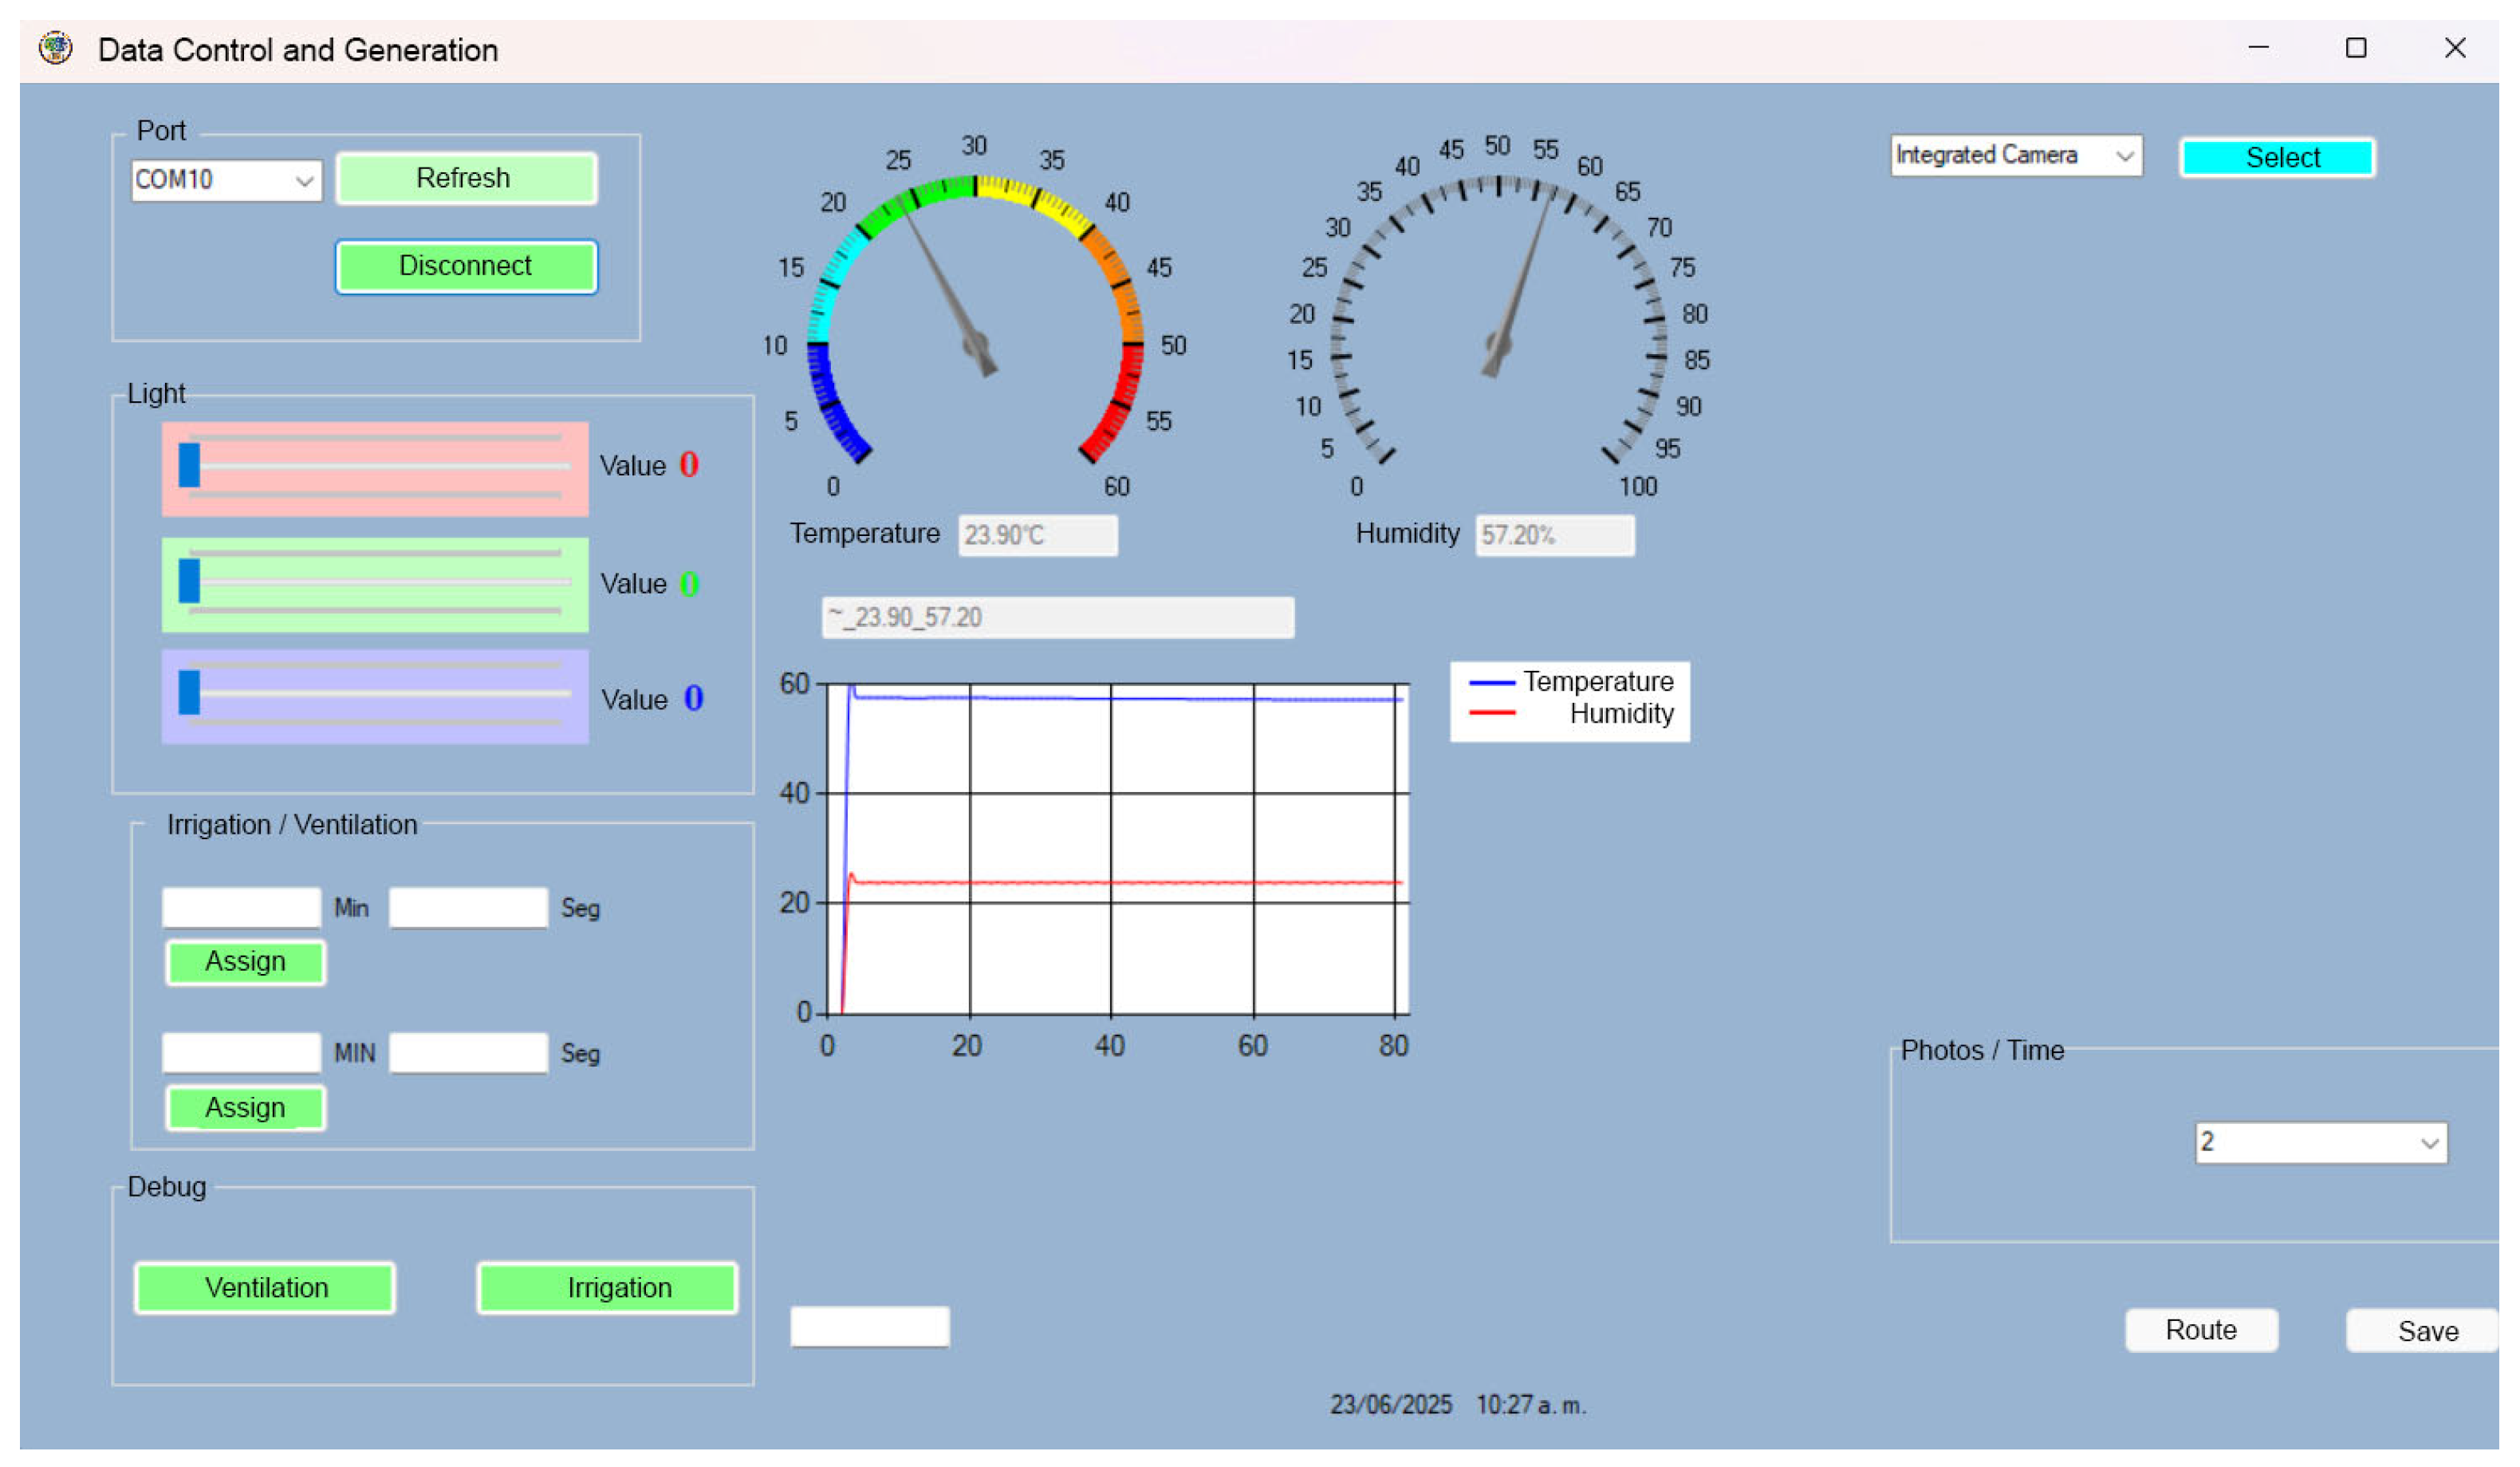
A microcontroller manages all sensors, actuators, and communication tasks. In this way, sensor readings and image data are linked to the unique ID assigned to each cutting and stored in a database, allowing for export in standard formats such as CSV and enabling visualization of trends and recorded variables. Finally, a user interface, available as desktop software v1.0, allows for real-time monitoring and configuration of parameters such as temperature, humidity, light cycles, and growth indicators (Table A1).

2.3. Development and Prototyping

The CDC development process began with a meticulous structural design based on information provided by experts. External dimensions of 40 cm in height, 15 cm in width, and 15 cm in depth were defined, with an internal volume calculated to accommodate cuttings of various species (Figure 1). For proper operation and airflow, the chamber requires a minimum installation footprint of approximately 30 cm in width and 20 cm in depth, ensuring clearance for ventilation and handling. The design was divided into two main compartments, each with a specific function and controlled environment. The Lower Zone (Root Area) was structured to maintain a humidity-controlled environment and support the substrates; its sealed and darkened configuration was necessary to ensure healthy and inert conditions for root development (Figure 1b).
In contrast, the Upper Zone (Foliage Area) was constructed to ensure optimal lighting, ventilation, and smooth air circulation while preventing moisture accumulation and excessive condensation (Table A1), thereby allowing for uninterrupted photosynthesis (Figure 1a,c). Transparent acrylic walls were incorporated to facilitate direct observation of growth and to allow for the integration of rock wool as thermal insulation. Additionally, because the top surface is also used for image acquisition, the chamber cannot be stacked vertically, as doing so would obstruct the camera’s field of view and compromise uniform lighting conditions. The main structural frame of the CDC was designed in SolidWorks v2020 (CAD), as illustrated in Figure 2. This modeling process ensured measurement accuracy and compatibility among components, allowing for precise assembly and seamless integration of the environmental control systems.
During the conceptualization stage, the ability to continuously monitor and record environmental conditions was identified as a critical requirement for ensuring the successful development of the cuttings. Therefore, a digital temperature and humidity sensor (DHT22) was selected as the primary monitoring component due to its precision, reliability, and suitability for controlled environment applications. Its integration from the early design phase ensured that the chamber would be capable of maintaining stable conditions and generating accurate data for subsequent analysis, additionally, the lighting configuration was deliberately designed to include illumination in both the upper and lower sections of the chamber, this decision was based on the phototropic behavior of plants, which tend to grow directionally toward a dominant light source.
By providing balanced lighting from multiple angles, the system prevents excessive directional growth and promotes uniform development of both the aerial and root-associated tissues, ensuring more consistent and healthy morphological formation during the propagation process.
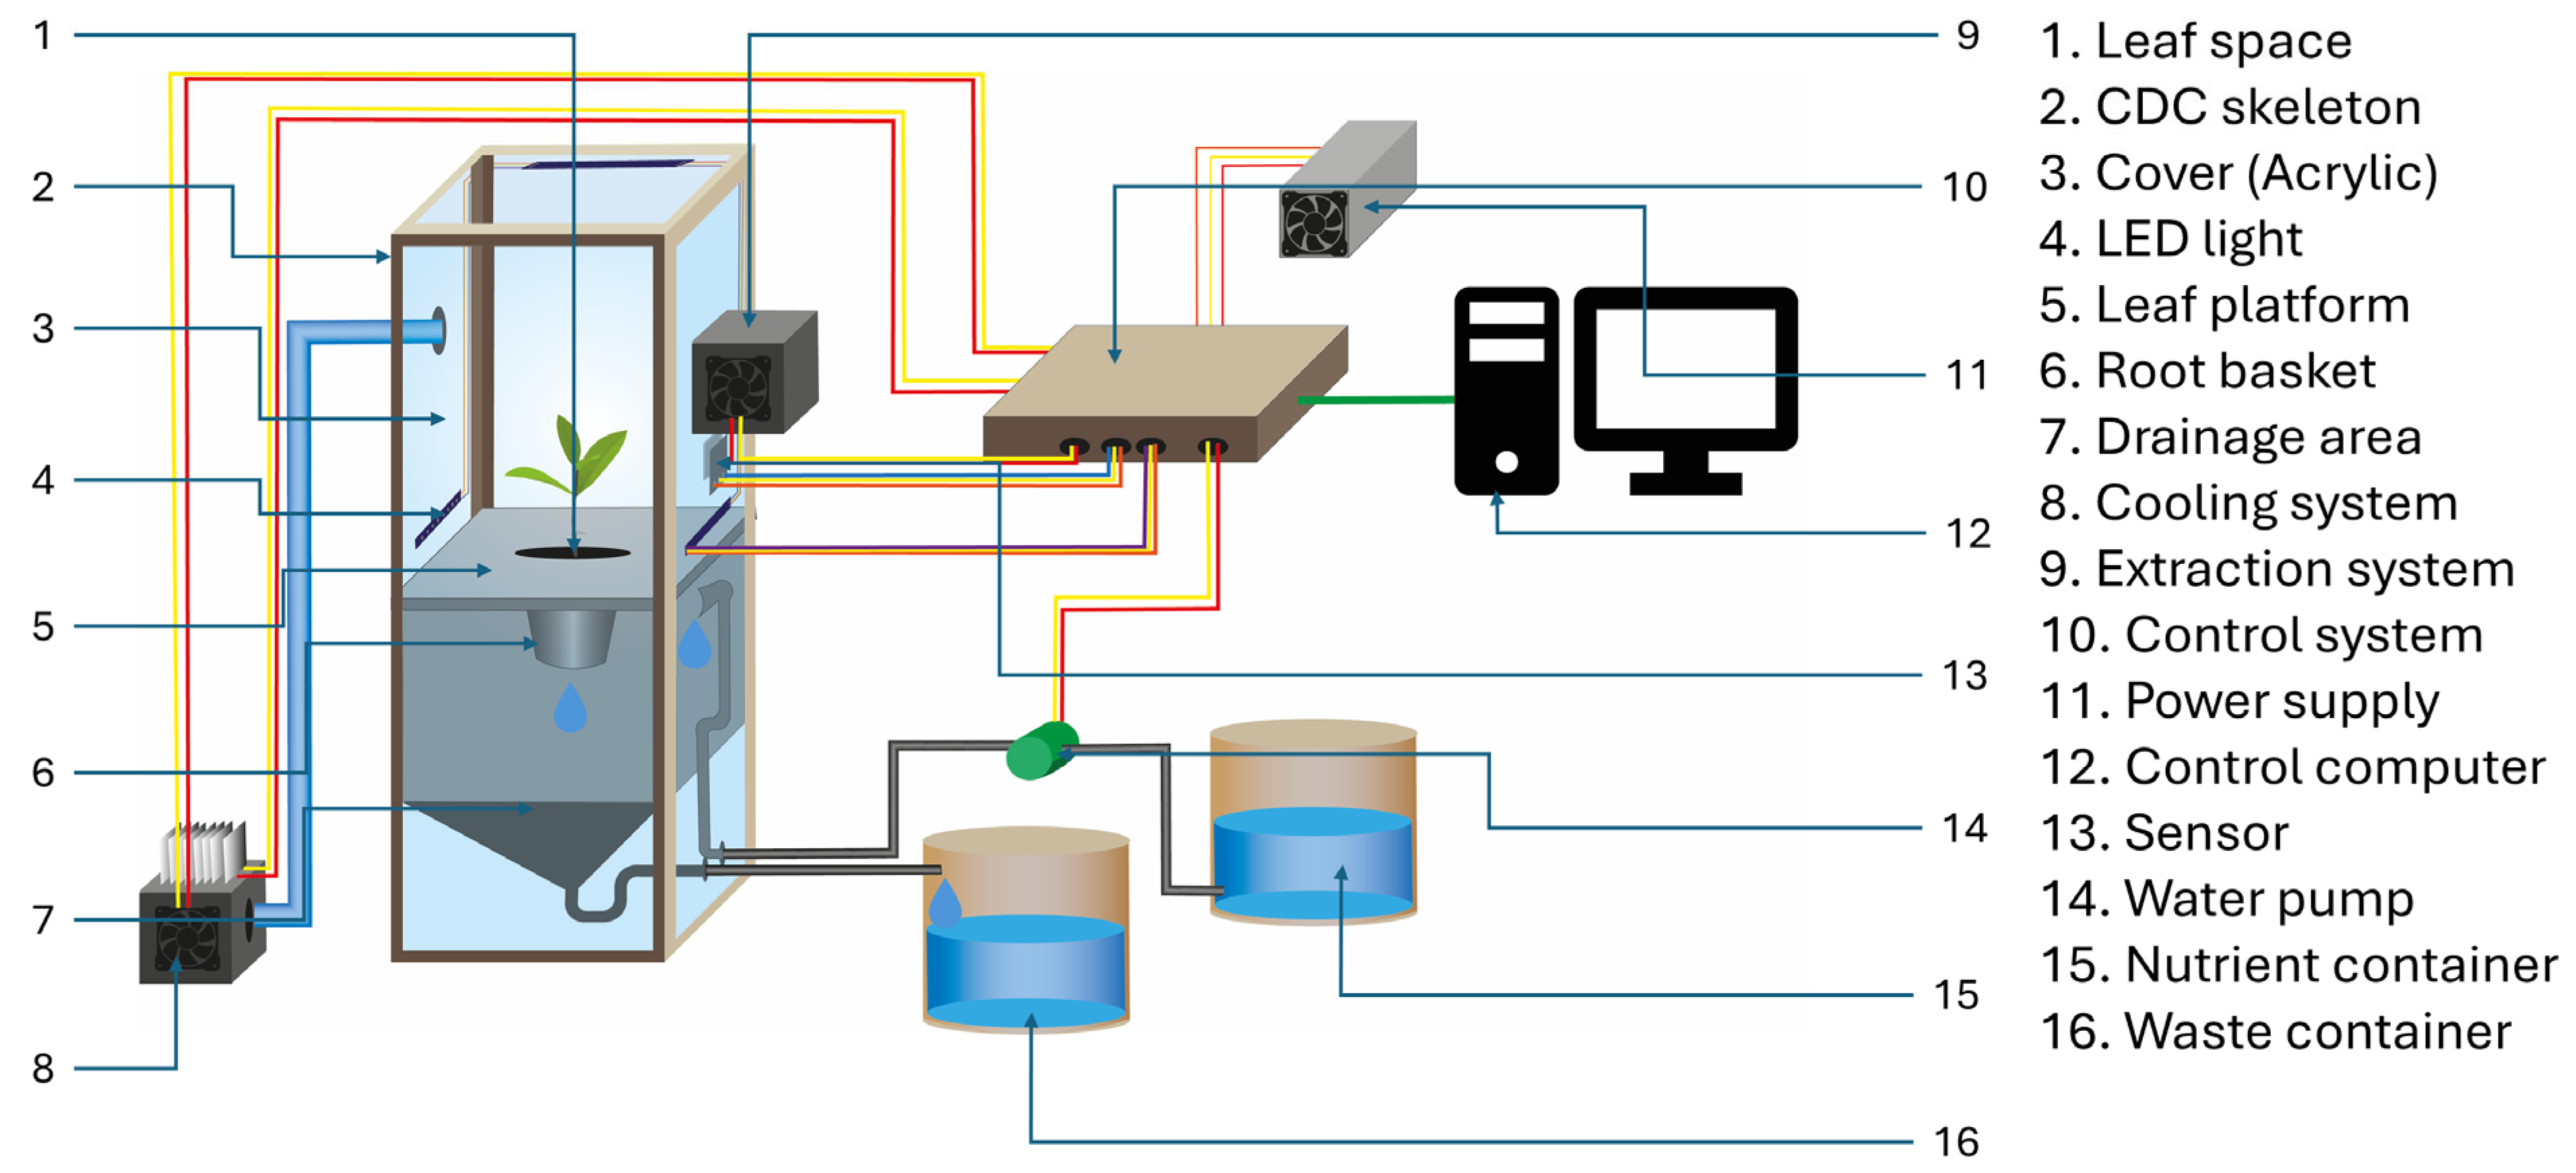
The construction of the CDC was based on advanced manufacturing techniques and careful material selection to optimize its functionality, durability, and, crucially, to reduce energy and water consumption and production costs. To illustrate the manufacturing of the CDC, a diagram was chosen specifying all its component elements (Figure 2).
The Structural Skeleton was fabricated using 1.75 mm PLA filament [35]. This method was chosen for its ability to offer a cost-effective, customized design, eliminating the need for complex industrial processes and minimizing material waste [35]. The dimensional accuracy of PLA was essential for the perfect fit of the acrylic parts and other components, using a ROBO3D FDM (Fused Deposition Modeling) 3D printer (San Diego, CA, USA) [36].
The Transparent Acrylic Walls were constructed from 3 mm thick transparent acrylic sheets. This material was selected for its high light transmission and strength, allowing for observation without disturbing internal conditions and reducing the need to open the chamber, which in turn minimizes moisture and energy loss. To ensure a watertight seal, the sheets were cut with a plasma cutter, a technique that ensures precise and uniform edges. Finally, the chamber’s airtightness was critical, so a combination of high-strength cyanoacrylate adhesive and cold-formed transparent silicone was used for the primary seal, complemented by T-7000 (Guangdong, China) on the interior to prevent moisture and air leakage, which directly contributes to water efficiency by preventing unwanted evaporation [34].

2.4. Development of Environmental Control Systems

The CDC functionality was enhanced with the integration of environmental control systems designed for optimal growth of the cuttings. In the lower area, mineral rock wool was used as a substrate for its water and oxygen retention capacity. The irrigation system was developed with a water pump and a micro-sprinkler system connected to an external reservoir capable of integrating water-soluble nutrients. Irrigation scheduling is assigned from the control system (Figure 3), which determines the irrigation period and time, ensuring a fully automated irrigation cycle (Table A1). This system communicates with the Arduino board and turns on the pump, enabling precise control over root moisture, optimizing water consumption by delivering only the necessary amount. To maintain airflow, two ventilation systems were integrated: a cooling system and an extractor. The cooling system, fabricated through 3D printing, incorporates a Peltier cell (Figure 2(8)) to dissipate heat generated by the lighting, while the air extractor (Figure 2(9)) supports uniform air circulation and prevents moisture accumulation in the upper region of the chamber (Table A1).
To maintain stable conditions and collect crucial data, a precise control and monitoring system was developed (Figure 3). An Arduino UNO microcontroller was selected as the central management system, and its modular and adaptable nature allowed for a cost-effective and efficient setup for managing the CDC. This system not only enables real-time control of environmental variables, but also supports the creation of structured databases including temperature, humidity, light intensity, and periodic plant growth images.
Temperature and humidity were monitored using a DHT22 sensor (Guangdong, China), chosen for its accuracy and operating range, as it can measure temperatures from −40 °C to 80 °C with an accuracy of ±0.5 °C and relative humidity between 0% and 100% with an accuracy of ±2%. This sensor uses digital communication, simplifying its integration with the Arduino microcontroller [37]. Therefore, it was strategically placed in the upper area (Leaf growth area) of the chamber to monitor the conditions where the foliage is growing and outside the CDC as part of the control measures. For verification purposes, the sensor’s performance was tested by comparing its readings whit those of laboratory thermometer and hygrometer (model: TER-150). Additional testing included exposing the chamber to step changes in temperature (by placing a heat source inside) and humidity (using a humidifier) to verify the sensors responsiveness and stability over time.
Lighting in the upper section of the chamber was provided by a NeoPixel WS2812B LED light (Shenzhen, China) board consisting of 8 LEDs was used. These LEDs are highly versatile and allow for individualized control of their color and intensity owing to their integration with a digital controller. NeoPixel LEDs (Shenzhen, China) can emit light in RGB colors, allowing them to generate specific spectra necessary for photosynthesis, such as red (660 nm) and blue (450 nm), known to be critical for plant growth. Among the advantages of using LEDs are high energy efficiency, which reduces power consumption compared to other lighting systems; low heat emission, which minimizes the risk of heat stress in plants; and spectral control, which allows lighting to be optimized to stimulate specific plant responses [38,39].
Likewise, to high-resolution image acquisition, an EMEET SmartCam C960 4K webcam (Guanguang, China) was integrated into the system. This component allows for periodic visual monitoring of each cutting and provides the detailed image data required for building the datasets used in neural network training, which constitutes one of the core objectives of the CDC.
To ensure the applicability of the design, the characteristics of the camera components are added (Table 4).

3. Results

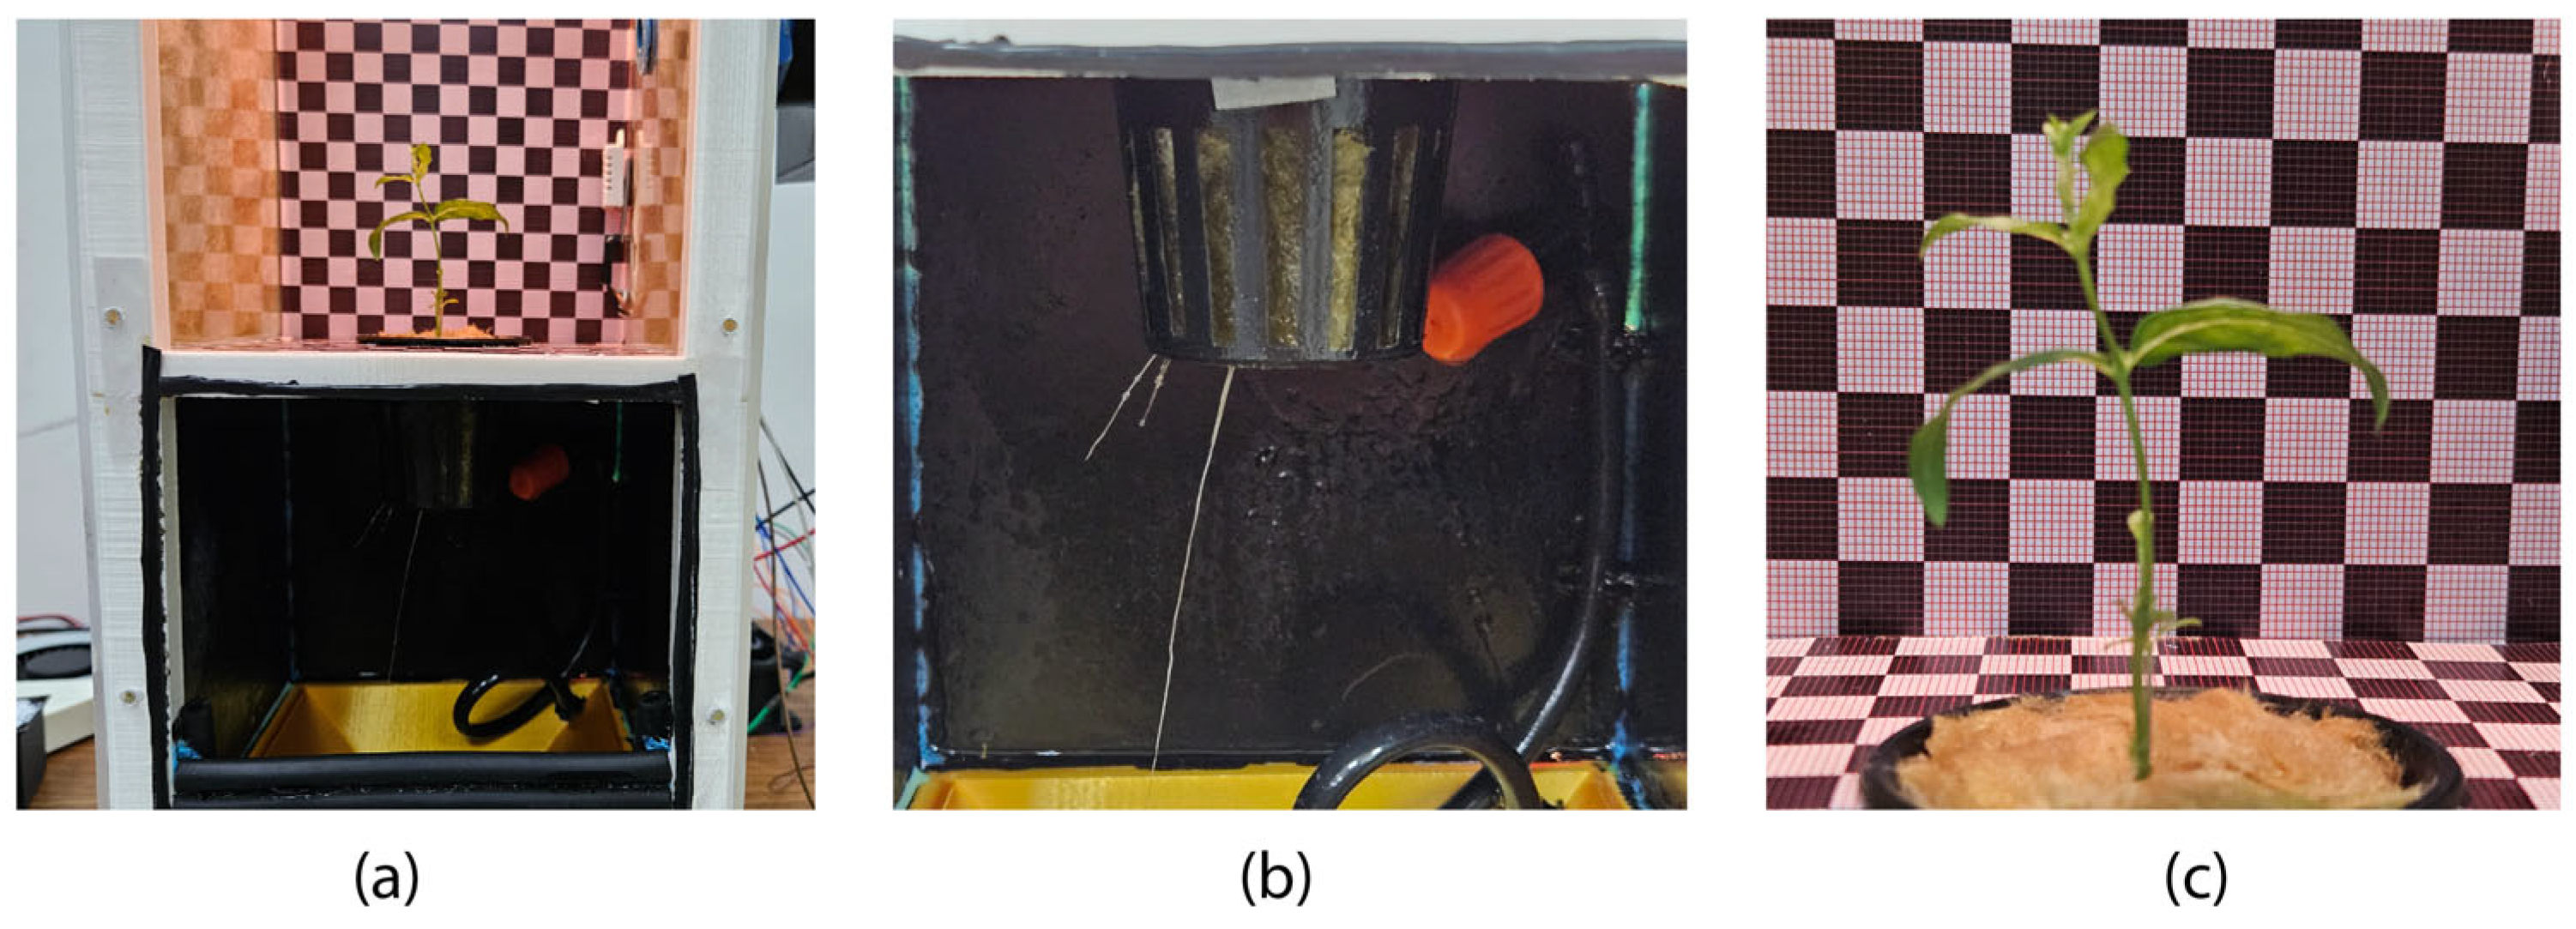
To validate the operation of the CDC, a series of 4 experiments were implemented, 1 with the species Aloysia citrodora and 3 with Stevia rebaudiana, with a duration determined by the rooting of the cutting (Figure 4). With these, batches of image data were created in JPG format with a size of 2160 × 3840 pixels, in RGB channel, labeled with temperature, humidity, light and growth, obtained in a real and continuous manner. It should be noted that the results obtained are not the main characteristic of this research, but rather, they are part of the testing the correct functioning of the CDC.
The duration of the experiments was determined by the moment in which the cutting developed roots, as shown in Figure 4. The results obtained are shown below, statistically analyzed and a brief comparison between them, highlighting the use of standard deviation as an analysis of the maintenance of conditions within the chamber.

3.1. Experiment 1. (Aloysia citrodora)

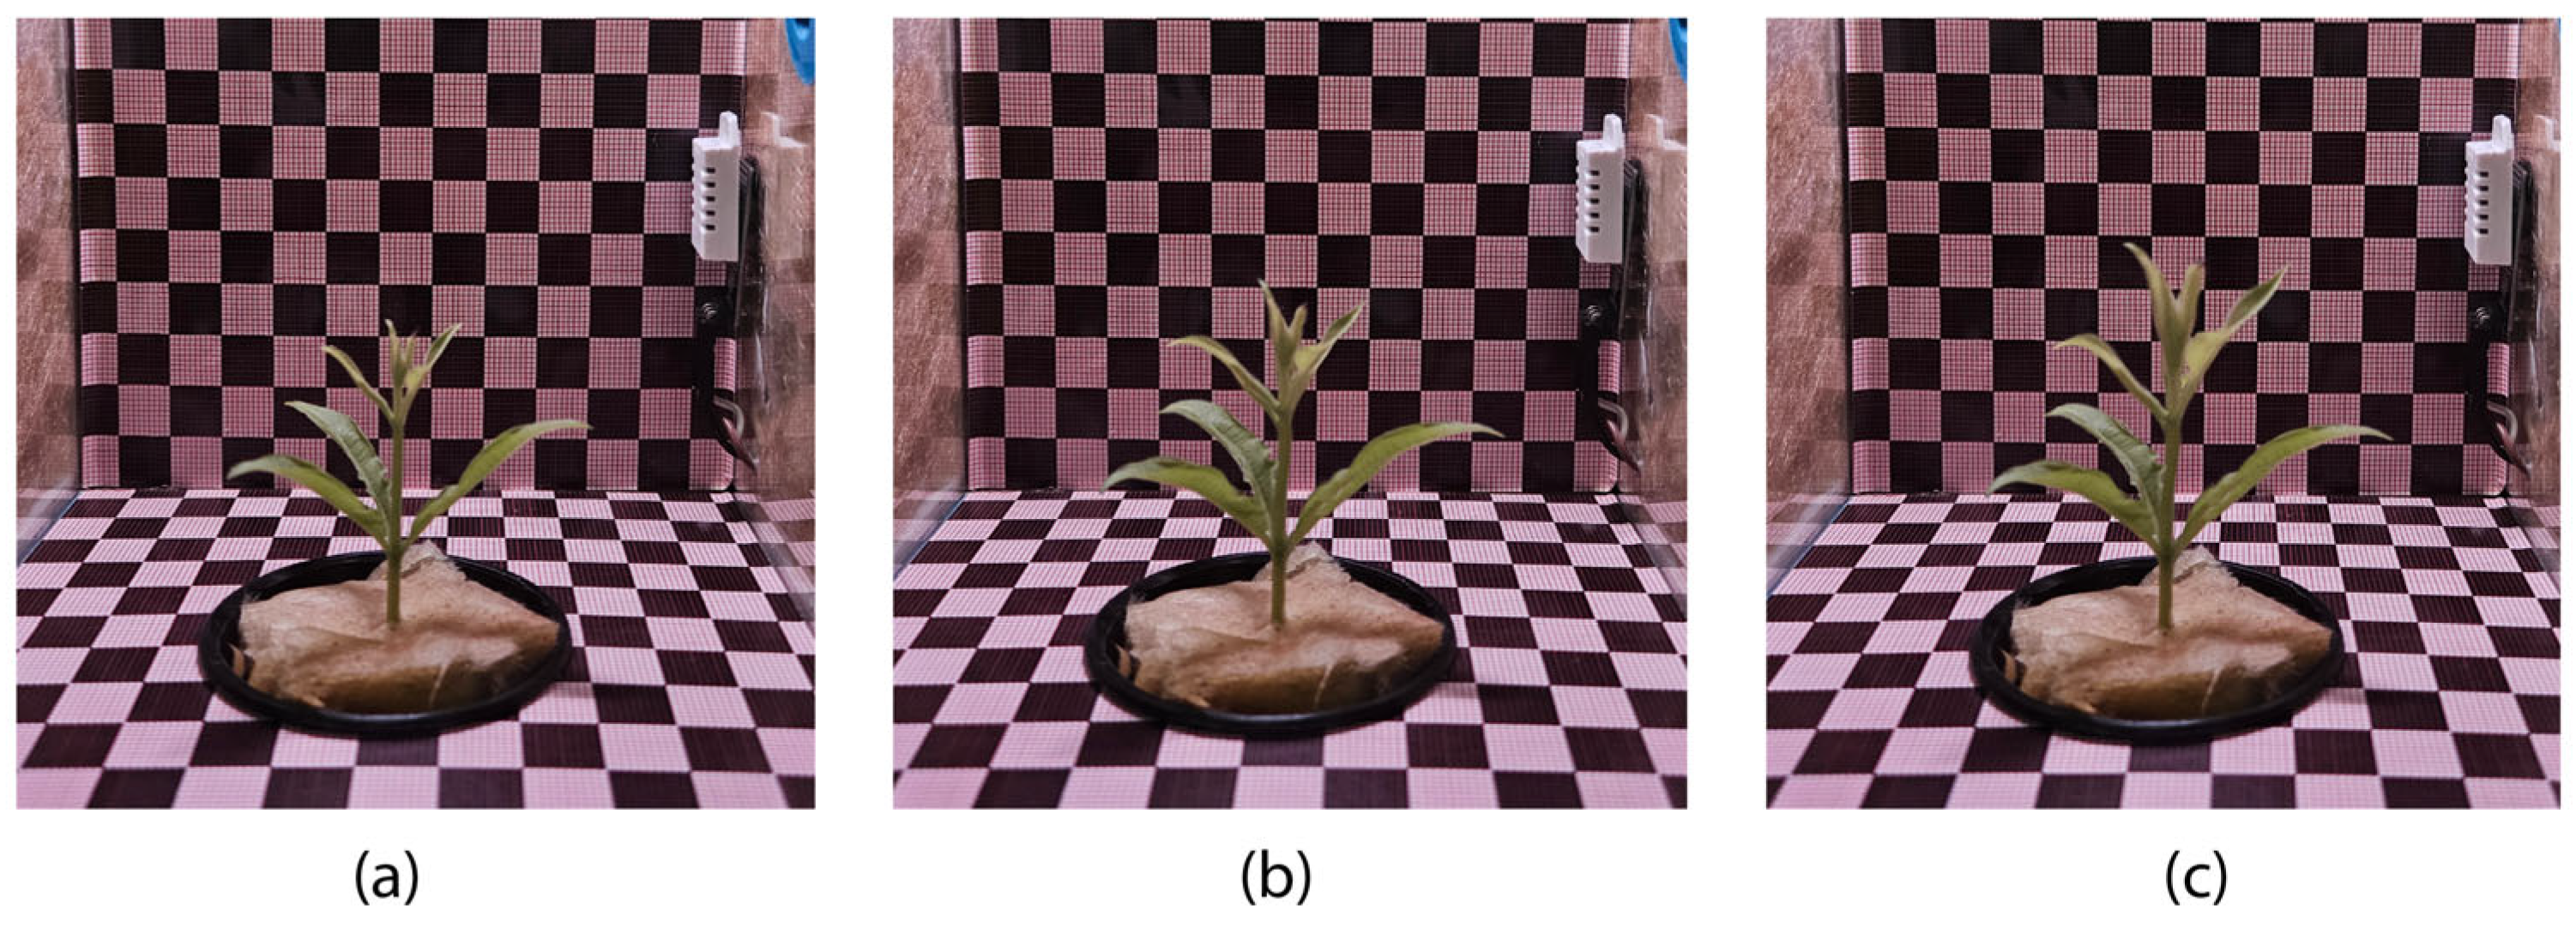
The first experiment conducted inside the chamber was with an Aloysia citrodora cutting (Figure 5), lasting 25 days. The default parameters were maintained, which included illumination provided by NeoPixel WS2812b RGB LED strips (Shenzhen, China). These LEDs generate light through three independent channels, with typical peak wavelengths of ~620–630 nm (red), ~520–530 nm (green), and ~465–475 nm (blue), according to the manufacturer specifications. The following results were obtained (Table 5).
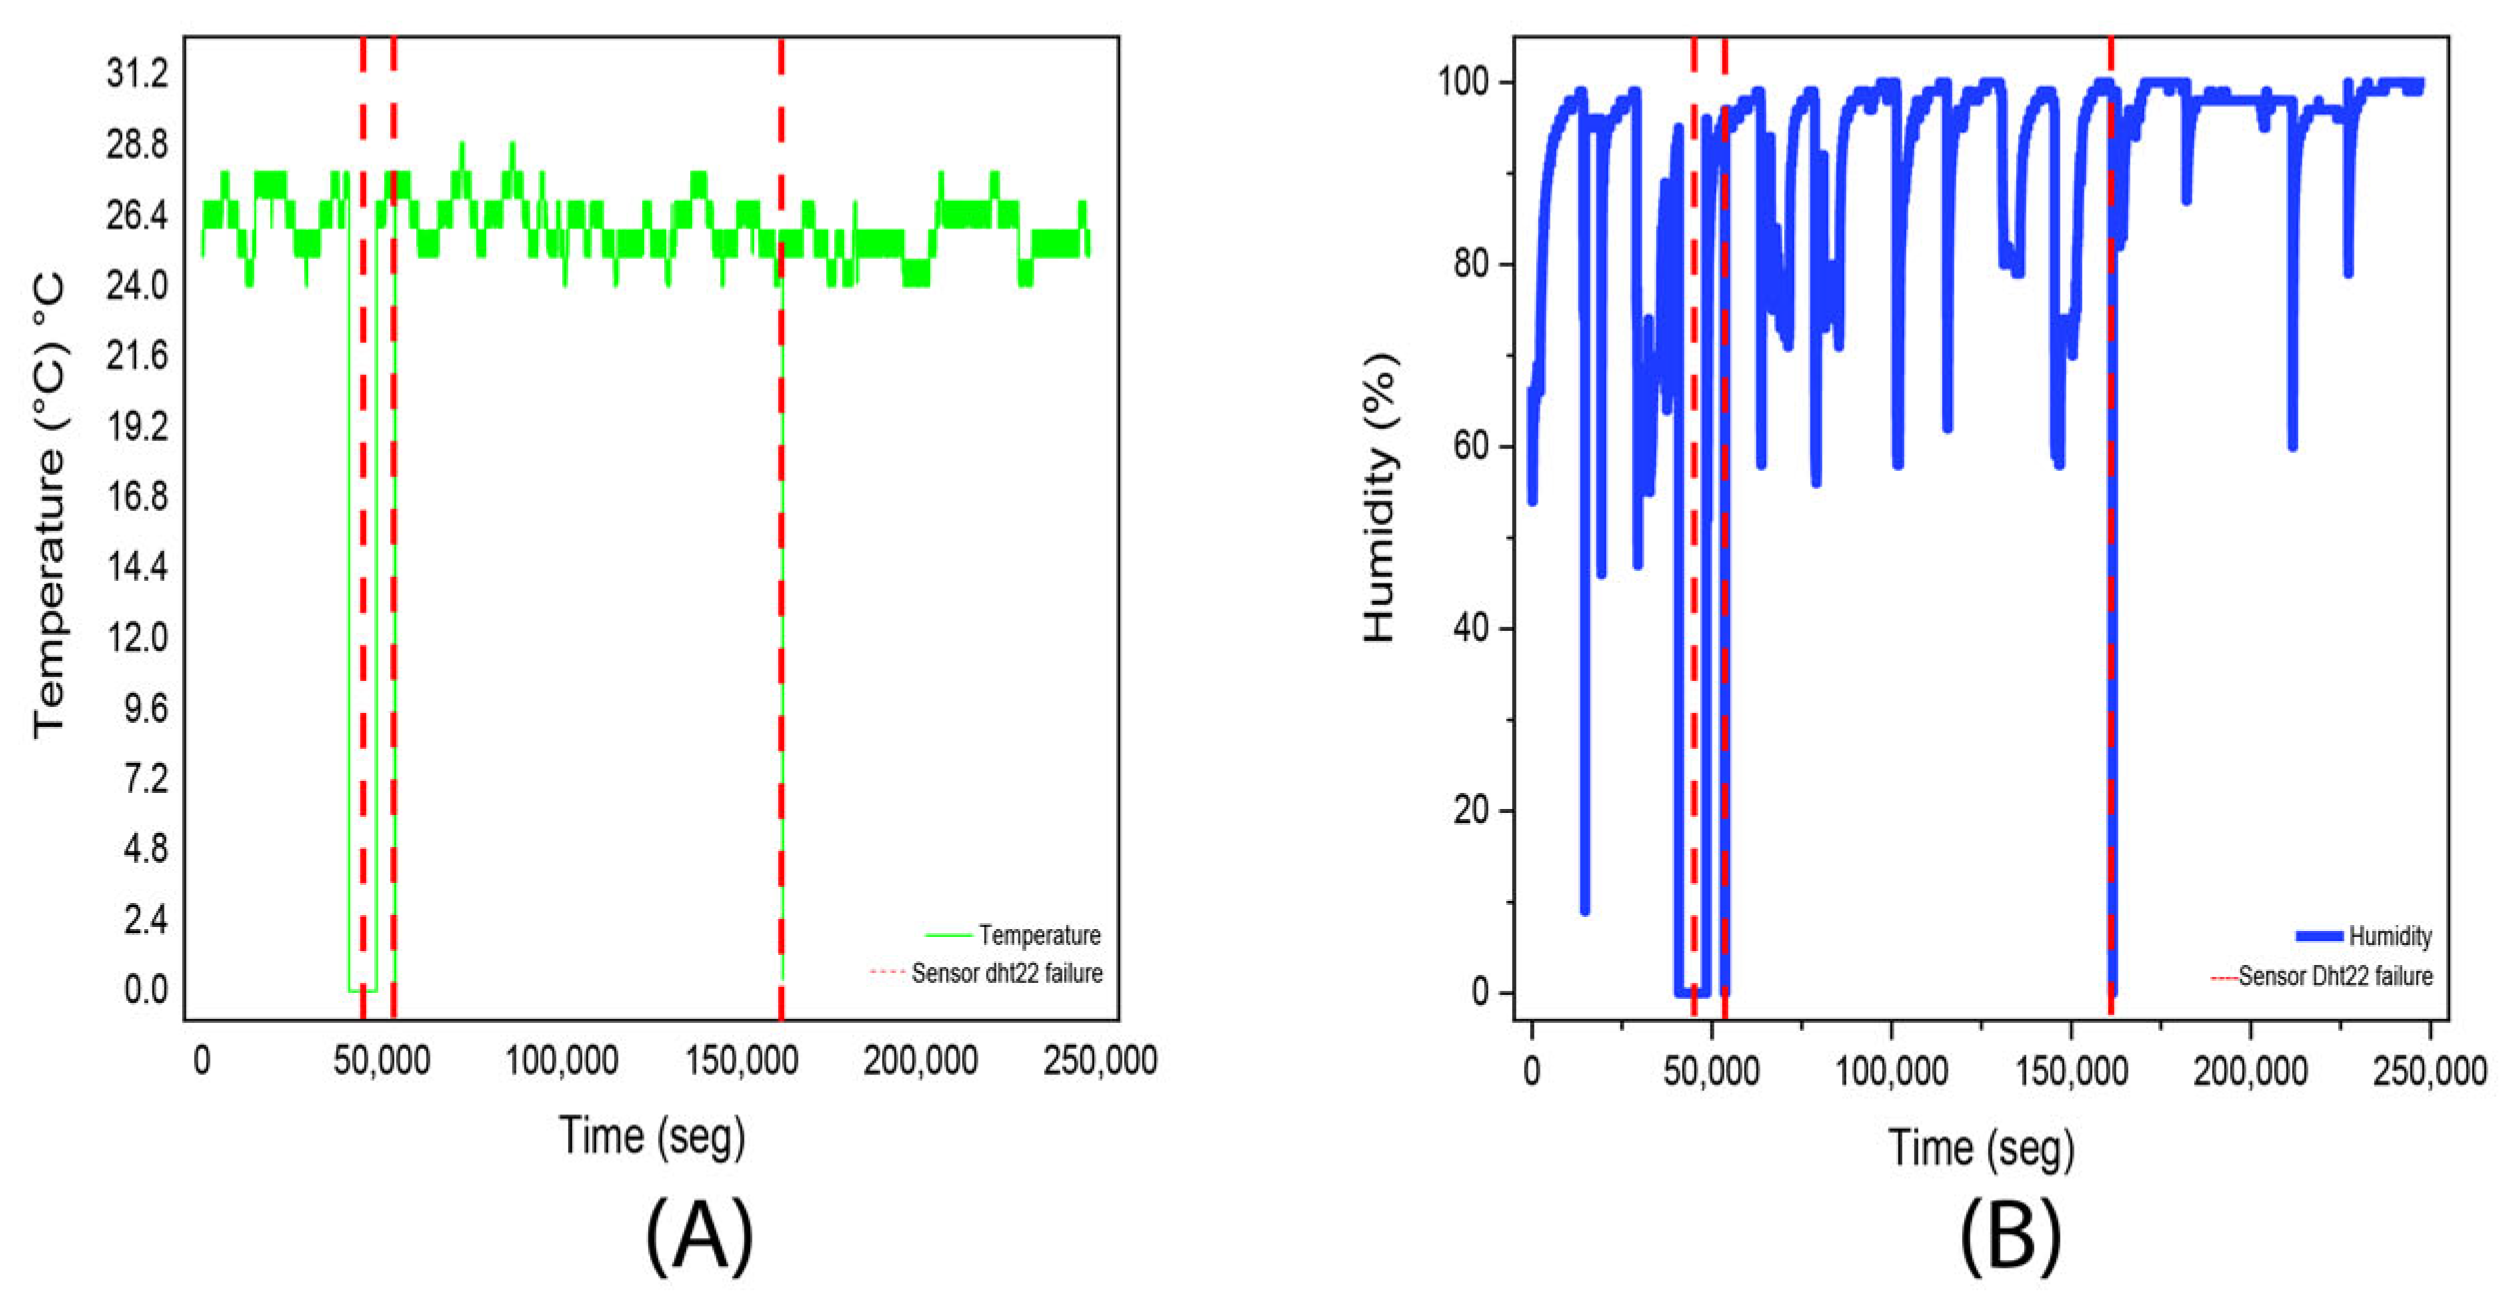
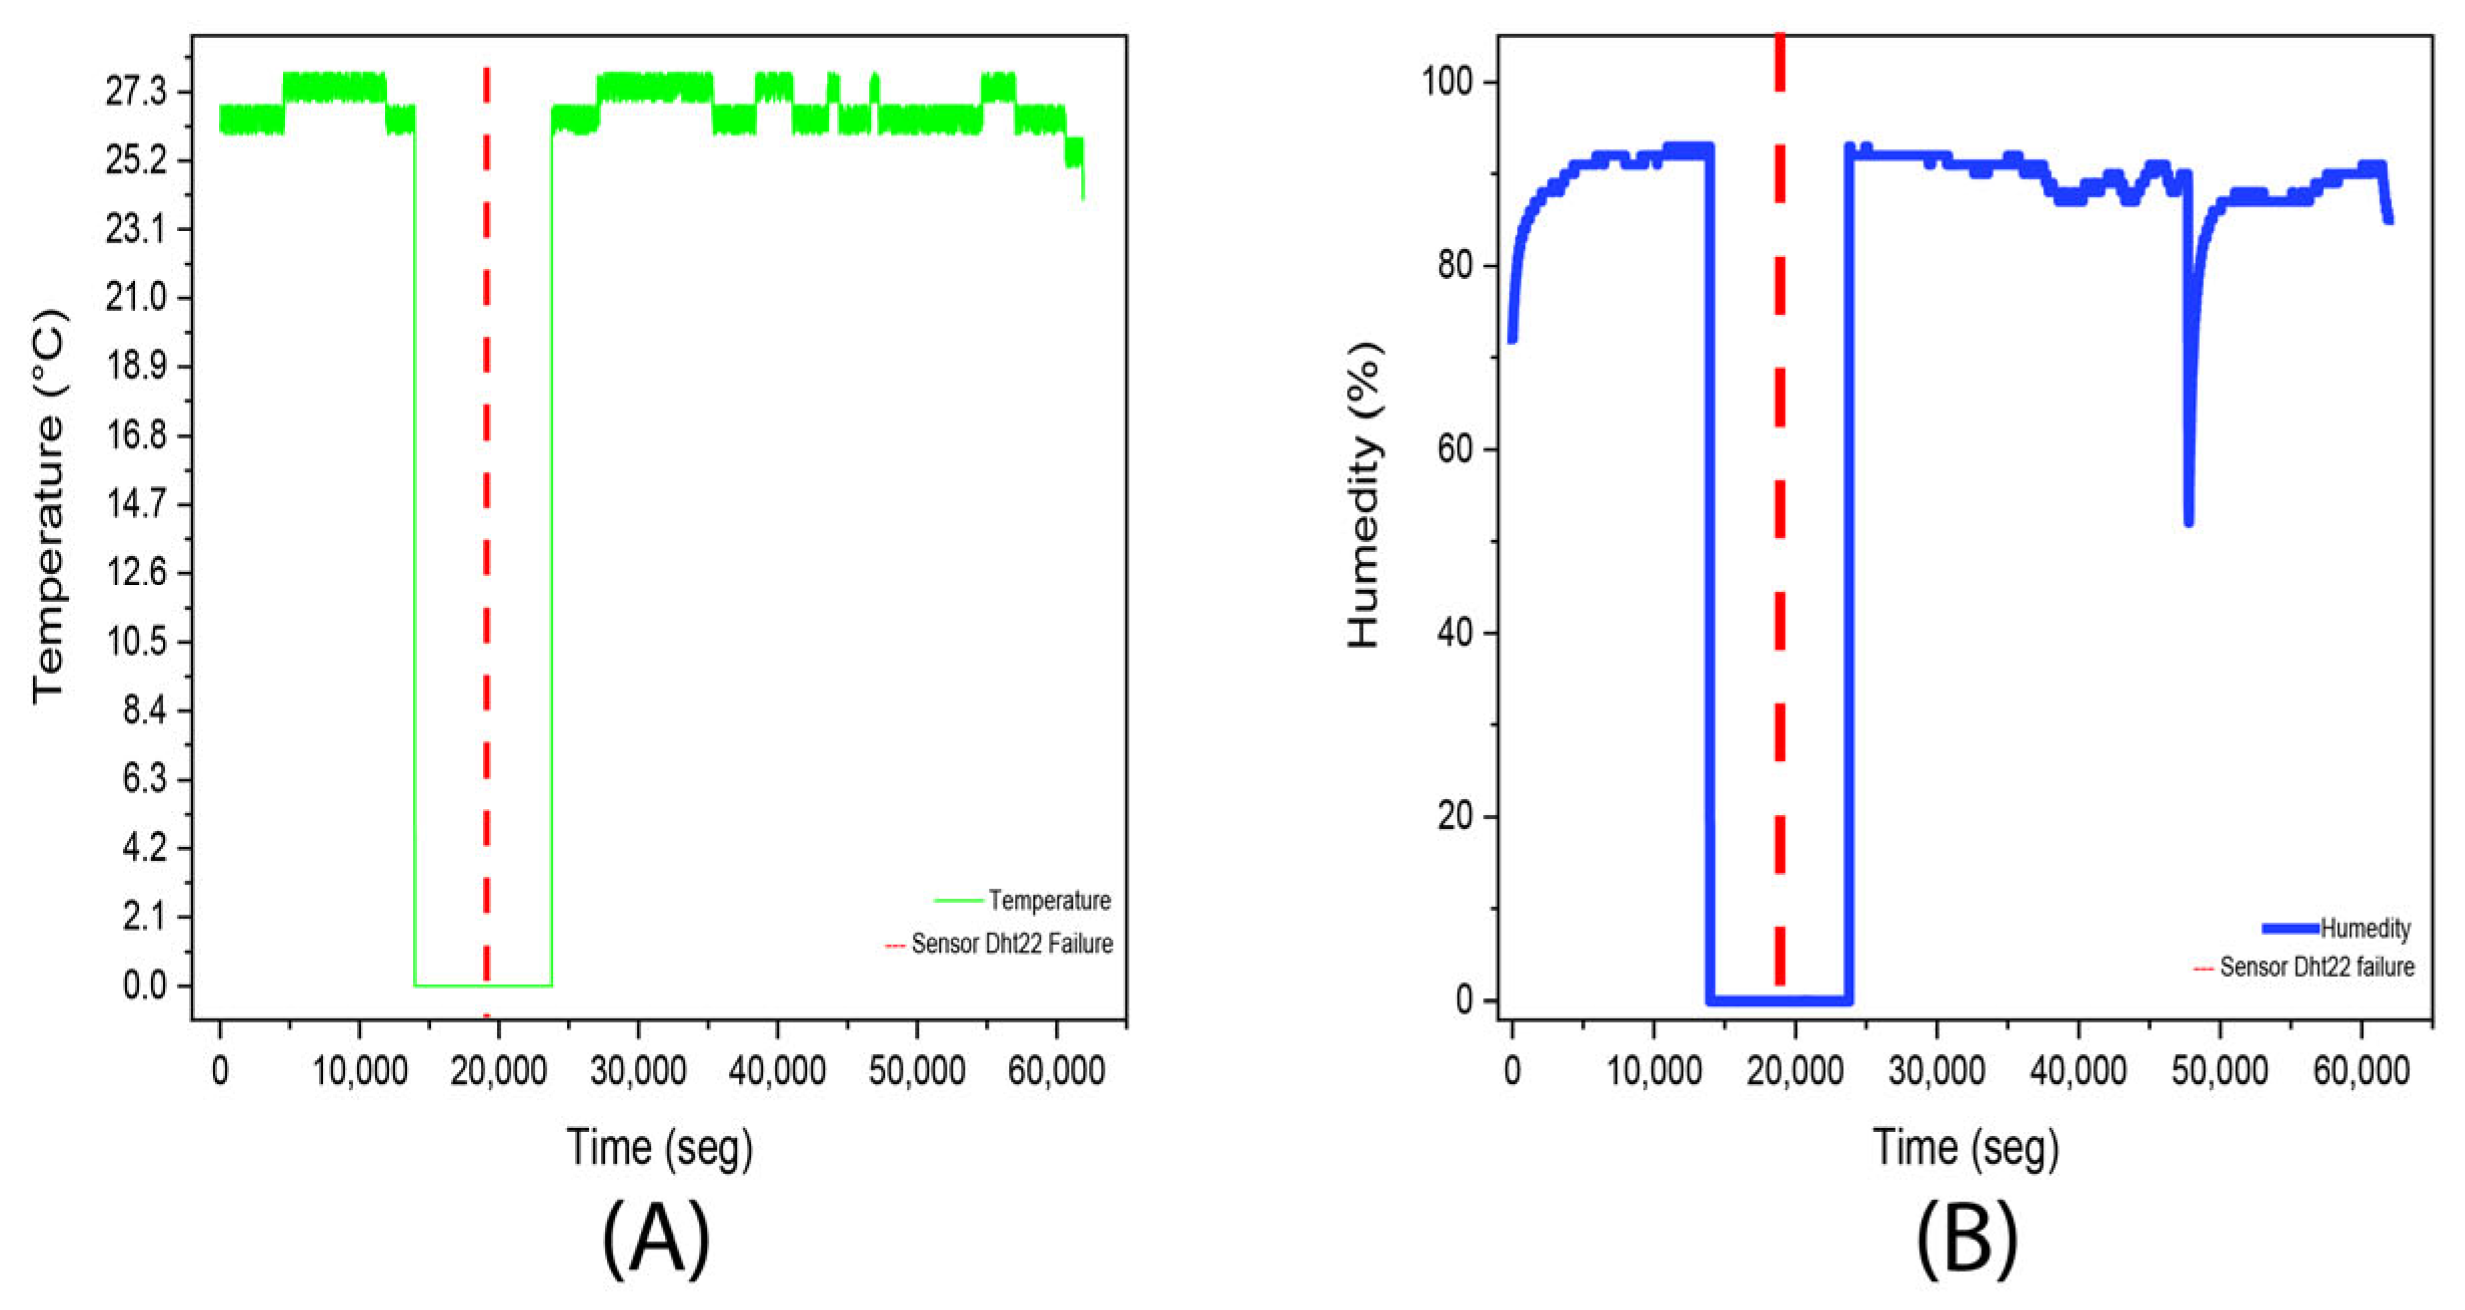
The first experiment carried out with a duration of 25 days, yielded 1388 images and 24,691 records (Table 6), in this case the lighting settings were kept at default values, meaning that all colors (RGB) provided their maximum amount of light (R = 255, G = 255, B = 255), providing a white light, the temperature data show a mean of 24.8 °C with a median and mode of 25 °C, indicating a symmetric distribution around these values. The high standard deviation (4.6 °C) and variance (20.9 °C) suggest significant variability in the measurements. Likewise, the high kurtosis (24.3 °C) and negative skewness coefficient (−5.0 °C) indicate the presence of extreme values and a trend towards lower temperatures. The range of 28 °C, with a minimum of 0 °C (this is obtained due to failures in the DHT22 sensor (Guangdong, China) as seen in Figure 6, a failure associated with the disconnection of the circuit board) and a maximum of 28 °C, reinforces this variability.
Regarding humidity, the mean is 89.80% with a median of 97% and a mode of 98%, suggesting a high concentration of high values; in comparison, the standard deviation (19.13%) and variance (365.77%) also indicate considerable dispersion in the humidity data. The high kurtosis (12.81%) and negative skewness coefficient (−3.448%) reflect the presence of extreme values and a tendency towards extremely low humidity. The full range of 100%, with a minimum of 0% given by the previously explained flaw, and a maximum of 100%, highlights the variability in humidity measurements.
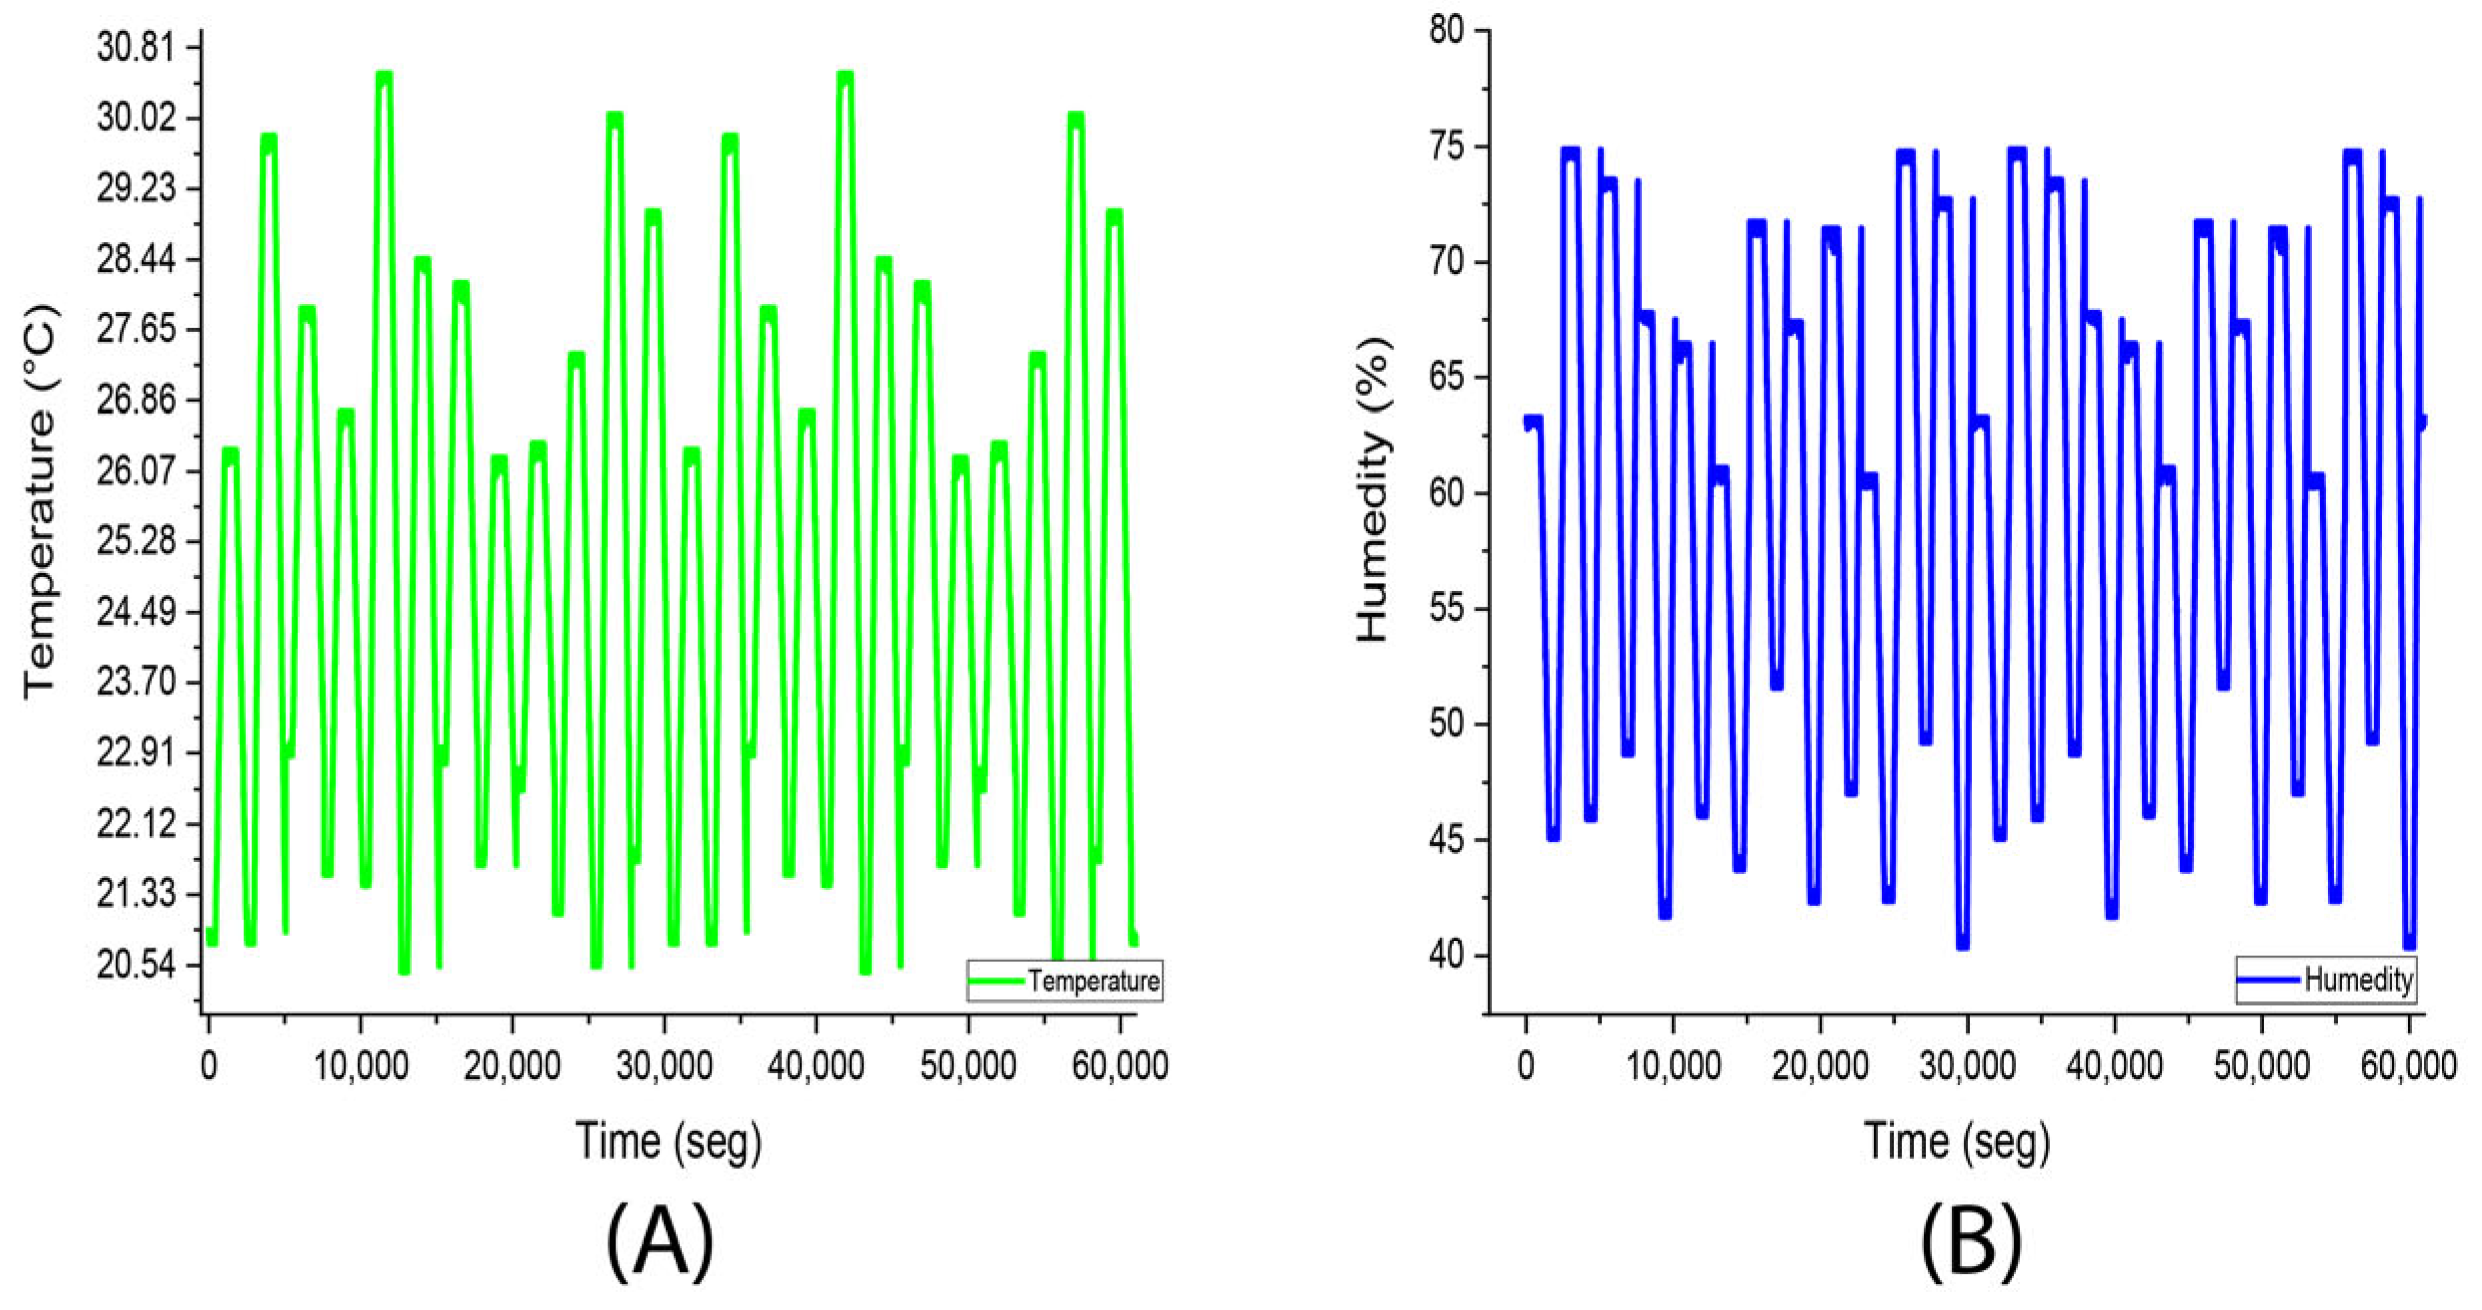
In contrast, the environmental data collected outside the chamber over the same period show markedly different statistical behavior. The external temperature presented a lower mean of 20.8 °C, with a median of 22.2 °C and a mode of 25.0 °C, and a smaller standard deviation (4.1 °C) and variance (17.2 °C), indicating more stable and less fluctuating conditions. Additionally, the kurtosis value (−1.4) and a reduced range of 12.2 °C suggest a more uniform distribution without extreme deviations. Similarly, external humidity showed a mean of 53.6%, a median of 53.2%, and a mode of 49.1%, with lower variability (standard deviation of 7.2% and variance of 51.2%). The negative kurtosis (−1.1) and narrower range (25.5%) further indicate stable ambient moisture conditions.
This comparison highlights that the controlled environment inside the development chamber inherently introduces greater dynamic variability, particularly as a result of the active environmental regulation mechanisms and the sensitivity of monitored microclimatic conditions. Meanwhile, external conditions remain comparatively stable and uniform, as shown in Figure 7.
This contrast validates the chamber ability to create distinct micro-environmental conditions required for the experimental development of cuttings and the subsequent generation of diverse training data for artificial intelligence applications.

3.2. Experiment 2. (Stevia Rebaudiana Red Light)

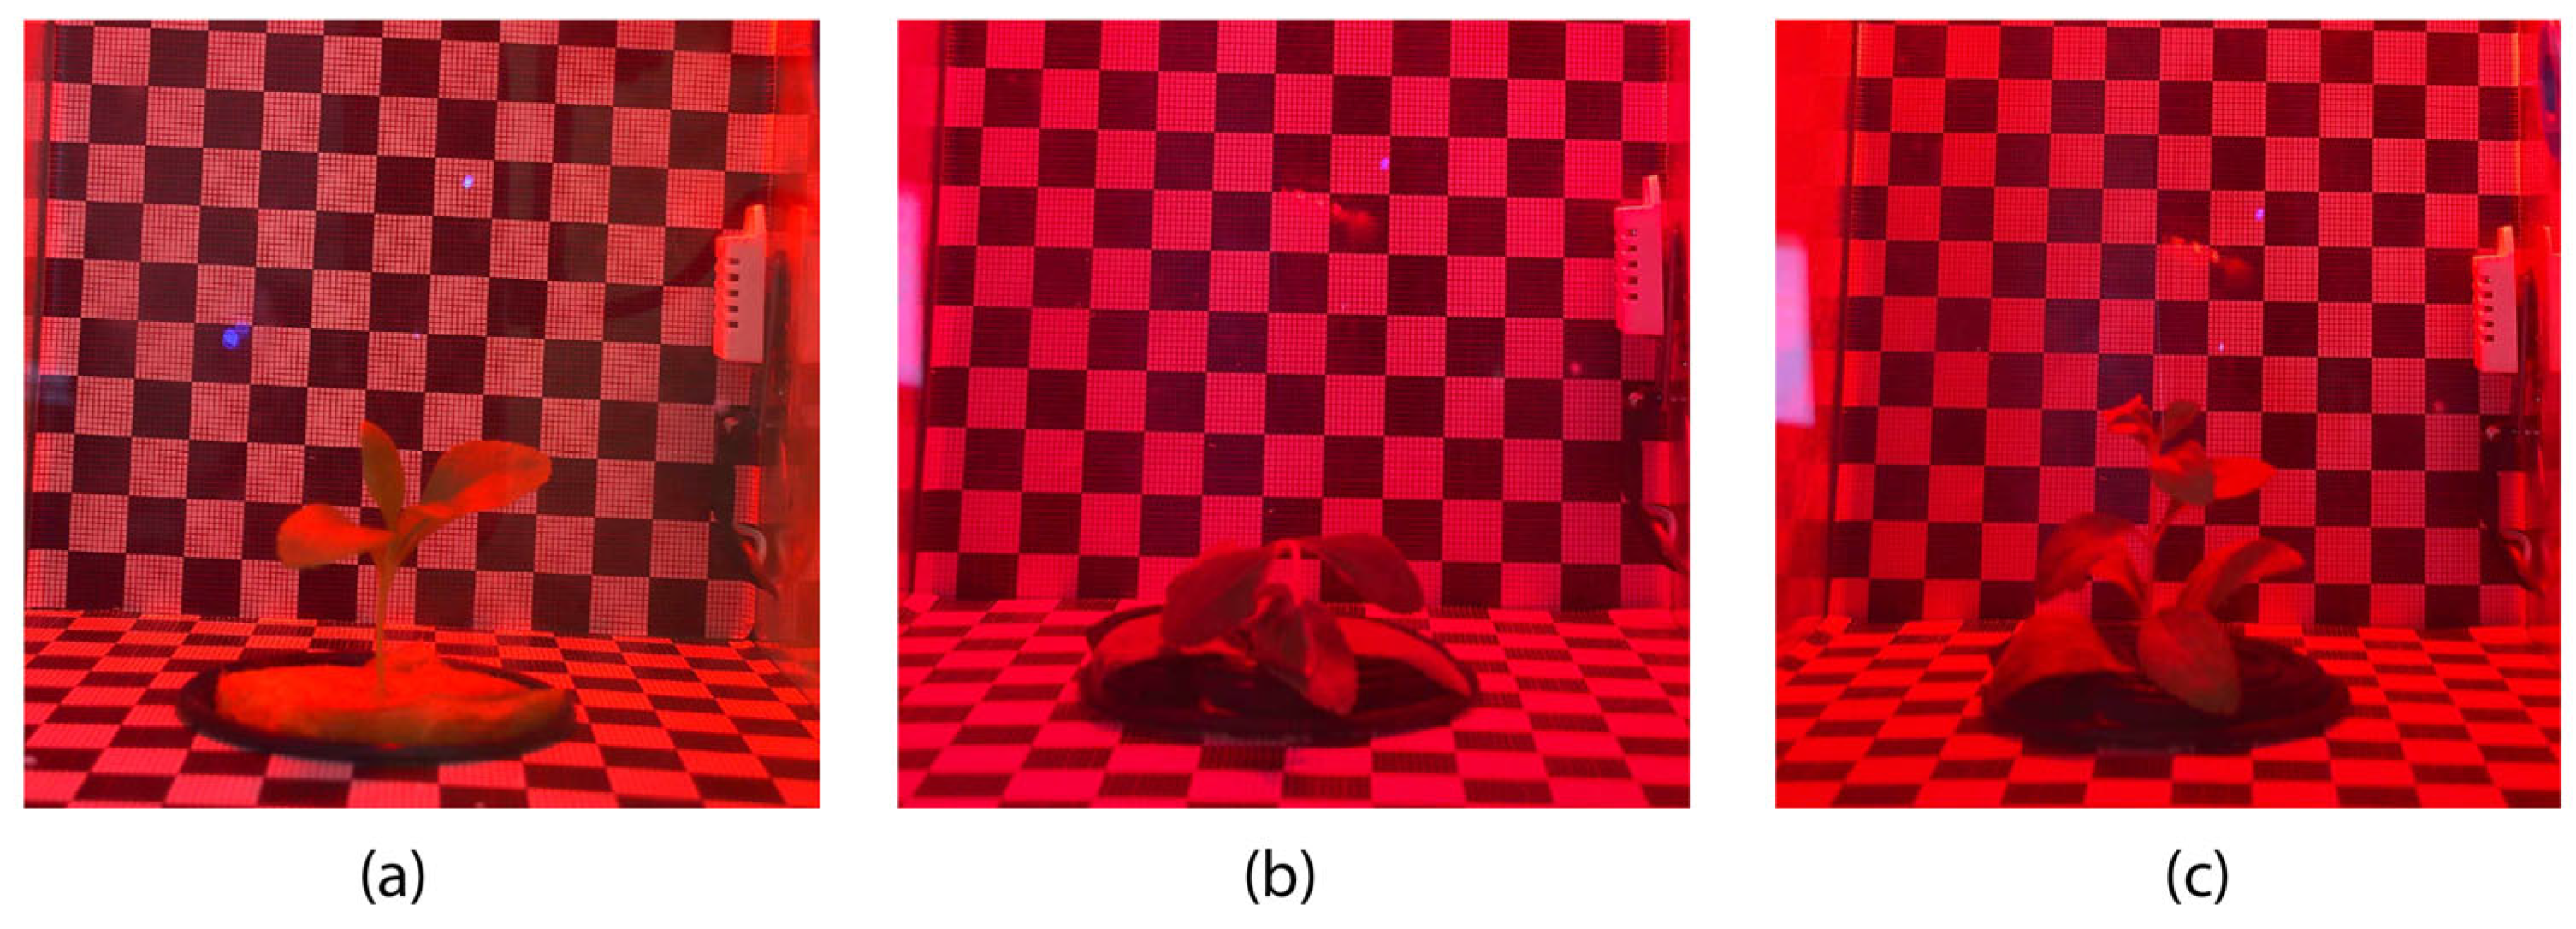
From this experiment onwards, the plant specimen was kept for all tests with differences in lighting parameters. In this and subsequent experiments, cuttings of the Stevia Rebaudiana plant were developed. In the specific case of experiment 2, red lighting was chosen (Figure 8) and lasted 10 days, during which the following statistical information was obtained (Table 7).
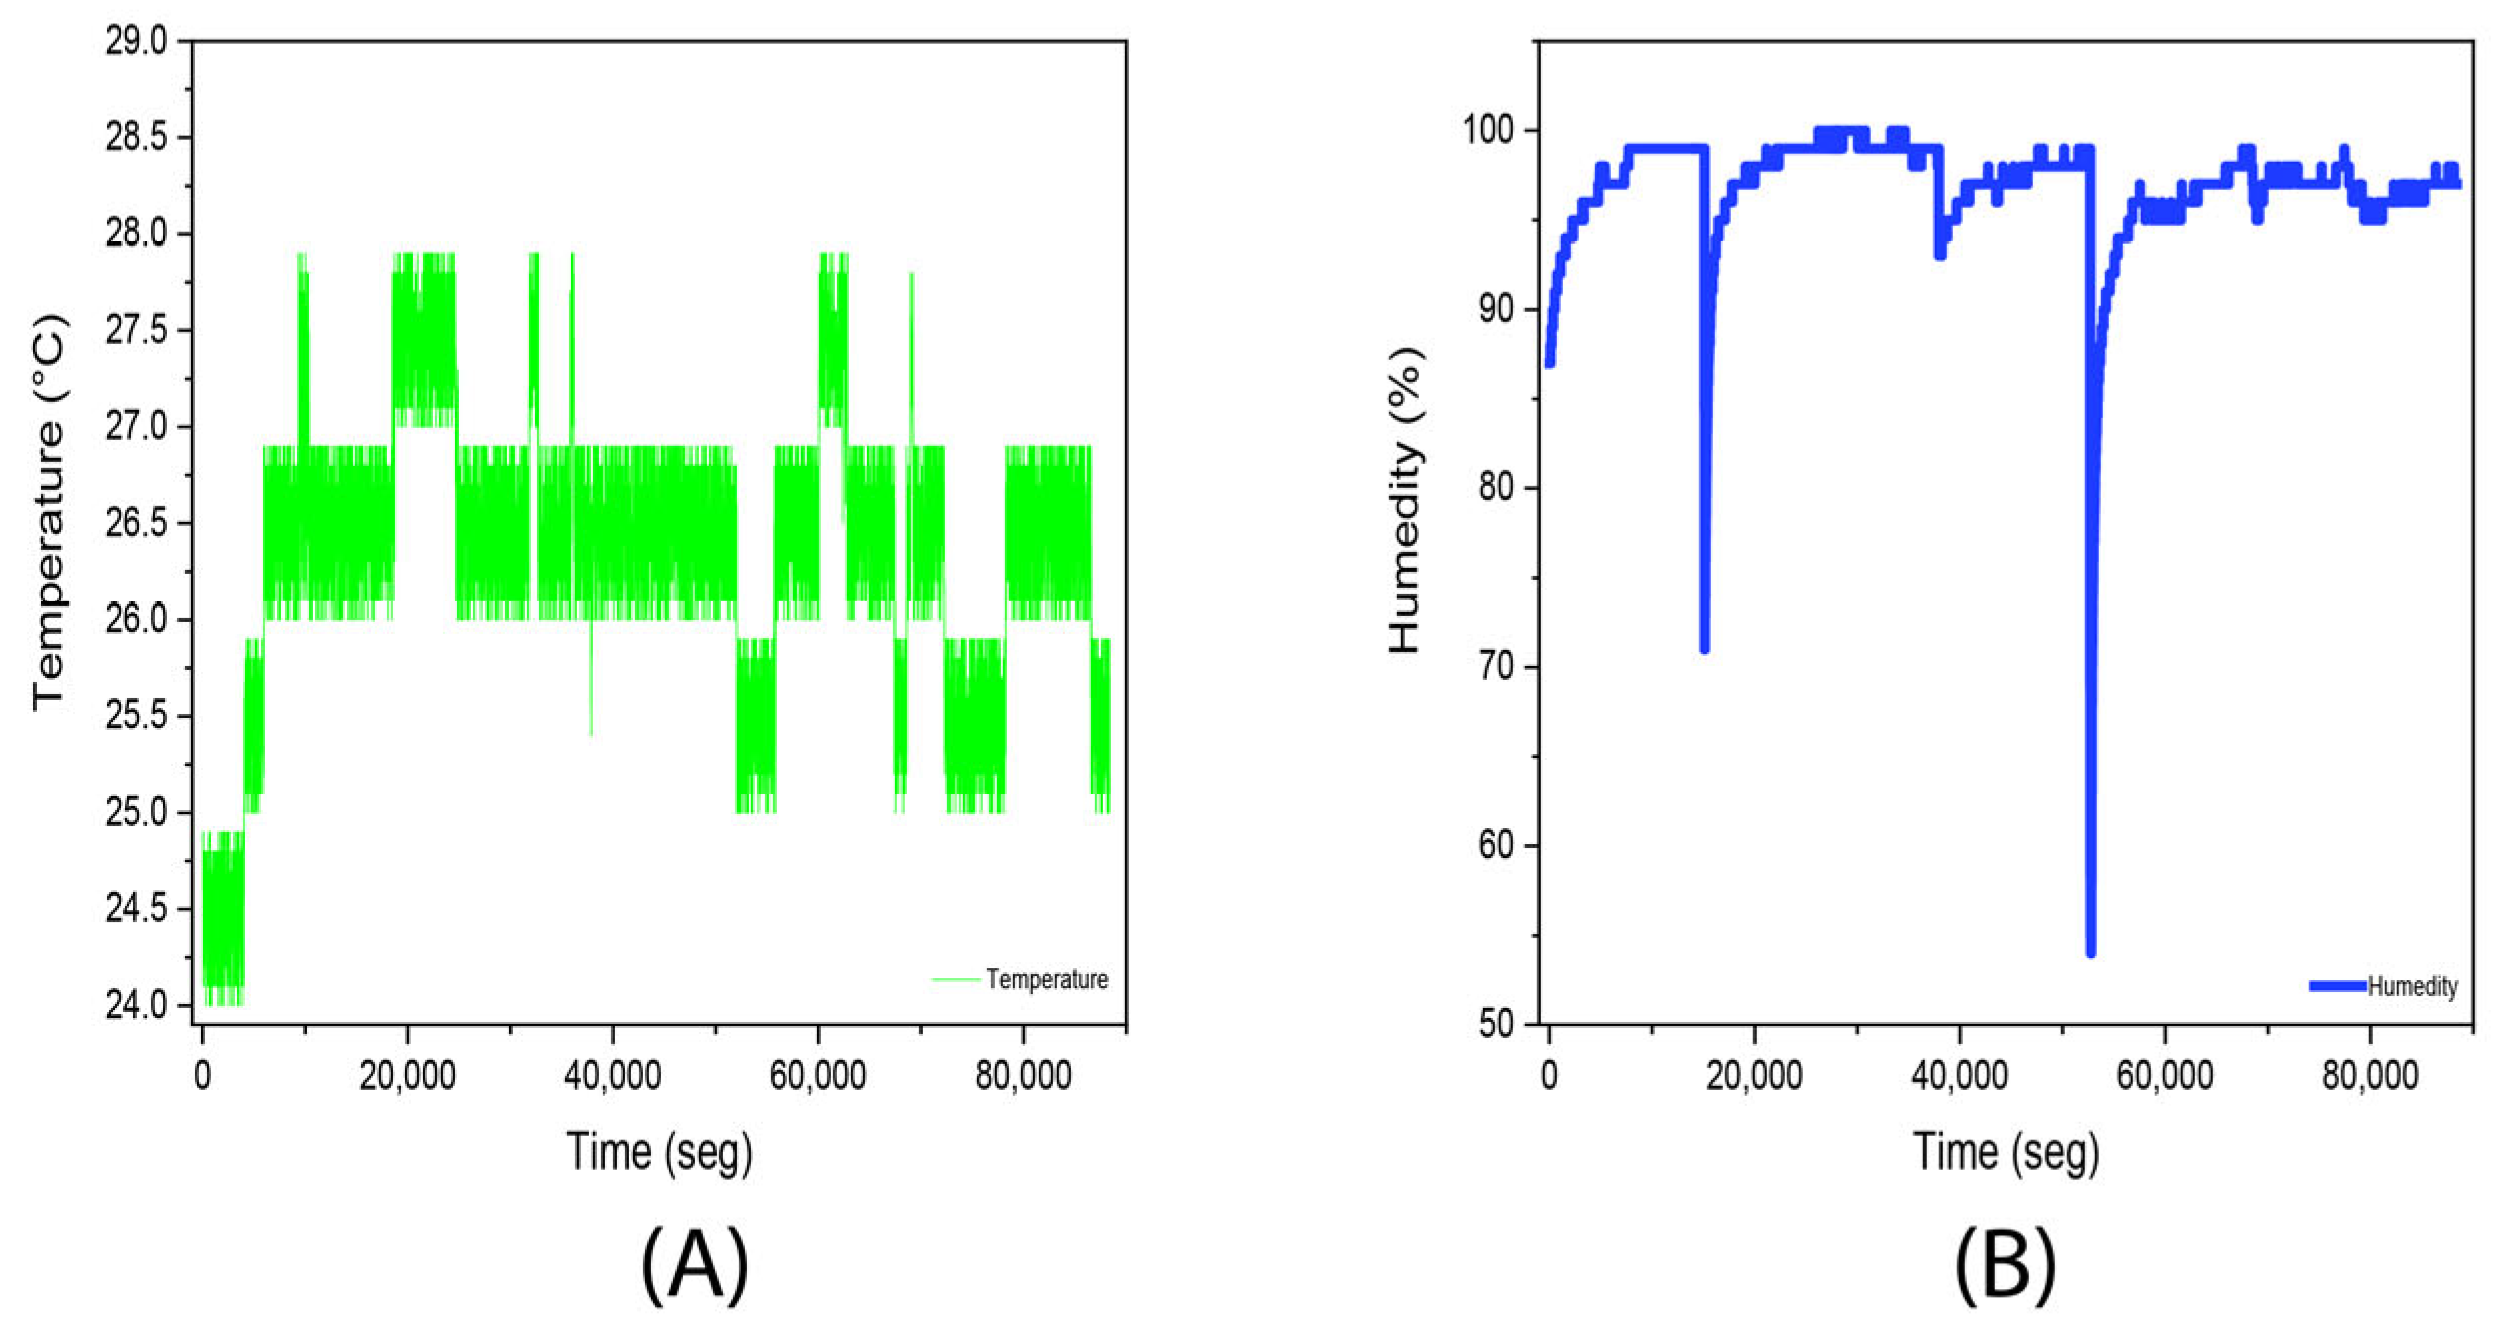
During the 10-day experiment with stevia (Stevia rebaudiana) plants under red illumination, a total of 885 images and 8839 temperature and humidity records were obtained (Table 8). The temperature showed a mean of 25.9 °C, with a median and mode of 26 °C, indicating a distribution centered around these values. The low standard deviation (0.7 °C) and narrow range (3 °C) suggest minimal variability in temperatures, and the slightly high kurtosis (1.16 °C) and negative skewness coefficient (−0.740 °C) reflect a bias towards lower temperatures. These results indicate a relatively stable temperature environment, ideal for studying stevia growth.
Regarding humidity, the mean was 96.8%, with a median and mode of 97%, suggesting a high average level, where the standard deviation (3.1832%) and the wide range (46%) show considerable variability, this given by the use of ventilation within the chamber as can be seen in (Figure 9). The extremely high kurtosis (47.53%) and the negative asymmetry coefficient (−5.378%) indicate the presence of many extreme values and a tendency towards lower humidity values.
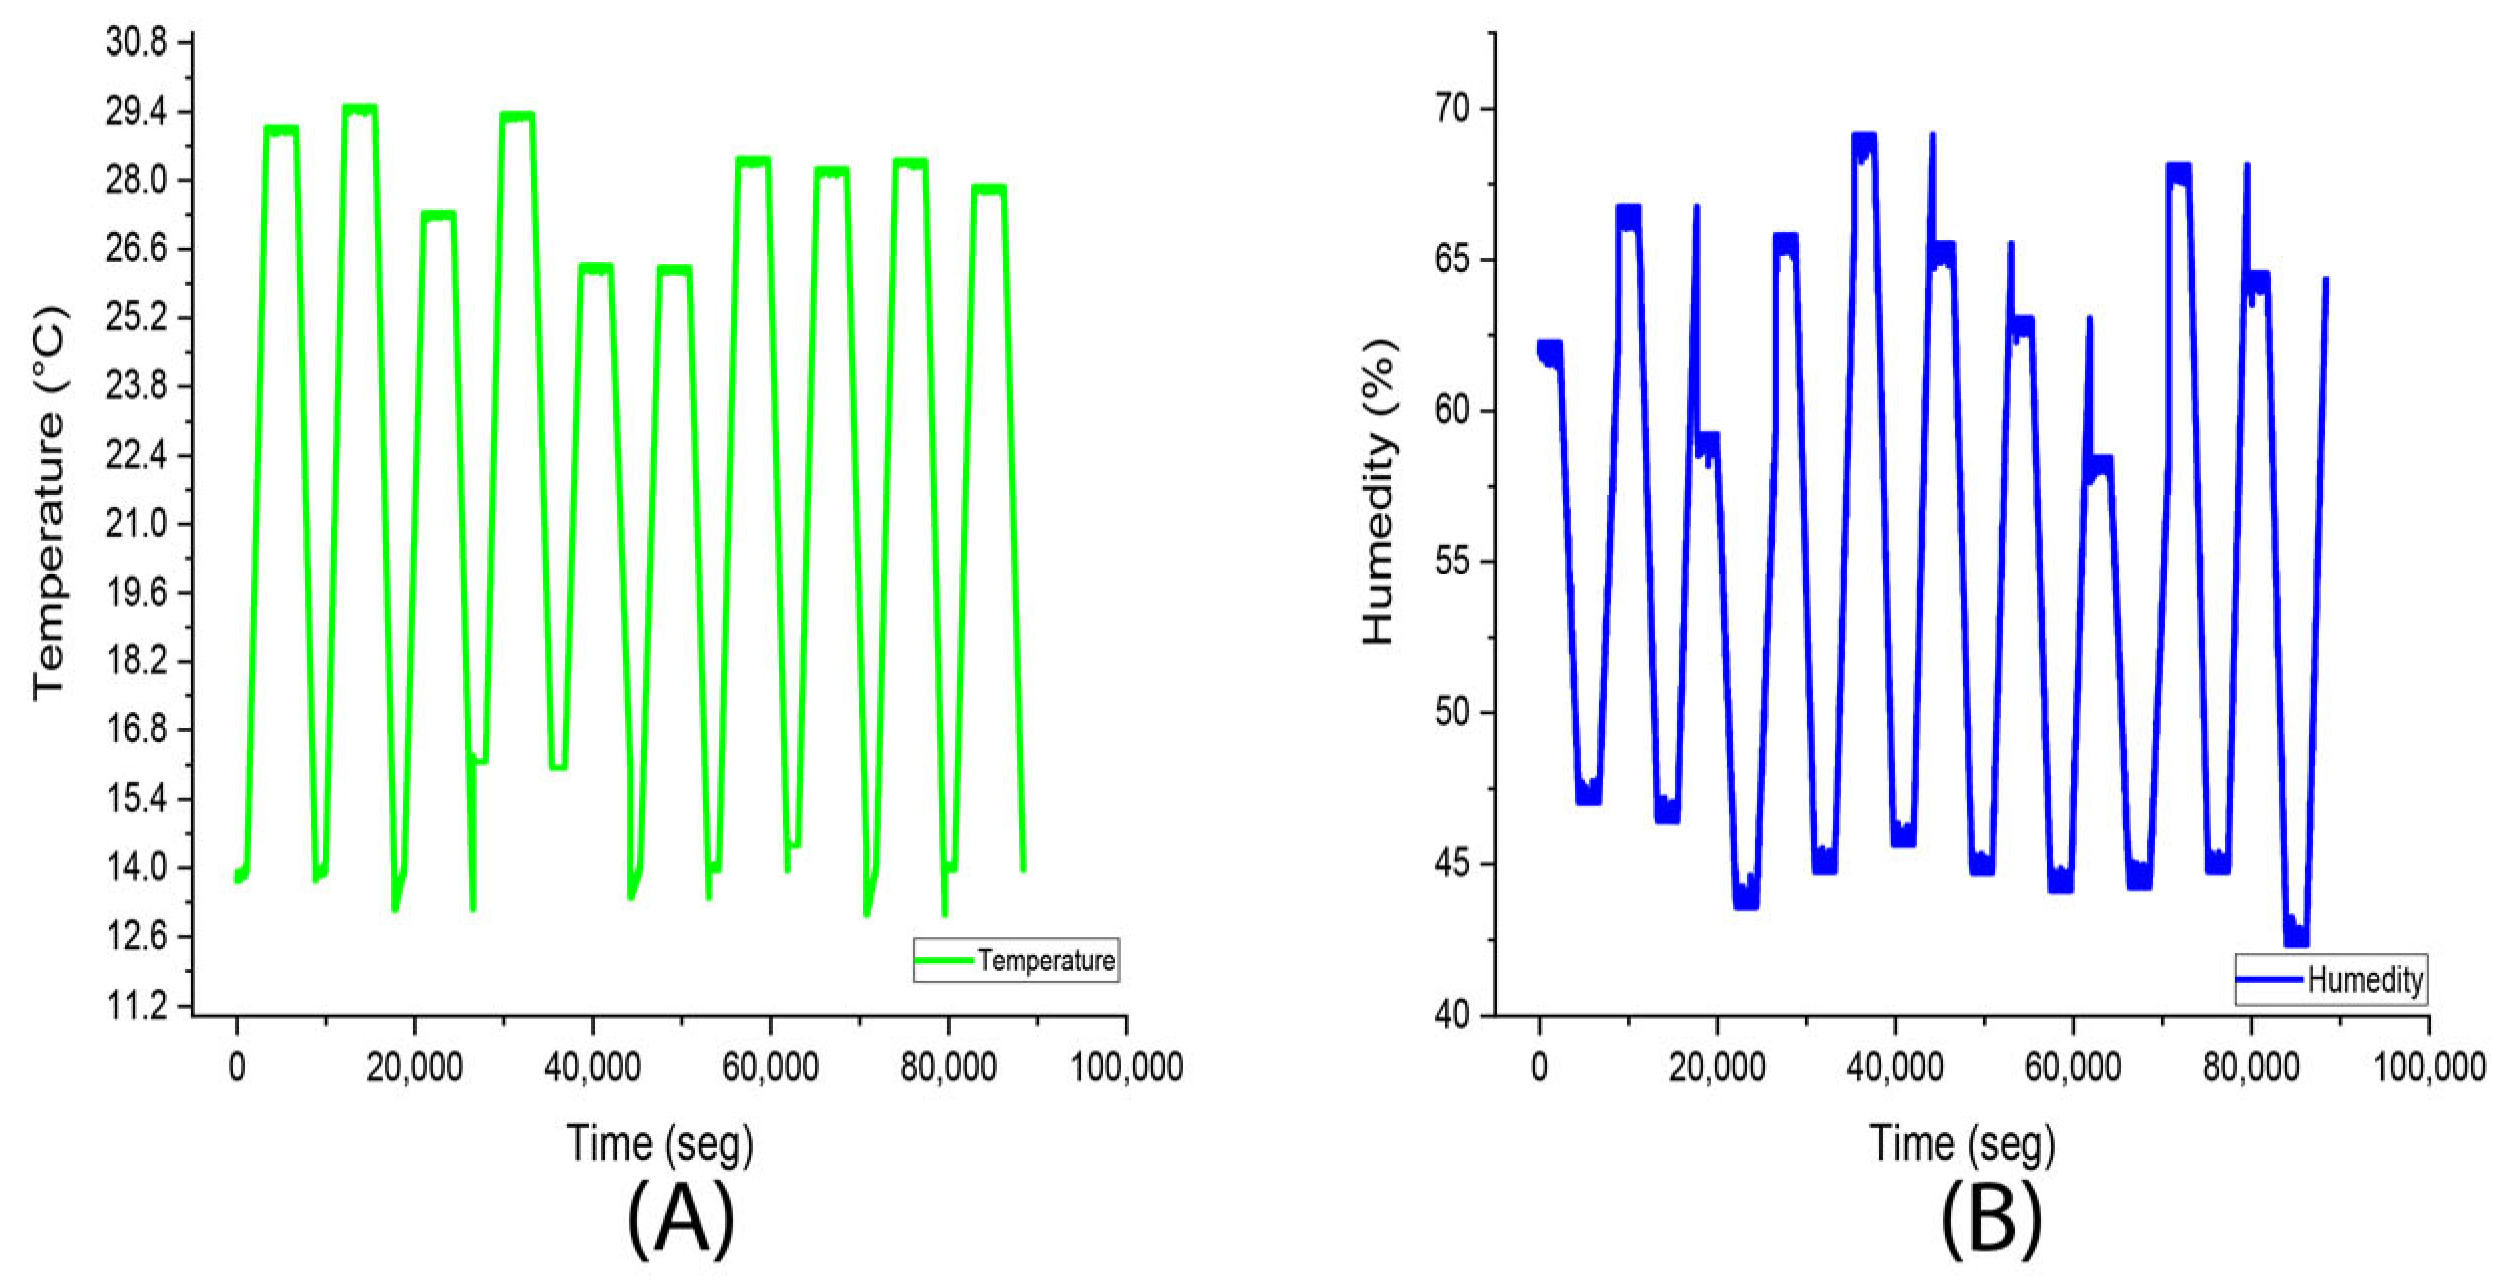
In comparison, the environmental conditions outside the chamber during the same period exhibit greater variability and lower central values. The external temperature had a lower mean of 22.8 °C, a median of 24.5 °C, and a mode of 28.4 °C, accompanied by a considerably larger standard deviation (5.5 °C) and variance (29.8 °C). These values indicate that outdoor temperature was less stable and more affected by environmental fluctuations. Additionally, the negative kurtosis (−1.3) and wider temperature spread between the minimum (13.0 °C) and maximum (29.5 °C) reflect a more dispersed and less controlled thermal environment.
Likewise, the external humidity data showed a mean of 54.5% with a median of 54.3% and mode of 44.7%, which contrasts sharply with the consistently high humidity maintained inside the chamber. The higher standard deviation (8.3%) and broader range (from 42.3% to 69.1%) reflect natural environmental variation. The negative kurtosis (−1.4) also indicates a flatter distribution with fewer extreme values compared to the chamber conditions (Figure 10).

3.3. Experiment 3 (Stevia rebaudiana Green Light)

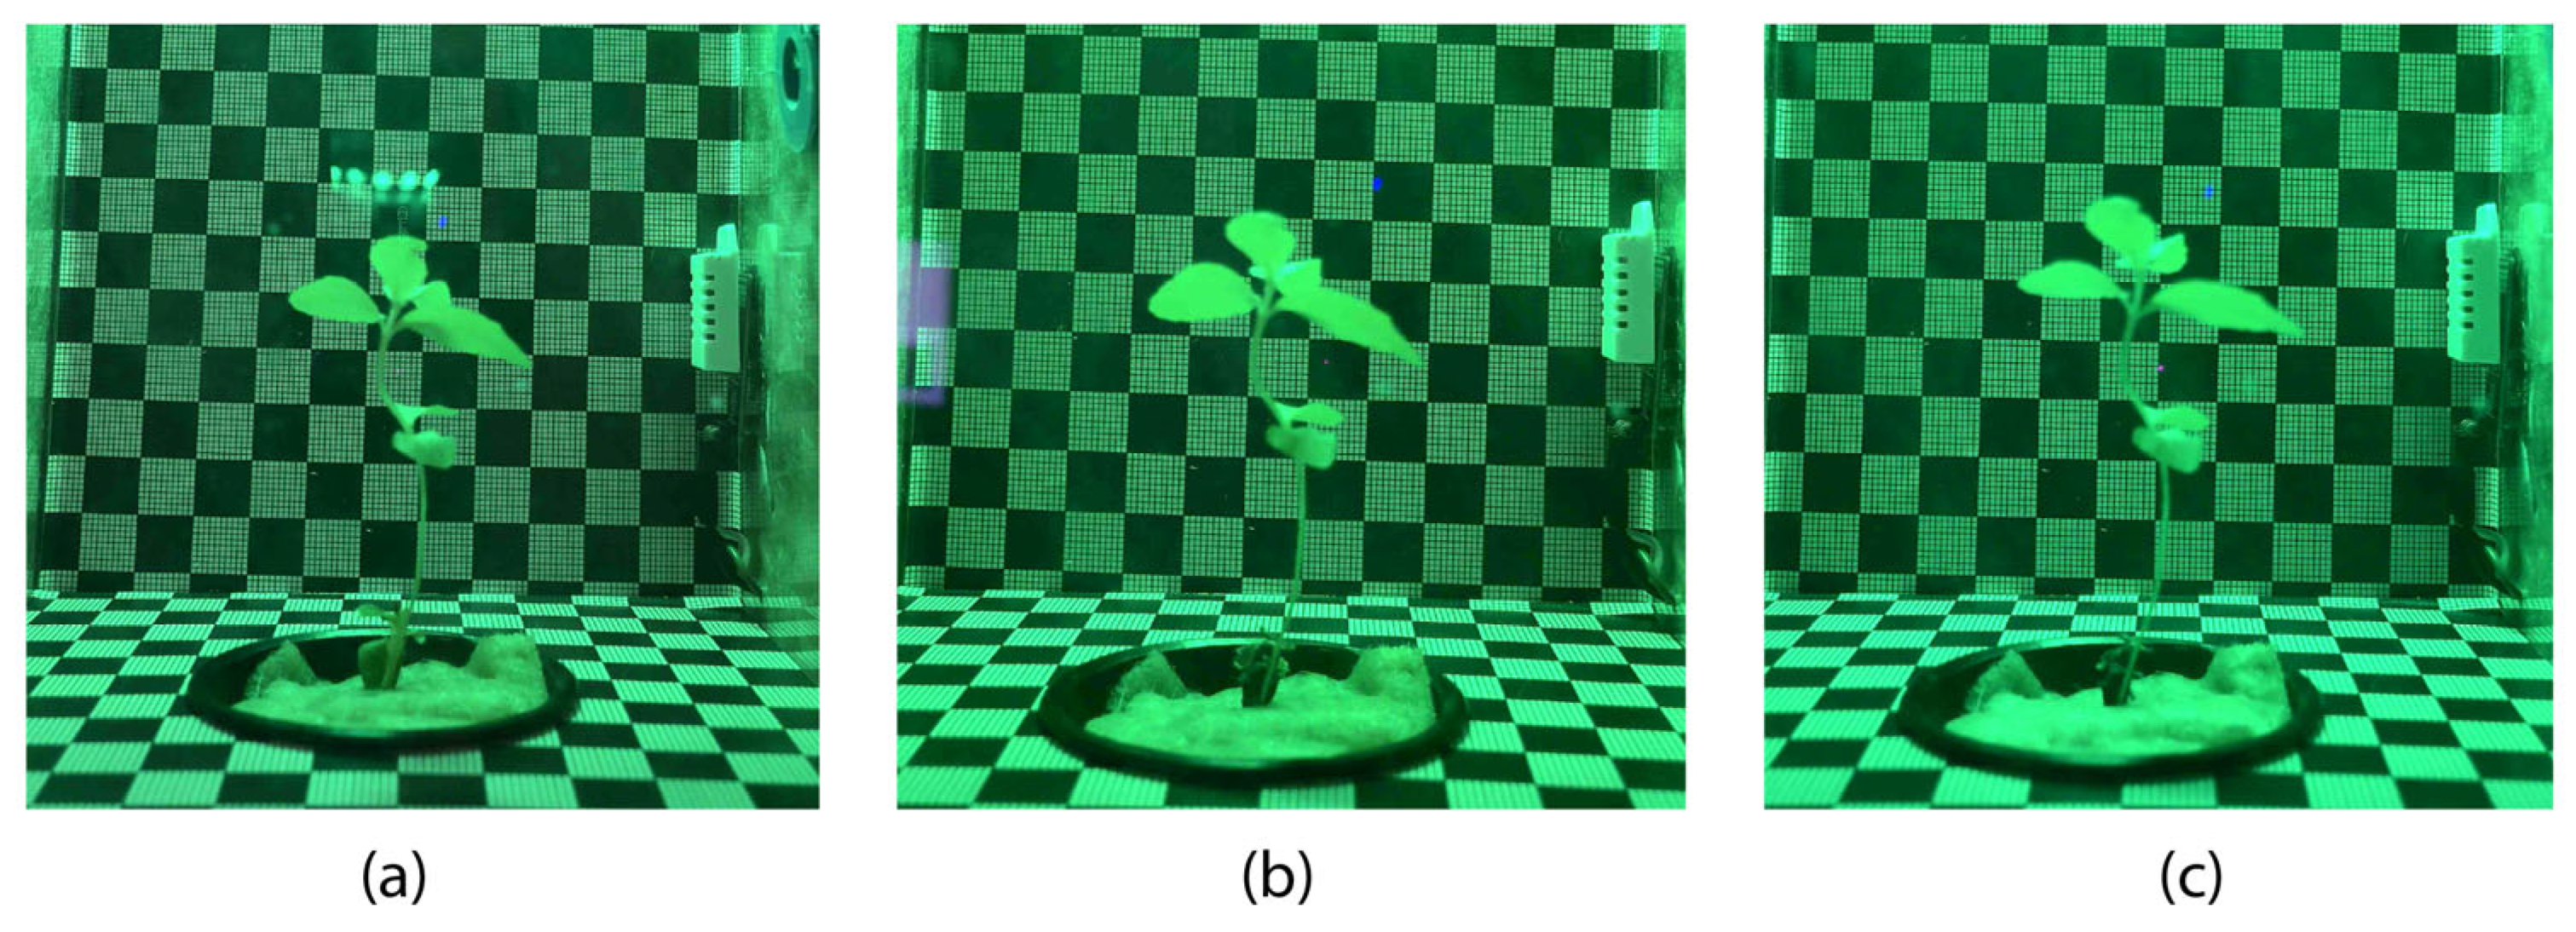
In the second experiment lasting 38 days, the values were set so that the LED light would irrigate the plant only with green color (Figure 11), which led to the following descriptive statistical results (Table 9).
During the green light experiment, a total of 2153 images were obtained in jpg format, which contain the temperature and humidity labels that were recorded inside the camera at the time of image capture, in the same way the csv file contains 28,199 records (Table 10), the temperature showed an average of 25.4 °C, with a median and mode of 25 °C, indicating a distribution centered around these values, in conjunction with the low standard deviation (1.2 °C) and the relatively narrow range (27 °C) suggest minimal variability in temperatures, on the other hand, the extremely high kurtosis (307.92 °C) and the negative skewness coefficient (−14.61 °C) reflect a bias towards lower temperatures. These results indicate a relatively stable temperature environment.
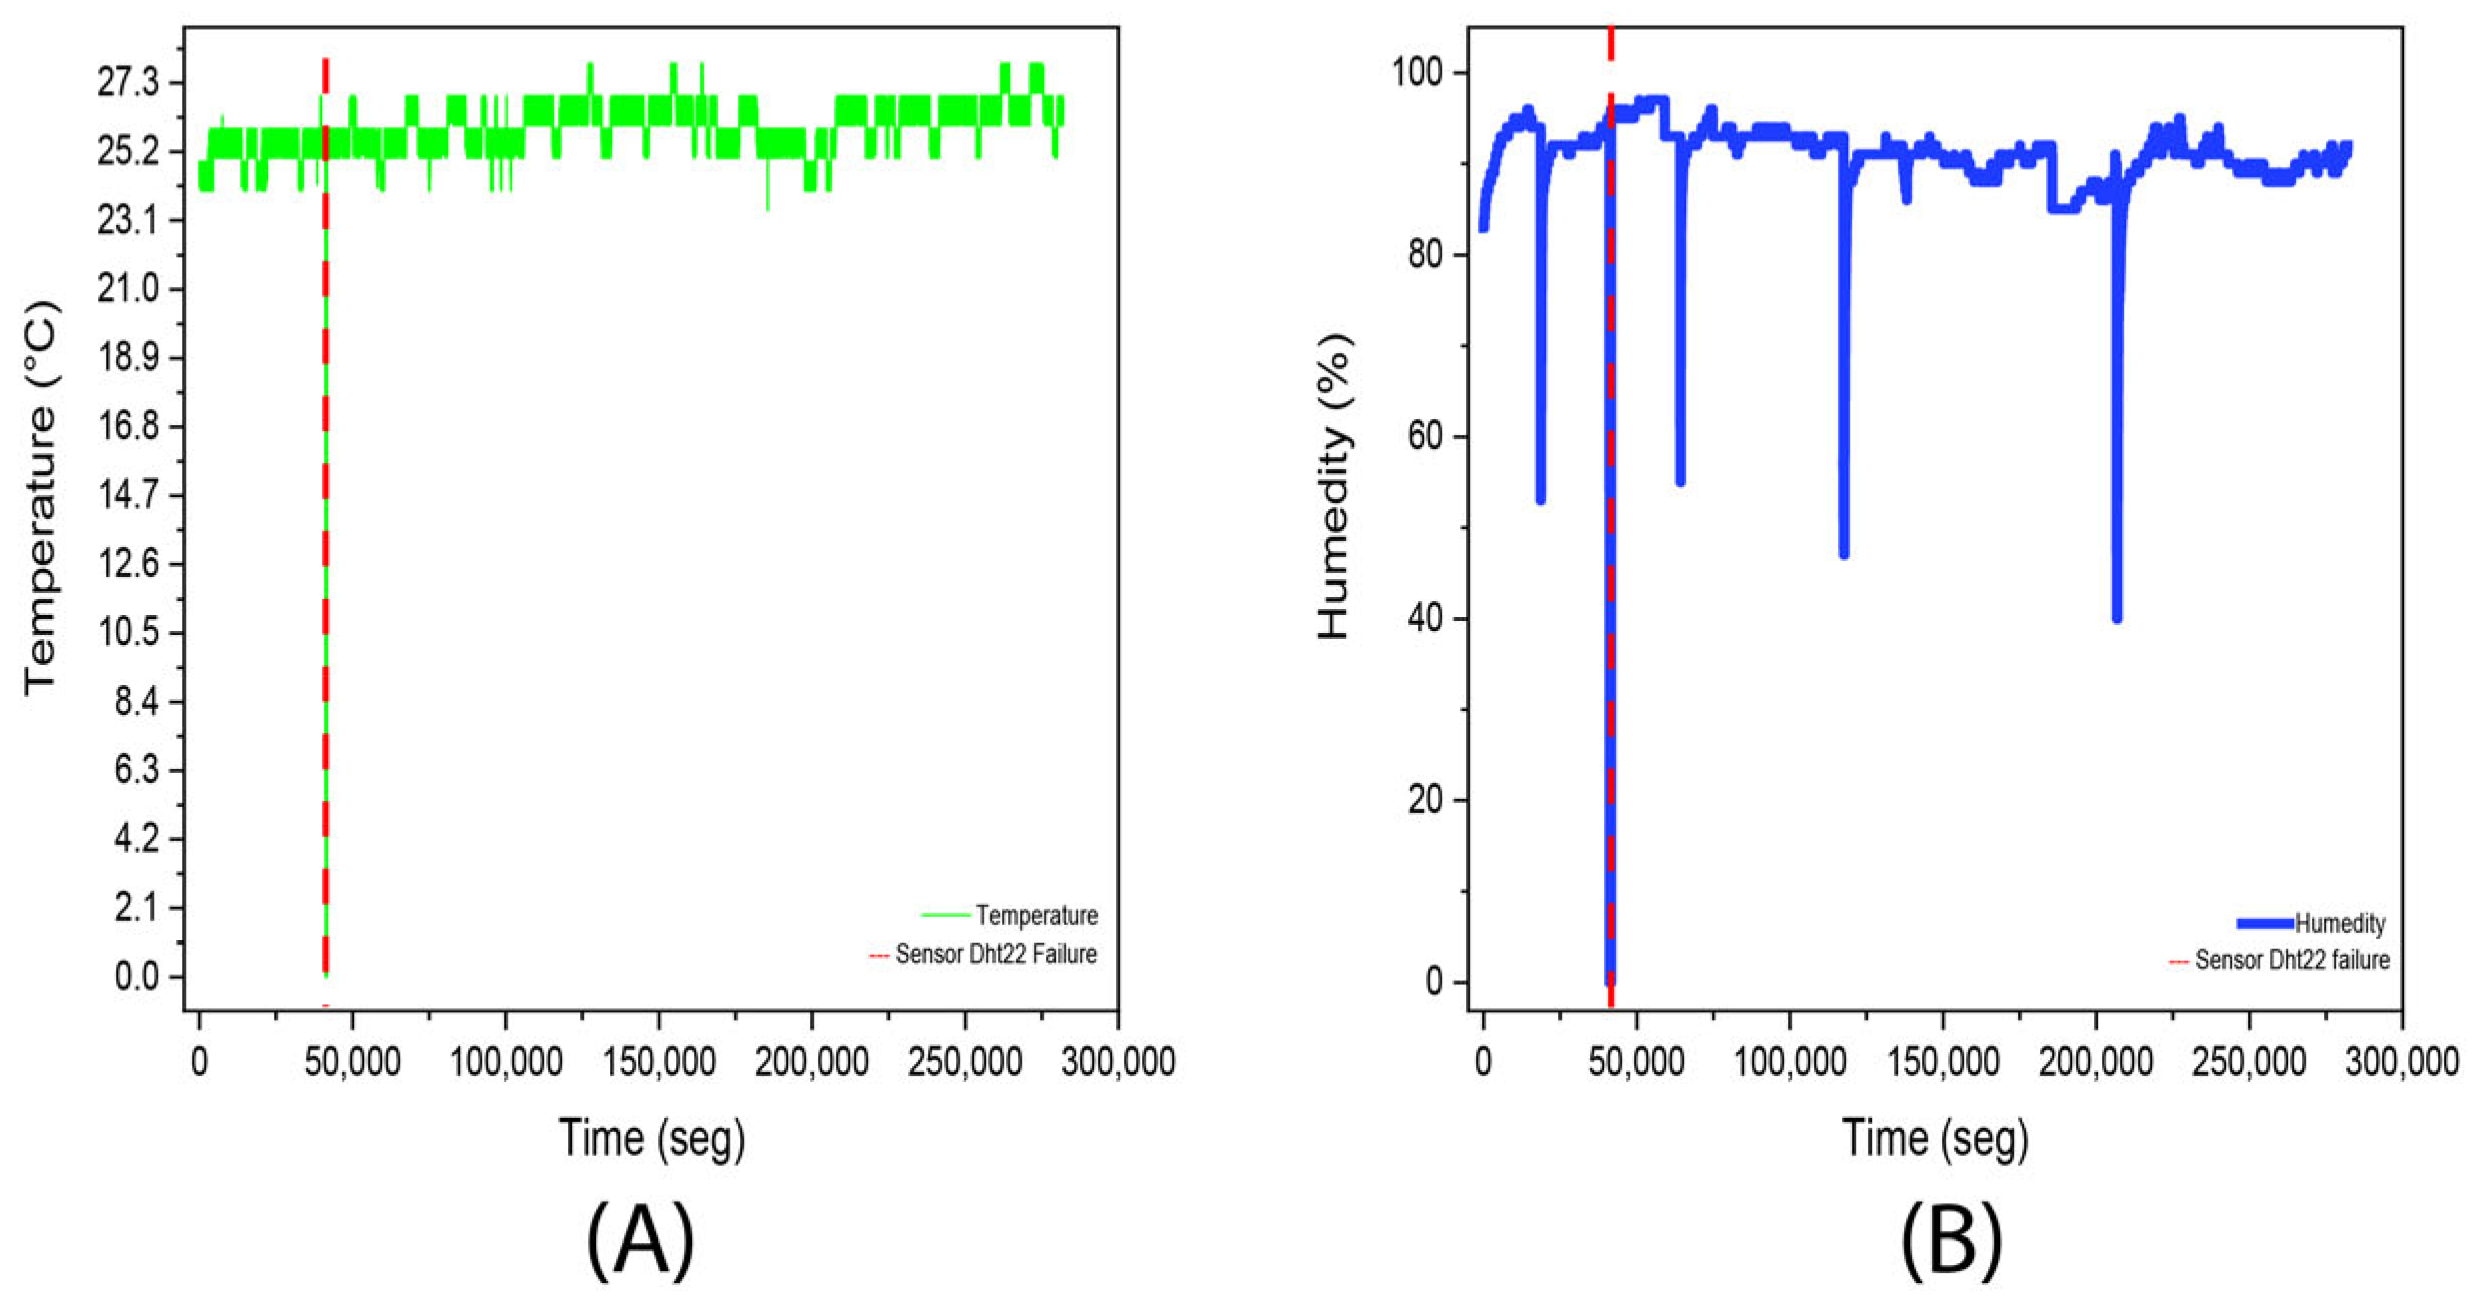
Regarding humidity, the mean was 90.8%, with a median of 91% and a mode of 93%, suggesting a high average level, in relation, the standard deviation (5.148%) and the wide range (97%) show considerable variability, possibly due to factors such as ventilation in the experimental chamber, on the other hand, the extremely high kurtosis (159.78%) and the negative skewness coefficient (−10.26%) indicate the presence of many extreme values and a tendency towards lower humidity values which could be due to the connection error explained above and which can be seen in Figure 12.
In contrast, the environmental conditions outside the chamber during the same period exhibited both lower humidity and greater variability in temperature. The external temperature had a mean of 25.5 °C and a median of 25.7 °C, close to the internal values, but with a higher standard deviation (3.1 °C) and a larger variance (9.6 °C), reflecting a less stable thermal environment influenced by natural fluctuations. The negative kurtosis (−1.3) and the wider span between the minimum (20.2 °C) and maximum (30.9 °C) reinforce this greater dispersion.
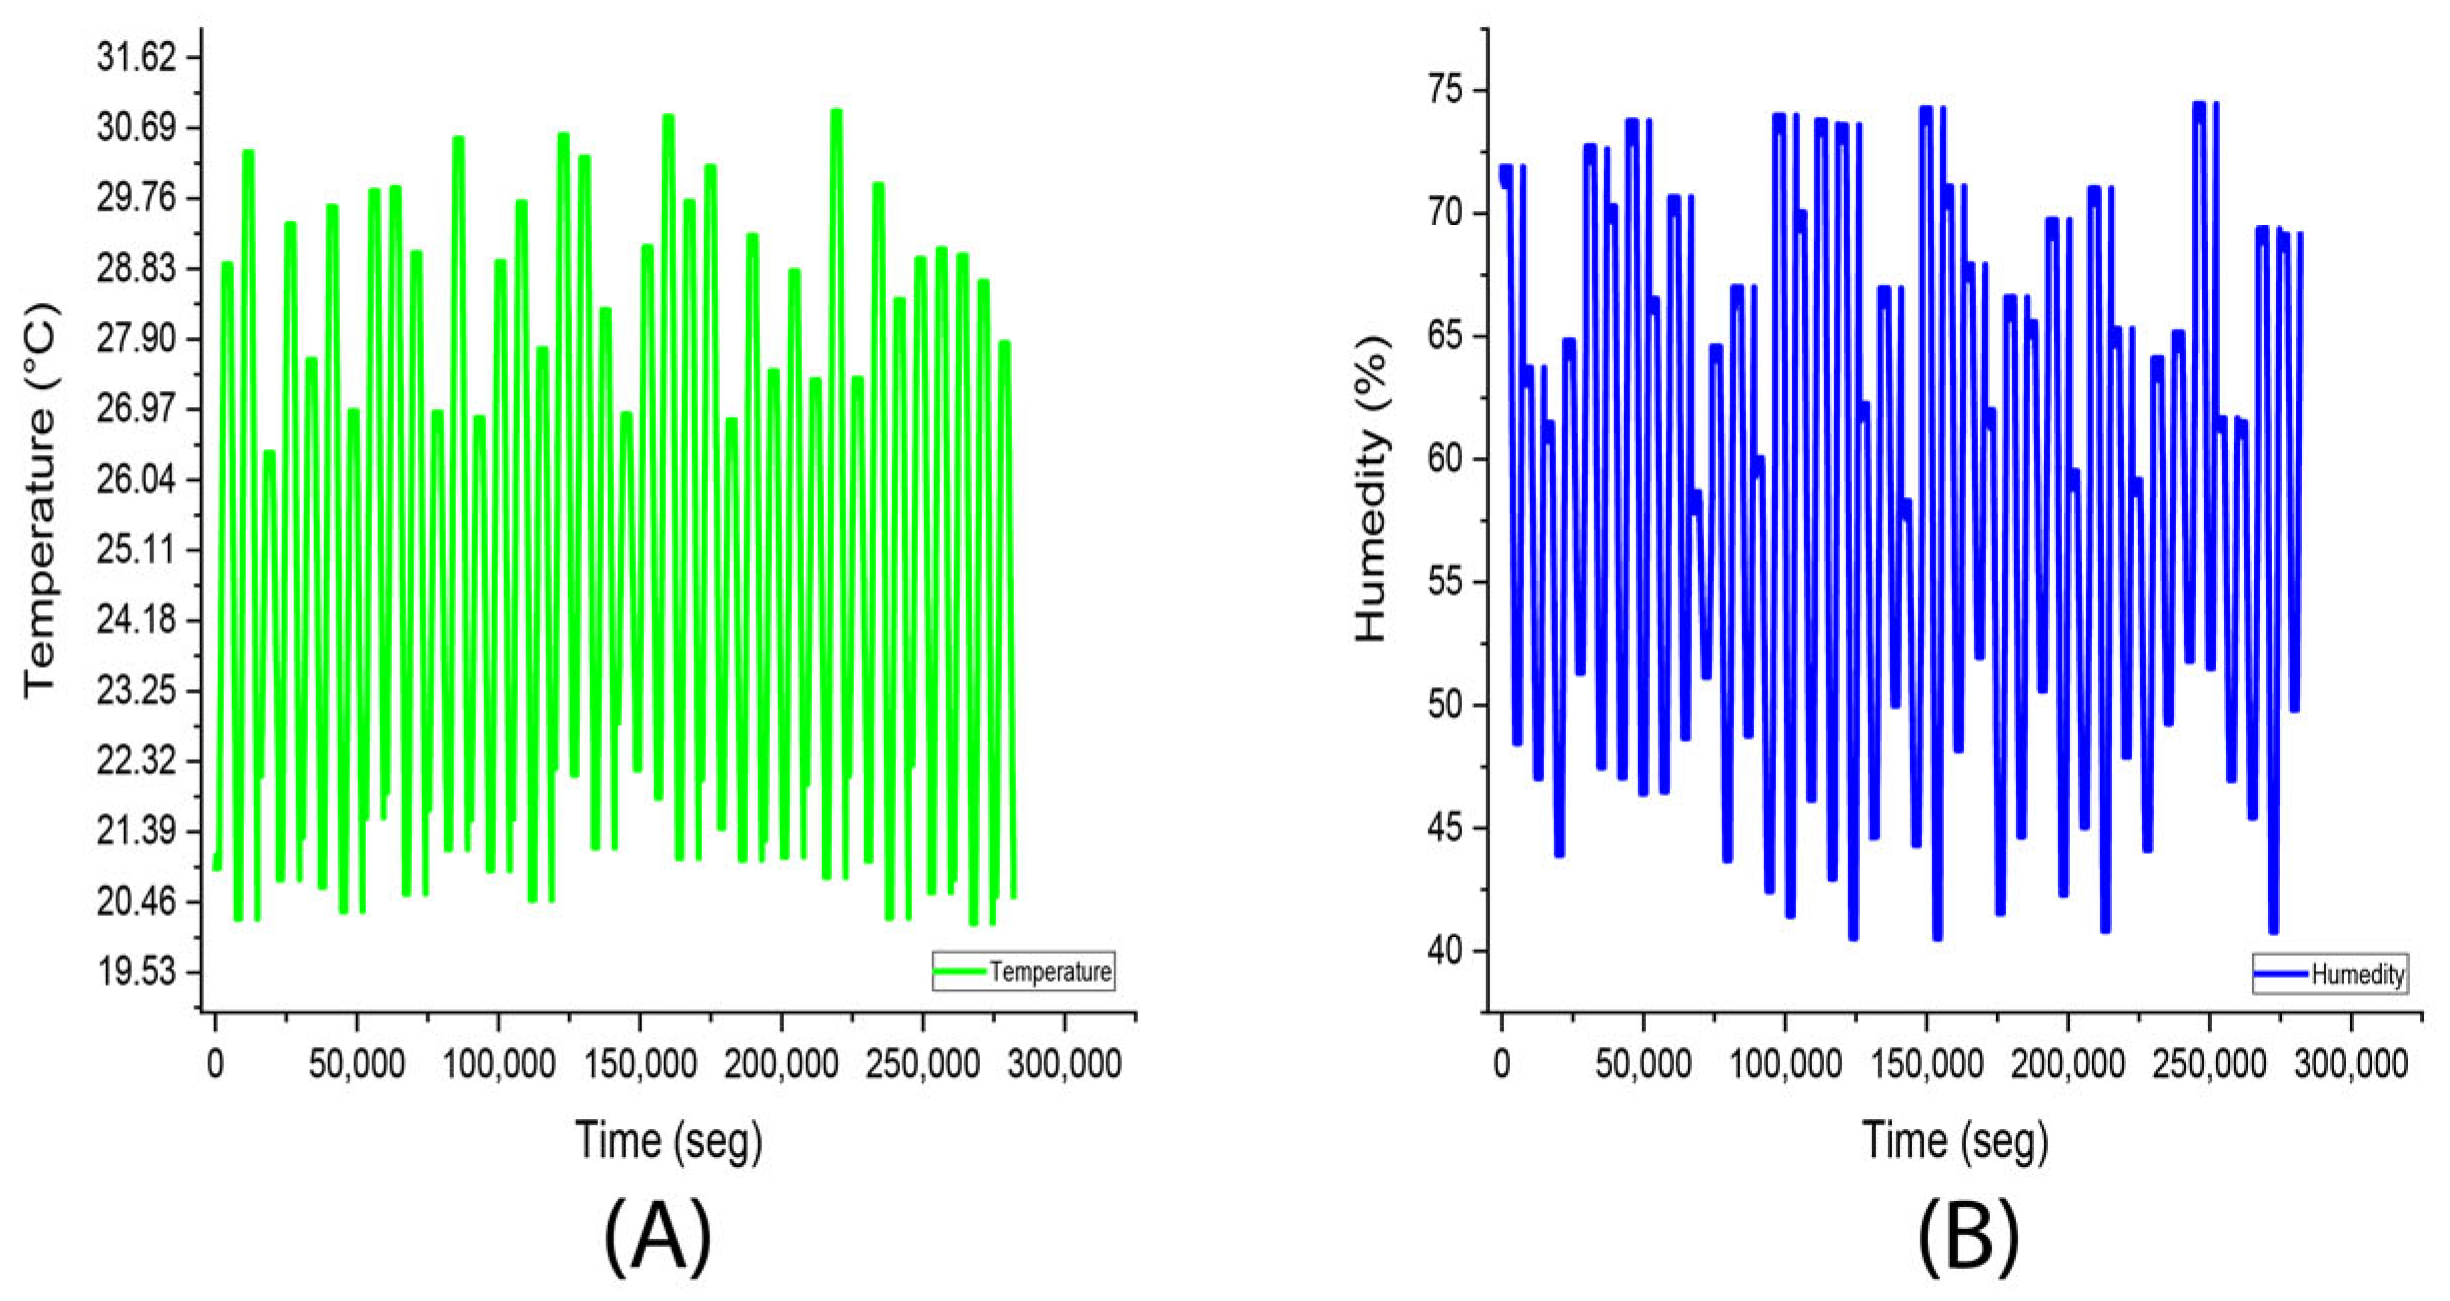
Similarly, the external humidity presented a mean of 58.3%, a median of 59.0%, and a mode of 67.9%, contrasting sharply with the consistently high relative humidity maintained inside the chamber. The higher standard deviation (9.6%) and variance (91.2%) indicate a broader range of environmental conditions outside the chamber (40.5% to 74.5%), whereas the chamber maintained humidity at levels close to saturation for extended periods. The negative kurtosis (−1.1) suggests a flatter distribution with fewer extreme values than those observed inside, where the influence of internal ventilation and sensor behavior led to pronounced peaks (Figure 13).
Overall, this comparison highlights that the green light experiment preserves stable and controlled internal temperature and humidity conditions, which differ significantly from the more variable external environment.

3.4. Experiment 4 (Stevia rebaudiana Blue Light)

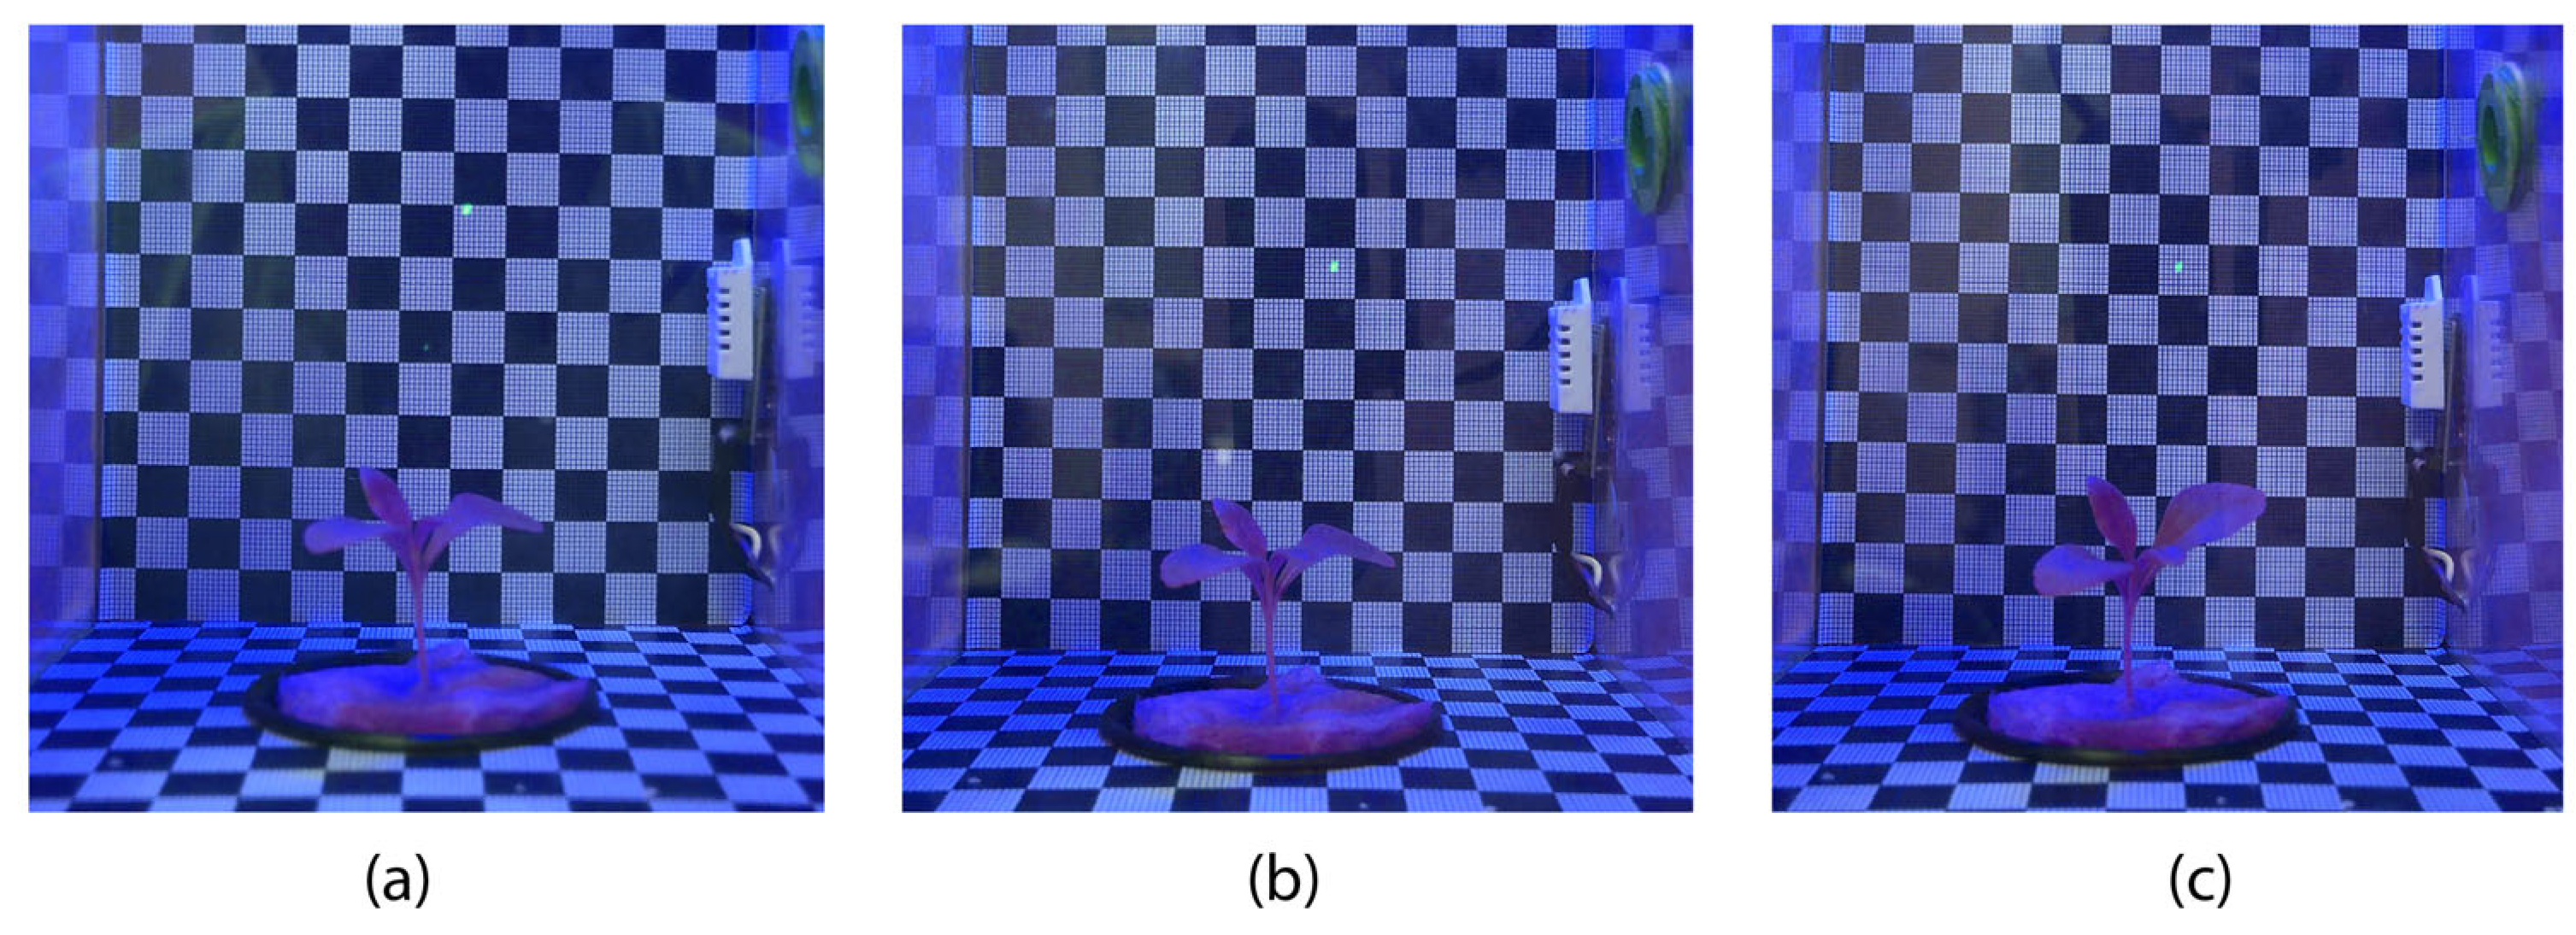
To finish the experiments, the lighting was set to maximum blue (Figure 14). This experiment lasted 12 days, during which the following data were obtained (Table 11).
During the blue light experiment, the results obtained were as follows: 2153 image files and 6190 records of which (Table 12), the temperature showed a mean of 26.3 °C, with a median and mode of 26 °C, indicating a distribution centered around these values, in relation, the low standard deviation (0.5 °C) and the relatively narrow range (3 °C) suggest minimal variability in temperatures, on the other hand, the negative kurtosis (−0.212 °C) and the almost neutral skewness coefficient (−0.025 °C) reflect a relatively flat distribution with a slight inclination towards lower temperatures. These results indicate a relatively stable temperature environment.
Regarding humidity, the mean was 88.3%, with a median of 89% and a mode of 87%, suggesting a high average level. The standard deviation (3.8%) and the wide range (40%) show considerable variability, possibly due to factors such as the error in the DHT22 sensor in the experimental chamber (Figure 15). On the other hand, the extremely high kurtosis (33.41%) and the negative skewness coefficient (−4.949%) indicate the presence of many extreme values and a tendency towards lower humidity values.
In comparison, the environmental conditions outside the chamber during the same experimental period show lower humidity levels and greater variability in both parameters. The external temperature presented a mean of 25.2 °C, a median of 25.4 °C, and a mode of 26.3 °C. However, the higher standard deviation (2.8 °C) and variance (7.8 °C) indicate a less controlled thermal environment, influenced by natural environmental fluctuations. The negative kurtosis (−1.1) and the broader temperature range (20.5 °C to 30.5 °C) further confirm a more dispersed distribution when compared to the stable temperature maintained within the chamber.
Similarly, the external humidity exhibited a mean of 59.1%, a median of 60.7%, and a mode of 74.9%, reflecting significantly lower moisture levels than those sustained inside the chamber. The considerably higher standard deviation (10.6%) and variance (112.0%) show a wide dispersion influenced by ambient outdoor conditions (Figure 16). Additionally, the negative kurtosis (−1.3) indicates a flatter distribution with fewer extreme humidity values, in contrast to the chamber data where extreme oscillations were detected due to sensor-related artifacts.
Overall, this comparison confirms that the chamber maintains controlled and consistently elevated humidity, along with stable temperature conditions, regardless of lighting conditions used in the experiment. Meanwhile, the external environment exhibits larger fluctuations in both temperature and humidity, reinforcing the functional relevance of the chamber as a controlled microclimate for plant development and for generating structured datasets suitable for artificial intelligence training and environmental modeling tasks.

4. Discussion

Currently, controlled environment agriculture is gaining increasing relevance within the modern agricultural landscape, driven by factors such as continuous population growth, urbanization, and the effects of climate change. In this context, plant growth chambers and propagation systems under specific conditions have enabled significant advances in the understanding and management of plant development. Several recent studies highlight the need to design accessible and reproducible cultivation chambers capable of maintaining precise environmental control, particularly for cutting propagation, which is a critical stage in plant multiplication [34].
However, the international literature indicates that although numerous cultivation chamber designs exist, few are oriented toward the systematic generation of structured data for artificial intelligence applications. For example, Złotkowska et al. demonstrated the effectiveness of automated phenotyping systems assisted by computer vision, but their approach is mainly focused on growth evaluation during advanced vegetative stages [40]. Similarly, Yasrab et al. explored growth prediction through time-series analysis, whereas Xu et al. integrated 2D images with point clouds for architectural quantification [41,42]. Nevertheless, these studies rely on datasets that do not provide detailed coverage of the early developmental stages of cuttings nor maintain rigorous temporal synchronization between environmental variables and visual signals.
The review by Tütüncü et al. on micropropagation also concludes that one of the main obstacles to advancing predictive models and intelligent control is the lack of multimodal databases with synchronized phenotypic and environmental information [43]. Paul et al. and Krishna et al. agree that the datasets used in most computer vision models in agriculture focus on detecting foliar diseases or stress in mature plants, leaving aside the rooting and early development processes, which are fundamental in propagation by cuttings [44,45].
In the field of industrial property, the World Intellectual Property Organization (WIPO) highlights significant growth in patent applications related to smart greenhouses, especially originating from China. Among them is patent CN203433329U, which describes a remote monitoring system for smart greenhouses based on a network of temperature, humidity, nutrient, CO2, and light sensors that transmit information to a central unit through ZigBee modules [46]. Meanwhile, patent US7823328B2 presents an aeroponic system for the propagation of cuttings in which the roots are exposed to controlled misting to promote oxygenation and development [47].
Despite these advances, a clear trend is evident: most research and industrial developments are oriented toward environmental control, remote supervision, or propagation automation, while the creation of structured and curated databases for experimental, comparative, or artificial intelligence training purposes remains largely unexplored. This gap is particularly limiting considering that early cutting development is a highly dynamic process, where small environmental variations can determine the success or failure of rooting.
In contrast to this situation, the CDC presented in this work was specifically designed to address this gap identified in both the literature and the patent landscape. Unlike systems that focus exclusively on propagation or remote monitoring, the CDC primary objective is the generation of synchronized multimodal databases, where high-resolution image capture is accompanied by real-time measurements of environmental variables such as light, temperature, relative humidity, CO2 concentration, and nutrient availability. This integration allows for precise documentation of the stages of cutting development—from callus induction to root formation and elongation—with complete temporal traceability.
Furthermore, the CDC was conceived as a modular, reproducible, and low-cost system, which facilitates its implementation in different laboratories, educational institutions, and production settings. The availability of technical specifications and standardized protocols allows not only for the replication of the equipment but also for the comparison of results across different experimental environments—something rarely found in patented or commercial chambers, which are generally designed as closed and minimally interoperable systems.
The integration of this platform with artificial intelligence techniques represents a promising perspective for the development of autonomous control systems in protected agriculture. While the present work focuses on the structured generation of data, the datasets derived from the CDC may serve future research aimed at implementing adaptive control, where advanced algorithms automatically modify environmental conditions based on the observed physiological state of the cutting. This opens the possibility of advancing toward truly intelligent and self-regulated agricultural systems.
Finally, several natural avenues for future research are identified from this development: the creation and publication of open and standardized datasets that allow for result comparison across laboratories; the evaluation of the CDC across different plant species and propagation techniques; and the exploration of early physiological signals for detecting stress or abnormalities in rooting. The availability of synchronized and multimodal data will enable, in the medium term, the construction of more precise diagnostic tools and more robust predictive models, strengthening the connection between plant biotechnology and artificial intelligence.

5. Conclusions

At the end of the experiments, it was concluded that the designed for the CDC showed optimal performance, achieving total control over the lighting (on, off, intensity, and visible light spectrum), which is crucial for plant growth. An 80% survival rate of the cuttings was obtained, further supporting the effectiveness of the chamber under the tested conditions; the remaining 20% was derived from early testing in the development of the CDC. Although variations in plant growth were observed during the experiments depending on the color of the applied light, it is important to emphasize that this was not the main objective of this study; on the contrary, the central purpose was to identify and solve possible flaws in the chamber design. Therefore, during the experimental process, several tests and adjustments were made that allowed these deficiencies to be detected and corrected.
Among the flaws found, some were related to the uniform distribution of light within the chamber and the disconnections of the DHT22 sensor, which led to a series of modifications and optimizations to resolve these issues present in the redesign of the CDC v2 chamber. The chamber’s design during the research period not only proved efficient in promoting cutting development, but also allowed for a controlled and stable environment for the plants. This environmental control is essential to minimize external variables that could affect the results of future experiments.
In conclusion, the results obtained indicate that the camera is a reliable tool for the creation of data sets on the development of cuttings; the improvements implemented ensure that the camera can continue to be used in future research with greater confidence in its performance and precision, therefore, the experience obtained in this study provides a valuable basis for the design and optimization of similar equipment in the field of agrotechnology research and opens the way for future work related to the storage and creation of data sets with the purpose of training neural networks, so that they have the capacity to intervene in the development and growth of plants.

Author Contributions

Conceptualization, J.G.Á.-S.; methodology, J.G.Á.-S., C.A.O.-O. and M.d.J.L.-M.; validation, J.G.Á.-S., V.M.-G., M.d.J.L.-M., and C.A.O.-O.; formal analysis, J.G.Á.-S., C.A.O.-O., and S.V.; investigation, J.G.Á.-S., V.M.-G., M.d.J.L.-M., and C.A.O.-O.; resources, C.A.O.-O., M.R.-E., G.M.S.-Z.; and C.L.C.-M.; data curation, J.G.Á.-S.; writing—original draft preparation, J.G.Á.-S., and C.A.O.-O.; writing—review and editing, V.M.-G., F.E.L.-M., and C.A.O.-O.; visualization, F.E.L.-M.; supervision, C.A.O.-O., and M.d.J.L.-M.; project administration, C.A.O.-O. All authors have read and agreed to the published version of the manuscript.

Funding

This research received no external funding.

Institutional Review Board Statement

Not applicable.

Informed Consent Statement

Not applicable.

Data Availability Statement

The original contributions presented in this study are included in this article. Further inquiries can be directed to the corresponding authors.

Conflicts of Interest

The authors declare no conflicts of interest.

Appendix A. Needs and Qualifications

This table shows the results of the surveys, which were conducted with 50 people involved in the fields of agronomy and artificial intelligence. After averaging all the responses and analyzing those with an average score greater than 4.0, the Chamber developed a conceptualization of 27 tasks to be completed in its initial process.
Table A1. This is a table caption.
Need CategoryNo.User Need (What the User Wants to Achieve or Avoid)Average
Environmental control1Maintain a constant and precise temperature.5
2Ensure an optimal level of relative humidity.4.3
3Provide adequate lighting (spectrum and photoperiod).5
4Regulate CO2 levels.3.6
5Ensure smooth, even air circulation.4.7
6Control the temperature of the substrate/root.1.6
7Eliminate excess heat generated by lighting.4.6
8Minimize condensation inside the chamber.5
Monitoring and Data9Know the exact temperature in real time.4.8
10View the humidity level at all times.4.8
11Measure light intensity (PAR).4.4
12Record CO2 levels over time.3.9
13Obtain periodic high-resolution images of each cutting.5
14Automatically measure the height and leaf size of each cutting.4.8
15Detect abnormalities or signs of stress/disease in cuttings.4.2
16Access a complete history of environmental conditions.1.2
17Collect data on the pH and EC of the culture medium.1.5
18Receive alerts if parameters go out of range.0.3
19Export data in compatible formats (CSV, Excel).5
20View graphs and trends of collected data.4.8
Automation and Control21Automate the irrigation/misting cycle.5
22Program the photoperiod and light intensity.4.5
23Adjust the fan speed.2.9
24Control the camera remotely (via mobile/web app).3.2
25Configure different “recipes” or growth profiles.1.2
Design and Ergonomics26That the camera is compact and does not take up much space.5
27Make it easy to clean and disinfect.4.7
28Make access to the cuttings easy and unobstructed.5
29That it has a robust and durable construction.4.8
30That the internal materials are non-toxic to plants.4.9
31That it is silent in operation.4.5
32That the design is aesthetic and professional.5
Maintenance and Longevity33That the main components are easy to replace.5
34Requiring minimal maintenance.4.8
35That it is energy efficient.4.7
36That the light source has a long useful life.4.5
37That the camera has readily available spare parts.4.7

Appendix B. Prototype Development and Testing
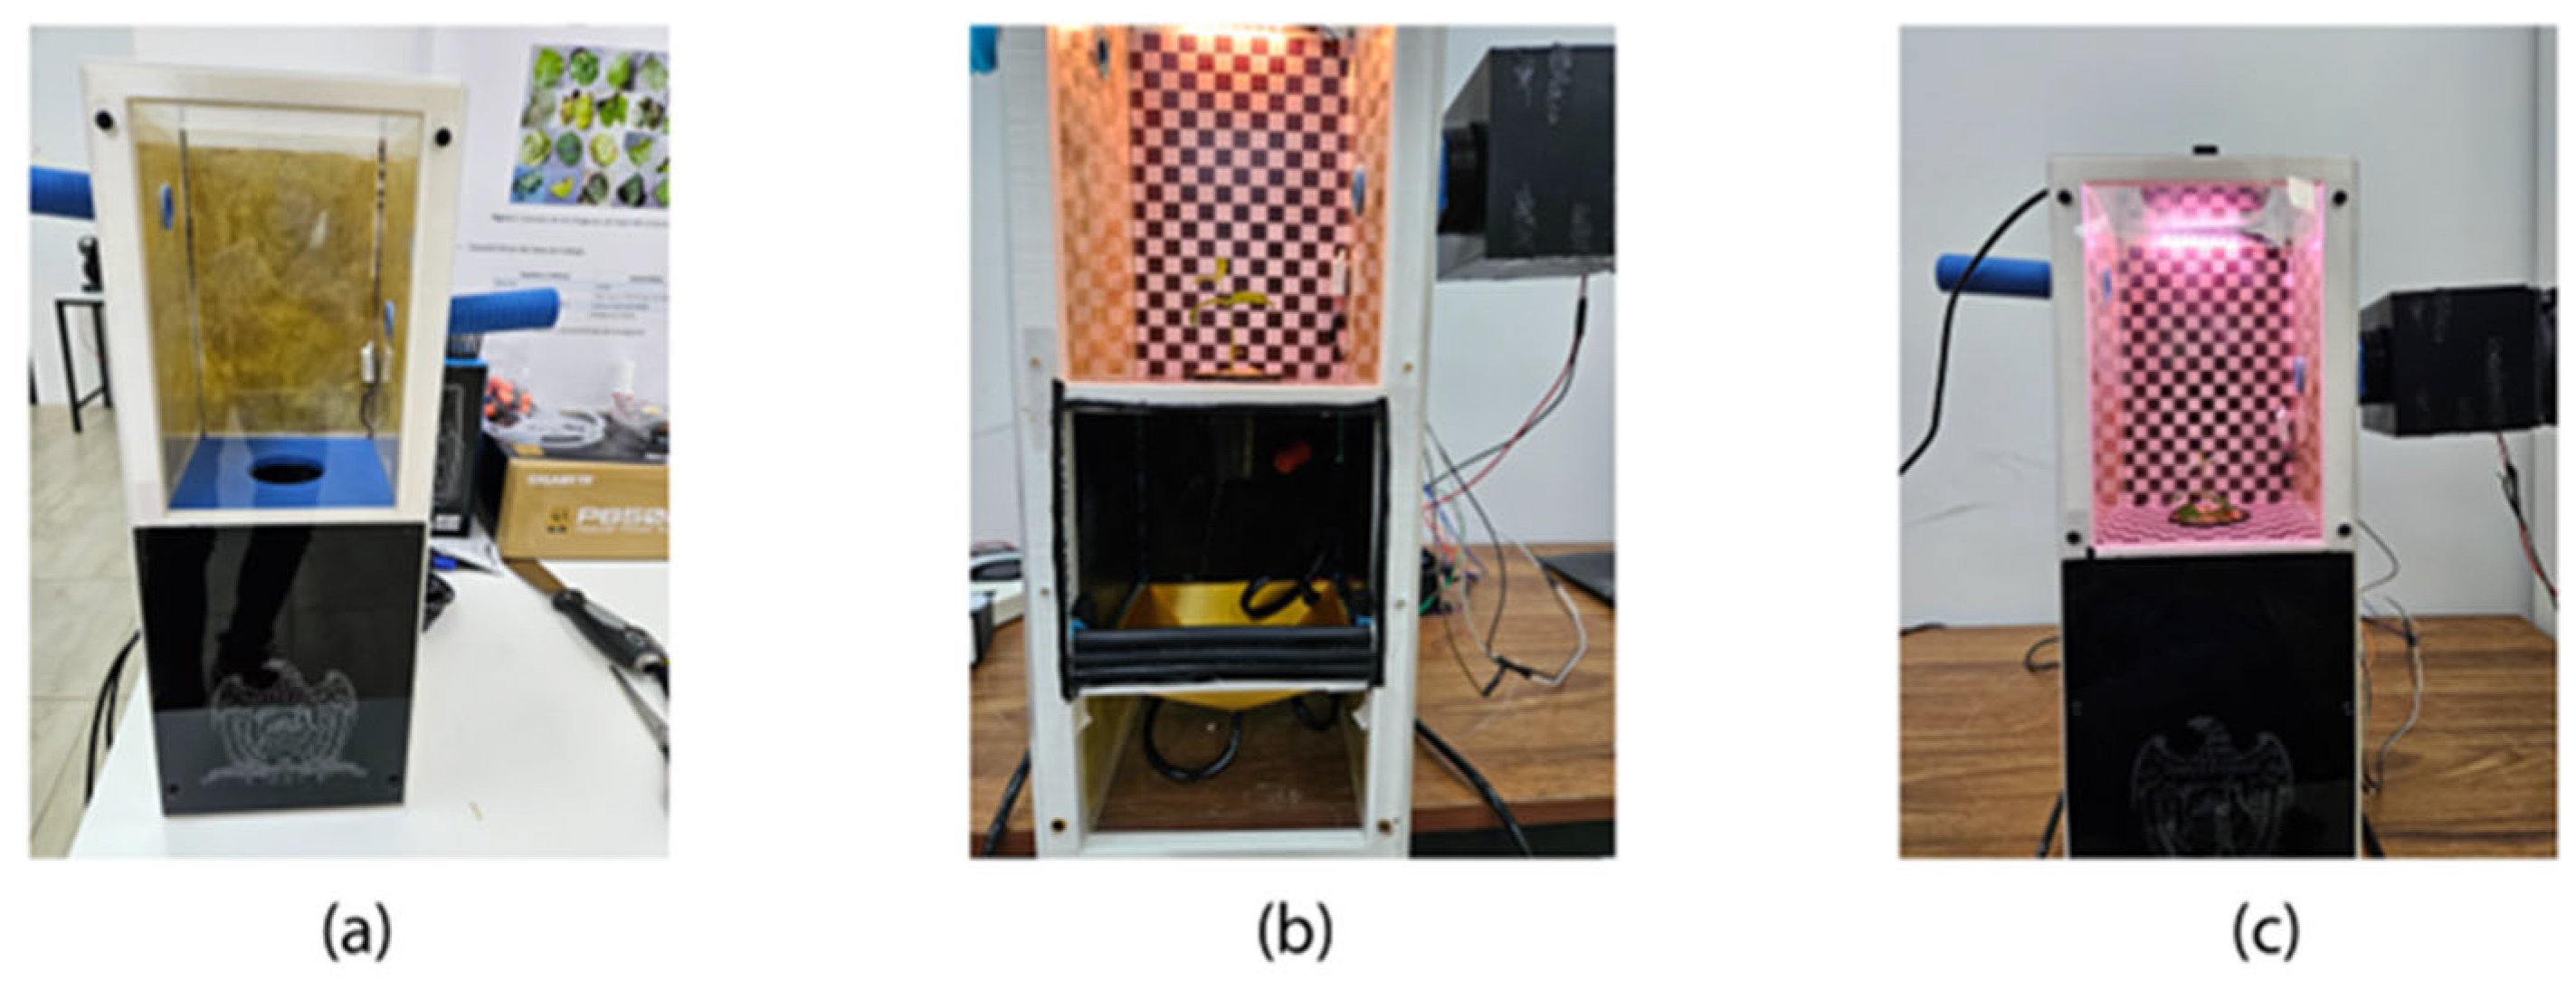
This section details the realization of the Cutting Development Chamber (CDC) concept through the prototype development phase, based on the diagram shown in Figure 1. The construction process is documented, showing the key stages in the creation of the chamber’s physical structure and the integration of its essential components (Figure A1a,b). Initial usability tests, designed to evaluate the prototype’s practical functionality in plant reproduction by cuttings under controlled conditions, are then presented (Figure A1c).
Figure A1. (a) Initial development of CDC, (b) Internal components of CDC, (c) Initial testing.
Inventions 10 00108 g0a1

References

  1. Charles, H.; Beddington, J.R.; Crute, I.R.; Lawrence, D.; Muir, J.F.; Pretty, J.; Robinson, S.; Sandy, M.; Thomas, S.M.; Toulmin, C. Food Security: The Challenge of Feeding 9 Billion People. Available online: www.sciencemag.org (accessed on 3 November 2025).
  2. Velazquez-Gonzalez, R.S.; Garcia-Garcia, A.L.; Ventura-Zapata, E.; Barceinas-Sanchez, J.D.O.; Sosa-Savedra, J.C. A Review on Hydroponics and the Technologies Associated for Medium- and Small-Scale Operations. Agriculture 2022, 12, 646. [Google Scholar] [CrossRef]
  3. Lin, B.B.; Philpott, S.M.; Jha, S. The future of urban agriculture and biodiversity-ecosystem services: Challenges and next steps. Basic Appl. Ecol. 2015, 16, 189–201. [Google Scholar] [CrossRef]
  4. Armanda, D.T.; Guinée, J.B.; Tukker, A. The second green revolution: Innovative urban agriculture’s contribution to food security and sustainability—A review. Glob. Food Secur. 2019, 22, 13–24. [Google Scholar] [CrossRef]
  5. Dennison, M.S.; Kumar, P.S.; Wamyil, F.; Meji, M.A.; Ganapathy, T. The role of automation and robotics in transforming hydroponics and aquaponics to large scale. Discov. Sustain. 2025, 6, 1–35. [Google Scholar] [CrossRef]
  6. Zhang, L.; Yang, X.; Li, T.; Gan, R.; Wang, Z.; Peng, J.; Hu, J.; Guo, J.; Zhang, Y.; Li, Q.; et al. Plant factory technology lights up urban horticulture in the post-coronavirus world. Hortic. Res. 2022, 9, uhac018. [Google Scholar] [CrossRef]
  7. Mun, H.-S.; Lagua, E.B.; Hong, S.-K.; Ryu, S.-B.; Sharifuzzaman; Hasan, K.; Kim, Y.-H.; Yang, C.-J. Energy-Efficient Technologies and Strategies for Feasible and Sustainable Plant Factory Systems. Sustainability 2025, 17, 3259. [Google Scholar] [CrossRef]
  8. Garcillanosa, M.M.; Batino, Z.M., Jr.; Gabuyo, E.A.; Mojica, T.L.; Del Mundo, M.A.; Impelido, D.G.; Sison, M.P.A.A. Efficient and Low-Cost Method of Smart Indoor Vertical Farming for Lactuca sativa L. with Machine Learning. Chem. Eng. Trans. 2023, 106, 535–540. [Google Scholar] [CrossRef]
  9. Chen, K.; Zhao, B.; Zhou, H.; Zhou, L.; Niu, K.; Jin, X.; Li, R.; Yuan, Y.; Zheng, Y. Digital Twins in Plant Factory: A Five-Dimensional Modeling Method for Plant Factory Transplanter Digital Twins. Agriculture 2023, 13, 1336. [Google Scholar] [CrossRef]
  10. Li, L.; Zhang, Q.; Huang, D. A Review of Imaging Techniques for Plant Phenotyping. Sensors 2014, 14, 20078–20111. [Google Scholar] [CrossRef]
  11. Kamilaris, A.; Prenafeta-Boldú, F.X. Deep learning in agriculture: A survey. Comput. Electron. Agric. 2018, 147, 70–90. [Google Scholar] [CrossRef]
  12. Mohanty, S.P.; Hughes, D.P.; Salathé, M. Using deep learning for image-based plant disease detection. Front. Plant Sci. 2016, 7, 1419. [Google Scholar] [CrossRef]
  13. Ayan, E.; Erbay, H.; Varçın, F. Crop pest classification with a genetic algorithm-based weighted ensemble of deep convolutional neural networks. Comput. Electron. Agric. 2020, 179, 105809. [Google Scholar] [CrossRef]
  14. Liu, W.; Han, T.; Wang, C.; Zhang, F.; Xu, Z. Predicting indoor temperature of solar green house by machine learning algorithms: A comparative analysis and a practical approach. Smart Agric. Technol. 2025, 12, 101096. [Google Scholar] [CrossRef]
  15. Chlingaryan, A.; Sukkarieh, S.; Whelan, B. Machine learning approaches for crop yield prediction and nitrogen status estimation in precision agriculture: A review. Comput. Electron. Agric. 2018, 151, 61–69. [Google Scholar] [CrossRef]
  16. Hemathilake, D.M.K.S.; Gunathilake, D.M.C.C. High-productive agricultural technologies to fulfill future food demands: Hydroponics, aquaponics, and precision/smart agriculture. In Global Trends, Opportunities, and Sustainability Challenges; Academic Press: London, UK, 2022; pp. 555–567. ISBN 978-0-323-91001-9. [Google Scholar] [CrossRef]
  17. Dsouza, A.; Newman, L.; Graham, T.; Fraser, E.D. Exploring the landscape of controlled environment agriculture research: A systematic scoping review of trends and topics. Agric. Syst. 2023, 209, 103673. [Google Scholar] [CrossRef]
  18. Ampim, P.A.Y.; Obeng, E.; Olvera-Gonzalez, E. Indoor Vegetable Production: An Alternative Approach to Increasing Cultivation. Plants 2022, 11, 2843. [Google Scholar] [CrossRef]
  19. Lozano-Castellanos, L.F.; Navas-Gracia, L.M.; Lozano-Castellanos, I.C.; Correa-Guimaraes, A. Technologies Applied to Artificial Lighting in Indoor Agriculture: A Review. Sustainability 2025, 17, 3196. [Google Scholar] [CrossRef]
  20. Singh, D.; Basu, C.; Meinhardt-Wollweber, M.; Roth, B. LEDs for energy efficient greenhouse lighting. Renew. Sustain. Energy Rev. 2014, 49, 139–147. [Google Scholar] [CrossRef]
  21. AI Boosts Indoor Food Production’s Energy Sustainability|Cornell Chronicle. Available online: https://news.cornell.edu/stories/2024/09/ai-boosts-indoor-food-productions-energy-sustainability?utm_source=chatgpt.com (accessed on 11 August 2025).
  22. Cai, W.; Bu, K.; Zha, L.; Zhang, J.; Lai, D.; Bao, H. Energy consumption of plant factory with artificial light: Challenges and opportunities. Renew. Sustain. Energy Rev. 2024, 210, 115235. [Google Scholar] [CrossRef]
  23. Comprar Propagador Con Calefacción Para Germinación Y Esquejes Elcogollo.es. Available online: https://www.elcogollo.es/accesorios/2111-propagador-electrico-pequeno-38x24x19-cms.html (accessed on 11 August 2025).
  24. Comprar Armario Para Esquejes Garden High Pro 60 × 40 × 2,00 Metros Elcogollo.es. Available online: https://www.elcogollo.es/propagadores-invernaderos-cannabis/5532-armario-propagador-l-garden-highpro.html (accessed on 11 August 2025).
  25. Comprar Armario Propagador Esquejes XL High Pro Elcogollo.es. Available online: https://www.elcogollo.es/propagadores-invernaderos-cannabis/5533-armario-propagador-xl-garden-highpro.html (accessed on 11 August 2025).
  26. Cámaras Climáticas Tipo Fitotrones Para Cultivo E Investigación de Plantas. Available online: https://www.mpcontrol.es/equipos/camaras-climaticas-fitotrones-para-cultivo-crecimiento-e-investigacion-de-plantas-e-insectos (accessed on 11 August 2025).
  27. Greenhouse Sensor Data-10 Minute Interval. Available online: https://www.kaggle.com/datasets/marcelboonman/greenhouse-sensor-data-10-minute-interval?utm_source=chatgpt.com (accessed on 11 August 2025).
  28. Ihoume, I.; Tadili, R.; Arbaoui, N.; Benchrifa, M.; Idrissi, A.; Daoudi, M. Developing a TinyML-Oriented Deep Learning Model for an Intelligent Greenhouse Microclimate Control from Multivariate Sensed Data. Lect. Notes Netw. Syst. 2023, 579, 283–291. [Google Scholar] [CrossRef]
  29. Ećim-Đurić, O.; Milanović, M.; Dimitrijević-Petrović, A.; Mileusnić, Z.; Dragičević, A.; Miodragović, R. Prediction of Greenhouse Microclimatic Parameters Using Building Transient Simulation and Artificial Neural Networks. Agronomy 2024, 14, 1147. [Google Scholar] [CrossRef]
  30. Rasheed, A.; Kwak, C.S.; Kim, H.T.; Lee, H.W. Building Energy an Simulation Model for Analyzing Energy Saving Options of Multi-Span Greenhouses. Appl. Sci. 2020, 10, 6884. [Google Scholar] [CrossRef]
  31. Ahamed, M.S.; Guo, H.; Tanino, K. Energy-efficient design of greenhouse for Canadian Prairies using a heating simulation model. Int. J. Energy Res. 2018, 42, 2263–2272. [Google Scholar] [CrossRef]
  32. Boersma, S.; Cheng, X. A Bayesian Neural ODE for a Lettuce Greenhouse. In Proceedings of the 2024 IEEE Conference on Control Technology and Applications, CCTA 2024, Newcastle upon Tyne, UK, 21–23 August 2024; pp. 782–786. [Google Scholar] [CrossRef]
  33. Jara-Villagrana, M.F.; Olvera-Olvera, C.A.; Villagrana-Barraza, S.; Castro-Tapia, S.; Ibarra-Delgado, S.; Gómez-Rodríguez, J.R.; Sandoval-Aréchiga, R.; Rodríguez-Abdalá, V.I.; Díaz-Flórez, G. Conceptual Design Based on Modular Platforms for a Prototype of a Functional Growth Chamber for Cuttings in Controlled Agriculture. Designs 2025, 9, 86. [Google Scholar] [CrossRef]
  34. Guerrero-Sánchez, J.; Olvera-Olvera, C.A.; Solis-Sánchez, L.O.; Martínez-Blanco, M.D.R.; López-Martínez, M.d.J.; Castañeda-Miranda, C.L.; Soto-Zarazúa, G.M.; Díaz-Flórez, G. Design and Implementation of a Low-Cost Controlled-Environment Growth Chamber for Vegetative Propagation of Mother Plants. Agriengineering 2025, 7, 177. [Google Scholar] [CrossRef]
  35. van der Borg, G.; Warner, H.; Ioannidis, M.; Bogaart, G.v.D.; Roos, W.H. PLA 3D Printing as a Straightforward and Versatile Fabrication Method for PDMS Molds. Polymers 2023, 15, 1498. [Google Scholar] [CrossRef]
  36. Shukla, M.R.; Singh, A.S.; Piunno, K.; Saxena, P.K.; Jones, A.M.P. Application of 3D printing to prototype and develop novel plant tissue culture systems. Plant Methods 2017, 13, 1–10. [Google Scholar] [CrossRef] [PubMed]
  37. Compute Heat Index with Arduino and DHT Sensor One Transistor. Available online: https://www.onetransistor.eu/2018/01/compute-heat-index-arduino-dht.html?utm_source=chatgpt.com (accessed on 11 August 2025).
  38. Full Spectrum, Vs. Red/Blue LED Grow Lights|P.L. Light Systems. Available online: https://pllight.com/articles/2020/09/01/full-spectrum-vs-red-blue-leds/?utm_source=chatgpt.com (accessed on 11 August 2025).
  39. LED Grow Light (WS2812*10)—Smarthon Documentation 1.0 Documentation. Available online: https://smarthon-docs-en.readthedocs.io/en/latest/Sensors_and_actuators/LED_Grow_Light.html?utm_source=chatgpt.com (accessed on 11 August 2025).
  40. Złotkowska, E.; Wlazło, A.; Kiełkiewicz, M.; Misztal, K.; Dziosa, P.; Soja, K.; Barczak-Brzyżek, A.; Filipecki, M. Automated imaging coupled with AI-powered analysis accelerates the assessment of plant resistance to Tetranychus urticae. Sci. Rep. 2024, 14, 1–16. [Google Scholar] [CrossRef]
  41. Yasrab, R.; Zhang, J.; Smyth, P.; Pound, M.P. Predicting Plant Growth from Time-Series Data Using Deep Learning. Remote. Sens. 2021, 13, 331. [Google Scholar] [CrossRef]
  42. Xu, J.; Liu, H.; Shen, Y. Image and Point Cloud-Based Neural Network Models and Applications in Agricultural Nursery Plant Protection Tasks. Agronomy 2025, 15, 2147. [Google Scholar] [CrossRef]
  43. Tütüncü, M. Application of machine learning in in vitro propagation of endemic Lilium akkusianum R. Gämperle. PLoS ONE 2024, 19, e0307823. [Google Scholar] [CrossRef] [PubMed]
  44. Paul, N.; Sunil, G.; Horvath, D.; Sun, X. Deep learning for plant stress detection: A comprehensive review of technologies, challenges, and future directions. Comput. Electron. Agric. 2025, 229, 109734. [Google Scholar] [CrossRef]
  45. Krishna, M.S.; Machado, P.; Otuka, R.I.; Yahaya, S.W.; dos Santos, F.N.; Ihianle, I.K. Plant Leaf Disease Detection Using Deep Learning: A Multi-Dataset Approach. J 2025, 8, 4. [Google Scholar] [CrossRef]
  46. CN203433329U-Dispositivo Inteligente de Monitorización Remota de Invernaderos Mediante Internet de Las Cosas-Patentes de Google. Available online: https://patents.google.com/patent/CN203433329U/en (accessed on 3 November 2025).
  47. US7823328B2-Sistema de Cultivo Aeropónico de Plantas-Patentes de Google. Available online: https://patents.google.com/patent/US7823328B2/en (accessed on 3 November 2025).
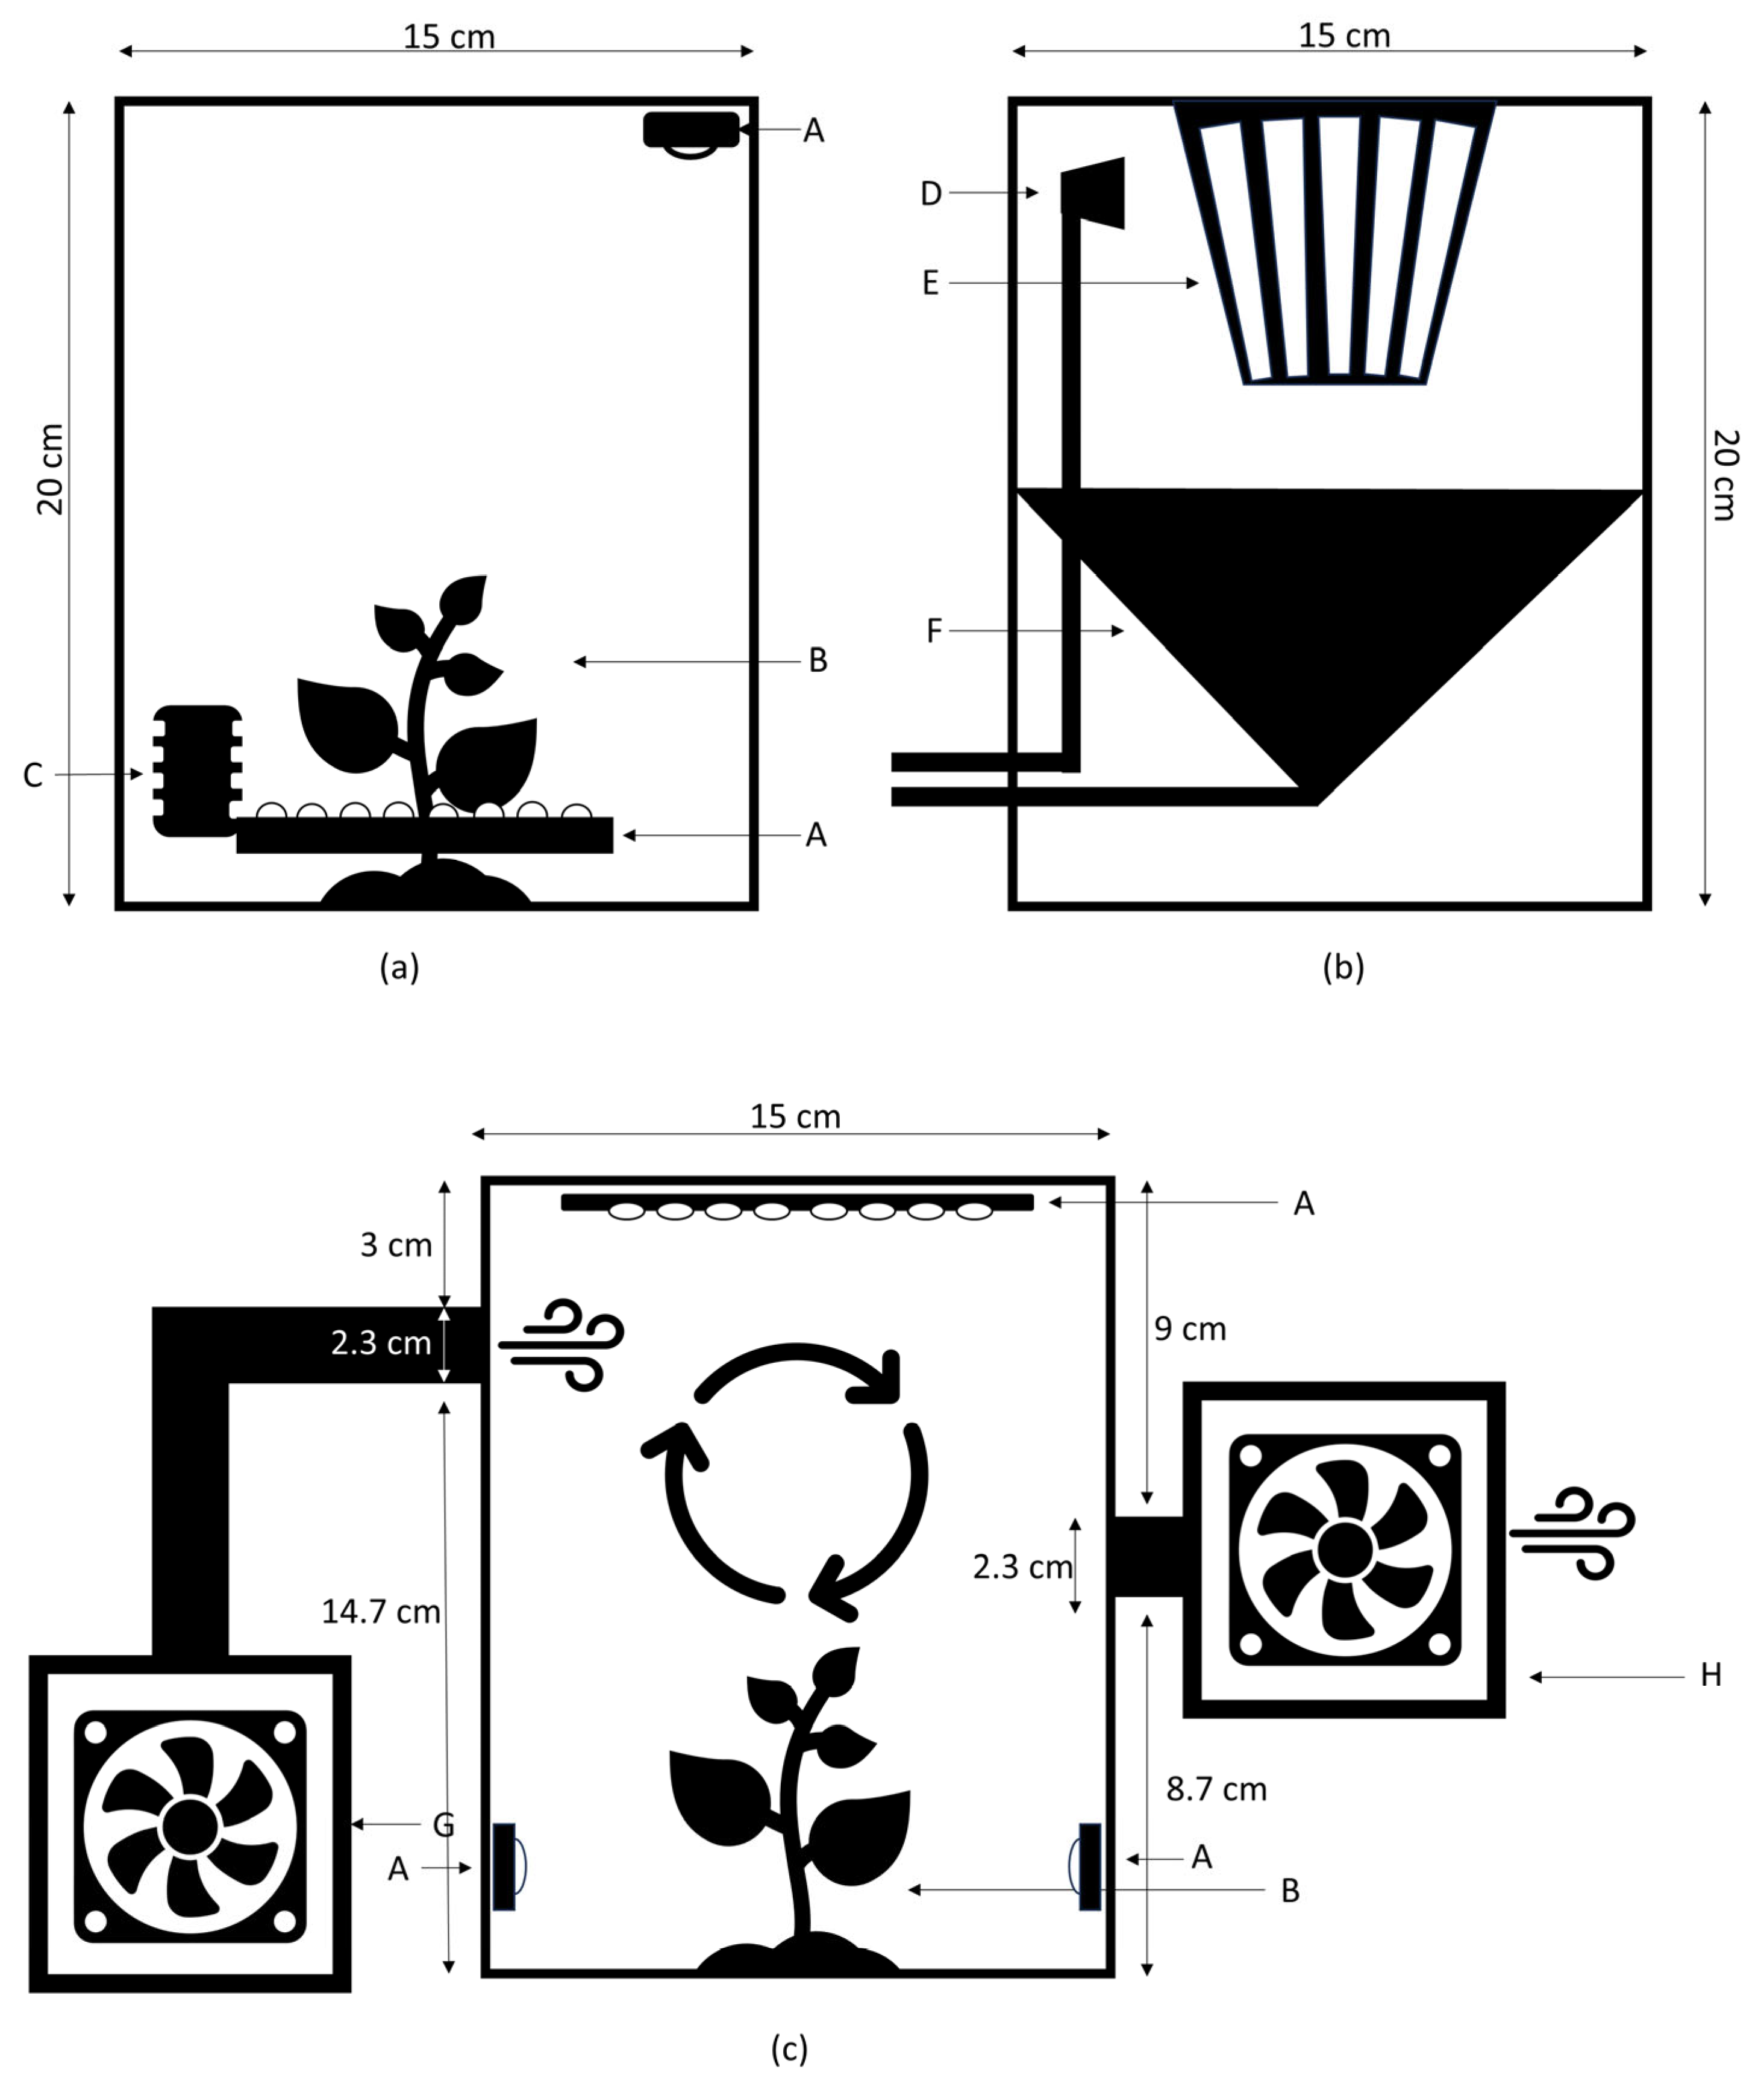
Figure 1. Structural diagram of the cutting development chamber, (a) Leaf growth area, (b) Root growth area, (c) Ventilation system; A: RGB LED light. B: Leaf growth. C: HDT22 sensor. D: Irrigation system. E: Rooting basket. F: Drainage system. G: Cooling system. H: Extractor, (This figure illustrates only the internal structure and environmental control components of the Cutting Development Chamber. The external nutrient and irrigation system is shown separately in Figure 2).
Inventions 10 00108 g001
Figure 2. Computer-aided schematic of CDC. The system consists of a cutting container, a drainage system, an environmental parameter maintenance system (humidity, temperature and light) consisting of sensors, RGB LED strips, a temperature control system and an extractor, an irrigation system consisting of a solution container, a waste container, a water pump, a control system consisting of an ARDUINO UNO, a power system (power supply and relays) and finally a data storage system (computer).
Inventions 10 00108 g002
Figure 3. Control and data management system for the cutting development chamber.
Inventions 10 00108 g003
Figure 4. Image of the cutting development chamber in calibration status, (a) full view of the end of calibration, (b) cutting root, (c) cutting.
Inventions 10 00108 g004
Figure 5. Internal image of the cutting development chamber with a specimen of Aloysia citrodora, (a) day 1, (b) day 14, (c) day 25.
Inventions 10 00108 g005
Figure 6. Case 1 (Aloysia citrodora). (A) represents the graph of temperature and (B) the humidity inside the chamber, where the failure of the DHT22 sensor can be observed in 3 cases delimited by a red line, the first lasting 21 h and 19 min, the second lasting 8 min, and finally the third lasting 1 min.
Inventions 10 00108 g006
Figure 7. Case 1 (Aloysia citrodora). (A) shows the external temperature and (B) the external humidity recorded by the DHT sensor. In this case, no sensor failures were observed throughout the monitoring period, indicating stable and reliable measurements.
Inventions 10 00108 g007
Figure 8. Development of Stevia Rebaudiana cuttings under red lighting (r = 255, g = 0, b = 0), (a) day 1, (b) day 5, (c) day 10.
Inventions 10 00108 g008
Figure 9. Case 2 with Stevia Rebaudiana under red lighting (r = 255, g = 0, b = 0). (A) represents the temperature and (B) the humidity graph inside the chamber, where it can be seen that in this case the DHT22 sensor failure was not recorded.
Inventions 10 00108 g009
Figure 10. Case 2 (Stevia Rebaudiana). (A) shows the temperature and (B) the humidity recorded by the corresponding DHT sensor during the experiment. The measurements remained stable throughout the monitoring period, indicating consistent sensor performance with no interruptions or anomalies detected.
Inventions 10 00108 g010
Figure 11. Development of Stevia Rebaudiana cuttings under green lighting (r = 0, g = 255, b = 0), (a) day 1, (b) day 15, (c) day 38.
Inventions 10 00108 g011
Figure 12. Case 3 with Stevia Rebaudiana under green lighting (r = 0, g = 255, b = 0). (A) represents the temperature and (B) humidity graphs inside the chamber, where the failure of the DHT22 sensor can be observed in one case (marked by the red line) that lasted 4 h.
Inventions 10 00108 g012
Figure 13. Case 3 with Stevia rebaudiana under green lighting (r = 0, g = 255, b = 0). (A) shows the external temperature and (B) the external humidity recorded during the experiment. In this case, no sensor failures were detected, and the measurements remained stable throughout the monitoring period.
Inventions 10 00108 g013
Figure 14. Development of Stevia Rebaudiana cuttings under blue lighting (r = 0, g = 0, b = 255), (a) day 1, (b) day 6, (c) day 12.
Inventions 10 00108 g014
Figure 15. Case 4. Stevia Rebaudiana under blue illumination (r = 0, g = 0, b = 255). (A) represents the temperature and (B) humidity graph inside the chamber, where the failure of the DHT22 sensor can be observed in one case (delimited by the red line) lasting 2 days and 18 h.
Inventions 10 00108 g015
Figure 16. Case 4 with Stevia rebaudiana under blue illumination (r = 0, g = 0, b = 255). (A) shows the external temperature and (B) the external humidity recorded during the experiment. In this case, the external DHT sensor operated continuously without interruptions, and no measurement failures were observed throughout the monitoring period.
Inventions 10 00108 g016
Table 1. Search for cutting propagation systems.
SystemMain FeaturesDimensions (cm)Estimated Cost USD
Electric propagator
(Alicante, Spain)
“heated base, will maintain the interior of the greenhouse at approximately 20 °C”38 × 24 × 1941.382
L Garden HighPro Propagator Cabinet
(Alicante, Spain)
reflective Nylon canvas40 × 40 × 200134.52
XL Garden HighPro Propagator Cabinet
(Alicante, Spain)
“ultra-opaque and watertight 420D Nylon canvas, with 97% reflective Mylar interior”120 × 40 × 200227.943
PERCIVAL E-36L2
(Fremont County, IA, USA)
“metal and glass, temperature management (10–44 °C), Humidity management (20–95%), interior lighting”85.1 × 85.4 × 196.126,897.50
Table 2. Kaggle data sets.
Dataset NameDescriptionKey ParametersFormatSize (Approx.)
“Autonomous Greenhouse Challenge (AGC)—2nd Edition.”Interior and exterior climate data, irrigation, actuators, consumption, harvest, cherry tomato parameters.Temperature, humidity, CO2, light, irrigation, harvest, fruit quality.CSVVariable (multiple files)
“IoT Agriculture 2024.”Interior and exterior sensor data.Temperature, humidity, light, VOC, eCO2.CSV1.5 MB
“Advanced IoT Agriculture.”California agricultural data with environmental, soil, and crop parameters.Nitrogen, Phosphorus, Potassium, temperature, humidity, pH, rain, crop type, soil moisture, etc.CSVNot specified
“Greenhouse Plant Growth.”Plant metrics related to vegetative and root growth.Plant growth metrics.CSV1.8 MB
Table 3. Synthetic data simulators.
Simulator NameDescriptionKey FeaturesData Output CapabilitiesLicense/Availability
TRNSYSTransient systems simulation program for energy analysis in buildings, including greenhouses.Component-based modeling, dynamic simulation of energy and thermal systems.Indoor air temperature, energy requirements, evapotranspiration, ventilation.Commercial
Modelica (Greenhouses Library)Modeling language for physical systems, with a specific library for greenhouses.Equation-based modeling, simulation of energy and mass flows.Temperature, humidity, CO2, energy flows; text formats, potentially CSV.Open Source (Modelica Standard Library)
Grinnell College Greenhouse SimulationOnline simulation for crop cultivation and data collection.Interactive simulation of crop growth, data collection on yields and profits.Tabular data on yields, profits, growth factors.Free (online)
Table 4. Technical specifications.
NumberComponent NameDescription
1DHT22 Sensor
(Guangdong, China)
Temperature range: −40 to 80 °C. Humidity range: 0 to 100% RH. Accuracy: Temperature: ±0.5 °C, Humidity: ±2–5% RH. Resolution: Temperature: 0.1 °C, Humidity: 0.1%. Power: 3.3 V to 6 V DC. Communication: Digital
Wastewater collection system3D printed wastewater collection chamber with ABS material
ABS exoskeleton3D printed exoskeleton with ABS material
Acrylic walls4 3 mm thick acrylic walls measuring 15 cm × 40 cm
3 3 mm thick acrylic walls measuring 13 cm × 40 cm
2 3 mm thick acrylic walls measuring 15 cm × 15 cm
2NeoPixel WS2812b
(Shenzhen, China)
Color Range: RGB. Pixel Count: 8. Power Supply: 5 V DC. Communication: Digital
3FanPower supply: 12 V 1.0 A (Generic).
4Irrigation system12 V 6.0 A pump (Generic). Flow rate: 6 L/min. Pressure: 0.9 MPA.
Hoses and sprinklers
Table 5. Statistical data of experiment 1.
Temperature Humidity
Average24.8 °CAverage89.8%
Median25 °CMedian97%
Fashion25 °CFashion98%
Standard deviation4.6 °CStandard deviation19.1%
Minimum0 °CMinimum0%
Maximum28 °CMaximum100%
Account24,691Account24,691
Table 6. Data set information (Aloysia citrodora with default lighting).
Data Set NameFormatNumber of FilesData Set SizeTags
ALCDJPG13881.11 GBDate, Time, Humidity and Temperature
ALCDCSV1837 KBDate, Time, Humidity and Temperature
Table 7. Statistical analysis of experiment 2.
Temperature Humidity
Average25.9 °CAverage96.8%
Median26 °CMedian97%
Fashion26 °CFashion97%
Standard deviation0.7 °CStandard deviation3.2%
Minimum24 °CMinimum54%
Maximum27 °CMaximum100%
Account8839Account8839
Table 8. Data set information (Stevia rebaudiana with red illumination).
Data Set NameFormatNumber of filesData Set SizeTags
STVRJPG885307 MBDate, Time, Humidity and Temperature
STVRCSV1557 KBDate, Time, Humidity and Temperature
Table 9. Statistical analysis of experiment 3.
Temperature Humidity
Average25.4 °CAverage90.8%
Median25 °CMedian91%
Fashion25 °CFashion93%
Standard deviation1.2 °CStandard deviation5.1%
Minimum0 °CMinimum0%
Maximum27 °CMaximum97%
Account28,199Account28,199
Table 10. Data set information (Stevia rebaudiana with green illumination).
Data Set NameFormatNumber of FilesData Set SizeTags
STVGJPG21531.23 GBDate, Time, Humidity and Temperature
STVGCSV11.35 MBDate, Time, Humidity and Temperature
Table 11. Statistical analysis of experiment 4.
Temperature Humidity
Average26.3 °CAverage88.3%
Median26 °CMedian89%
Fashion26 °CFashion87%
Standard deviation0.5 °CStandard deviation3.8%
Minimum24 °CMinimum52%
Maximum27 °CMaximum92%
Account3035Account3035
Table 12. Data set information (Stevia rebaudiana with blue illumination).
Data Set NameFormatNumber of FilesData Set SizeTags
STVBJPG21531.23 GBDate, Time, Humidity and Temperature
STVBCSV11.35 MBDate, Time, Humidity and Temperature
Disclaimer/Publisher’s Note: The statements, opinions and data contained in all publications are solely those of the individual author(s) and contributor(s) and not of MDPI and/or the editor(s). MDPI and/or the editor(s) disclaim responsibility for any injury to people or property resulting from any ideas, methods, instructions or products referred to in the content.