Article

Quantifying Innovation: Intellectual Property Data as Indicators of Technology Maturity of Metal–Organic-Frameworks and Inorganic Nanoparticles

by
Umberto Maria Matera
1,2,
Matteo Faccenda
3,
Yolanda Pérez
4,5,
Darina Francesca Picchi
1,5,
Lorenzo Rossi
3,
Sergio Larreina
2 and
Patricia Horcajada
5,*
1
Escuela Internacional de Doctorado, Universidad Rey Juan Carlos, C/ Tulipán s/n, 28933 Madrid, Spain
2
Isern Patentes y Marcas, C/ Príncipe de Vergara, 43, 28001 Madrid, Spain
3
Istituto Italiano di Tecnologia, IIT, Via Morego, 30, 16163 Genova, Italy
4
Departamento de Biología y Geología, Física y Química Inorgánica, Escuela Superior de Ciencias Experimentales y Tecnología (ESCET), Universidad Rey Juan Carlos, Tulipán s/n, 28933 Madrid, Spain
5
Advanced Porous Materials Unit, IMDEA Energy Institute, Av. Ramón de la Sagra 3, 28935 Madrid, Spain
*
Author to whom correspondence should be addressed.
Inventions 2025, 10(6), 107; https://doi.org/10.3390/inventions10060107
Submission received: 2 September 2025 / Revised: 20 October 2025 / Accepted: 30 October 2025 / Published: 19 November 2025
(This article belongs to the Section Inventions and Innovation in Biotechnology and Materials)

Abstract

The increasing significance of intellectual property (IP) in recent decades highlights its crucial role in driving innovation and shaping competitive strategies. While many studies have attempted to evaluate the technological level of specific sectors or companies, few offer a standardized and scalable approach for cross-domain comparison. This study proposes a patent-based framework to comparatively evaluate technological maturity across different fields using a concise set of intellectual property (IP) indicators. The selected metrics, renewal trends, family size, grant rate, and citation patterns, capture legal, economic, and technological dimensions of innovation without requiring field-specific calibration. We apply this approach to two representative nanomedical technologies, Metal–Organic Frameworks (MOFs) and inorganic nanoparticles (iNPs), within the domain of cancer therapy. Our analysis highlights distinct trajectories: MOFs show increasing patent activity and sustained short-term citation growth, consistent with an emerging field; iNPs exhibit signs of stabilization and declining citation intensity, suggesting greater maturity. These findings demonstrate the utility of standardized IP indicators for mapping innovation dynamics across domains. The proposed framework offers a replicable tool for strategic technology assessment, with potential applications in research prioritization, technology forecasting, and early-stage investment analysis.

1. Introduction

In a world increasingly driven by technological innovation, the ability to strategically manage and assess intellectual property (IP) has become essential for guiding investment, policy, and innovation strategies. Companies and investors face mounting pressure to identify promising technologies early, optimize R&D allocation, and maintain a competitive edge. However, existing evaluation tools, such as expert reviews, technology readiness levels (TRLs), or bibliometrics, are often limited by subjectivity, sector-dependence, or lack of early-stage coverage [1,2,3]. Despite the proliferation of sector-specific metrics and innovation dashboards, there is still no accessible, standardized methodology for comparing the technological maturity of emerging fields in a consistent and cross-domain fashion. Many existing models are data-intensive, rely on static indicators, or require detailed knowledge of the application context, making them less viable in fast-evolving or resource-constrained settings. In this complex context, intellectual property (IP) valuation has emerged as a strategic tool for assessing technological innovation, guiding investment and policy decisions, and informing competitive positioning and technology forecasting. Patent indicators, in particular, offer actionable insights into innovation dynamics, R&D strategy, and market potential, making them increasingly valuable across corporate, academic, and policy domains [4,5,6,7,8,9,10,11,12,13,14,15]. Firm-level evidence shows that the economic value of a firm’s early patents predicts multiple dimensions of its subsequent research success; moreover, a subset of ‘hidden gem’ firms can be detected through the technological value of their early patents, underscoring the strategic utility of early IP signals for scouting and policy [16]. However, existing approaches often remain fragmented, targeting individual sectors, companies, or isolated indicators, without providing a unified, comparative framework for assessing the maturity of different technologies. Moreover, most studies adopt a static perspective, lacking the temporal and geographical resolution needed to interpret the dynamic evolution of emerging technologies. As a result, there is still a lack of accessible, cross-sectoral methodologies capable of comparing technological trajectories with standardized, interpretable, and low-input indicators. In response, this paper introduces a minimal, scalable, and domain-independent framework to assess the maturity of emerging technologies based solely on patent-derived indicators. This methodology is tested through a comparative case study in cancer nanomedicine. Unlike existing approaches that focus on specific domains, require heavy data preprocessing, or rely on static metrics, our contribution introduces a streamlined IP-based framework that operates entirely on publicly available data, enabling consistent comparison across fields. While we acknowledge that patent value does not have a precise or universal definition, and is highly context-dependent, we argue that a carefully selected set of IP indicators can provide meaningful insights into the relative maturity and strategic positioning of a technology. Our approach does not aim to quantify absolute value, but to offer a comparative lens for analyzing how technologies evolve over time and space. As a first step in our comparative analysis, we construct a technological landscape that captures the legal, economic, and strategic dimensions of the two fields. This landscape does not aim to assign value per se, but to contextualize the technologies through fundamental patent-derived signals. Among these, the renewal history of patents serves as a proxy for the sustained economic interest in the protected inventions: longer maintenance periods typically indicate higher perceived utility and long-term commitment from the assignee. We also consider the size of patent families, which reflects the geographical scope of protection. A broader territorial coverage often points to greater market ambition and higher investment in IP strategy. Lastly, the grant rate, calculated as the ratio of granted to filed patents, offers insight into the inventive step and legal robustness of the technological outputs, as acknowledged by patent offices. Beyond this descriptive layer, our methodological contribution centers on two synthetic indicators that enable a systematic comparison between technologies based on their maturity, persistence, and influence within the innovation ecosystem. While the landscape offers essential descriptive grounding, the core of our analytical framework is built on two synthetic indicators that capture the temporal, spatial, and relational dynamics of innovation. The first is the Scope–Year (SY) index, a composite metric that combines the duration of patent protection with the geographical breadth of coverage [17]. It reflects not only how long a piece of technology remains protected, but also how widely it is deployed across international markets. To account for market relevance, the geographical component can be optionally weighted by GDP, linking technological persistence to potential economic impact. This index enables a systematic comparison of how technologies evolve and persist in global innovation environments. The second indicator draws on patent citation analysis, widely recognized as a proxy for technological influence. We consider both applicant-driven citations, analogous to references in scientific literature, and examiner-added citations, which emerge from prior art searches. Forward citations indicate how much a technology informs subsequent developments, while backward citations reveal its foundational knowledge base. Further, large-scale evidence using machine learning shows that family size and early-citation signals (e.g., first-citation speed) rank among the most informative predictors of patent value [18]. Taken together, these two indicators provide a robust and interpretable lens through which to compare the maturity and positioning of emerging technologies, revealing dynamic trends that can support strategic decisions in innovation policy and investment. To validate this approach, we selected two representative nanomedical technologies in the field of cancer therapy: Metal–Organic Frameworks (MOFs) and inorganic nanoparticles (iNPs), including plasmonic and magnetic variants. MOFs are highly tunable drug delivery systems with favorable biocompatibility and controlled release properties, while iNPs provide externally triggered drug release and multifunctional features such as imaging and phototherapy [19,20,21,22,23]. By applying our methodology to MOFs and iNPs within a consistent application domain, cancer nanomedicine, we minimize domain-specific biases and isolate key innovation dynamics. This study thus offers a replicable and lightweight strategy for assessing technological trajectories using only IP data, with potential applications in research prioritization, strategic investment, and innovation policy. Through this comparative framework, we aim to assess whether a selected set of IP indicators can effectively distinguish between technologies at different stages of maturity.

2. Materials and Methods

Patent families were retrieved from Orbit Intelligence (queries and filters in Appendix A) by searching title, abstract and claims with a biomedical filter and an application-date cutoff. Inventions were analyzed at the earliest-priority family level (to avoid multiple counting across jurisdictions) and time series were aggregated by priority year.
In order to evaluate priority filings, applications, and grants, we proceeded as follows: for each patent family we kept the Earliest Priority Date (EPD) as a proxy for one invention across jurisdictions; for each family member we used its Application Date and, when available, its Grant Date (per jurisdiction). We then built three yearly time series by simple aggregation.
To summarize the temporal (lifespan) and geographical (territorial coverage) extent of protection at the family level, we use an explicit formulation of the SY index that distinguishes between (i) the unweighted version and (ii) an optional GDP-weighted version for market-relevance adjustment.
S Y t = f F t c C f l L c g c t + l
where F(t) is the number of total families borne in the year t, C f represents the countries where the family f extends the patent application, L c is the life expressed in years of the patent applied in the country c, l is a natural number from 0 to L c , g c ( t + l ) is a coefficient that is 1 for the unweighted SY index, while for the weighed one it is:
g c t =   G D P c ( t ) G D P U S A ( t )
where G D P c t and G D P U S A ( t ) are, respectively, the Gross Domestic Product of the country c and USA evaluated in the year t. This formulation allows the SY to account not only for how long and where a technology is protected, but also for how strategically valuable those jurisdictions are from an economic standpoint.
In this study, we use the unweighted specification throughout to maximize interpretability and cross-field comparability.

3. Results

3.1. Technological Landscape

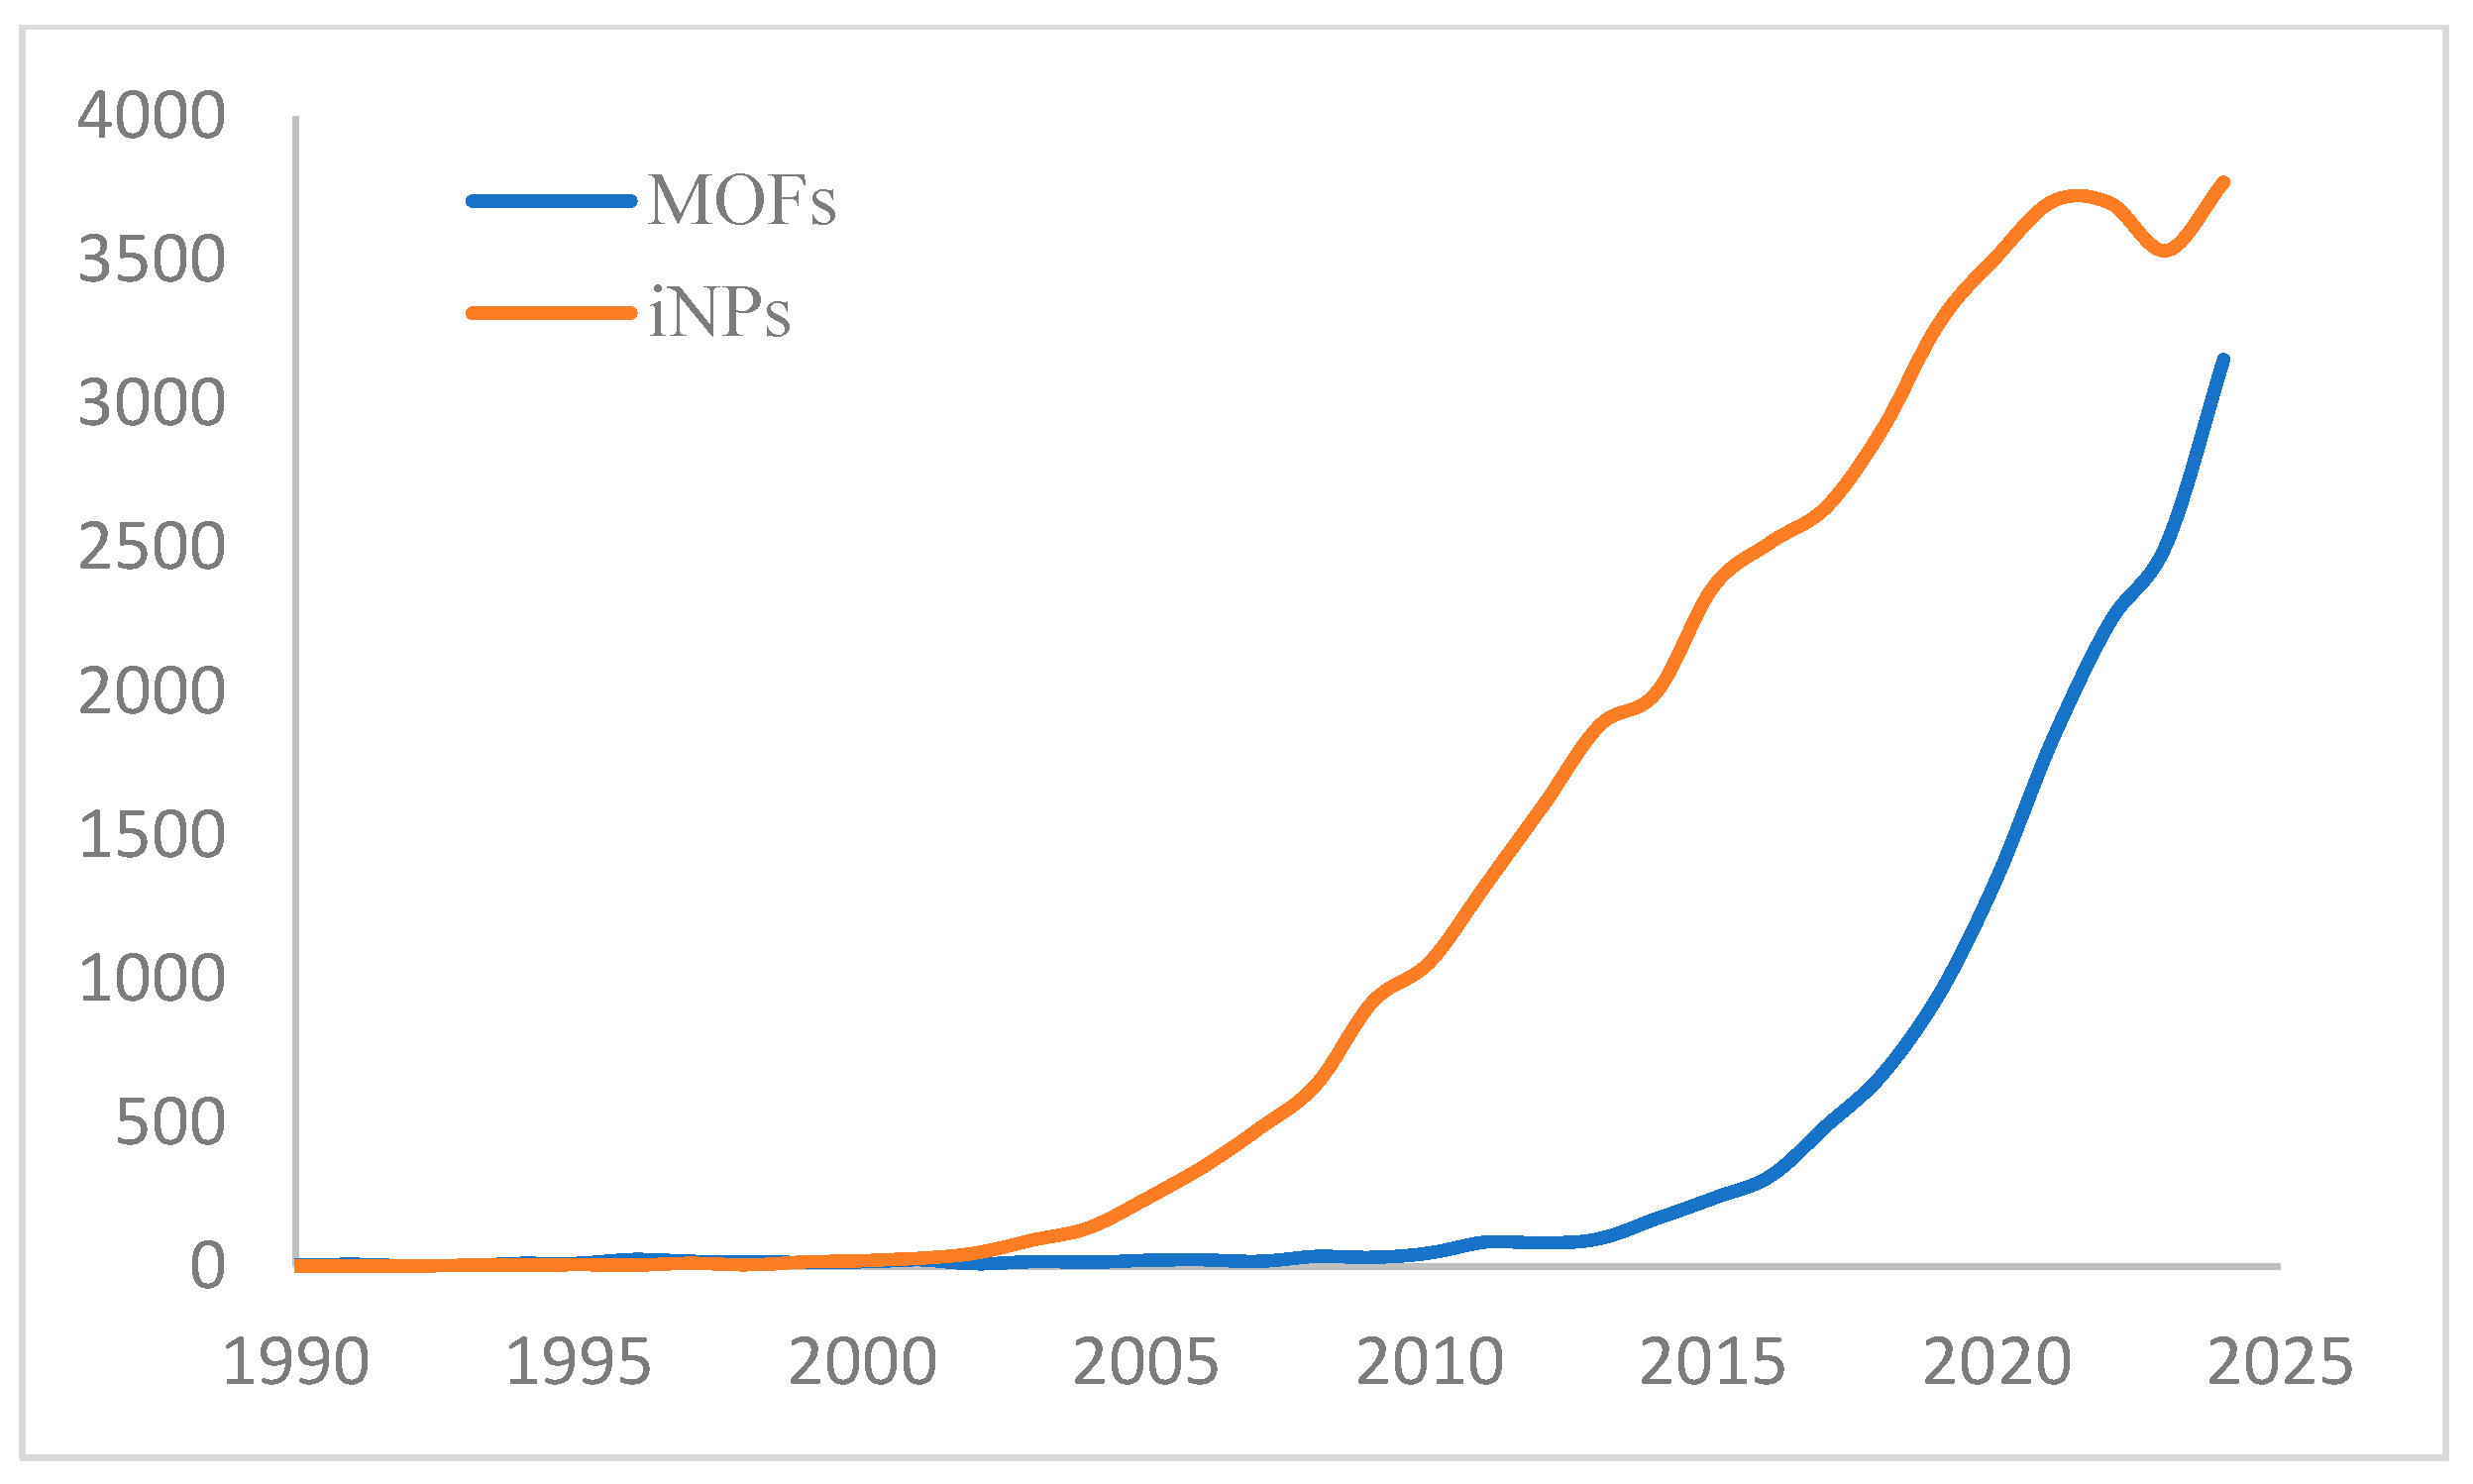
We begin by assessing the inventive activity in the MOFs and iNPs technology domains (see Table A1 in the Appendix A for the query used). To ensure a consistent representation of inventive activity, we use the earliest priority application of each patent family as a proxy for a single invention, allowing clearer temporal tracking across technologies despite variability in how ‘invention’ is defined. To compare the innovation capacity of these fields, we analyze the yearly frequency of earliest priority filings as a proxy for inventive output. Figure 1 provides an insightful overview of the patent production from 1990 to 2020, including the number of applications, granted patents, and priority filings. We observe a total amount of 2035 and 3862 patent families for, respectively, MOFs and iNPs with markedly different growth patterns. The two technologies follow distinct innovation trajectories: iNPs exhibit steady growth throughout the early 2000s, followed by a noticeable slowdown around 2013. In contrast, MOFs show slower initial activity, with a sharp acceleration in patent filings beginning in 2015. These trends may reflect the relative maturity of scientific research in each domain (Figure 2). In fact, the fields of MOFs and iNPs have seen a notable increase in scientific publications, with a peak in 2020, contributing approximately 28% and 12% of the total, respectively. This growth trend closely mirrors the patent activity depicted in Figure 1, highlighting the strong link between R&D investments and IP production.
Patent volume alone does not convey information on the quality or strength of the protected inventions. To complement this picture, we analyze the grant rate of patent families. The volume of granted patents within a family serves as a metric conveying insight into application quality, the robustness of innovative ideas, and the technological relevance in the market. Granted applications represent inventions that are acknowledged as novel and inventive in comparison to the existing state of the art, with the accumulation of grants within a family reflecting acknowledgment by different patent offices globally. Moreover, granted patents confer exclusive rights to assignees, wielding the potential to exert a tangible influence on the market, even though the pending applications may also bear influence.
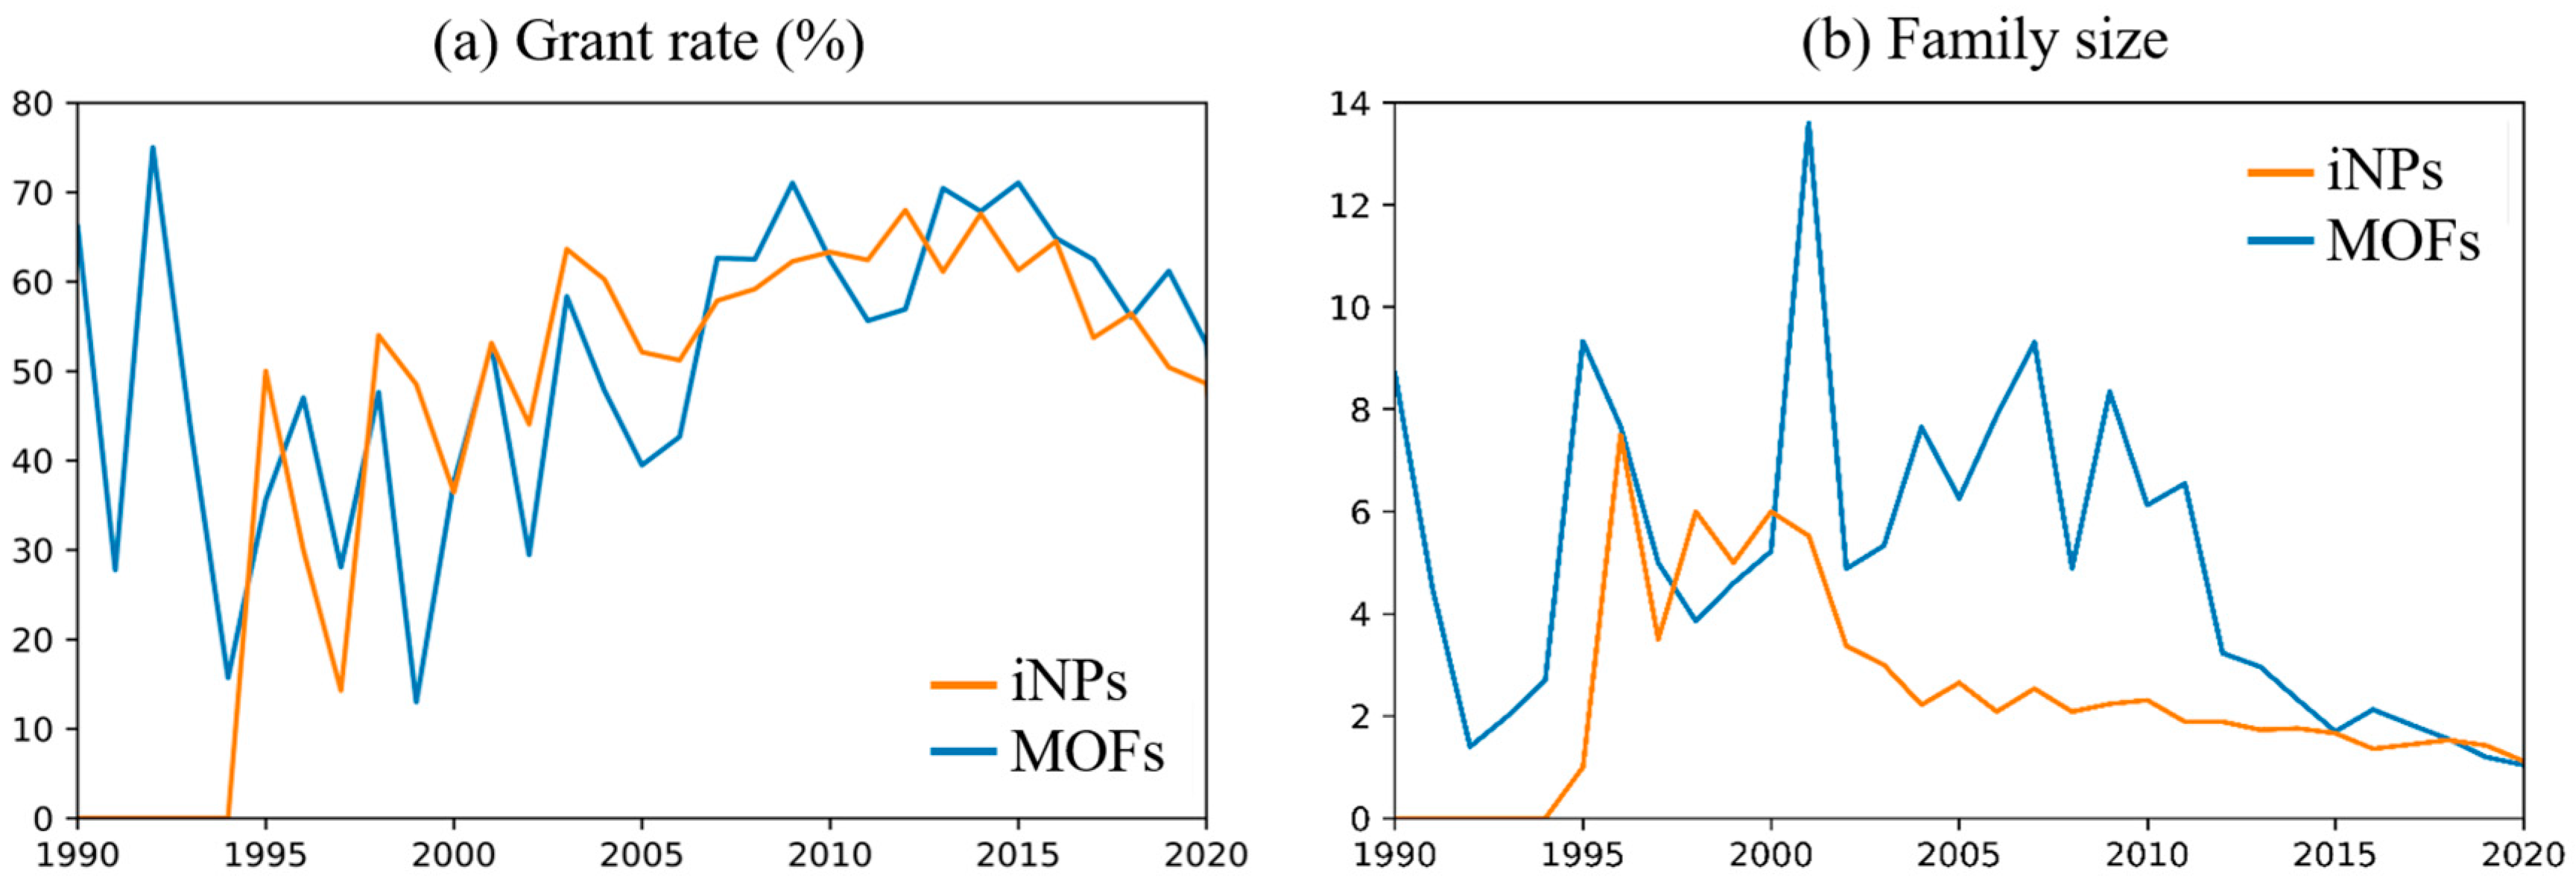
Looking deeper into the granted applications, the grant rate for the patent families in each technology field Figure 3 shows an initial period marked by considerable noise, which is primarily due to the limited data availability in the early years. After this period, the grant rates for both technologies exhibit fluctuations within a range roughly spanning from 60 to 70%. Notably, in recent years, it seems to be a decreasing tendency in the proportion of granted patents, down to 50% in both cases. This reduction is likely attributed to ongoing examination processes. It is important to bear in mind that this process typically extends over a period of a few years. Patent family size (Figure 3b) further complements this analysis, providing insight into global protection strategies and potential market reach [17,25]. For instance, a larger family size often indicates: (i) a broader geographical protection, as each member of the family may correspond to a patent application filed in a different country; (ii) higher fees to sustain for the assignee, and thus, a higher bottom line for the economic value of the technology; and (iii) strong innovation impact and relevance across multiple jurisdictions, showing the adaptability and applicability in diverse regulatory environments of the protected invention. In contrast, the average family size for both MOFs and iNPs has significantly declined. Even accounting for early-period fluctuations due to low filing volumes, family size starts stabilizing after 2000 or 2010, and getting closer to 1 (the minimum size) until 2010 or 2020 for iNPs or MOFs, respectively. Note here the different timeline between the technologies, particularly post-2000. In the initial decades of the 21st century, the general family size of iNPs is roughly half compared to MOFs. However, as they approach the year 2020, the two technologies converge toward a similar family size. Part of this recent decline may be explained by the fact that some families have not yet entered the national phase of the international filing process (under the Patent Cooperation Treaty (PCT), applicants can delay national phase entry for up to 30–31 months from the earliest priority date). Nonetheless, the decrease in size is also evident in the past (after 2010 for MOFs, and after 2000 for iNPs), for which the period of extension is already expired. This suggests that the observed decline may partly reflect a more targeted protection strategy or a lower commercial valuation of recent inventions.

3.2. Patents Lifespan and Scope Year Index

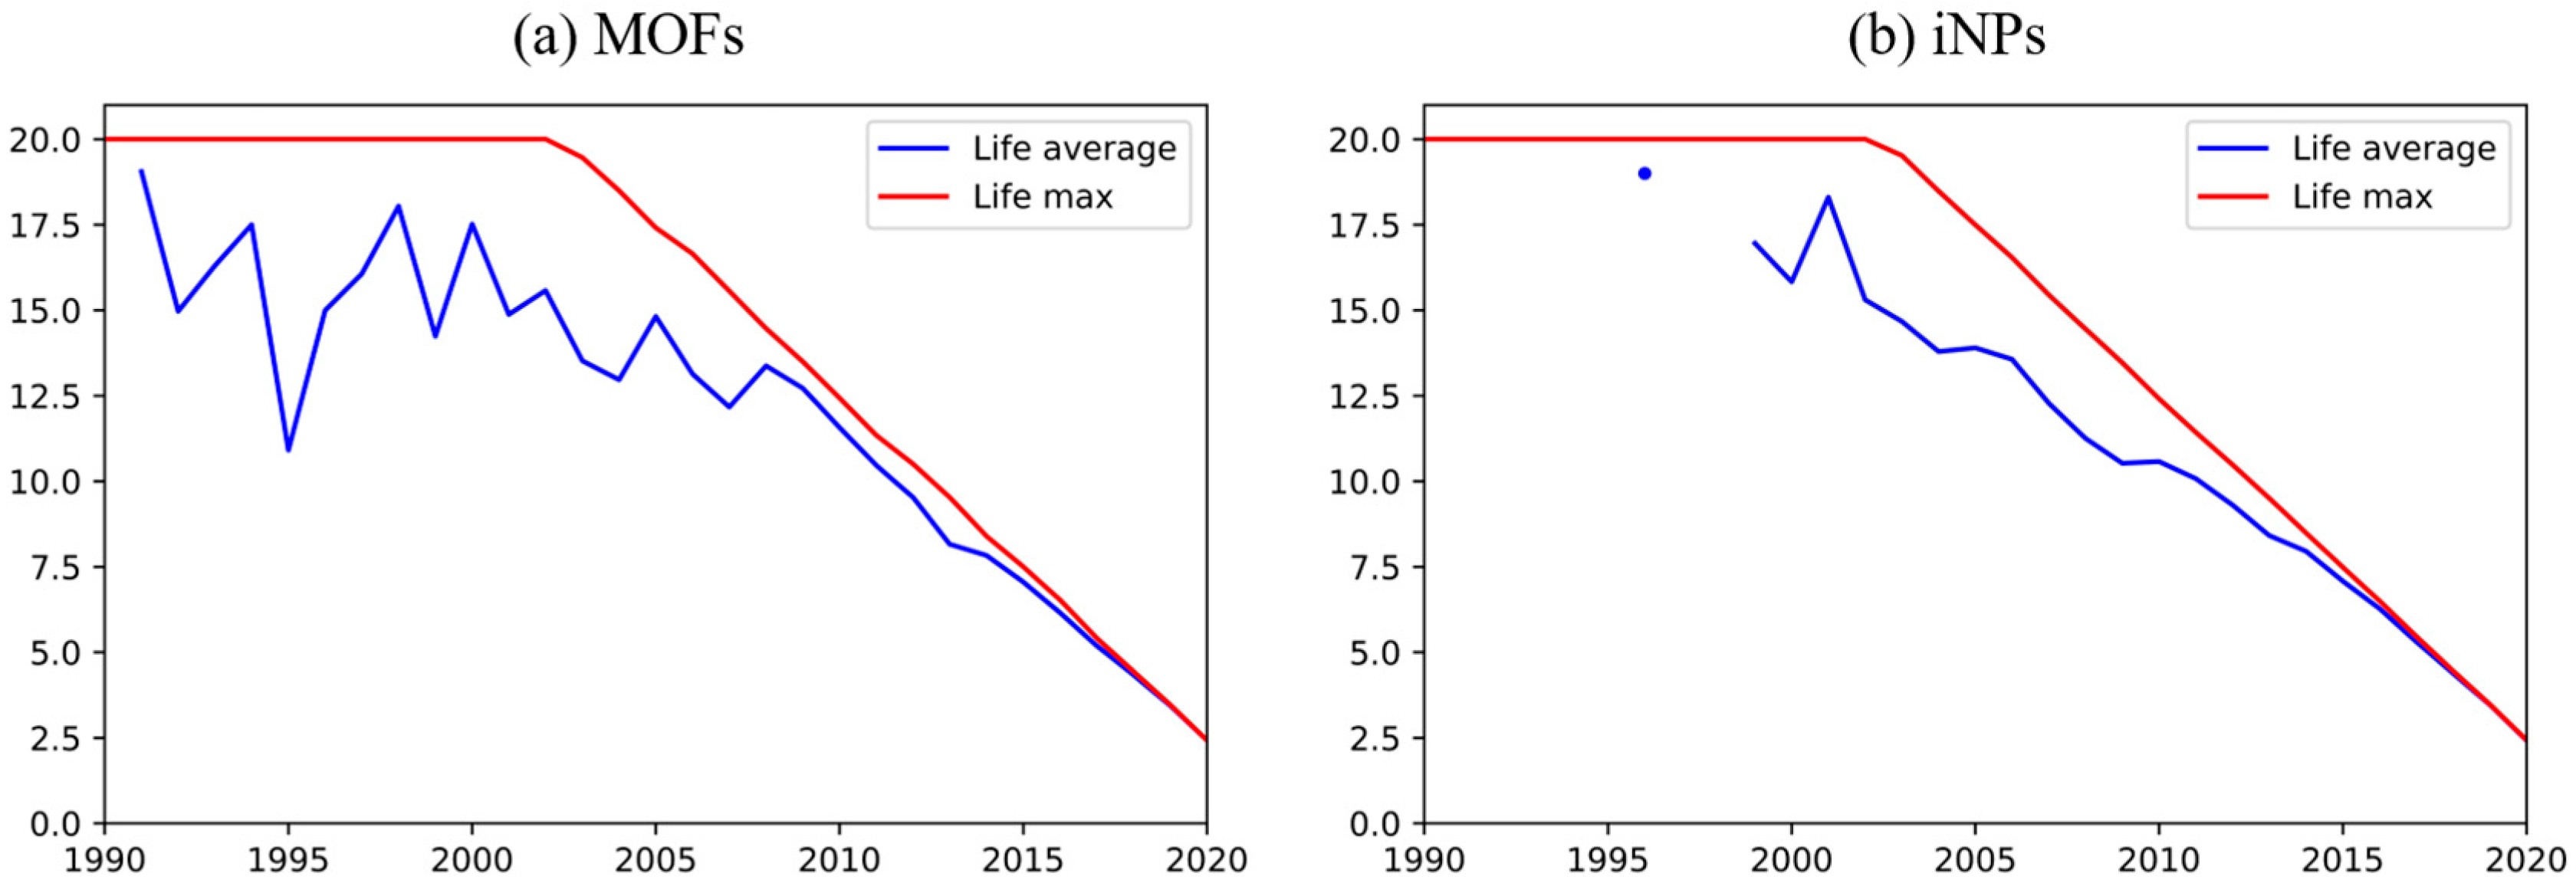
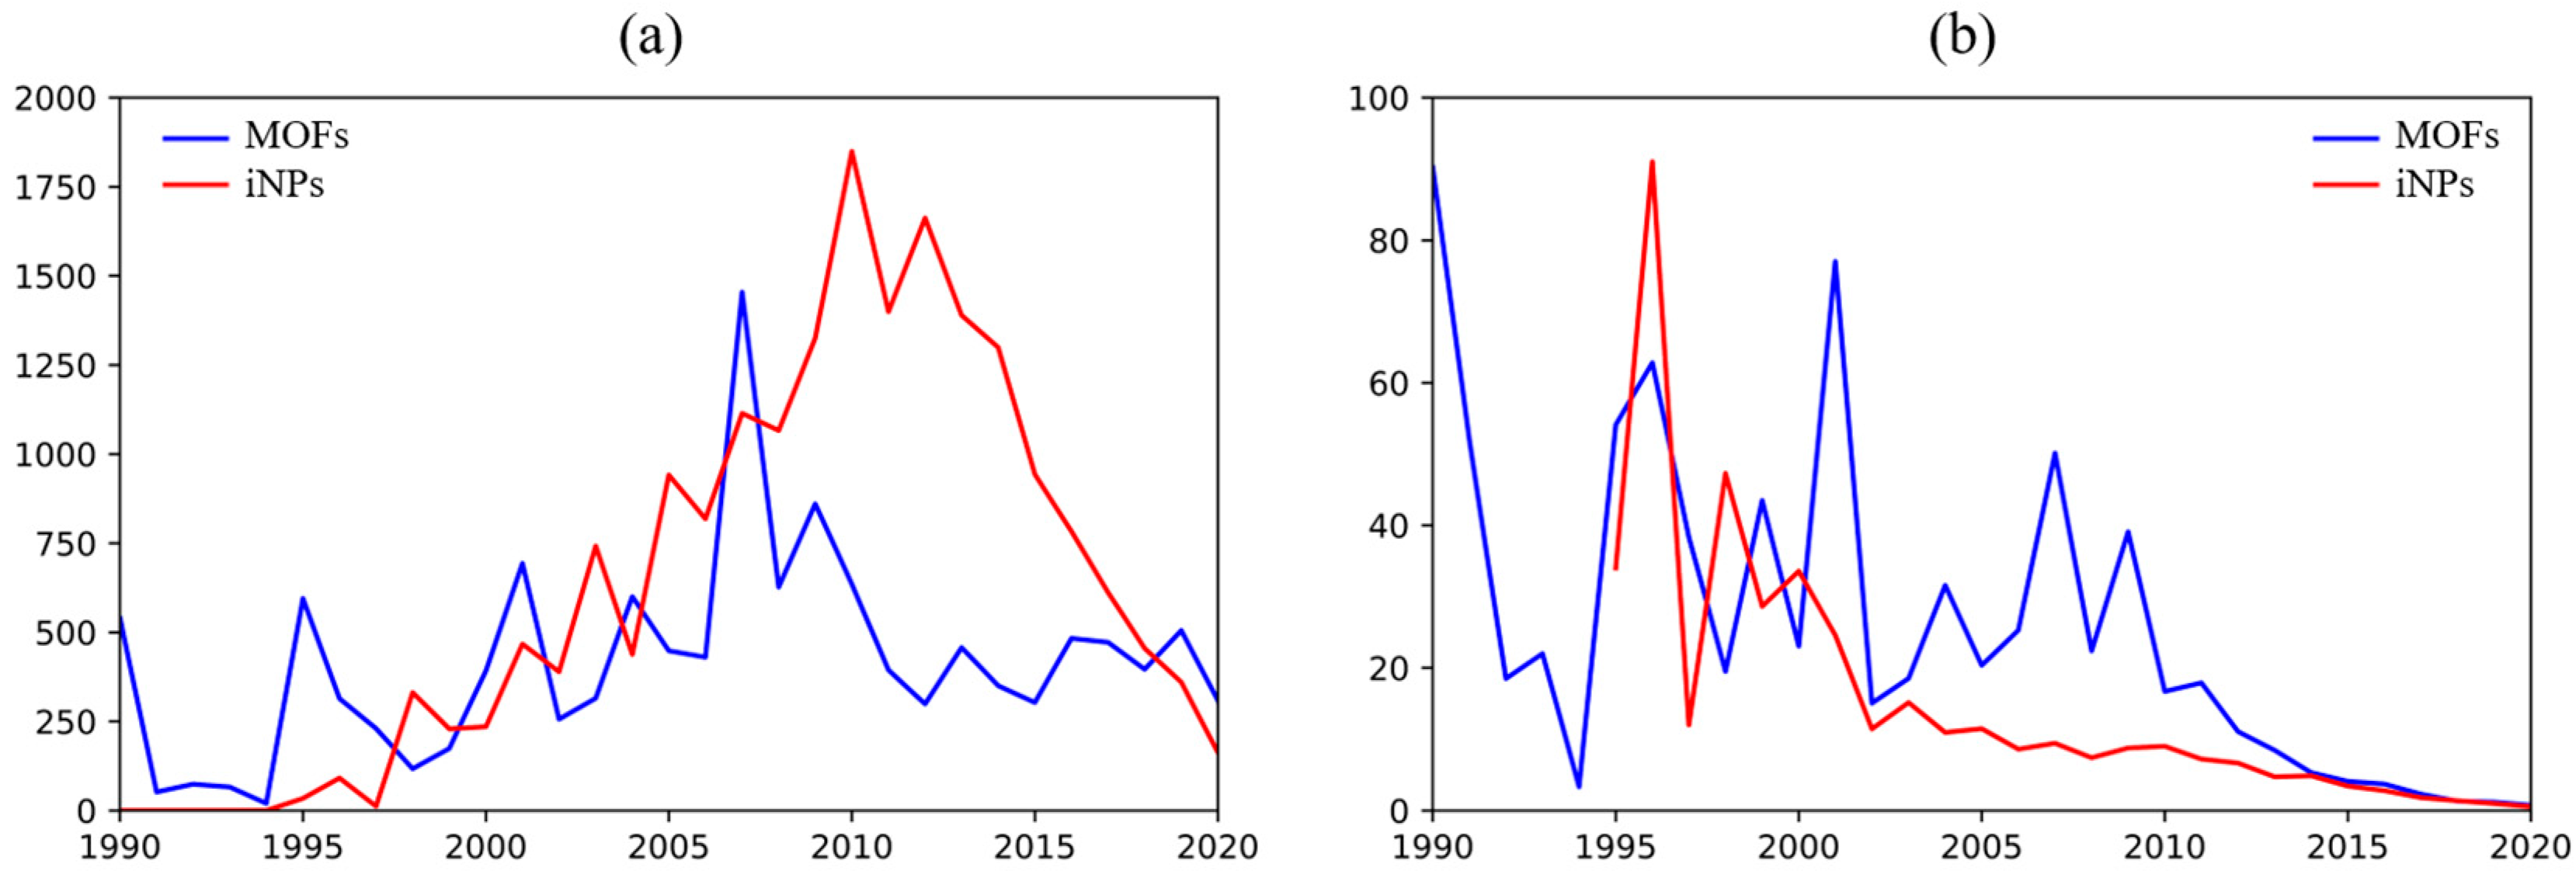
An additional insight comes from analyzing the evolution of the average patent lifespan Figure 4, which reflects the duration of legal protection over time. The observed trends exhibit striking similarity in both scenarios, with the average patent lifespan steadily declining to 2.5 years by the year 2020. As we approach the data collection year (2023), many patents have not had time to reach full term, making lifespan estimates unreliable after 2003. As in previous analyses, the early years are affected by significant statistical noise due to the limited number of patent filings. Nevertheless, we can still consistently discuss the last decade if we consider the deviation from the line that represents the possible maximum lifespan in time (represented as a red line). After the initial fluctuations, the gap between the average and maximum lifespan narrows. This suggests that newer patents are maintained longer, likely reflecting greater confidence in their market potential. This behavior is expected, as assignees often monitor a patent’s commercial viability during its early years. A larger gap may indicate lower perceived value or strategic relevance by the assignee. In fact, in cases where the market is not receptive, it is already saturated, or the invention fails to capture a substantial market share, the assignee may opt to let the patent go abandoned and allow for its withdrawal. This pattern may reflect rapid market testing or fast technological turnover in competitive fields such as iNPs and MOFs. This trend may indicate the need for companies to quickly ascertain the commercial viability of their innovations in competitive and rapidly evolving markets. As patents approach closer to their maximum potential lifespan, it reflects increased confidence in the market potential and value of these technologies. However, the short lifespan also highlights the challenges faced by innovators in sustaining long-term intellectual property protection amidst shifting market dynamics and technological advancements. A central element of this study is the Scope–Year (SY) index, which integrates the temporal duration and geographical extension of patent families into a single synthetic metric. It provides a dynamic measure of how technologies evolve over time and across jurisdictions. The SY index is calculated by summing the lifespan of all patent members within a family, from their grant to expiration or withdrawal. This value is then aggregated per priority year to show yearly trends. We also compute an average SY per family to assess the typical extent of protection. Finally, we introduce a GDP-weighted version of the index, accounting for the economic relevance of each jurisdiction. The detailed formulation of the SY index is provided in the Materials and Methods section. The temporal evolution of the SY index is shown in Figure 5a. In the early years, MOF patents display significant fluctuations, likely due to ow filing volumes and data sparsity. A clear peak appears in 2007, followed by a gradual decline and stabilization in the most recent period. In contrast, iNPs show a more consistent growth pattern in the early phase, supported by a broader patent base, before entering a sharp downward trend after 2010. For iNPs, the SY index begins to decline after 2010, eventually reaching near-minimal values by 2020. This drop, especially in recent years, is partly explained by the limited observation window: patents filed close to the data collection year (2023) have not yet had sufficient time to accumulate full lifespan and coverage.
We also examine the average SY index per patent family over the last 30 years (Figure 5). As expected, the early period is marked by strong fluctuations in both technologies. However, from 2000 to 2010, the trajectories diverge: iNPs show a steady decline in average SY, while MOFs maintain relatively high and stable values throughout the decade. This suggests a stronger international and temporal footprint for MOFs during that period. Moreover, this observation is reinforced by the subsequent surge in MOF patent filings after 2015, contrasting with the plateau observed for iNPs. It is important to note that the most reliable SY data corresponds to patents filed at least 15–20 years before the data collection year (2023), due to delays introduced by procedures like the PCT and the natural accumulation of patent lifespan. As we approach more recent years, the index is naturally biased downward by design. Despite this limitation, combining SY trends with additional signals, such as average patent lifespan (Figure 4), can still yield useful comparative insights.

3.3. Citations

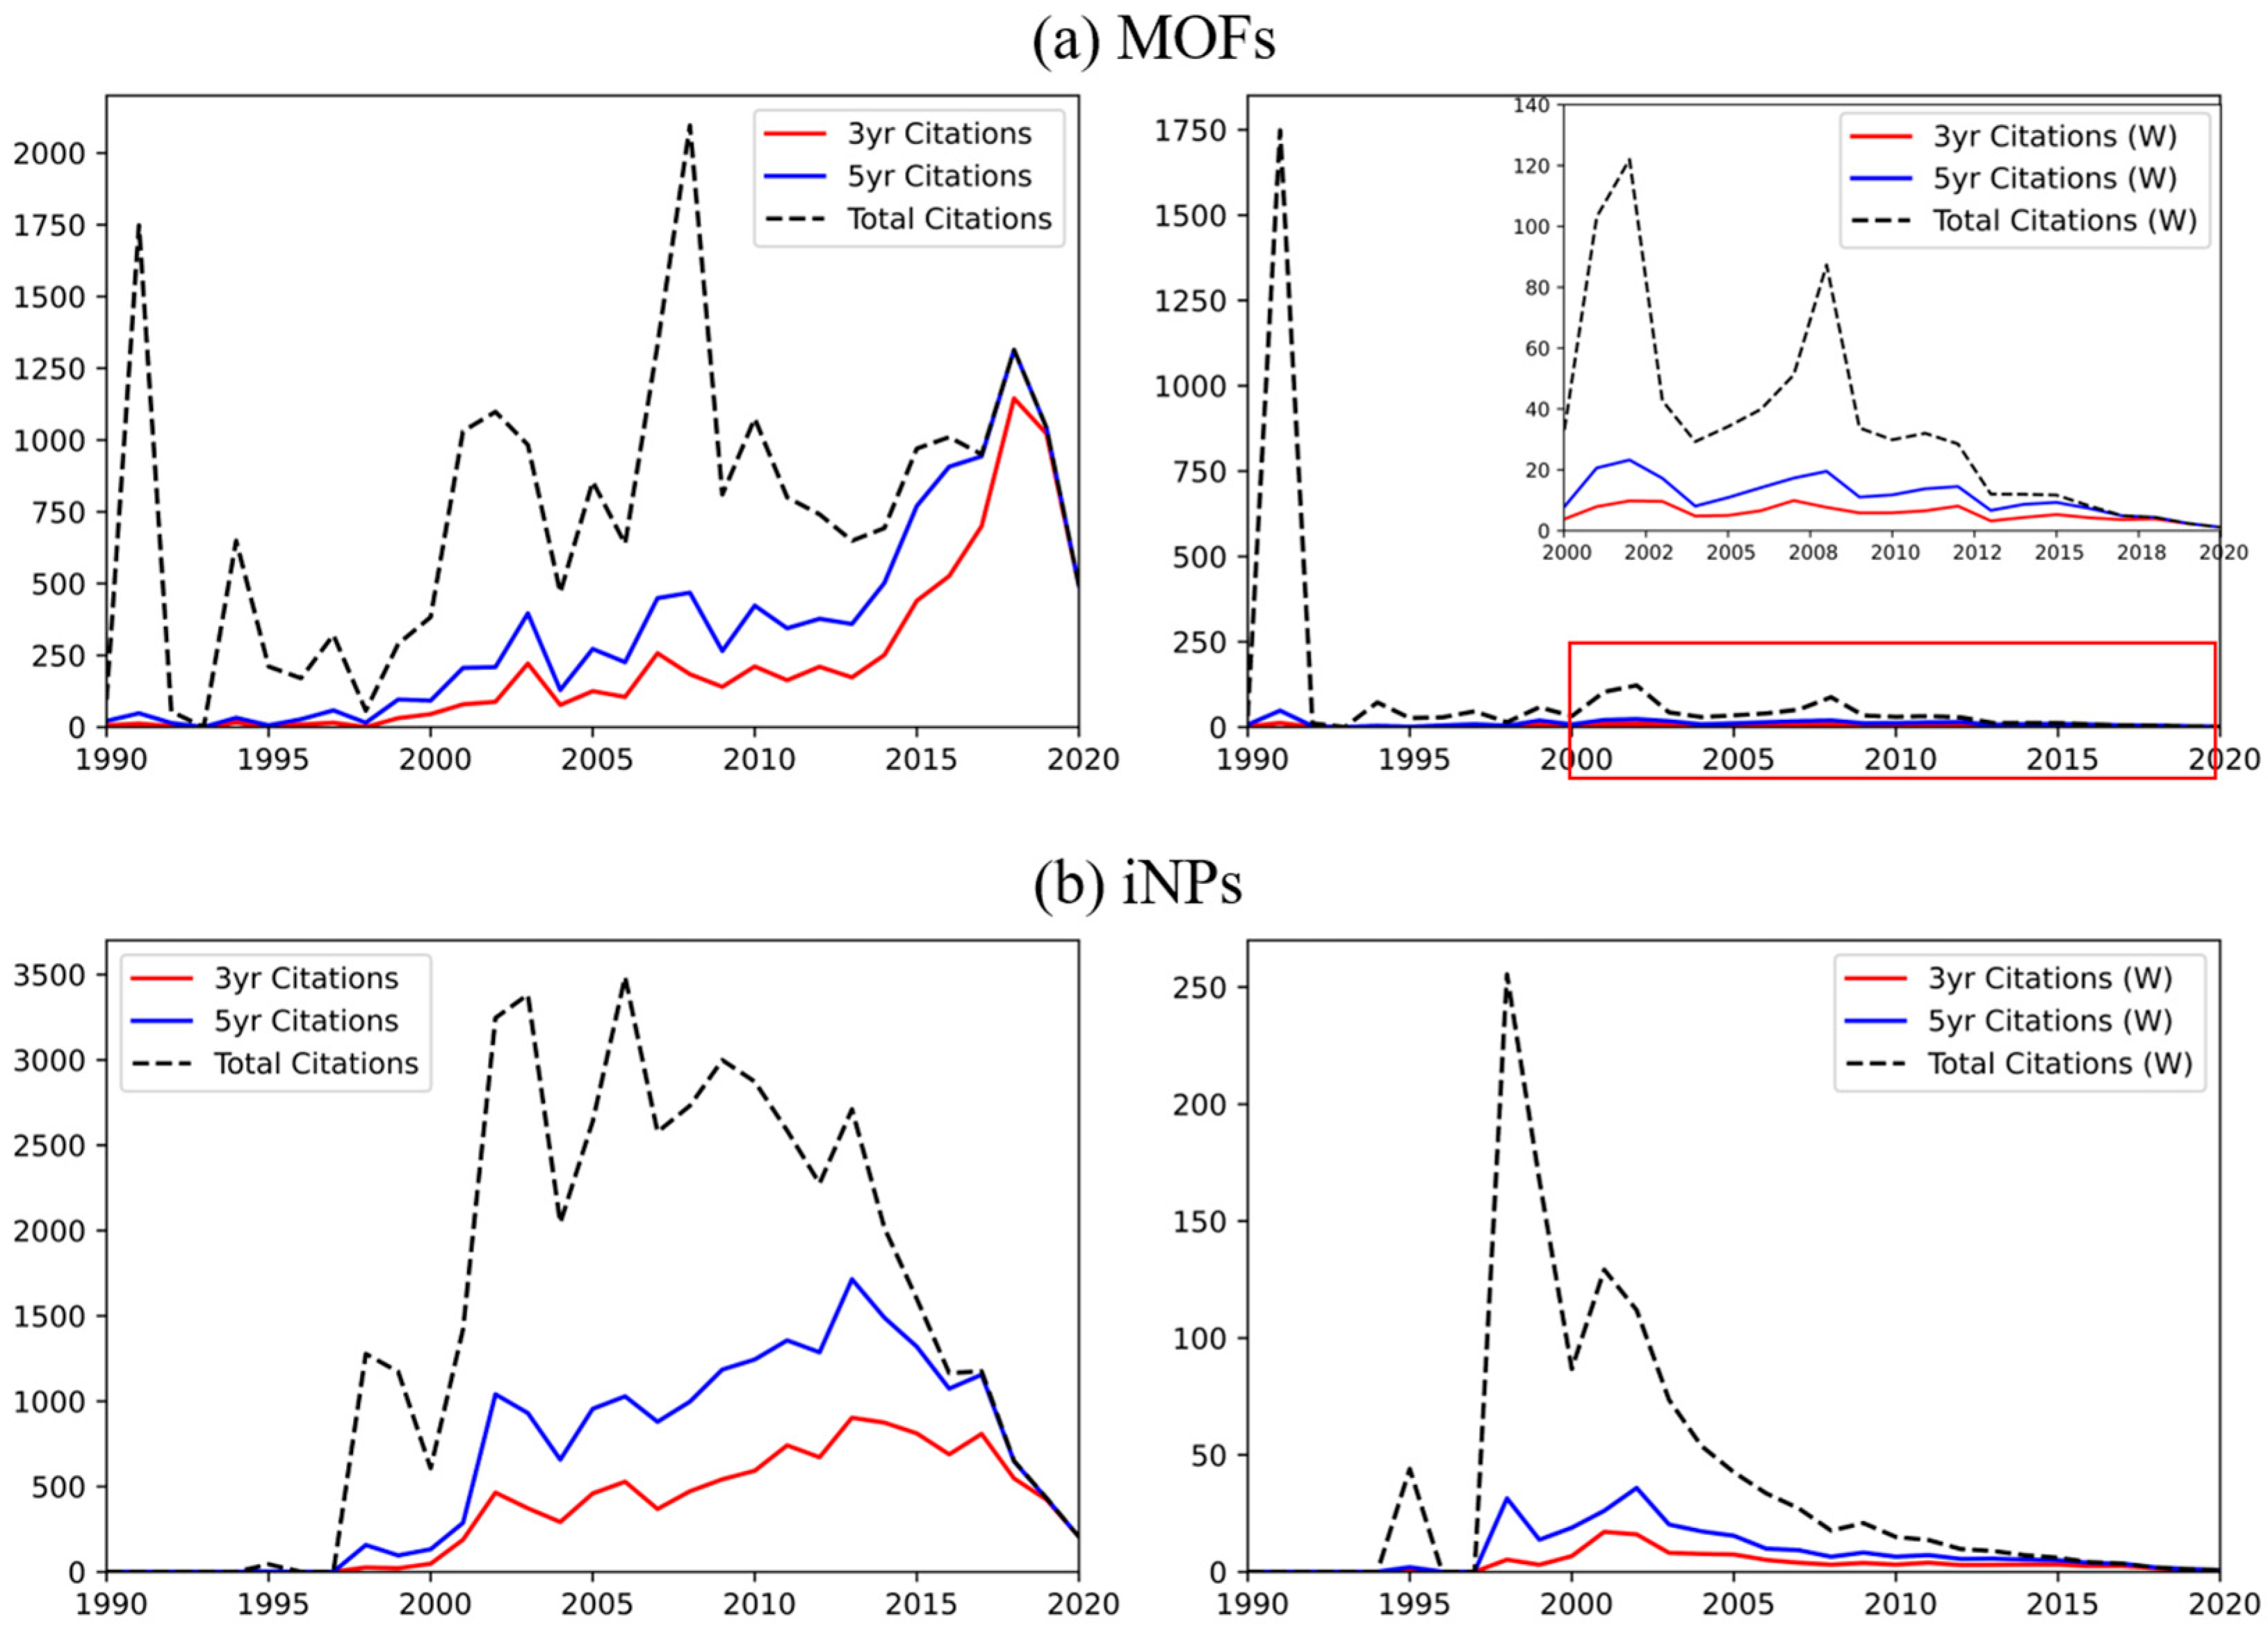
Citations capture how inventions build upon each other and signal a technology’s influence on subsequent developments. Analyzing citation trends thus provides insight into a technology’s immediate impact, long-term relevance, and position within the broader innovation landscape. Thus, Figure 6 illustrates the citation patterns for the patent families in both fields, with a focus on 3- or 5-year citations (that is the citations received by the family 3 or 5 years after the first priority, respectively) and total citations. Consistent with our choice of fixed 3–5-year windows, dynamic models of patent citation networks indicate that trajectories are shaped by temporal phenomena, supporting the use of early-impact windows as a robust proxy [26]. While total citations are still evolving, short-term citations (fixed at 3- or 5-years post-priority) offer a stable measure of early technological impact, at least up to 2017–2019. This immutability in short-term citation trends provides a relatively robust indicator of the immediate impact and recognition of patent families within those timeframes. In the case of MOFs, we observe a notable outlier in 1991: a single patent family that has accumulated over 1700 citations, suggesting substantial but delayed recognition of its technological relevance. Excluding this outlier, the trend in short-term citations (3- and 5-year windows) shows a gradual increase over time, while total citations tend to decline as we approach 2020, due to the limited time for citation accumulation. The narrowing gap between short-term and total citations is consistent with this observation. Several factors might explain the rise in early citations: (i) improved patent quality, meaning newer patents are more influential and thus cited more often; (ii) citation inflation, whereby newer patents include more references due to changing examination practices or strategic behavior by applicants; (iii) growth in patent volume, where the general increase in filings leads to more opportunities for cross-citation across technologies. To account for yearly variations in patent volume, citations were normalized by the number of families filed each year. When examining average citations per family, the outlier from 1991 stands out with over 1700 citations attributed to a single MOF-related family; an anomaly that suggests delayed but substantial recognition. Excluding this case, the average citations per family over the last 20 years show a downward trend, stabilizing around 4–5 citations per family, with occasional spikes. Notably, 3- and 5-year citation windows show a milder decrease and a more stable trajectory, suggesting a sustained short-term impact despite overall citation fatigue. Several factors could contribute to this pattern: diminished interest in the field, a reduced number of citing patents, or a tendency for newer patents to cite prior art less frequently.
Regarding iNPs, citation activity is more concentrated in an earlier time window and begins a marked decline around 2013, across all three citation categories (total, 3-year, and 5-year). This pattern supports the notion, already suggested by patent volume and SY trends, that iNPs have passed their peak period of development and entered a more mature phase. The decline is especially evident when looking at average citations per family, which drop below 5 in recent years even for short-term citations. This could be attributed to a narrowing technological focus, with fewer cross-domain applications, or simply to a lower relevance of more recent patents. Comparing the two technologies, iNPs display traits of maturity and stabilization, whereas MOFs exhibit sustained and possibly increasing short-term influence. This contrast reinforces the broader narrative emerging from the analysis: while iNPs appear to have plateaued, MOFs are still on a rising trajectory, potentially approaching their innovation peak. These diverging paths highlight the heterogeneous lifecycles that technologies can follow, even within the same application domain.

4. Discussion

This study proposes a lightweight and replicable framework to compare the maturity of emerging technologies using only patent-derived indicators. While it does not aim to estimate absolute technological value, the approach proves useful in highlighting relative differences when applied to comparable domains. Through a case study on Metal–Organic Frameworks (MOFs) and inorganic nanoparticles (iNPs) in the field of cancer nanomedicine, we show how selected IP metrics, particularly the Scope–Year index and citation trends, can reflect key innovation dynamics. The analysis of patent production, combined with these indicators, highlights notable differences in the maturity trajectories of MOFs and iNPs. Specifically: (i) patent filings for iNPs exhibit a clear deceleration starting around 2013, while MOFs show a sharp increase after 2015; (ii) the Scope–Year (SY) index is consistently higher for MOFs throughout the 2010–2020 decade, indicating broader and more sustained protection; (iii) citation trends diverge, with MOFs maintaining relatively stable short-term impact, while iNPs show a progressive decline. We interpret these patterns through established IP-based maturity proxies. In particular, renewal/family-scope measures, captured by the SY index, and forward citations have been linked to patent value and commercialization likelihood in prior work. In this lens, iNPs’ post-2013 filing slowdown and declining 3–5-year citations are consistent with a consolidation stage and increasingly targeted territorial strategies, whereas MOFs’ sustained early-window citations and comparatively broader SY footprint (2010–2020) indicate an expansion stage with wider and longer protection. A plausible reading is that iNPs face demand/regulation-driven saturation that compresses incremental filings, while MOFs retain higher design plasticity that supports faster inventive recombination. In practical terms, this results in a lead–lag dynamic, with iNPs consolidating while MOFs continue to explore. The proposed framework offers a practical tool for comparing the technological maturity of emerging domains. In the context of nanomedicine, MOF–iNP hybrids/composites (e.g., MOF shells on magnetic/plasmonic cores) represent a promising direction in which the mature iNP platform can pull MOFs via manufacturing/regulatory know-how, while MOFs refresh iNPs through introducing tunable porosity and functional adaptability via targeting and controlled release. Within our indicators, such convergence would likely appear as cross-citations, co-assignments, and stabilized short-term citation impact within the hybrid sub-space. By capturing differences in persistence, global diffusion, and innovation visibility, it can inform decision-making in research prioritization, technology scouting, and investment planning. Its simplicity and reliance on public data make it particularly suitable for early-stage evaluation, especially in dynamic or resource-constrained contexts. Moreover, trend analysis through standardized patent indicators may help identify collaboration opportunities and anticipate shifts in technological positioning. These patent-based indicators are decision aids and are sensitive to time-censoring and Scope–Year weighting; nevertheless, the directional conclusions remain stable under simple. Accordingly, we interpret late-period signals cautiously and recommend triangulation with market or clinical evidence, when available. Future research could extend this approach to broader sectors, examining multiple technologies within the same application domain. As an avenue for extension, our framework could integrate multi-dimensional, diffusion-oriented metrics of technological value, capturing lifetime, strength, breadth, and geographic dispersion, alongside SY to test robustness across measurement families [27]. Combining IP indicators with market performance and regulatory data could reveal correlations between innovation maturity and commercial impact, thus refining forecasting capabilities and investment strategies.

5. Conclusions

This work introduces a simple, patent-based framework to assess the maturity of emerging technologies using open data. In a cancer–nanomedicine case study, Scope–Year and short-window citations reveal divergent paths: iNPs show post-2013 consolidation, whereas MOFs continue to expand with broader and longer protection. The approach is replicable and decision-oriented, supporting early prioritization and technology scouting. Despite inherent time-censoring, the observed trends remain robust. Future work will explore MOF–iNP convergence (composites) by tracking co-assignments, cross-citations and aligning IP signals with market or clinical data.

Author Contributions

Conceptualization, U.M.M.; methodology, U.M.M. and M.F.; software, U.M.M.; validation, U.M.M. and M.F.; formal analysis, U.M.M. and M.F.; investigation, U.M.M. and M.F.; resources, M.F., D.F.P. and L.R.; data curation, U.M.M.; writing—original draft preparation, U.M.M.; writing—review and editing, P.H. and Y.P.; visualization, U.M.M. and D.F.P.; supervision, P.H. and Y.P.; project administration, P.H.; funding acquisition, P.H. and S.L. All authors have read and agreed to the published version of the manuscript.

Funding

This research was supported by the Marie Skłodowska-Curie Actions, H2020-MSCA-ITN-2019 HeatNMof project (ref. 860942).

Data Availability Statement

The data presented in this study are openly available in Zenodo at https://doi.org/10.5281/zenodo.17591829.

Acknowledgments

The authors would like to thank Federica Cassano for valuable discussions and feedback during the preparation of this manuscript.

Conflicts of Interest

Two authors, Umberto Maria Matera and Sergio Larreina, were employed by the company Isern Patentes y Marcas. The remaining authors declare that the research was conducted in the absence of any commercial or financial relationships that could be construed as a potential conflict of interest.

Abbreviations

The following abbreviations are used in this manuscript:
SYScope–Year Index
MOFMetal–Organic Frameworks
iNPInorganic Nanoparticle
GDPGross Domestic Product
IPCInternational Patent Classification
PCTPatent Cooperation Treaty
WIPOWorld Intellectual Property Organization
TRLTechnology Readiness Level

Appendix A

This section provides the queries used to retrieve MOF and iNP-related patent families from Orbit Intelligence. Searches were performed on title, abstract and claims fields, applying a biomedical filter and a cutoff on application date (≤2020). Wildcards were used to account for lexical variations.
Table A1. Query for the search of the patent families sets analyzed for MOFs and iNPs (“*” indicates truncation, allowing retrieval of all terms beginning with the specified root.).
TechnologyQuery
Metal–organic frameworks (MOFs)Title abstract claims = ((MOF) or (MOFs)) or (metal–organic-framework *)
AND
Title abstract claims = (bio * or medic * or therap * or (in vivo) or (in vitro) or pharma * or cure *)
AND
Application date ≤ 2020
Inorganic Nanoparticles (iNPs)Title abstract claims = (magnetic * nanoparticle *) or (plasmonic * nanoparticle *) or
(iron oxide nanoparticle *)
AND
Title abstract claims = (bio * or medic * or therap * or (in vivo) or (in vitro) or pharma * or cure * or
Diagnostic * or diagnosi * or theranostic)
AND
Application date ≤ 2020

References

  1. Bornmann, L.; Marx, W. How Good Is Research Really? EMBO Rep. 2012, 14, 226–230. [Google Scholar] [CrossRef]
  2. Granstrand, O. The Economics and Management of Intellectual Property; Edward Elgar Publishing: Cheltenham, UK, 1999. [Google Scholar]
  3. WIPO. WIPO Intellectual Property Handbook: Policy, Law and Use; World Intellectual Property Organization: Geneva, Switzerland, 2017. [Google Scholar]
  4. Adelman, M.J. The New World of Patents Created by the Court of Appeals for the Federal Circuit. Univ. Mich. J. Law Reform 1986, 20, 979. [Google Scholar] [CrossRef]
  5. Arora, A. Licensing Tacit Knowledge: Intellectual Property Rights and the Market for Know-How. Econ. Innov. New Technol. 1995, 4, 41–60. [Google Scholar] [CrossRef]
  6. Browne, D.; O’Mahony, M.; Caulfield, B. How Should Barriers to Alternative Fuels and Vehicles Be Classified and Potential Policies to Promote Innovative Technologies Be Evaluated? J. Clean. Prod. 2012, 35, 140–151. [Google Scholar] [CrossRef]
  7. Hall, B.H.; Ziedonis, R.H. The Patent Paradox Revisited: An Empirical Study of Patenting in the U.S. Semiconductor Industry, 1979–1995. Rand J. Econ. 2001, 32, 101–128. [Google Scholar] [CrossRef]
  8. Kunamneni, A.; Plou, F.J.; Ballesteros, A.; Alcalde, M. Laccases and Their Applications: A Patent Review. Recent Pat. Biotechnol. 2008, 2, 10–24. [Google Scholar] [CrossRef] [PubMed]
  9. Liu, C.-Y.; Wang, J.-C. Forecasting the Development of the Biped Robot Walking Technique in Japan through S-Curve Model Analysis. Scientometrics 2010, 82, 21–36. [Google Scholar] [CrossRef]
  10. Liu, K.; Chen, C.-H. Formulation of Research and Development Strategy by Analysing Patent Portfolios of Key Players the Semiconductor Industry According to Patent Strength and Technical Function. World Pat. Inf. 2022, 70, 102125. [Google Scholar] [CrossRef]
  11. Mejia, C.; Kajikawa, Y. Emerging Topics in Energy Storage Based on a Large-Scale Analysis of Academic Articles and Patents. Appl. Energy 2020, 263, 114625. [Google Scholar] [CrossRef]
  12. Oltra, V.; Saint Jean, M. Variety of Technological Trajectories in Low Emission Vehicles (LEVs): A Patent Data Analysis. J. Clean. Prod. 2009, 17, 201–213. [Google Scholar] [CrossRef]
  13. Paliwal, R.; Paliwal, S.R.; Kenwat, R.; Das Kurmi, B.; Sahu, M.K. Solid Lipid Nanoparticles: A Review on Recent Perspectives and Patents. Expert Opin. Ther. Pat. 2020, 30, 179–194. [Google Scholar] [CrossRef]
  14. Shubbak, M.H. Advances in Solar Photovoltaics: Technology Review and Patent Trends. Renew. Sustain. Energy Rev. 2019, 115, 109383. [Google Scholar] [CrossRef]
  15. Visser’s Annotated European Patent Convention; Visser, D., Lai, L., de Lange, P., Suominen, K., Eds.; Kluwer, Wolters: Alphen aan den Rijn, The Netherlands, 2019. [Google Scholar]
  16. Xu, S.; Mariani, M.S.; Lü, L.; Napolitano, L.; Pugliese, E.; Zaccaria, A. Citations or Dollars? Early Signals of a Firm’s Research Success. Technol. Forecast Soc. Change 2024, 201, 123208. [Google Scholar] [CrossRef]
  17. Van Pottelsberghe De La Potterie, B.; Van Zeebroeck, N. A Brief History of Space and Time: The Scope-Year Index as a Patent Value Indicator Based on Families and Renewals. Scientometrics 2008, 75, 319–338. [Google Scholar] [CrossRef]
  18. Hu, Z.; Zhou, X.; Lin, A. Evaluation and Identification of Potential High-Value Patents in the Field of Integrated Circuits Using a Multidimensional Patent Indicators Pre-Screening Strategy and Machine Learning Approaches. J. Informetr. 2023, 17, 101406. [Google Scholar] [CrossRef]
  19. Carregal-Romero, S.; Guardia, P.; Yu, X.; Hartmann, R.; Pellegrino, T.; Parak, W. Magnetically Triggered Release of Molecular Cargo from Iron Oxide Nanoparticle Loaded Microcapsules. Nanoscale 2015, 7, 570–576. [Google Scholar] [CrossRef]
  20. Liu, H.; Xu, C.; Meng, M.; Li, S.; Sheng, S.; Zhang, S.; Ni, W.; Tian, H.; Wang, Q. Metal-Organic Framework-Mediated Multifunctional Nanoparticles for Combined Chemo-Photothermal Therapy and Enhanced Immunotherapy against Colorectal Cancer. Acta Biomater. 2022, 144, 132–141. [Google Scholar] [CrossRef]
  21. Picchi, D.; Biglione, C.; Horcajada, P. Nanocomposites Based on Magnetic Nanoparticles and Metal-Organic Frameworks for Therapy, Diagnosis, and Theragnostics. ACS Nanosci. 2023, 4, 85–114. [Google Scholar] [CrossRef]
  22. Rojas, S.; Arenas-Vivo, A.; Horcajada, P. Metal-Organic Frameworks: A Novel Platform for Combined Advanced Therapies. Coord. Chem. Rev. 2019, 388, 202–226. [Google Scholar] [CrossRef]
  23. Sorraya, L.; Biglione, C.; Horcajada, P. Advances in Plasmonic-Based MOF Composites, Their Bioapplications and Perspectives in This Field. Expert Opin. Drug Deliv. 2022, 19, 1417–1434. [Google Scholar]
  24. Clarivate Web of Science Platform. Available online: https://clarivate.com/products/scientific-and-academic-research/research-discovery-and-workflow-solutions/webofscience-platform/ (accessed on 1 August 2024).
  25. Guellec, D.; Van Pottelsberghe de la Potterie, B. Applications, Grants and the Value of Patent. Econ. Lett. 2000, 69, 109–114. [Google Scholar] [CrossRef]
  26. Ding, M.; Yu, W.; Zeng, T.; Wang, S. PTNS: Patent Citation Trajectory Prediction Based on Temporal Network Snapshots. Sci. Rep. 2024, 14, 24034. [Google Scholar] [CrossRef] [PubMed]
  27. Song, H.; Hou, J.; Zhang, Y. The Measurements and Determinants of Patent Technological Value: Lifetime, Strength, Breadth, and Dispersion from the Technology Diffusion Perspective. J. Informetr. 2023, 17, 101370. [Google Scholar] [CrossRef]
Figure 1. Applications, grants, and priorities of MOFs (a) and iNPs (b).
Inventions 10 00107 g001
Figure 2. Scientific publications for MOFs and iNPs [24].
Inventions 10 00107 g002
Figure 3. Grant rate in percentage (a) and family size average (b) for iNPs (orange) and MOFs (blue) technologies.
Inventions 10 00107 g003
Figure 4. Patents life average evolution (blue line), and maximum patent life (red line) for MOFs (a) and iNPs (b).
Inventions 10 00107 g004
Figure 5. Scope–Year index evolution of the patent families in MOF and iNP technologies: (a) annual aggregate (sum across families by priority year); (b) average SY per family.
Inventions 10 00107 g005
Figure 6. Citations of MOFs (a) and iNPs (b). Left, citations received by families born between 1990 and 2020; right, average citations per family between1990 and 2020 (zoomed portion of the average citation per family since 2000).
Inventions 10 00107 g006
Disclaimer/Publisher’s Note: The statements, opinions and data contained in all publications are solely those of the individual author(s) and contributor(s) and not of MDPI and/or the editor(s). MDPI and/or the editor(s) disclaim responsibility for any injury to people or property resulting from any ideas, methods, instructions or products referred to in the content.