Article

A Modern Ultrasonic Cleaning Tank Developed for the Jewelry Manufacturing Process and Its Cleaning Efficiency

by
Chatchapat Chaiaiad
,
Pawantree Borthai
and
Jatuporn Thongsri
*
Computer Simulation in Engineering Research Group, Department of Manufacturing System Technology, School of Integrated Innovative Technology, King Mongkut’s Institute of Technology Ladkrabang, Bangkok 10520, Thailand
*
Author to whom correspondence should be addressed.
Inventions 2025, 10(5), 90; https://doi.org/10.3390/inventions10050090
Submission received: 4 September 2025 / Revised: 30 September 2025 / Accepted: 2 October 2025 / Published: 7 October 2025
(This article belongs to the Section Inventions and Innovation in Advanced Manufacturing)

Abstract

This research details the development and evaluation of a Modern Ultrasonic Cleaning Tank (MUCT) designed to enhance cleaning efficiency in jewelry manufacturing, particularly for silver jewelry, replacing the traditional method, which was less efficient and had higher operating costs. The MUCT offers capabilities of single- or dual-frequency ultrasonic operation (28 kHz and 40 kHz) and adjustable transducer positioning. An advanced method involving computer simulations, utilizing harmonic response analysis and transient dynamic analysis, was employed to determine the acoustic pressure inside the MUCT, thereby indicating the cavitation intensity required to achieve high cleaning efficiency. Simulation results confirm that this design can distribute acoustic pressure throughout the MUCT, as intended. A prototype MUCT was assembled, and its operation was validated through foil corrosion tests, ultrasonic power concentration (UPC) measurements, and jewelry cleaning tests. The results revealed that the MUCT’s center provided the maximum UPC of 28 W/L and an acoustic pressure of 30.43 MPa, effectively operating at single and dual frequencies, and achieving superior dirt removal. The highest cleaning efficiency of 100% was achieved using dual frequency with a 97% water and 3% dishwashing liquid mixture at 60 °C, exceeding the 23.52% obtained with water at 27 °C without ultrasonic treatment. The MUCT, successfully integrated into the manufacturing process, offers customizable features to meet various cleaning needs, providing flexibility, improved performance, and cost savings.

1. Introduction

Thailand is a significant global manufacturing hub for gems and jewelry. In 2024, Thailand ranked 3rd in the world for exporting these products, with a value of 9609.10 million US dollars, a 6.11% year-over-year increase [1]. Especially for silver jewelry, Thailand was ranked 2nd among the world’s exporters in 2017 [2]. For these reasons, Thailand focuses on developing its own manufacturing technology and reducing its dependence on imported foreign technology. Therefore, the technology employed for cleaning these products is one of the technologies Thai jewelry manufacturers aimed to develop for themselves.
Ultrasonic cleaning is a crucial process in manufacturing products, offering several advantages. For example, it can remove dirt, grease, grime, and contaminants from hard-to-reach areas, is suitable for delicate items like medical instruments, electronics, and jewelry, can clean multiple items simultaneously in a short time, reduces the need for harsh chemicals and excessive water usage, avoids physical damage to surfaces unlike scrubbing, effectively eliminates bacteria, dust, and fine particles, and has low maintenance costs. Importantly, it cleans various materials, including metals, plastics, glass, and ceramics. In the ultrasonic cleaning process, manufacturers recognize that the cleaning efficiency depends on both operating conditions and the design of the ultrasonic cleaning tank (UCT). The operating conditions include solution, sonification time, surfactant, temperature, flow, and object shape with positioned placement [3,4,5]. The UCT’s designs are the tank’s shape, volume, frequency, power, number of transducers, and materials [6,7,8]. Accordingly, optimizing the operating conditions and the design of the UCT results in high efficiency during the cleaning process; however, an experiment may determine the UCT’s design, and the operating conditions may be derived from computer simulation.
Today, computer simulation, for example, multiphysics, harmonic response analysis, computational fluid dynamics, and transient dynamic analysis, is an advanced method for designing and developing a UCT to achieve high cleaning efficiency. Since the UCT consists of three components—transducers, tanks, and ultrasonic generators—manufacturers focus on developing the first two components using computer simulation. From the manufacturers’ perspective, the last component is given less attention than the first two components because the current technology used in generators is already sufficient for industrial-scale applications; hence, developing transducers and tanks is more economically worthwhile than developing generators. In transducer development, modal analysis and harmonic response analysis (HRA) have been employed to determine the frequency and vibrational characteristics of the transducers [9,10,11]. Meanwhile, multiphysics [12,13,14], HRA [14,15,16,17], computational fluid dynamics [17,18,19], and transient dynamic analysis (TDA) [20] in UCT development yield acoustic pressure and solution flow fields, leading to the understanding of cavitation intensity inside the UCT under designs and operating conditions, helping in developing the UCT to achieve a high cleaning efficacy.
Jewelry cleaning is a crucial process in jewelry manufacturing. The most crucial reason manufacturers choose this cleaning method is that it effectively removes dirt, even on small and intricately shaped jewelry. It is also economical, environmentally friendly, and especially suitable for shining metals [21] such as silver. Importantly, ultrasonic cleaning removes oxide layers, such as Ag2S and Ag2O, that often tarnish jewelry [22], thereby enhancing its quality and attracting customers, which helps jewelry manufacturers sell at a higher price. Figure 1 shows a sample of a silver necklace, a product that the UCT has cleaned during the jewelry manufacturing process. A small picture presents an enlarged view of the silver necklace.
This research is based on the demand of Thai jewelry manufacturers for a new generation of UCT that is more efficient than the conventional generation, which has low cleaning efficiency, a single frequency, and expensive maintenance. According to the literature review [3,4,5,6,7,8,9,10,11,12,13,14,15,16,17,18,19,20,21,22], no research has been reported on the development of a dual-frequency ultrasonic tank with adjustable frequency and transducer placement that can be applied in the jewelry manufacturing industry. Therefore, this research reports on the development of the new generation UTC, the modern ultrasonic cleaning tank (MUCT), and its cleaning efficiency, which meets the manufacturer’s demand. This MUCT features transducers with dual frequencies of 28 kHz and 40 kHz, allowing for adjustable transducer position. Therefore, users can customize the MUCT’s design and operating conditions to suit their specific cleaning products, resulting in higher cleaning efficiency.
This article reports a step-by-step development, including an efficiency test, from the initial stages to implementation. First, the MUCT was designed under the manufacturer’s requirements. Then, the HRA and TDA were employed to determine the acoustic pressure, and a foil corrosion test was used to investigate the corrosion pattern caused by cavitation. Both results were compared to confirm the effective operation of the MUCT. Next, a prototype MUCT was assembled. The ultrasonic power concentration, microscopic inspection, and jewelry cleaning experiments were used to assess the cleaning efficiency of MUCT.

2. Theoretical Background and Methodology

The theoretical background includes computer simulation and the jewelry cleaning process. The computer simulation was used to calculate acoustic pressure, and understanding the jewelry cleaning process informed the design of the experiment to replicate the actual cleaning process, thereby achieving the research objectives. Methodology describes the materials and methods employed in this research. All are briefly described below.

2.1. Computer Simulation

It consists of the HRA and TDA. Both are based on finite element analysis. In ANSYS software version 2022R1, a governing equation for the HRA can be expressed as [16,23].
ω 2 M f + j ω C f + K f p = F f
where ω is the ultrasonic-driven frequency (rad/s), [M] is the mass matrix (N s2/Pa), [C] is the damping matrix (N s/m), [K] is the stiffness matrix (N/Pa), {F} is the acoustic load vector (N), and {p} is the nodal acoustic pressure vector (Pa). The subscript f refers to the fluid as a solution in this case.
After finishing the computer simulation process, solving equation (1) yields {p} related to cavitation intensity, which can be used to assess the cleaning efficiency further. The HRA is only practical for single-frequency UCTs but unsuitable for dual and multi-frequency, as employed in [14,15,16,17,18].
For the dual and multi-frequency UCT, the TDA is used to investigate ultrasonic cleaning. The governing equation of TDA is given by [20]
M f p ¨ + C f p ˙ + K f p = F f
where p ¨ and p ˙ are the acceleration and velocity of the nodal acoustic pressure vector, respectively.
The two Equations (1) and (2) are related, as proved in [19]. Regarding equation (2), it is clear that Equation (2) depends on time as a transient state calculation because of p ¨ and p ˙ , while Equation (1) does not. The TDA needs more complicated settings than the HRA. In addition, a single-frequency UCT can be used for both TDA and HRA because the TDA results converge with the HRA results for a single-frequency UCT, as reported in [19], confirming the TDA’s credibility. However, the UCT developers prefer to use the HRA for single frequencies over the TDA because of its ease of setting and lower computational resource requirement.
Like the HRA, after completing the computer simulation process of TDA, Equation (2) provides {p} related to cavitation intensity, which can be used to assess the cleaning efficiency later.

2.2. Jewelry Cleaning Process

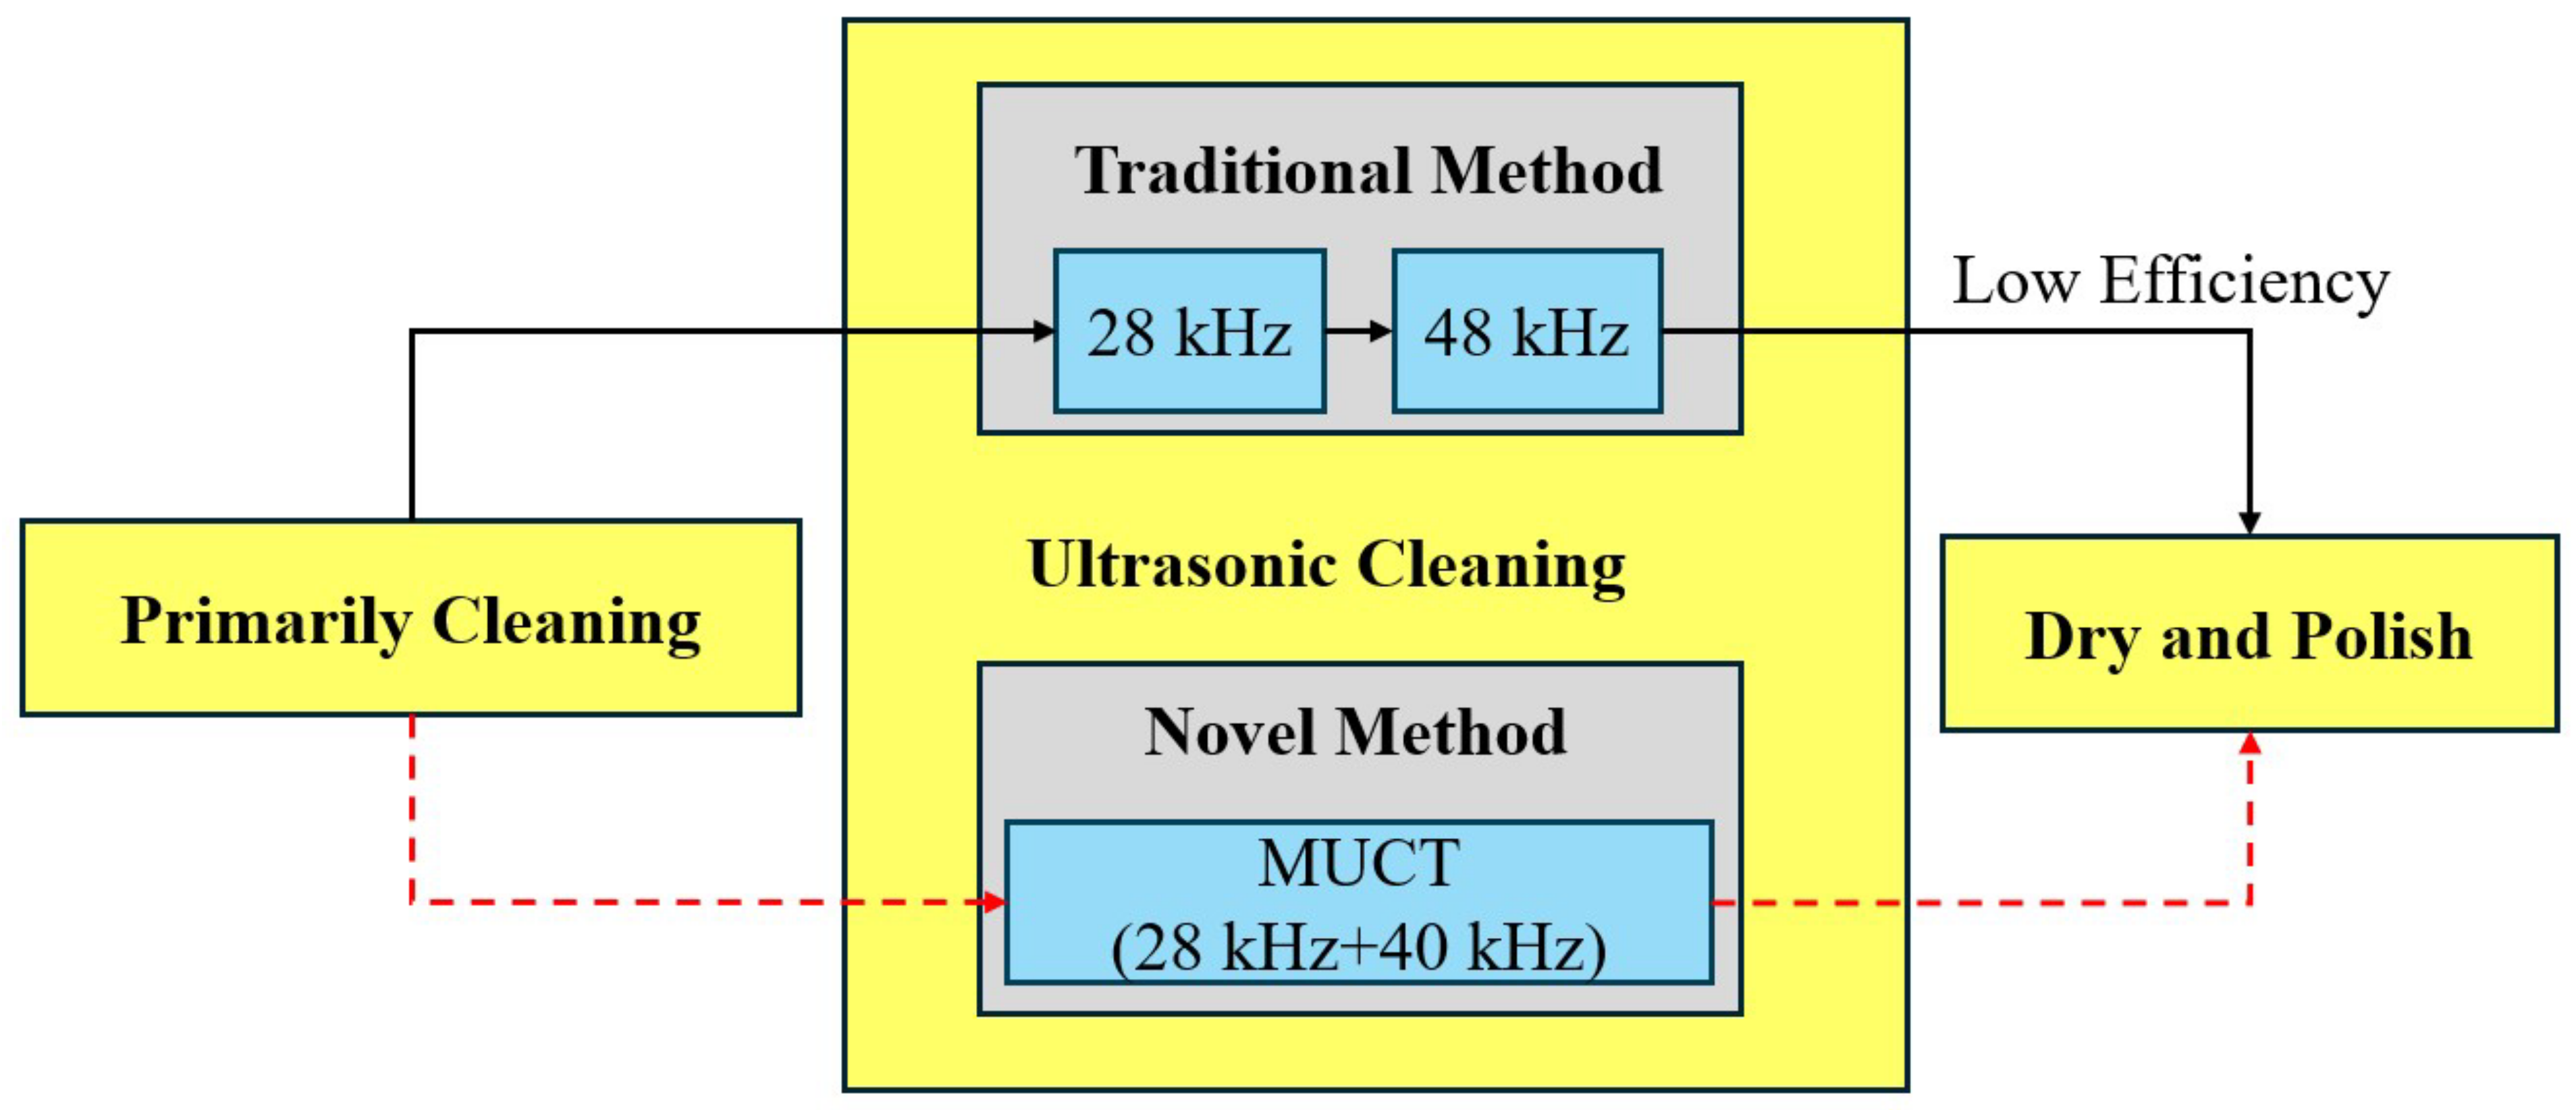
The jewelry-cleaning process varies depending on the product materials and manufacturers; however, a typical process is illustrated in Figure 2. The solid arrows present the traditional process, while the dotted arrows reveal the novel process.

2.2.1. Preliminary Cleaning

The jewelry was preliminarily cleaned after the silver was shaped into a product design. It was wiped and polished with dubbing until it shone. Dubbing is a wax from animal fat used to polish metals, making them beautiful, bright, and shiny. This process has a critical disadvantage: frequently, the dubbing tends to remain in the tiny pores of the jewelry, which cannot be cleaned by human wiping and polishing, resulting in the jewelry not being shiny. Therefore, ultrasonic processing is needed to clean the remaining dubbing.

2.2.2. Ultrasonic Cleaning

This research is helpful in this process. Previously, the jewelry manufacturer employed a traditional method. First, the jewelry products were cleaned in the 28 kHz ultrasonic cleaning tank, followed by cleaning in the 40 kHz ultrasonic cleaning tank. Both tanks were separated using a fixed transducer positioning; hence, the traditional method required a significantly longer sonication time, resulting in lower efficiency and higher operating costs. Accordingly, this research proposes a novel method. The jewelry products were cleaned in the MUCT, which has the capability of selecting either single or dual frequency (28 kHz and 40 kHz) and adjusting transducer positioning. Such a capability makes the novel method more efficient and state-of-the-art than the traditional method and more economical, presenting the MUCT with a suitable operating condition. The use of dubbing followed by ultrasonic cleaning is not applicable in the electronics, medical, and food processing industries, making this research novel and challenging.

2.2.3. Dry and Polish

After finishing the two previous processes, the jewelry was allowed to dry, and then it was wiped with a cleansing solution to prevent rust and enhance its shine. After that, it was left until the packaging process.

2.3. Methodology

Figure 3 presents a flowchart of the methodology, which comprises the MUCT design and assembly, computer simulation process, measurement, product cleaning, assessment of the MUCT’s operation and cleaning efficiency, and identification of limitations and opportunities for developing the MUCT, briefly explained below.

2.3.1. The MUCT Design and Assembly

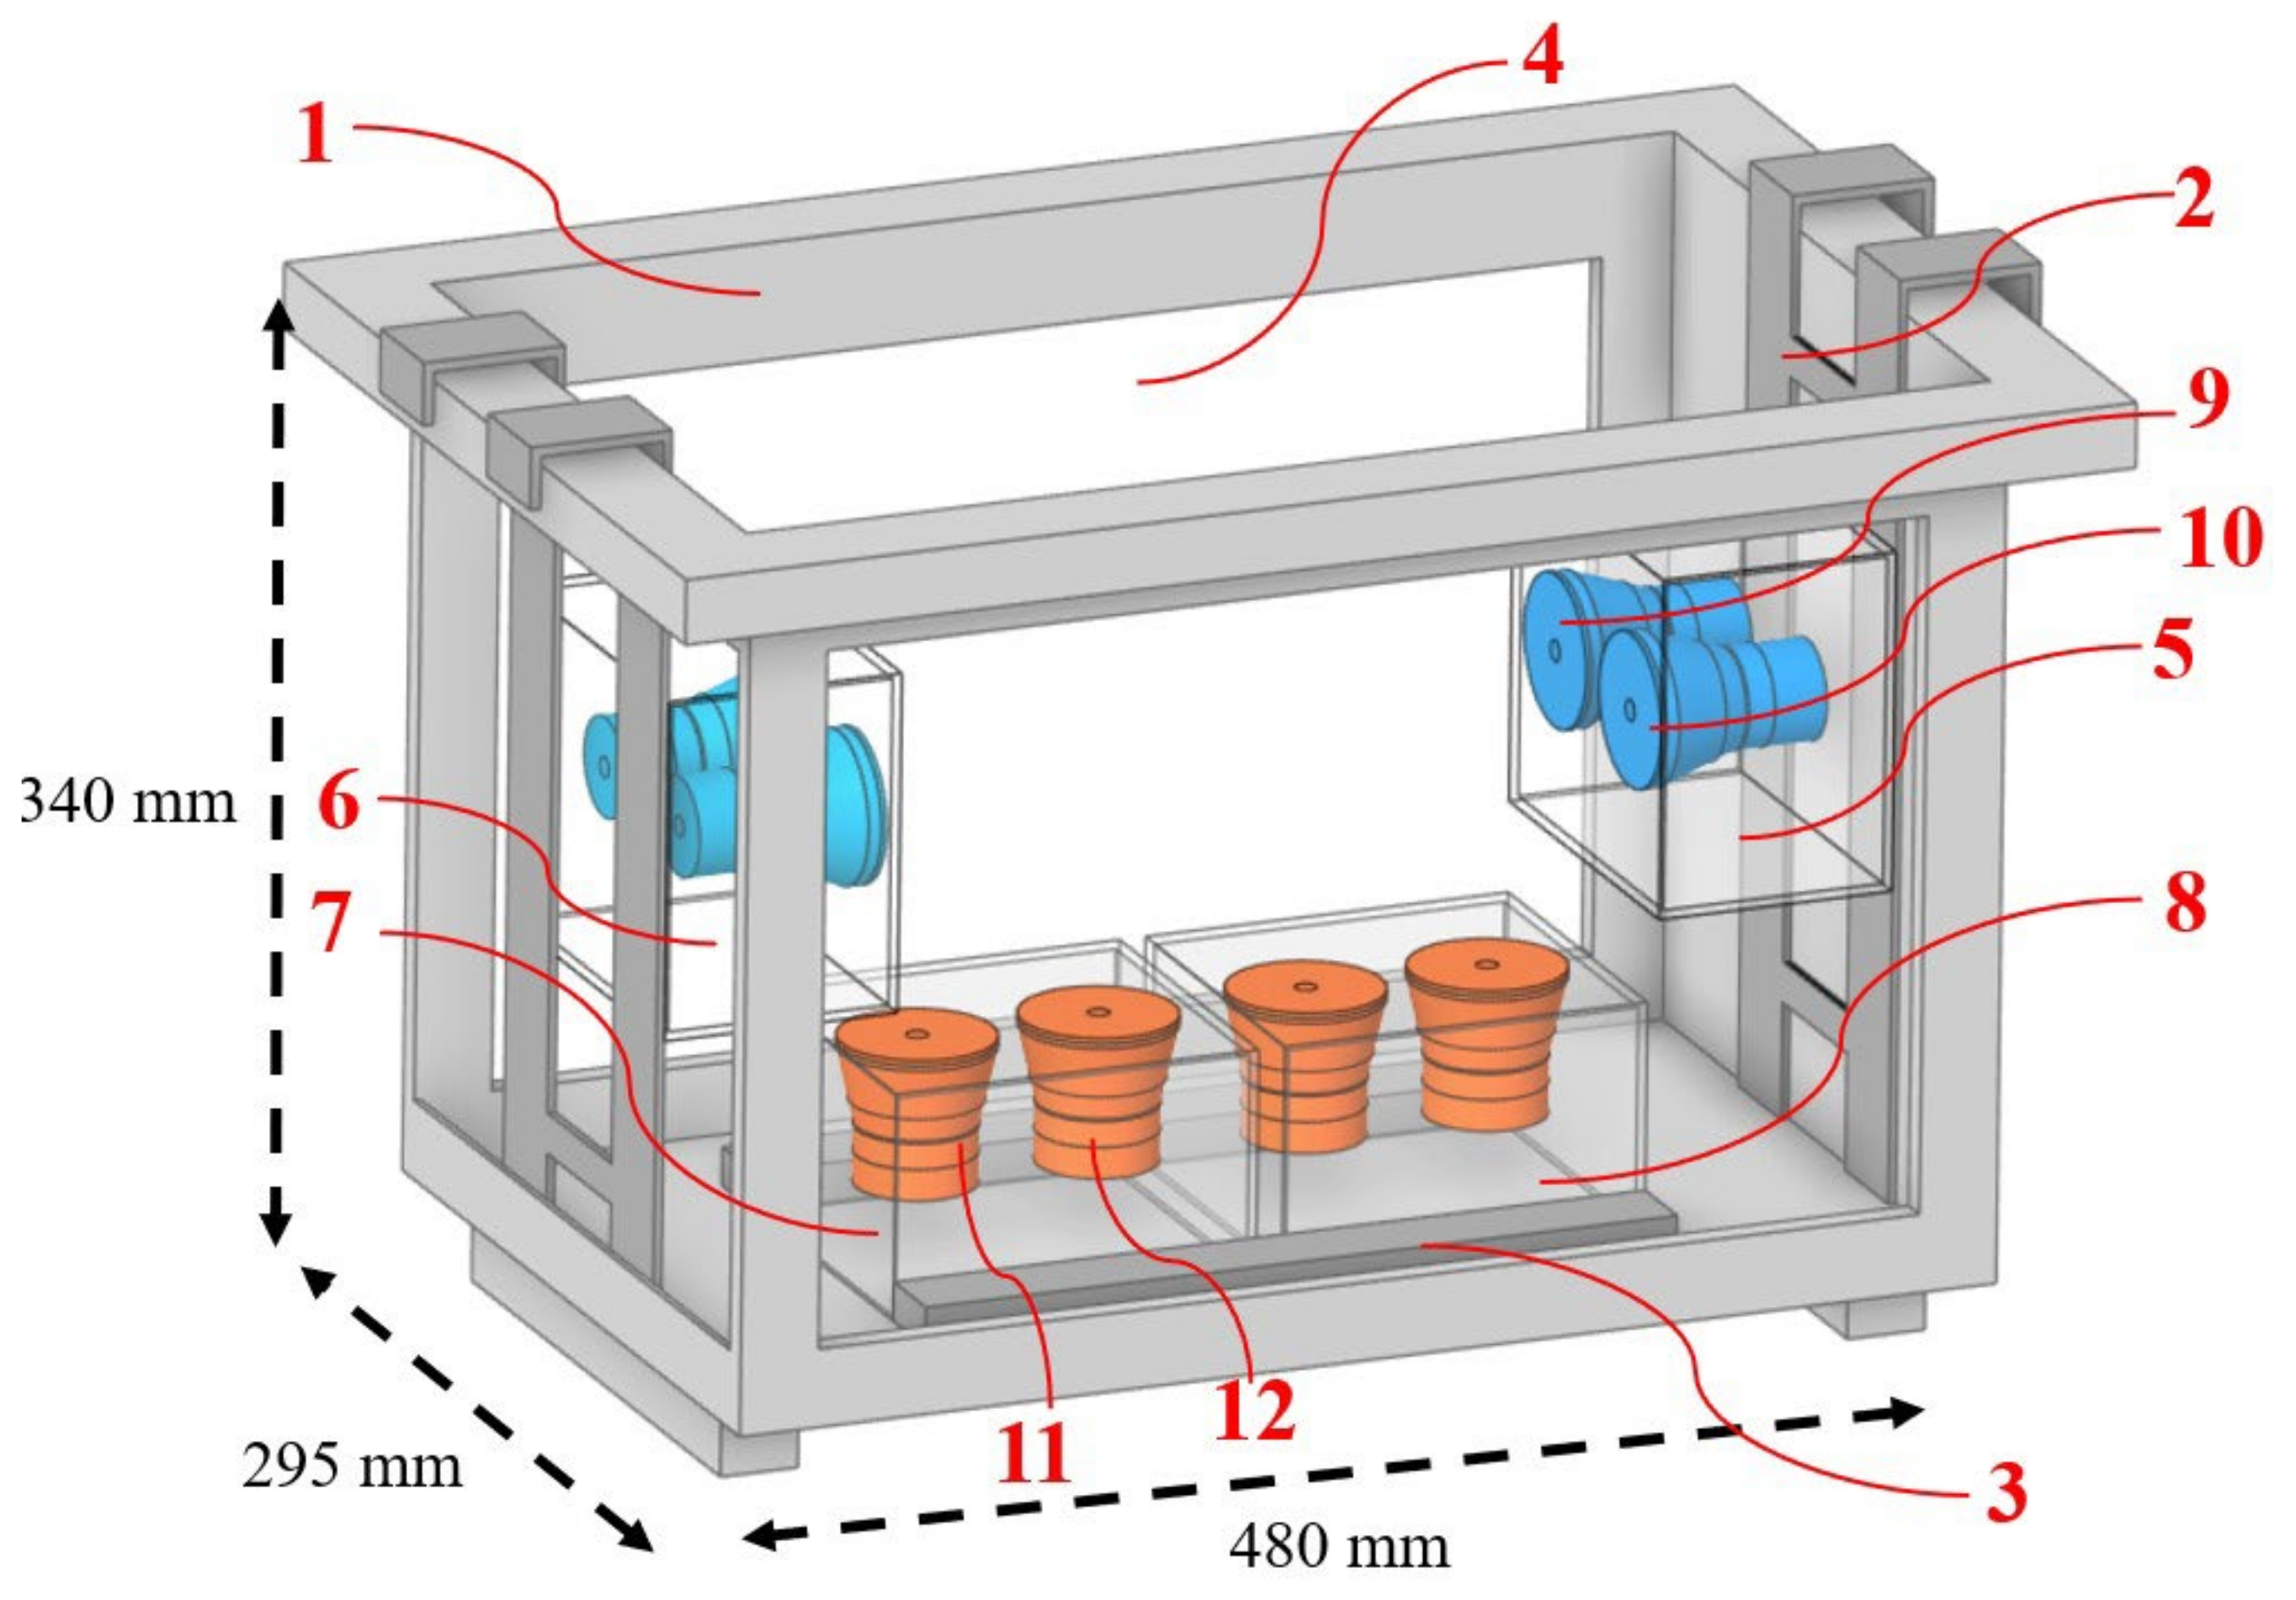
Because the ultrasonic cleaning efficiency is the highest when the bubble size is close to that of the dirt [16,24], and the dirt (remaining dubbing) size is approximately 10–20 μm based on data from the manufacturer’s laboratory, using the 25–50 kHz range to generate cavitation bubbles with a radius of about 6–16 μm tends to produce less mechanical damage to products and operate more quietly than lower-frequency ultrasonic cleaners [6,24]. The 28 and 40 kHz match the dirt, which is safe and suitable for the MUCT in this jewelry cleaning; therefore, both frequencies were selected as the first specification for the MUCT design. In addition, since the transducer position affects the cleaning efficiency [15,18], the MUCT should have a transducer position adjustment capability as a second specification. The MUCT was designed according to the specifications, and it is illustrated in Figure 4 as a transparent model, revealing its internal structure and rough dimensions. Other frequencies are less popular because their components might need to be specially custom-made to support them, making them more expensive, and they may provide lower cleaning efficiency than 28 kHz and 40 kHz. Many parts compatible with 28 kHz and 40 kHz are readily available in the market, leading to cost savings.
This MUCT consists of a rectangular tank (1) with two vertical sliding rails (2) installed on the short side walls and a horizontal sliding rail (3) installed on the floor of the MUCT (1). The two long side walls are made of glass (4). The sliding rails hold the transducer boxes (5,6,7,8) in place, allowing them to move. The transducer box (5,6) contains two 28 kHz transducers (9,10), and the transducer box (7,8) contains two 40 kHz transducers (11,12). The transducer boxes (5,6,7,8) can be placed on either a vertical slide rail (2) or a horizontal slide rail (3) and are interchangeable. The rectangular tank (1) and transducer boxes (5,6,7,8) are made of stainless steel grade 304 (SUS304). The slide rails (2) are installed on the short side walls of the rectangular tank (1). When the transducer boxes (5,6,7,8) are hung at the slide rails (2), they are perpendicular to the MUCT, as seen in Figure 4. Because of dual frequencies, interchangeable transducer box position capability, and a glass wall, this design makes the MUCT more utilized than other UCTs manufactured previously.
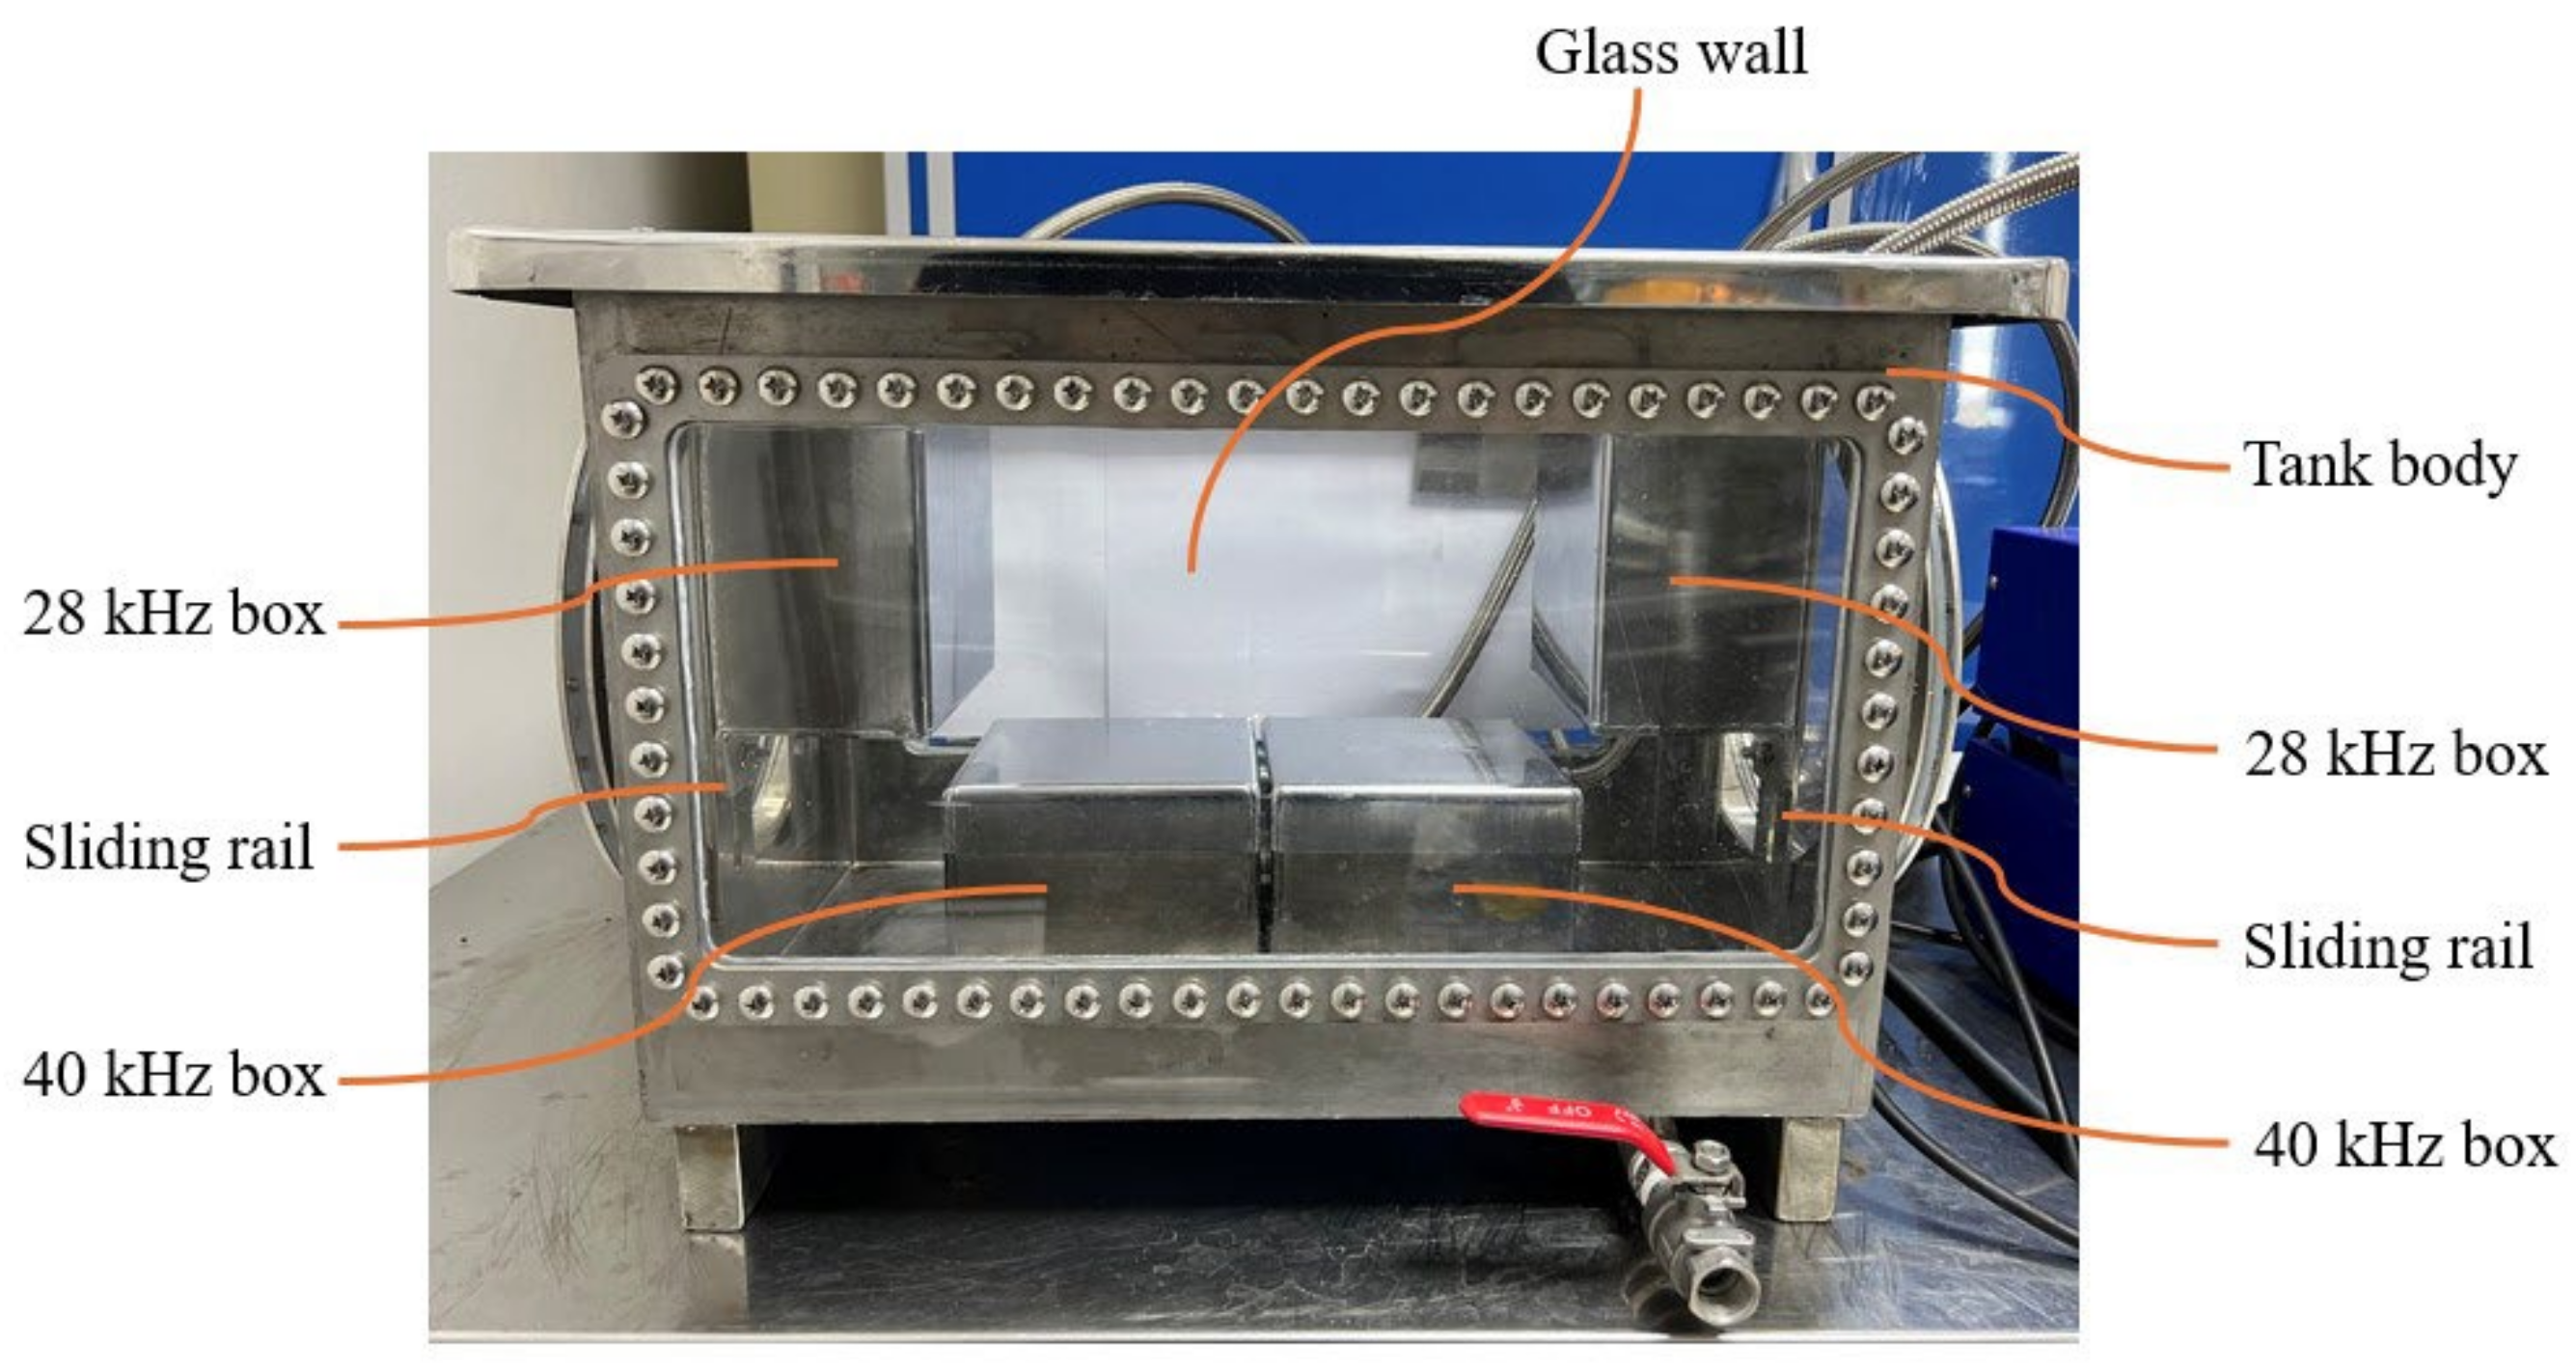
The transducers, operating at 28 and 40 kHz, are available on the market. They are similar to those employed in [15,18,20]. The glass wall helps users to monitor the cleaning process at all times. Other components have been formed in our partner metal factory. All components have been assembled into the MUCT, as shown in Figure 5. Some components are shown and labeled, while others are not, since they were installed inside.

2.3.2. Computer Simulation Process

This part aims to use computer simulation to determine the acoustic pressure distribution and assess the MUCT operation. Using the assembled MUCT in Figure 5, the 28 kHz transducers were placed on the side wall center, while the 40 kHz transducers were placed on the floor, in line with the report in [20] that the higher frequency should be on the floor and the lower frequency on the side to create the highest cavitation intensity. The design mentioned was forwarded to the computer simulation process, which involved creating CAD and mesh models, specifying material properties, defining boundary conditions, and setting analysis parameters.
  • CAD and Mesh Models
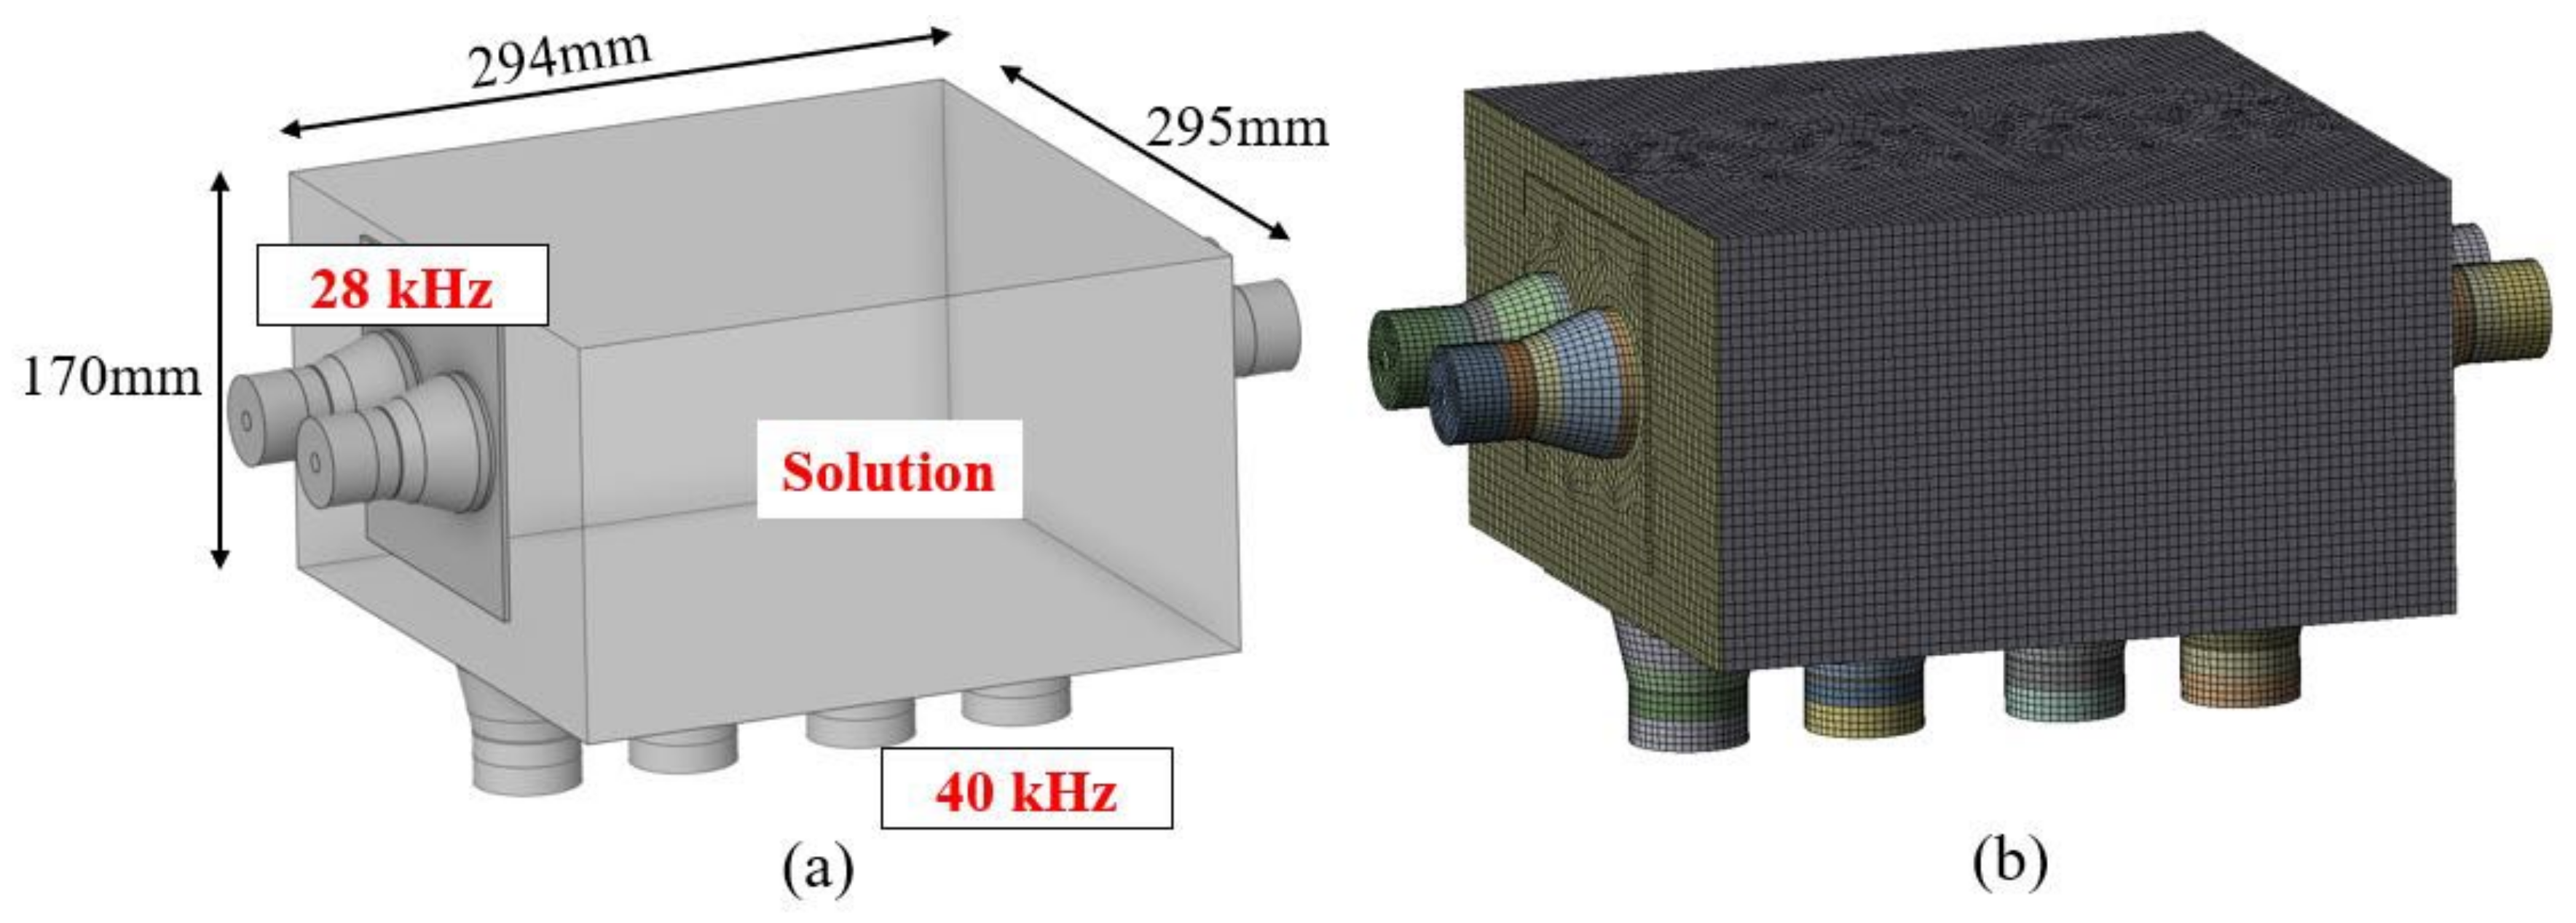
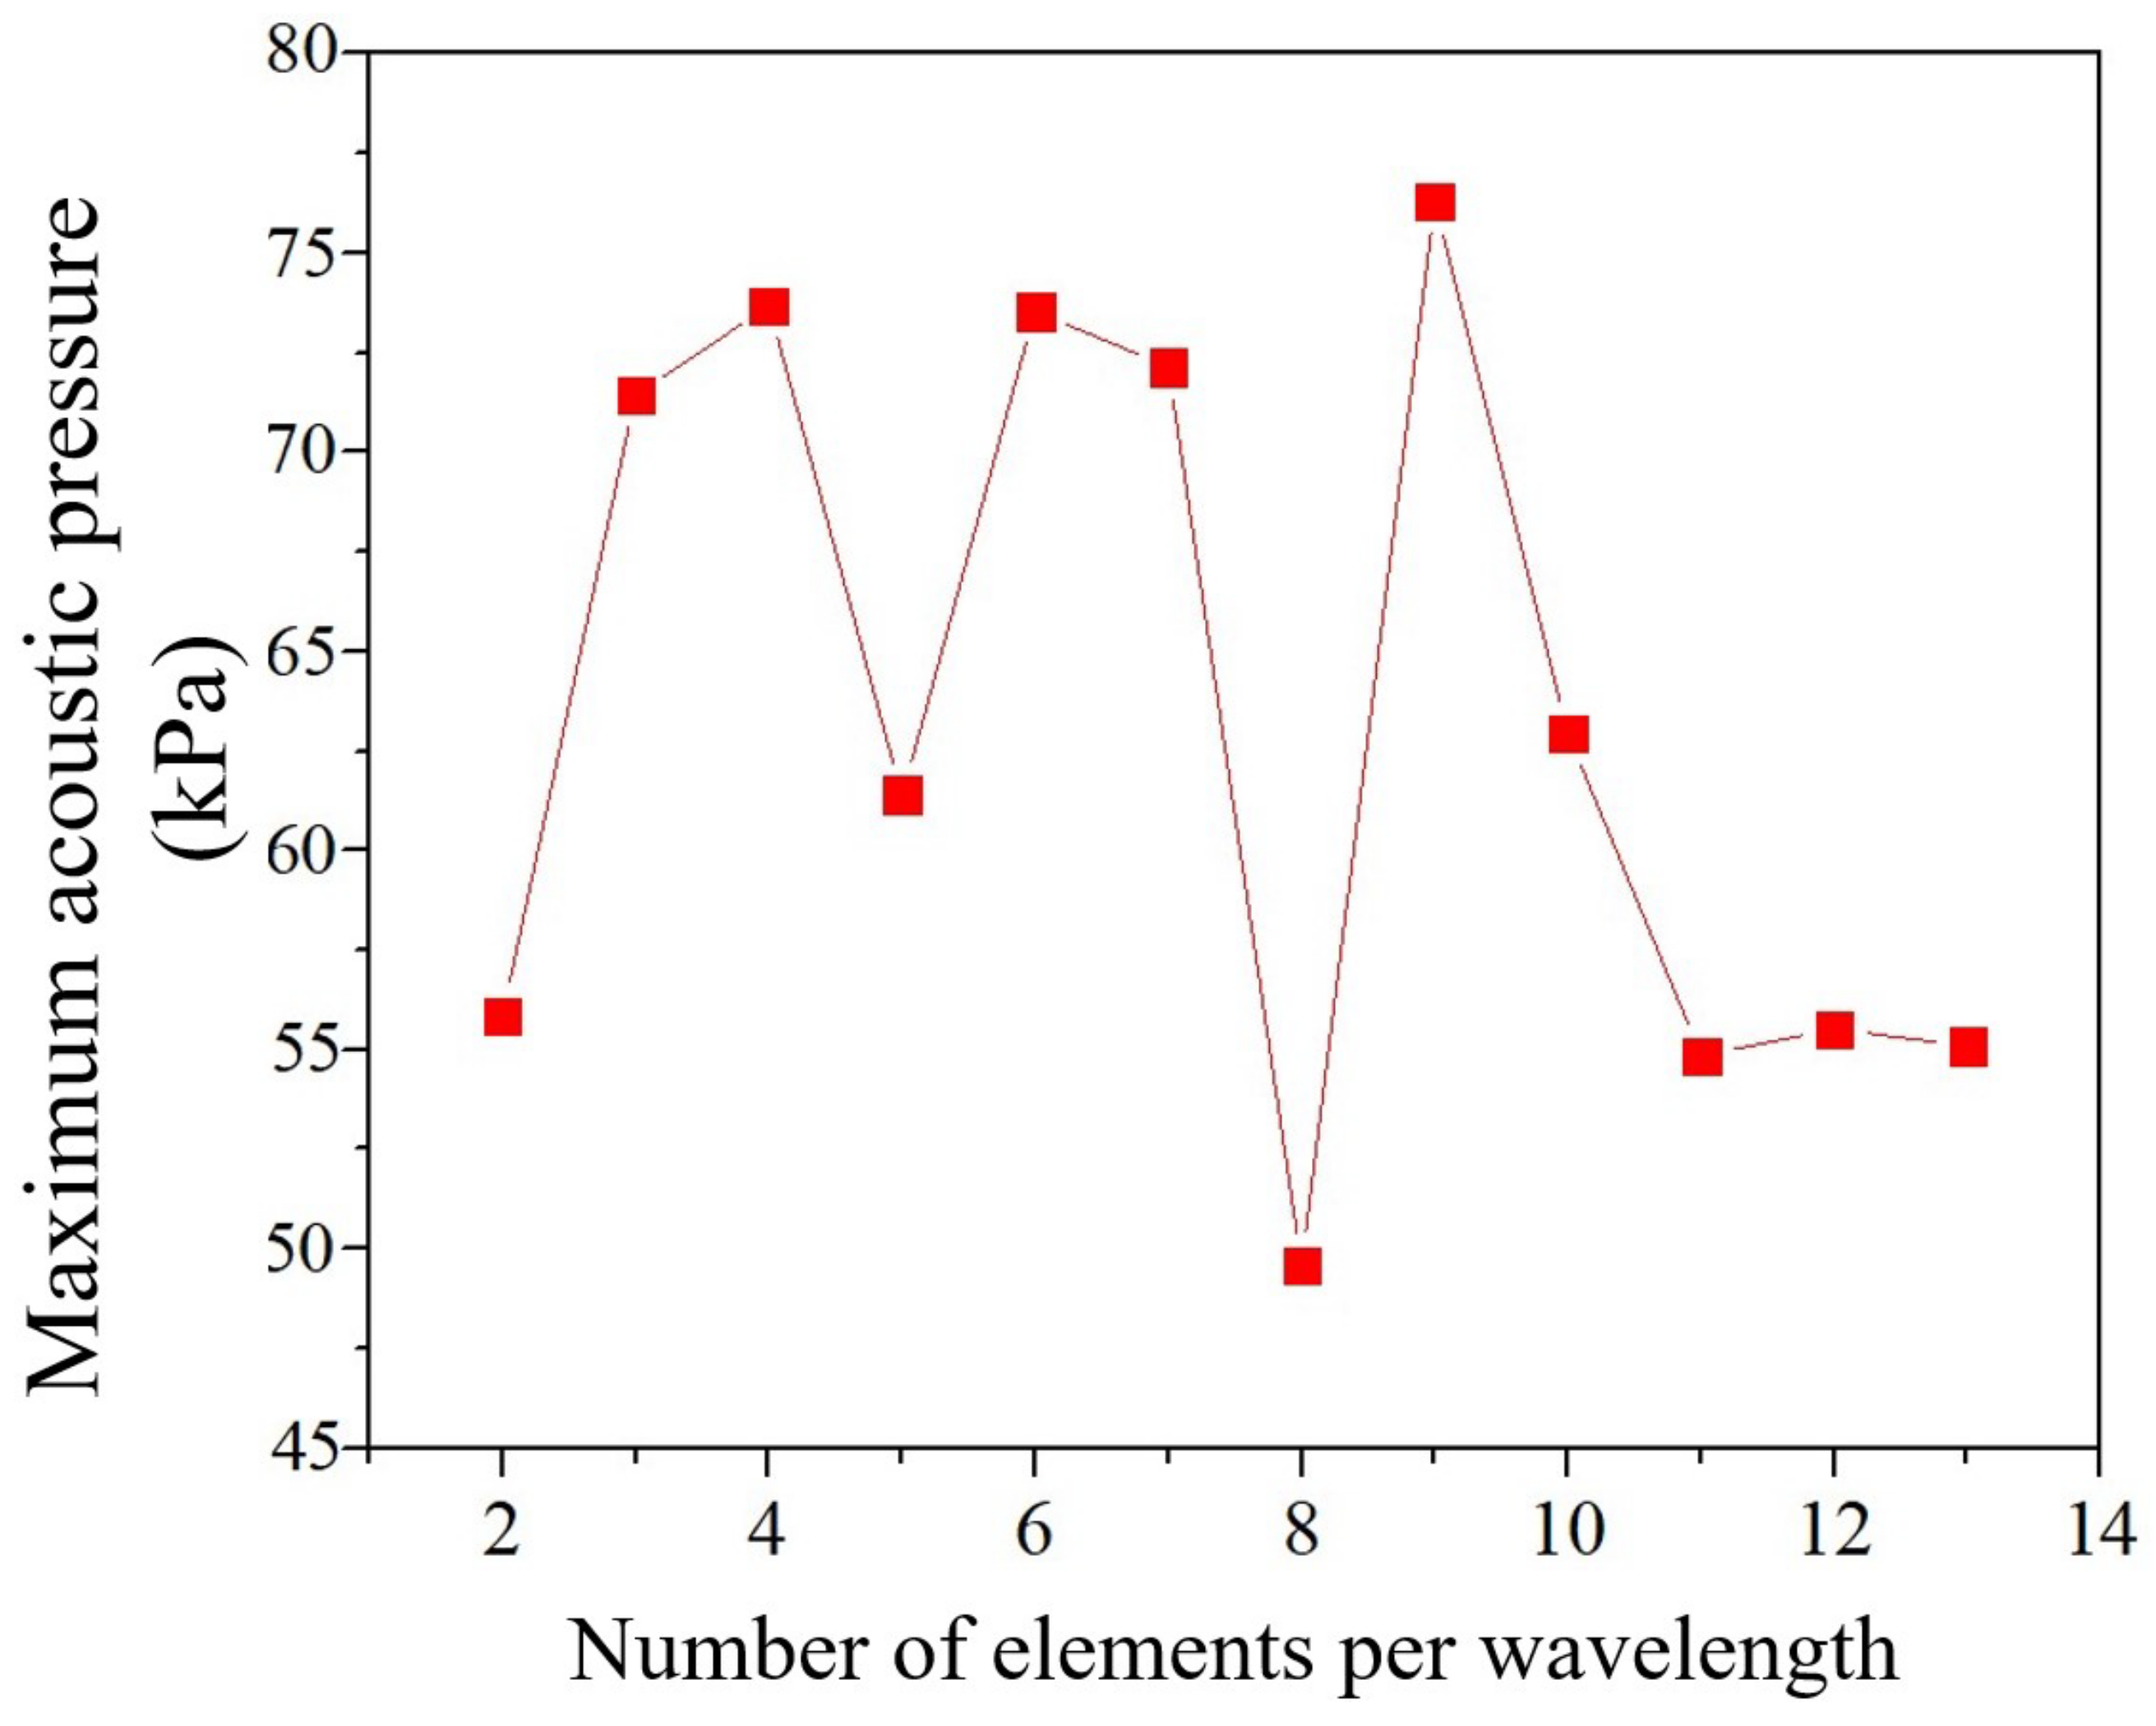
The mentioned design was filled with a solution (water as a cleaning fluid). Then, CAD and mesh models were created, as shown in Figure 6a,b, with rough dimensions, ignoring some irrelevant components for practical use in a computer simulation. In Figure 6a, the solution volume is around 29 L, following the manufacturer’s requirement. In Figure 6b, the optimal mesh model contains 0.78 million nodes and 1.84 million hexahedral elements with a maximum skewness of 0.86. The element size is 4.6 mm, covering 12 elements per wavelength, exceeding the six elements per wavelength criteria suggested by [15,16,23], to obtain accurate acoustic results. A hexahedron (8-node) generally produces a smaller error for the same number of degrees of freedom (DOFs) compared to a tetrahedron (4-node). When element sizes are equal, a computer typically requires about 2–4 times fewer DOFs with a hexahedron to achieve the same accuracy. Figure 7 presents the mesh-independent analysis, which is monitored by the maximum acoustic pressure. The number of elements increased from 0.38 million at 2 to 2.01 million at 13 elements per wavelength. The 12 elements per wavelength were chosen as the optimal mesh model because it is suitable for the available computational resources.
  • Material Property, Boundary Condition, and Analysis Settings
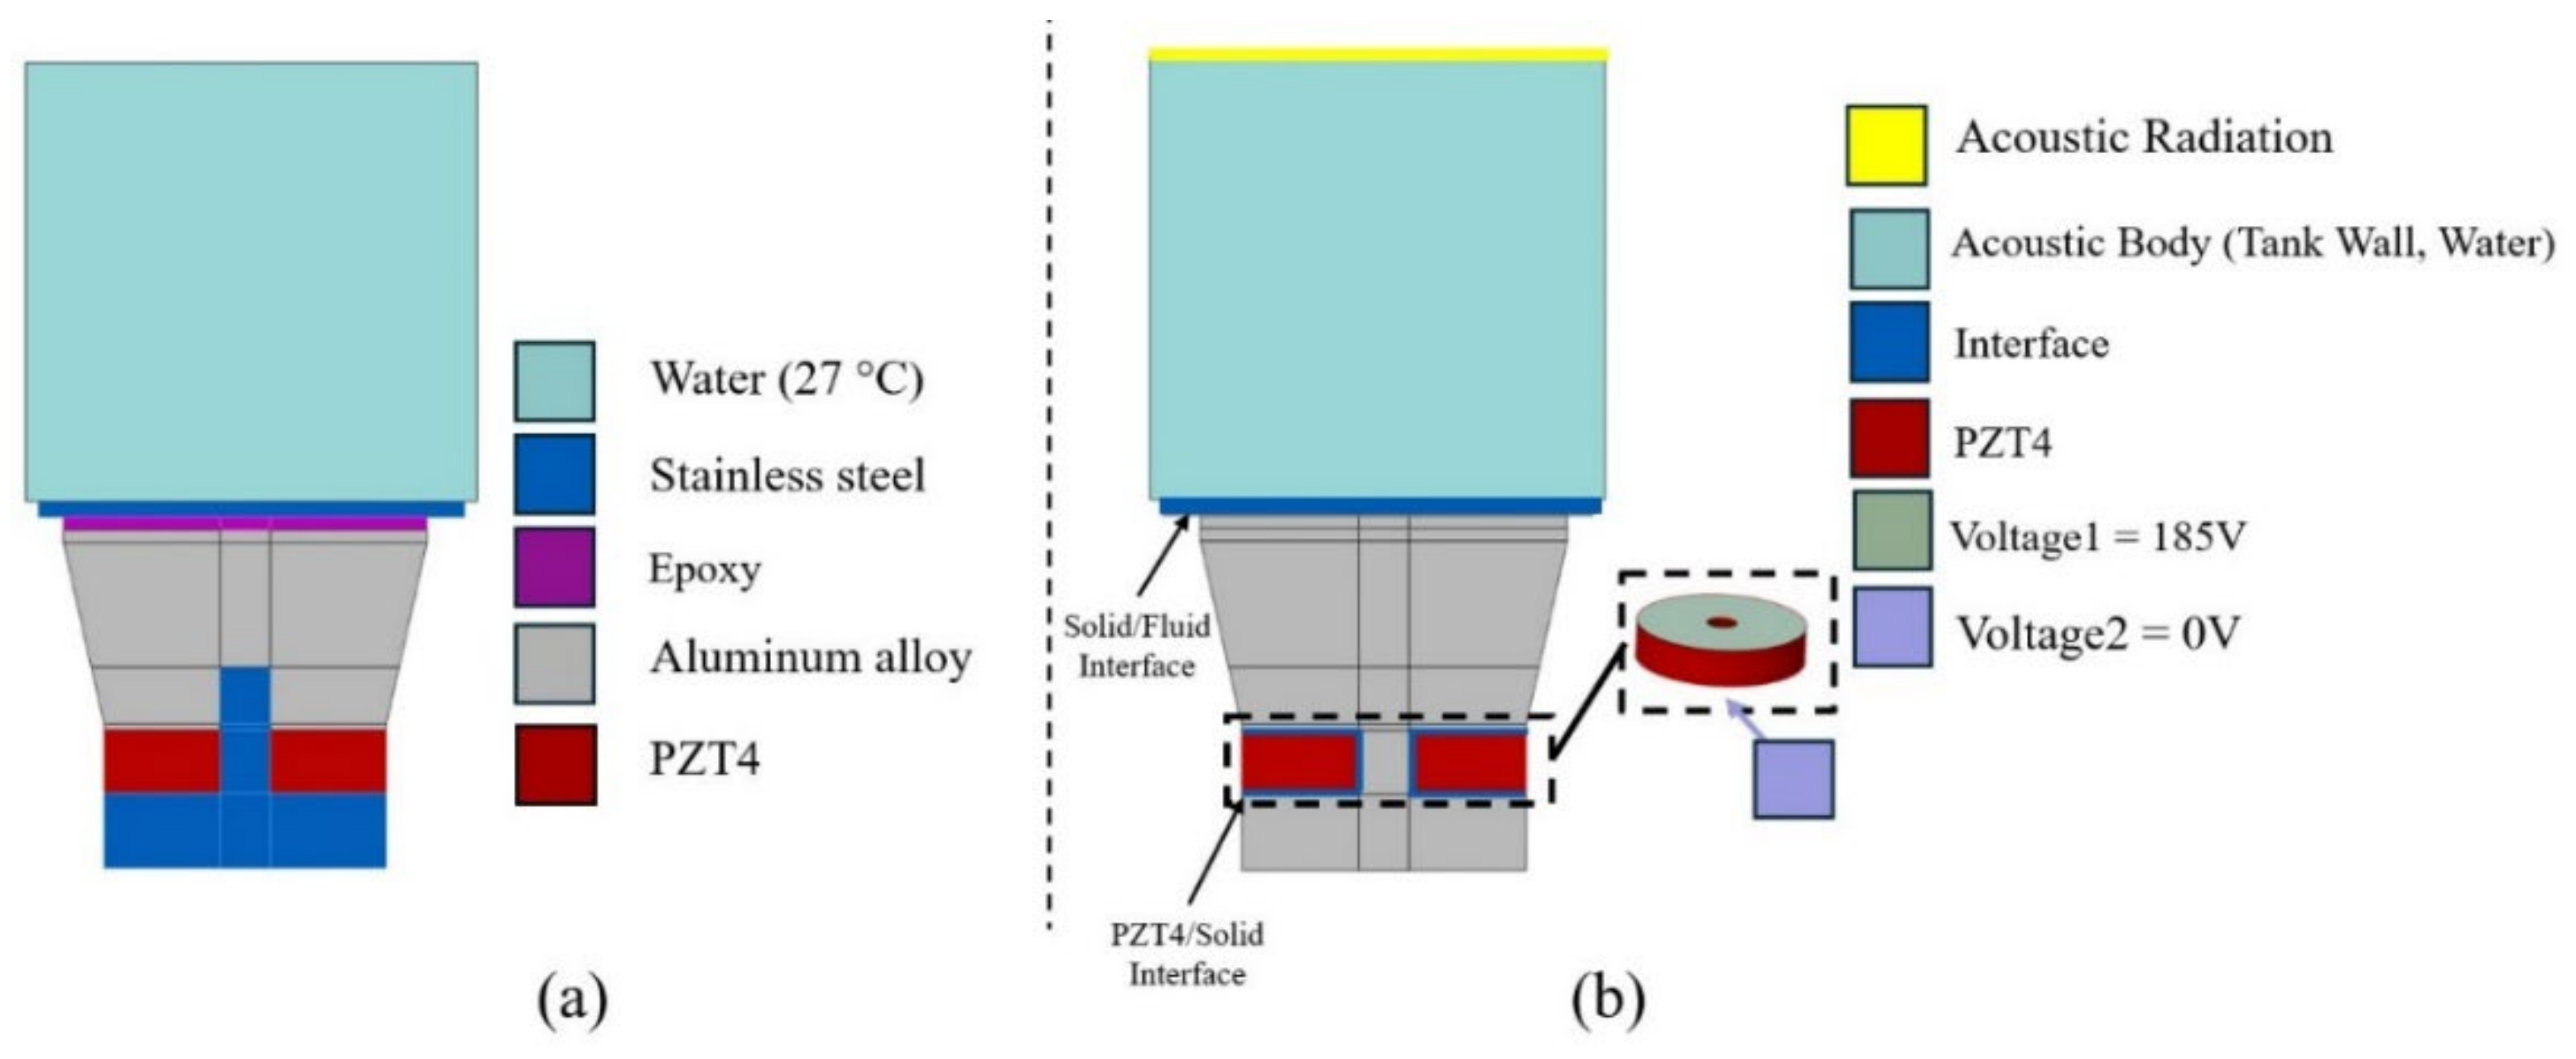
Focusing on the transducer in Figure 6, it can be represented in terms of the material properties and boundary conditions specified in the simulation shown in Figure 8. In Figure 8a, the 28 kHz and 40 kHz have the same material properties. They include PZT4, aluminum alloy, and stainless steel attached to water (solution) at a room temperature of 27 °C. The material properties were assigned as shown in Table 1. In Figure 8b, the upper side of PZT4 was assigned 185 V (Voltage1) for both 28 and 40 kHz, while the bottom side was 0 V (Voltage2). Both voltages were supplied from a generator, as measured in a laboratory. Tank walls and water were assigned to the acoustic body, while interfaces were assigned to meshes between different materials, similar to the settings in [18,20,23]. The upper interface of the tank was assigned to the acoustic radiation boundary since it is adjacent to the air.
Since the TDA is a dual-frequency calculation, its analysis setting requires additional time to produce accurate results, whereas the HRA, being a single-frequency calculation, does not. The TDA setting is explained as follows: the time step size (s) is 1/20f, where f is the transducer frequency (Hz), and the end time (s) is 30/f. It was calculated that f = 40 kHz gives a time step size of 0.9 μs and an end time of 720 μs, the same as when f = 28 kHz. Hence, this setting used an 800-time step size, covering the results between 0 and 720 μs. The shorter time step size and the longer end time can make the simulation results more precise and easier to analyze; however, this requires high-performance computing, which is not always necessary. These settings are similar to those used in successful research employing the HRA and TDA to specifically design the UCT for jewelry [18] and hard disk drive factories [20].

2.3.3. Measurements

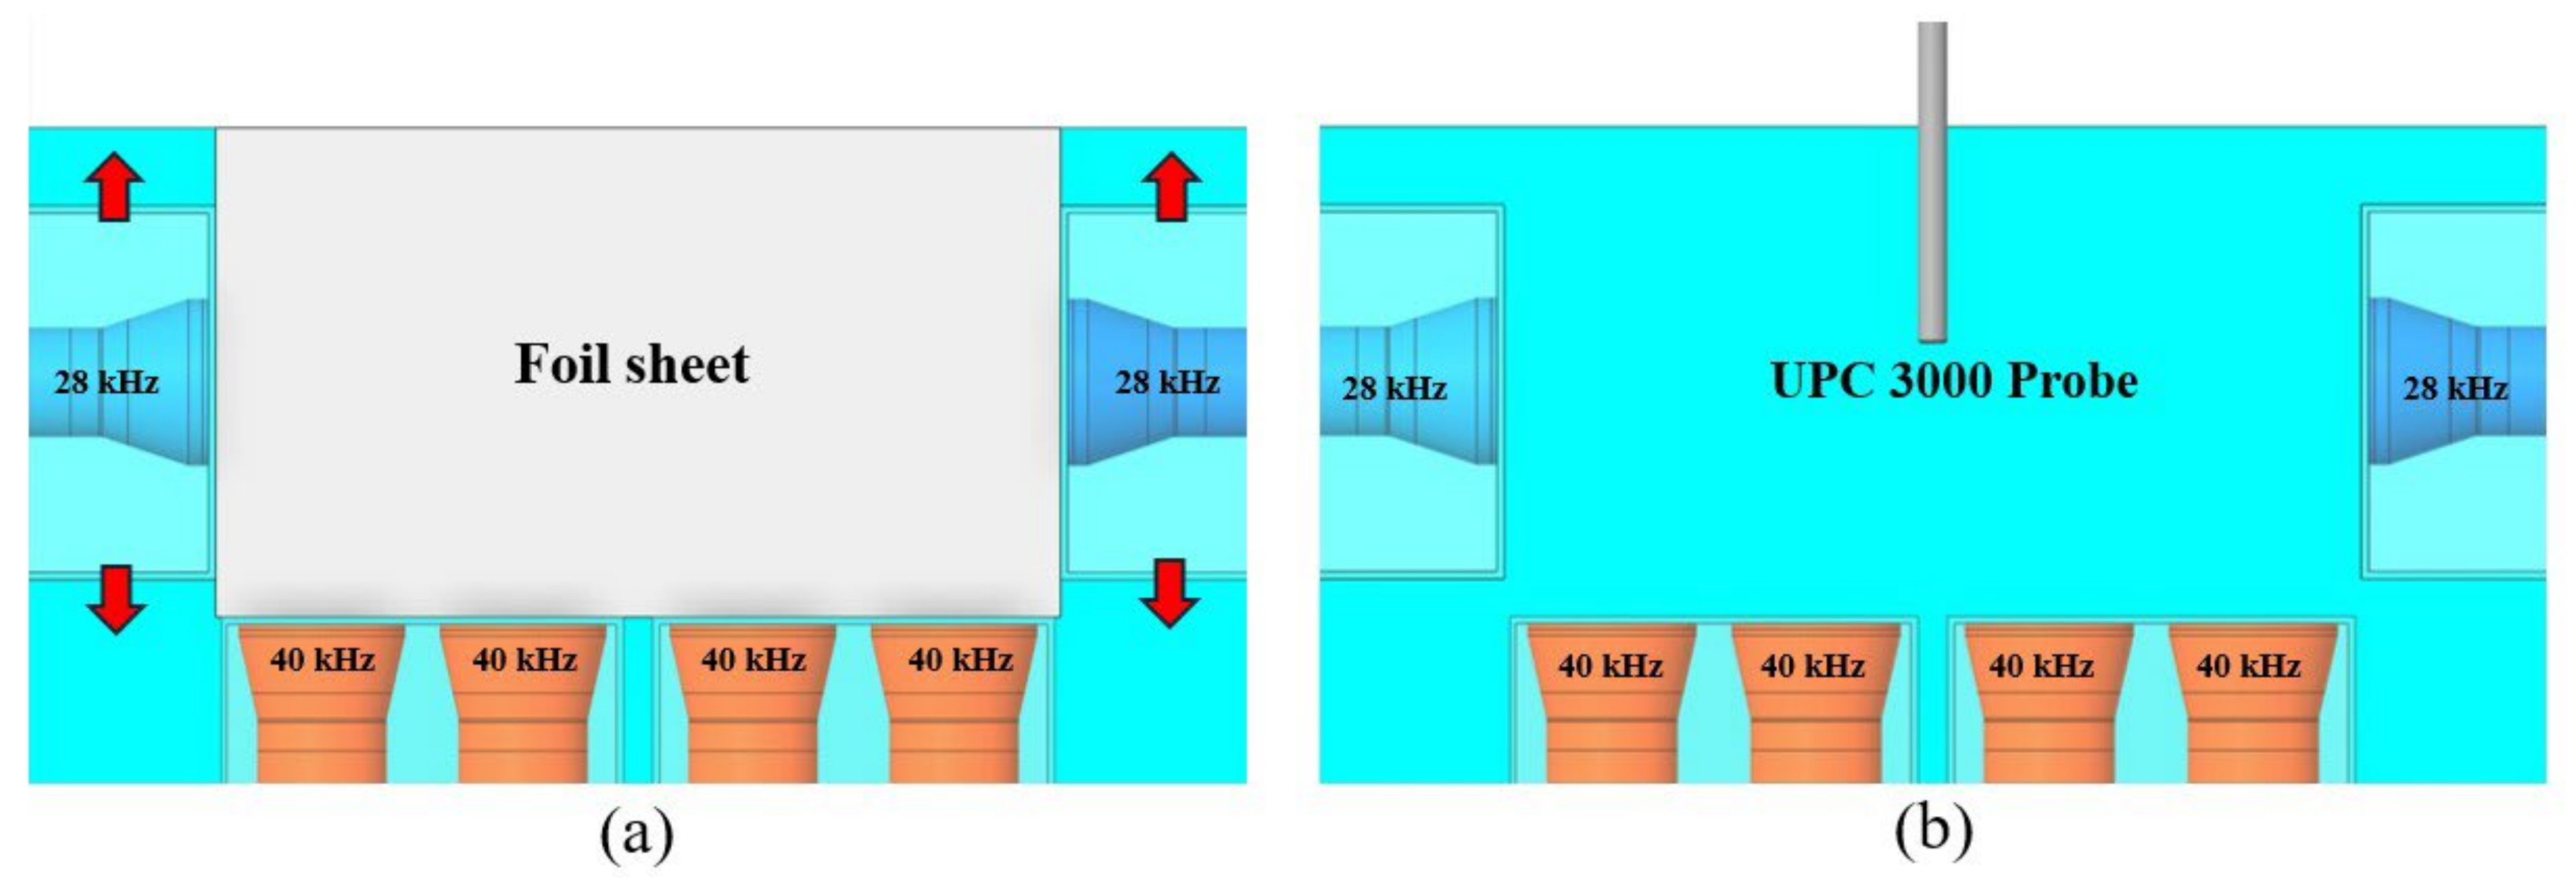
The measurements include foil corrosion and ultrasonic power concentration. Both measurements yielded results used to investigate cavitation intensity and MUCT operation. Figure 9 shows the experimental setup of (a) foil corrosion and (b) power concentration measurements, which can be described as follows:
  • Foil Corrosion Measurement
This measurement evaluated a qualitative analysis of cavitation intensity and uniformity within MUCT. To proceed with the foil corrosion measurement, the rectangular foil sheet, which has an area of 170 × 294 mm2 and is 15 μm thick, was stretched into rectangular frames of the same size. Then, it was vertically submerged into the solution in a central position, with a sonification time of 3 min to corrode, as shown in Figure 9a. The distance between the foil and the transducer boxes was 3 cm to reduce acoustic streaming effects. The acoustic streaming effect refers to the steady fluid motion generated by the nonlinear interaction of sound waves with a medium [25]. When an acoustic wave propagates through a liquid, it transfers momentum to the fluid, causing a flow that may severely damage the foil. After that, the foil corrosion results were compared with the simulation results to investigate the MUCT operation and find a suitable region for cleaning. Initially, the 28 kHz transducers in the side wall were placed at the center of the wall. Then, they were adjusted to positions up and down, 1 cm each time, marked as red arrows in Figure 9a, to investigate the effect of transducer positions on cavitation using single-frequency and dual-frequency modes. This measurement was repeated 5 times per case to find the foil mass loss using a digital scale, AND GR-200, and statistical values.
  • Ultrasonic Power Concentration (UPC) Measurement
UPC 3000 is a device that measures a quantitative analysis of ultrasonic power due to cavitation and is widely used by leading ultrasonic cleaner manufacturers after assembling an ultrasonic cleaning tank for calibration and quality control [15,16,20]. To proceed with the ultrasonic power concentration measurement, UPC 3000, an ultrasonic process controller by NGL cleaning technology [26], measured the ultrasonic power in the center position of MUCT, as shown in Figure 9b. A UPC 3000 probe automatically recorded the average, maximum, and minimum power concentration results in 10 s to represent the cavitation intensity. The higher the power concentration, the greater the cavitation intensity. This measurement was taken at three positions of the 28 kHz transducer: center, up, and down 1 cm from the side wall center, the same as in the foil corrosion test. This measurement was repeated 5 times per case for a statistical analysis.
All measured results in Section 2.3.3 will be reported and discussed in Section 3.1: the MUCT operation with results credibility.
  • Product Cleaning
It is a process of preparing results to assess the MUCT cleaning efficiency, replicating the actual processes in Figure 2: preliminary and ultrasonic cleaning. Figure 10 shows a cleaning diagram of the product. First, 35 parts of the silver necklace were prepared as samples. Each sample had the same shape, as illustrated in the small picture in Figure 1. Second, the samples were divided into 7 groups, with 5 samples in each group. The first group was assigned to the control group, which was cleaned without ultrasonication, and the second through seventh groups were assigned to the experimental group, which was cleaned with ultrasonication. Third, all samples were forwarded to a scanning electron microscope (SEM) for microscopic inspection to examine the surface, and then weighed with a digital scale. The SEM is ZEISS EVO MA10 with 100 nm resolution, and the digital scale is AND GR-200, with 0.0001 g of accuracy. The results were recorded as pre-product results. Fourth, they were polished with dubbing. Fifth, all samples were created with surface images by SEM and weighed on a digital scale again. The results were recorded as polished product results. Sixth, the first group was submerged in the center position of MUCT, the same position as the probe in Figure 9b, with water at 27 °C for 3 min without ultrasonication. The second group was cleaned using a 28 kHz ultrasonic cleaner, and the third group was cleaned using a 48 kHz ultrasonic cleaner, both for 3 min with water at a room temperature of 27 °C. The fourth group was cleaned with 28 kHz and 40 kHz ultrasonication, a dual-frequency mode, using water at 27 °C for 3 min, and the fifth group was cleaned similarly at 60 °C. The sixth and seventh groups were cleaned using a dual-frequency mode with a mixture of 97% water and 3% dishwashing liquid by volume at 27 °C and 60 °C for 3 min. The dishwashing liquid, also known as dish soap or dish detergent, is widely available in the market. Finally, when all samples were dried, they were sent to the SEM and the digital scale again for recording as clean product results.
After the product weighing was completed, the cleaning efficiency was determined by
η = W p o W c l W p o W p r × 100 %
where η is the percentage of cleaning efficiency, and W is the product’s weight. The subscripts po, cl, and pr refer to the polished, clean, and pre-product, respectively.
The results of product cleaning and the MUCT cleaning efficiency will be reported in Section 3.2, the MUCT cleaning efficiency.

3. Results and Discussion

This section includes the MUCT operation at both single and dual frequencies, with simulation and experimental results that demonstrate credibility, the MUCT cleaning efficiency, and its limitations, as well as opportunities for developing the MUCT.

3.1. The MUCT Operation with Results Credibility

3.1.1. Single Frequency

To verify the experimental and simulation results, including testing the MUCT’s ability to operate at a single frequency, Figure 11 shows foil corrosion results and acoustic pressure distribution by the HRA, as explained in Section 2.3.3, for a single frequency of (a) 28 kHz and (b) 40 kHz. Both results are presented as a half model due to the symmetry of the MUCT shape. The small picture shows the plane’s position inside the MUCT for analysis. In (a), the 40 kHz transducers at the bottom MUCT were powered off, presented in black color; hence, ultrasonic cleaning was created by 28 kHz transducers on the side wall as a single frequency. On the other hand, in (b), the 40 kHz transducers were powered on, generating cavitation bubbles in the MUCT, while the 28 kHz transducers were powered off, presented in black color.
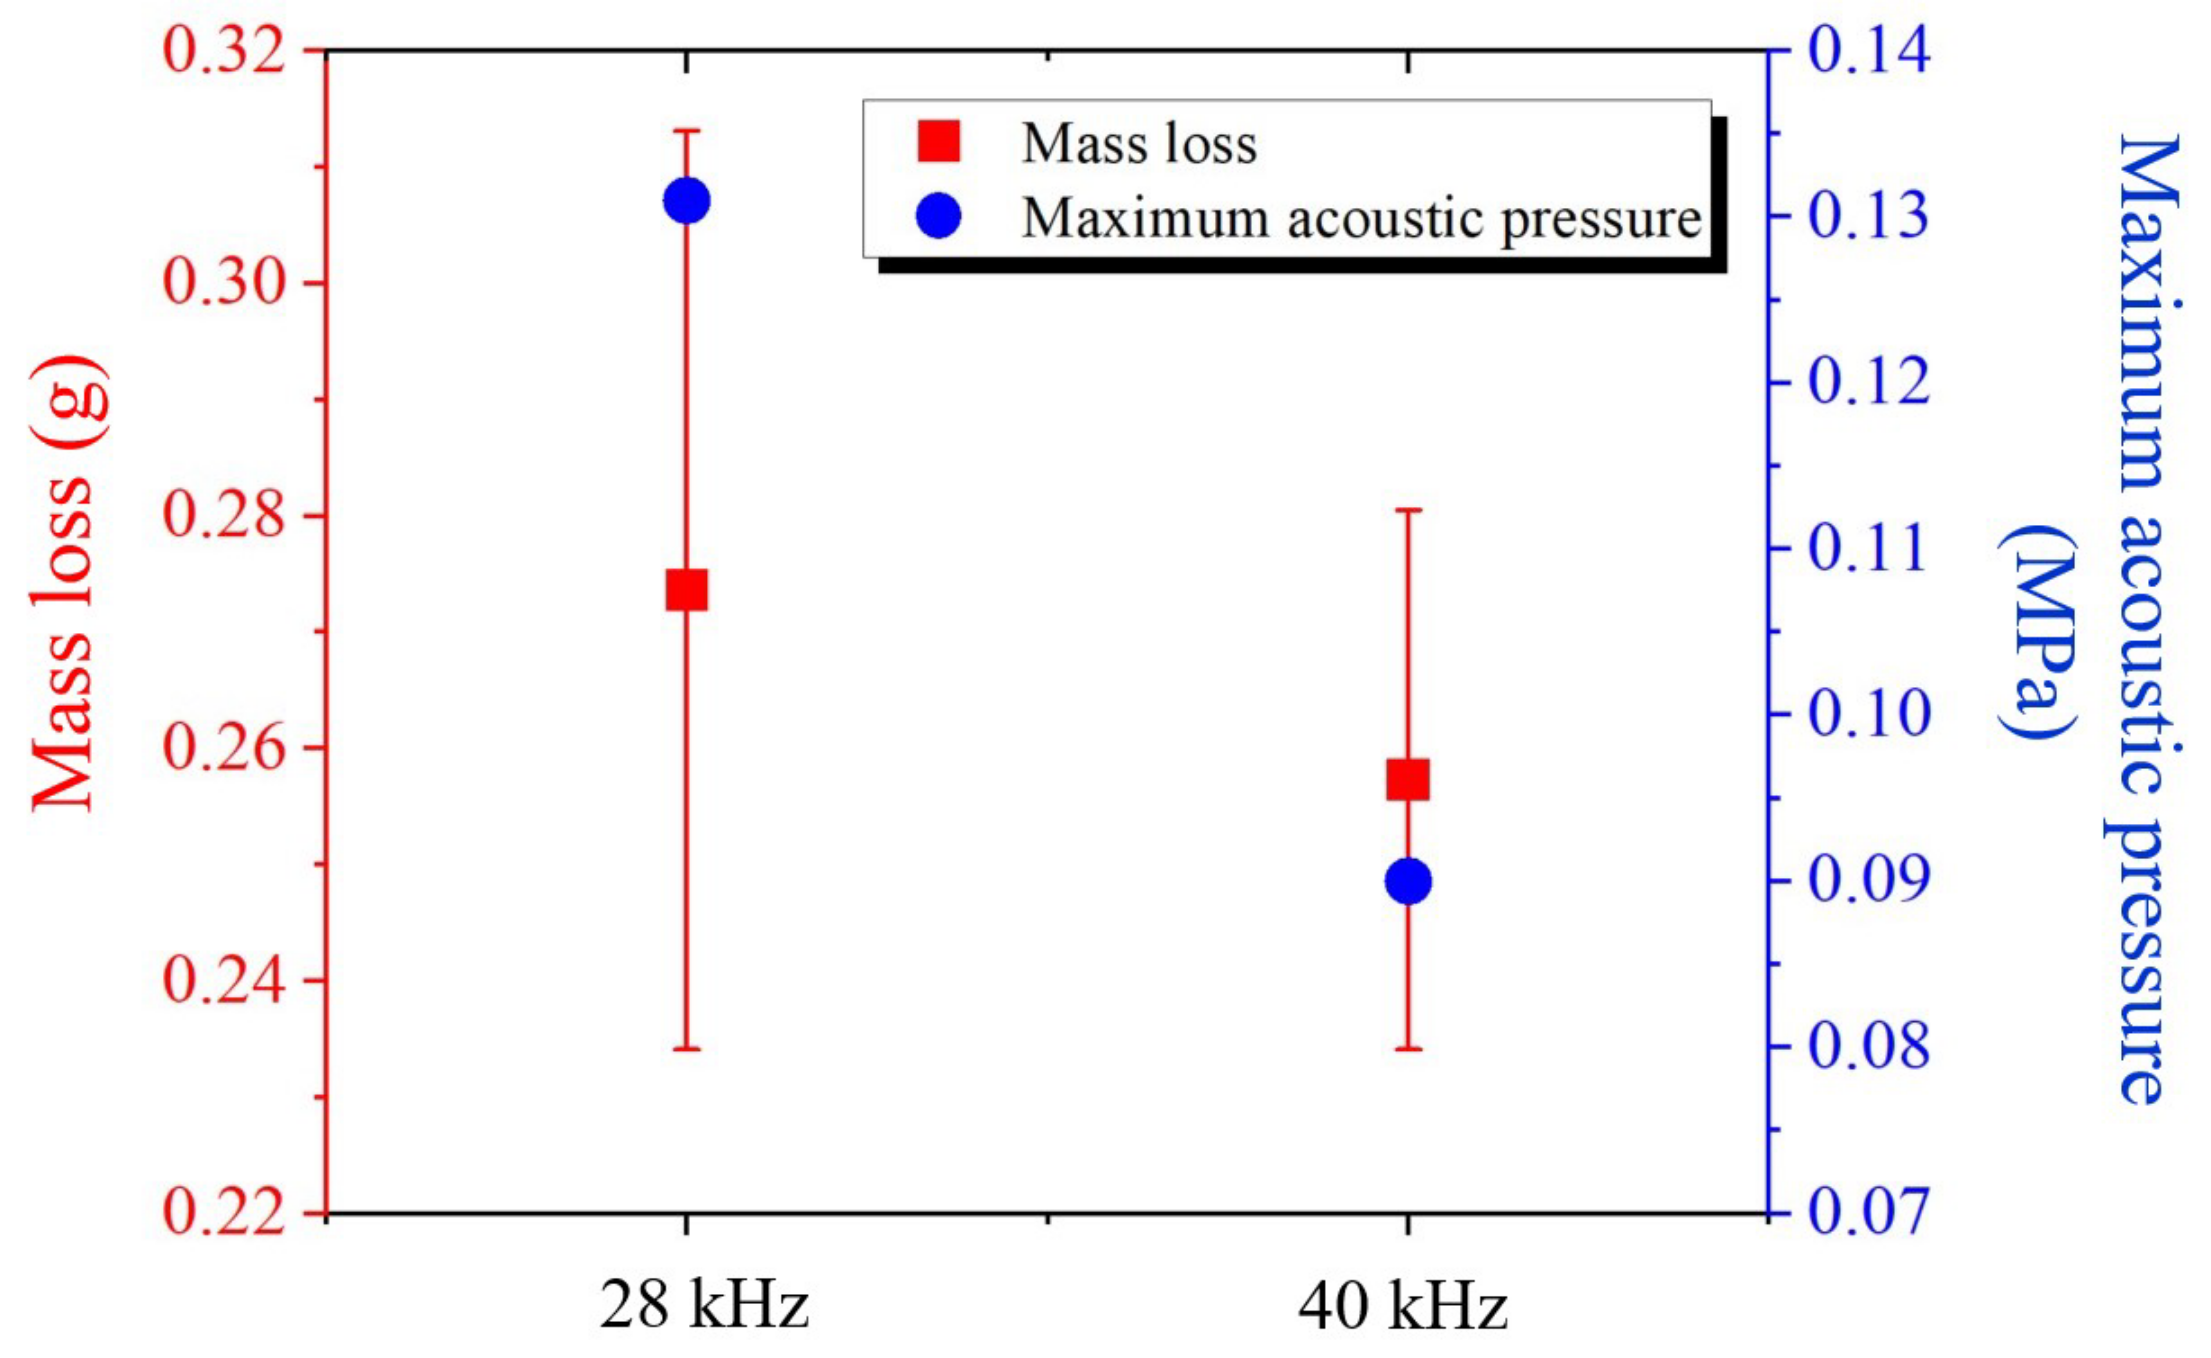
Regarding the credibility of the experimental and simulation results, the corroded pattern was consistent with the acoustic pressure distribution in marked areas, as expected. In addition, both results occurred consistently with the transducer position, in the horizontal direction for 28 kHz and the vertical direction for 40 kHz. The reduced corrosion at 40 kHz is due to the smaller and lower-explosive cavitation bubbles generated at 40 Hz compared to those generated at 28 kHz [6]. Significantly, as expected, the corroded pattern and acoustic pressure distribution of 40 kHz had a narrower area and more numbers than those of 28 kHz, consistent with the results reported in [15]. Figure 12 shows the comparison between the mass loss from foil corrosion and the maximum acoustic pressure resulting from Figure 11. The mass loss results were 0.2736 ± 0.0395 g for 28 kHz and 0.2573 ± 0.0232 g for 40 kHz. The maximum acoustic pressure results were 0.131 MPa and 0.091 MPa, for 28 kHz and 40 kHz, respectively. Both results exhibited a similar trend: decreased with increasing frequency, as expected. The mass loss of 28 kHz had a large error bar because the low frequency creates high-energy cavitation bubbles, which are less stable and do not distribute uniformly, unlike high-frequency bubbles. As a result, maintaining consistent cleaning efficiency at 28 kHz ultrasonic cleaning is difficult to replicate. The results are, therefore, credible since the experimental and simulation results are consistent and agree with the previous results.
Regarding the MUCT’s ability to operate at a single frequency and a suitable cleaning region, the highest acoustic pressure and the largest corroded region were significantly near the transducers, suggesting that the region near the transducers may be unsuitable for cleaning due to the severe cavitation, which could cause product damage. The acoustic pressure was distributed throughout the MUCT as intended in the design. The proper position for cleaning is the central region of the MUCT, which is in line with the transducers and not too close or too far from them, as the corroded pattern was not too large and the acoustic pressure was not too high. The wider the corroded pattern area, the greater the acoustic pressure, which should be checked and controlled in the operating condition to suit the product type, thereby avoiding damage from cleaning. All results confirm that the MUCT was effectively operated at a single frequency, and the central region of the MUCT is suitable for cleaning, as confirmed by foil corrosion and simulation results.

3.1.2. Dual Frequency

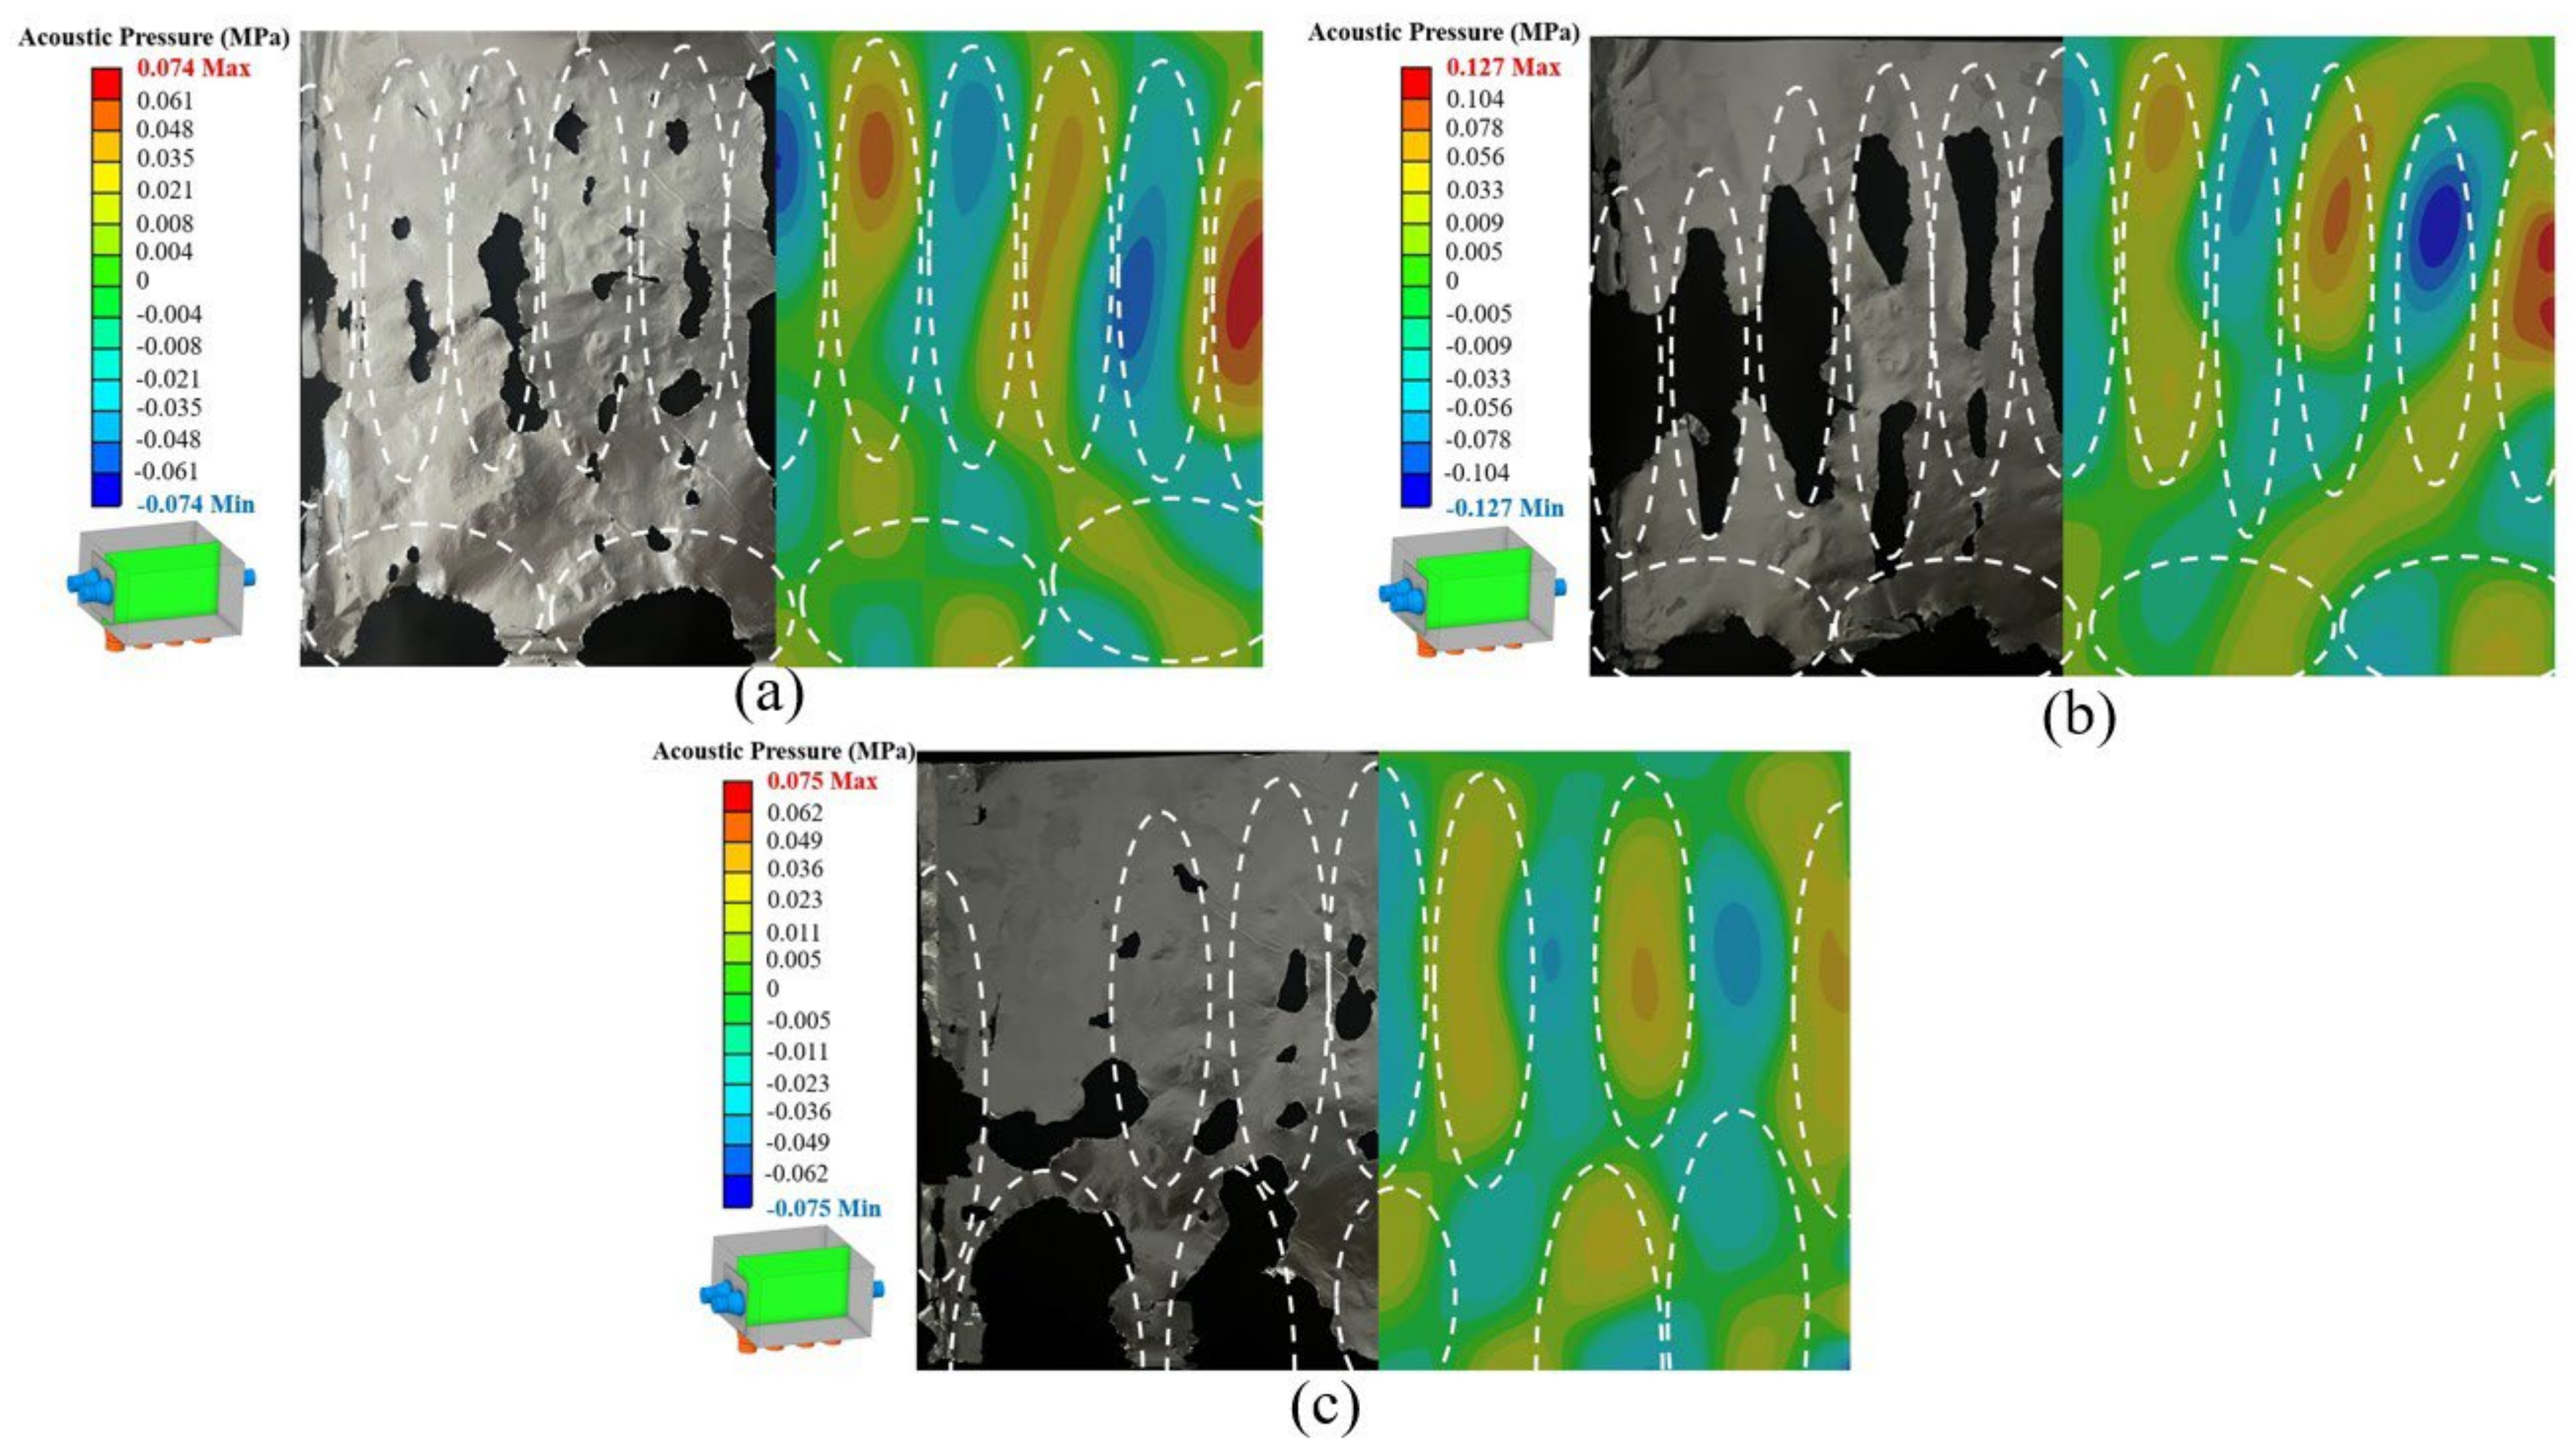
To test the MUCT’s ability to operate at a dual frequency with an adjustable transducer position capability, Figure 13 shows the acoustic pressure distribution and corroded pattern inside the MUCT, with 28 kHz on the side and 40 kHz on the bottom, as shown in Figure 9a, for adjusting transducer 28 kHz on the side wall (a) up 1 cm, (b) center, and (c) down 1 cm.
Regarding the MUCT’s ability to operate at a dual frequency, similar to Figure 11, the region near the transducers exhibited a high cavitation intensity due to wider corroded areas and high acoustic pressure. In contrast, as expected, the faraway region had a low cavitation intensity due to narrow, corroded areas and slight acoustic pressure. The 28 kHz transducers generated ultrasonic waves from the side, while the 40 kHz transducers generated waves from the bottom to create the corroded pattern and acoustic pressure distribution resulting from the dual-frequency waves, as intentionally designed. When the acoustic pressures in Figure 13 are compared with those in Figure 11, it is evident that the dual frequency generated by both results—the corroded pattern and acoustic pressure distribution—differ from the single frequency mode, as expected. This may be explained by wave interference theory [27], which states that the resultant wave from two wave sources (y) with different frequencies is y = 2 A cos 2 π f 1 f 2 2 t cos 2 π f 1 + f 2 2 t , where f1 = 40 kHz and f2 = 28 kHz. This equation may indicate that the frequency of the MUCT operated at dual-frequency mode is an average of f1 and f2, clearly different from a single frequency, not f1 or f2. In a deep analysis, the acoustic pressure shown in Figure 13 was recorded in the time domain. It was converted to the frequency domain and then transformed to a normalized power spectrum using the Fast Fourier Transform (FFT) in MATLAB software, the same method used to verify the frequency of the resultant wave proposed by Tangsopa and Thongsri [20]. It was found that the acoustic pressure shown in Figure 13, calculated using the TDA, represented a resultant wave between 28 and 40 kHz, as anticipated. The resultant wave creates cavitation for ultrasonic cleaning. However, since the MUCT has eight transducers, the resulting wave is a sum of the overall, which is more complex than the mentioned y equation and cannot be expressed using analytical results. Fortunately, the foil corrosion and simulation results provide alternative ways to present the resultant wave of eight transducers with dual frequency, as shown in Figure 13. Both results confirm their consistency and credibility, suggesting that the MUCT can operate effectively at dual frequencies.
Regarding the ability to adjust the transducer position, the acoustic pressure increased from (a) to (b) and then reduced in (c) as the foil sheet vertically moved closer to the transducers, from up to down. In position (b), transducers were placed on the side wall center, while in (a), they were 1 cm up, and in (c), they were 1 cm down from the center. As seen in Figure 13, changing the transducer position caused the acoustic pressure to change; therefore, the MUCT can adjust the transducer position, which can be tailored to accommodate the cleaning of various product types rather than just specific ones. This ability overcomes the disadvantages of traditional UCT, which has a fixed transducer position and limited applications [15,18,20].
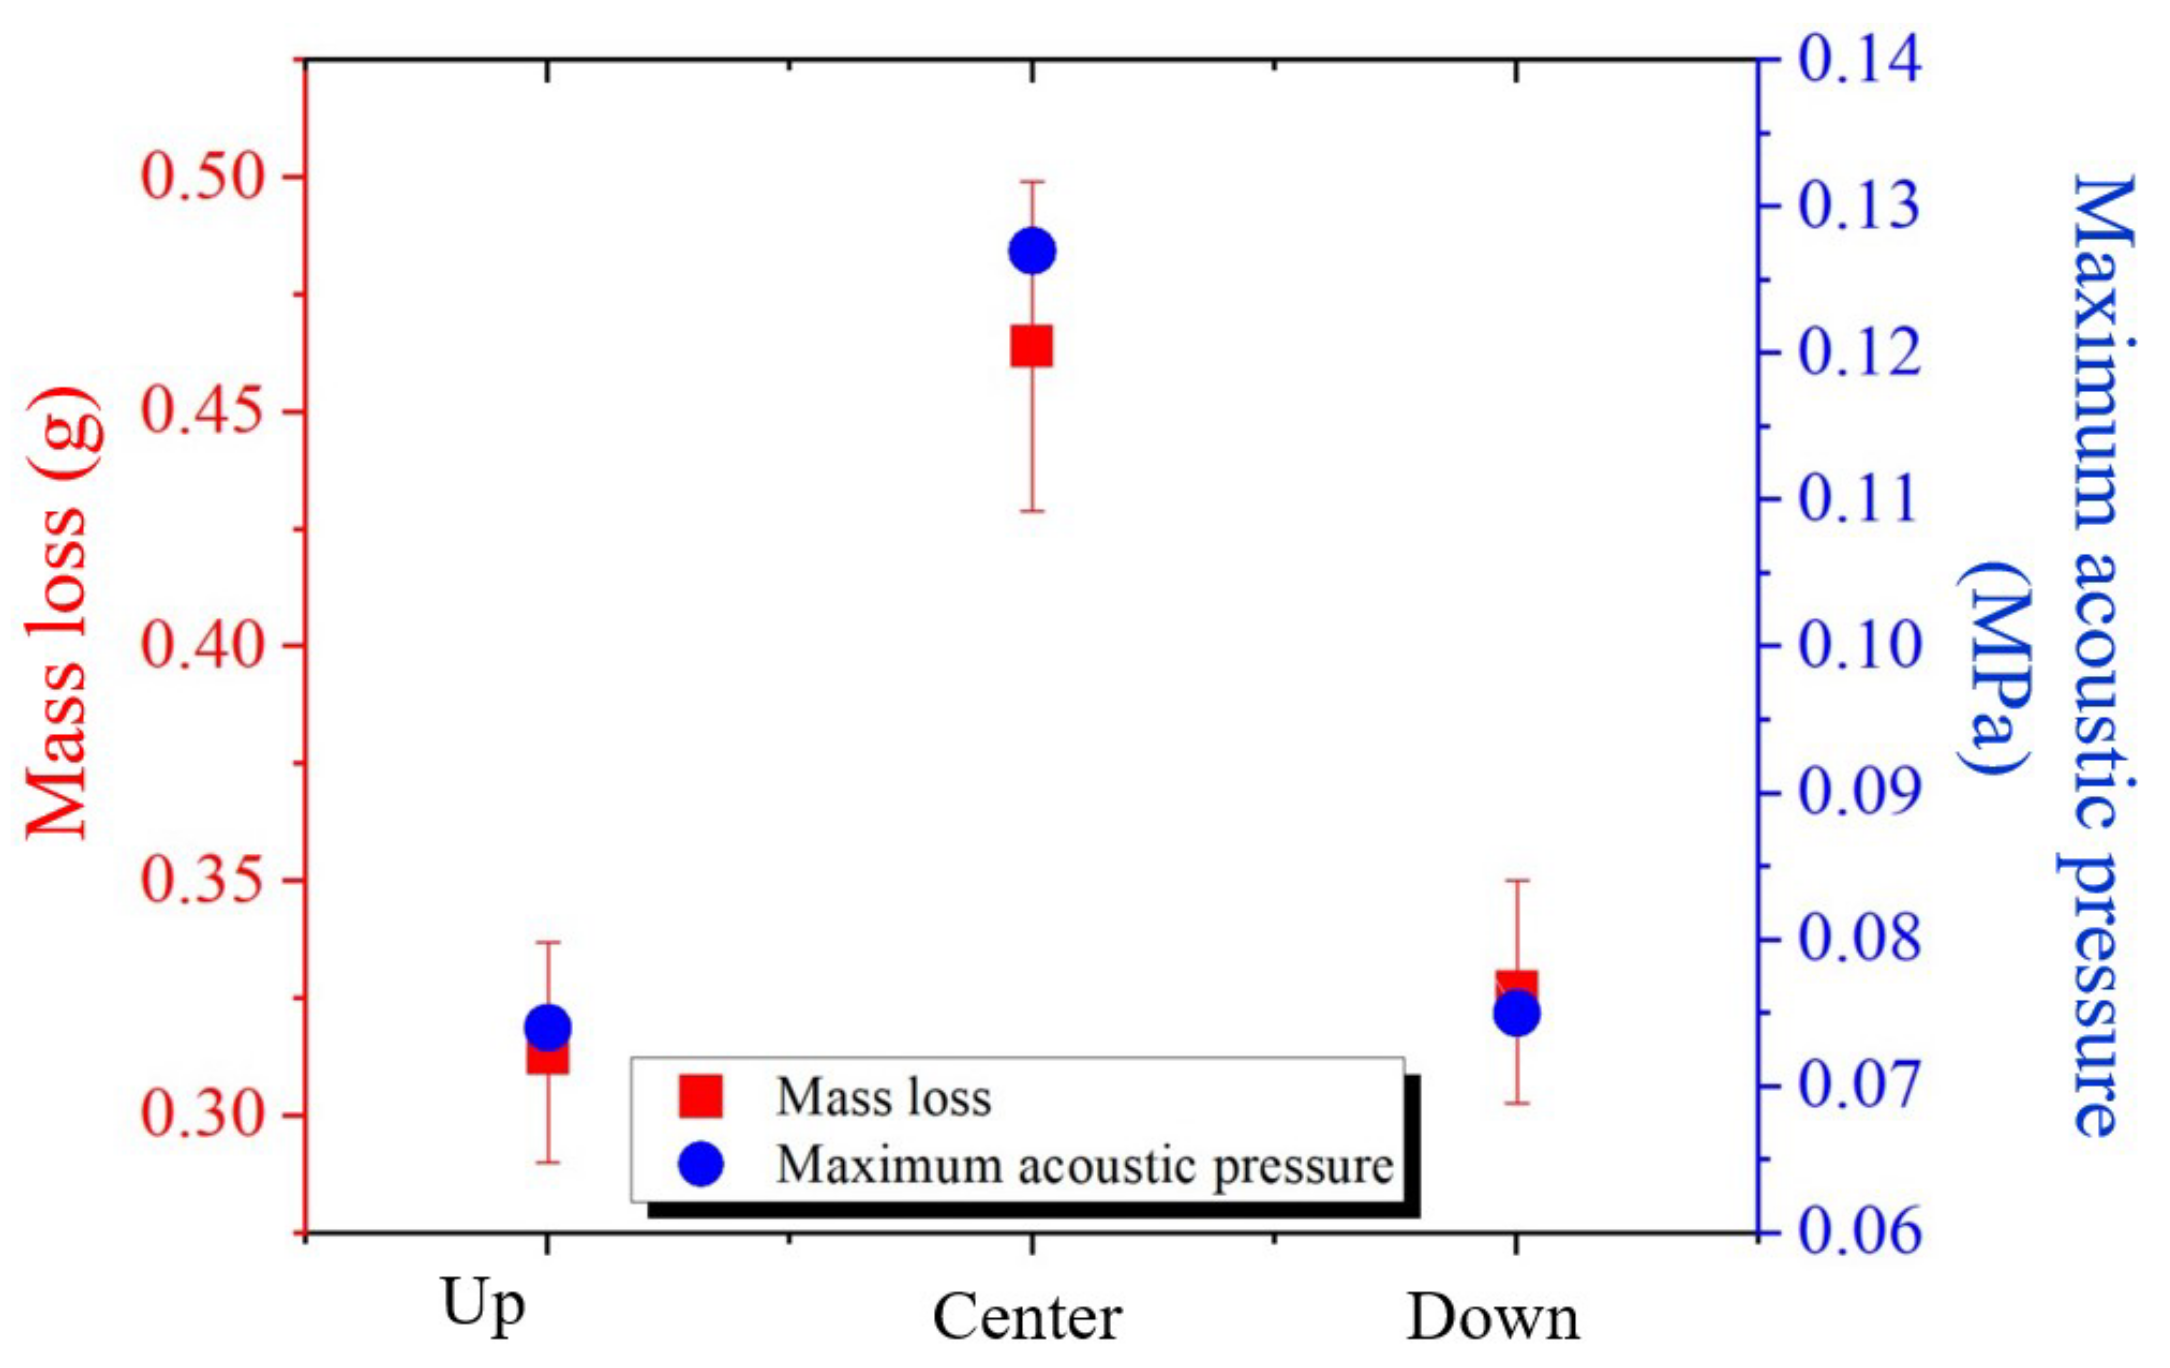
In a quantitative analysis, Figure 14 presents a comparison between the mass loss due to foil corrosion and the maximum acoustic pressure, as shown in Figure 13. The mass loss results were 0.3134 ± 0.0235 g, 0.4639 ± 0.0351 g, and 0.3264 ± 0.0237 g, for transducers moved up, at the center, and down, respectively. Meanwhile, the maximum acoustic pressure results were 0.074 MPa, 0.127 MPa, and 0.075 MPa for the transducers placed up, at the center, and down, respectively. As expected, both results showed a similar trend: the highest mass loss and the greatest maximum acoustic pressure were at the center of the MUCT. All mass loss results produced narrow error bars because a dual-frequency mode may generate cavitation bubbles that are more stable and distribute evenly, unlike single-frequency bubbles.

3.2. The MUCT Cleaning Efficiency

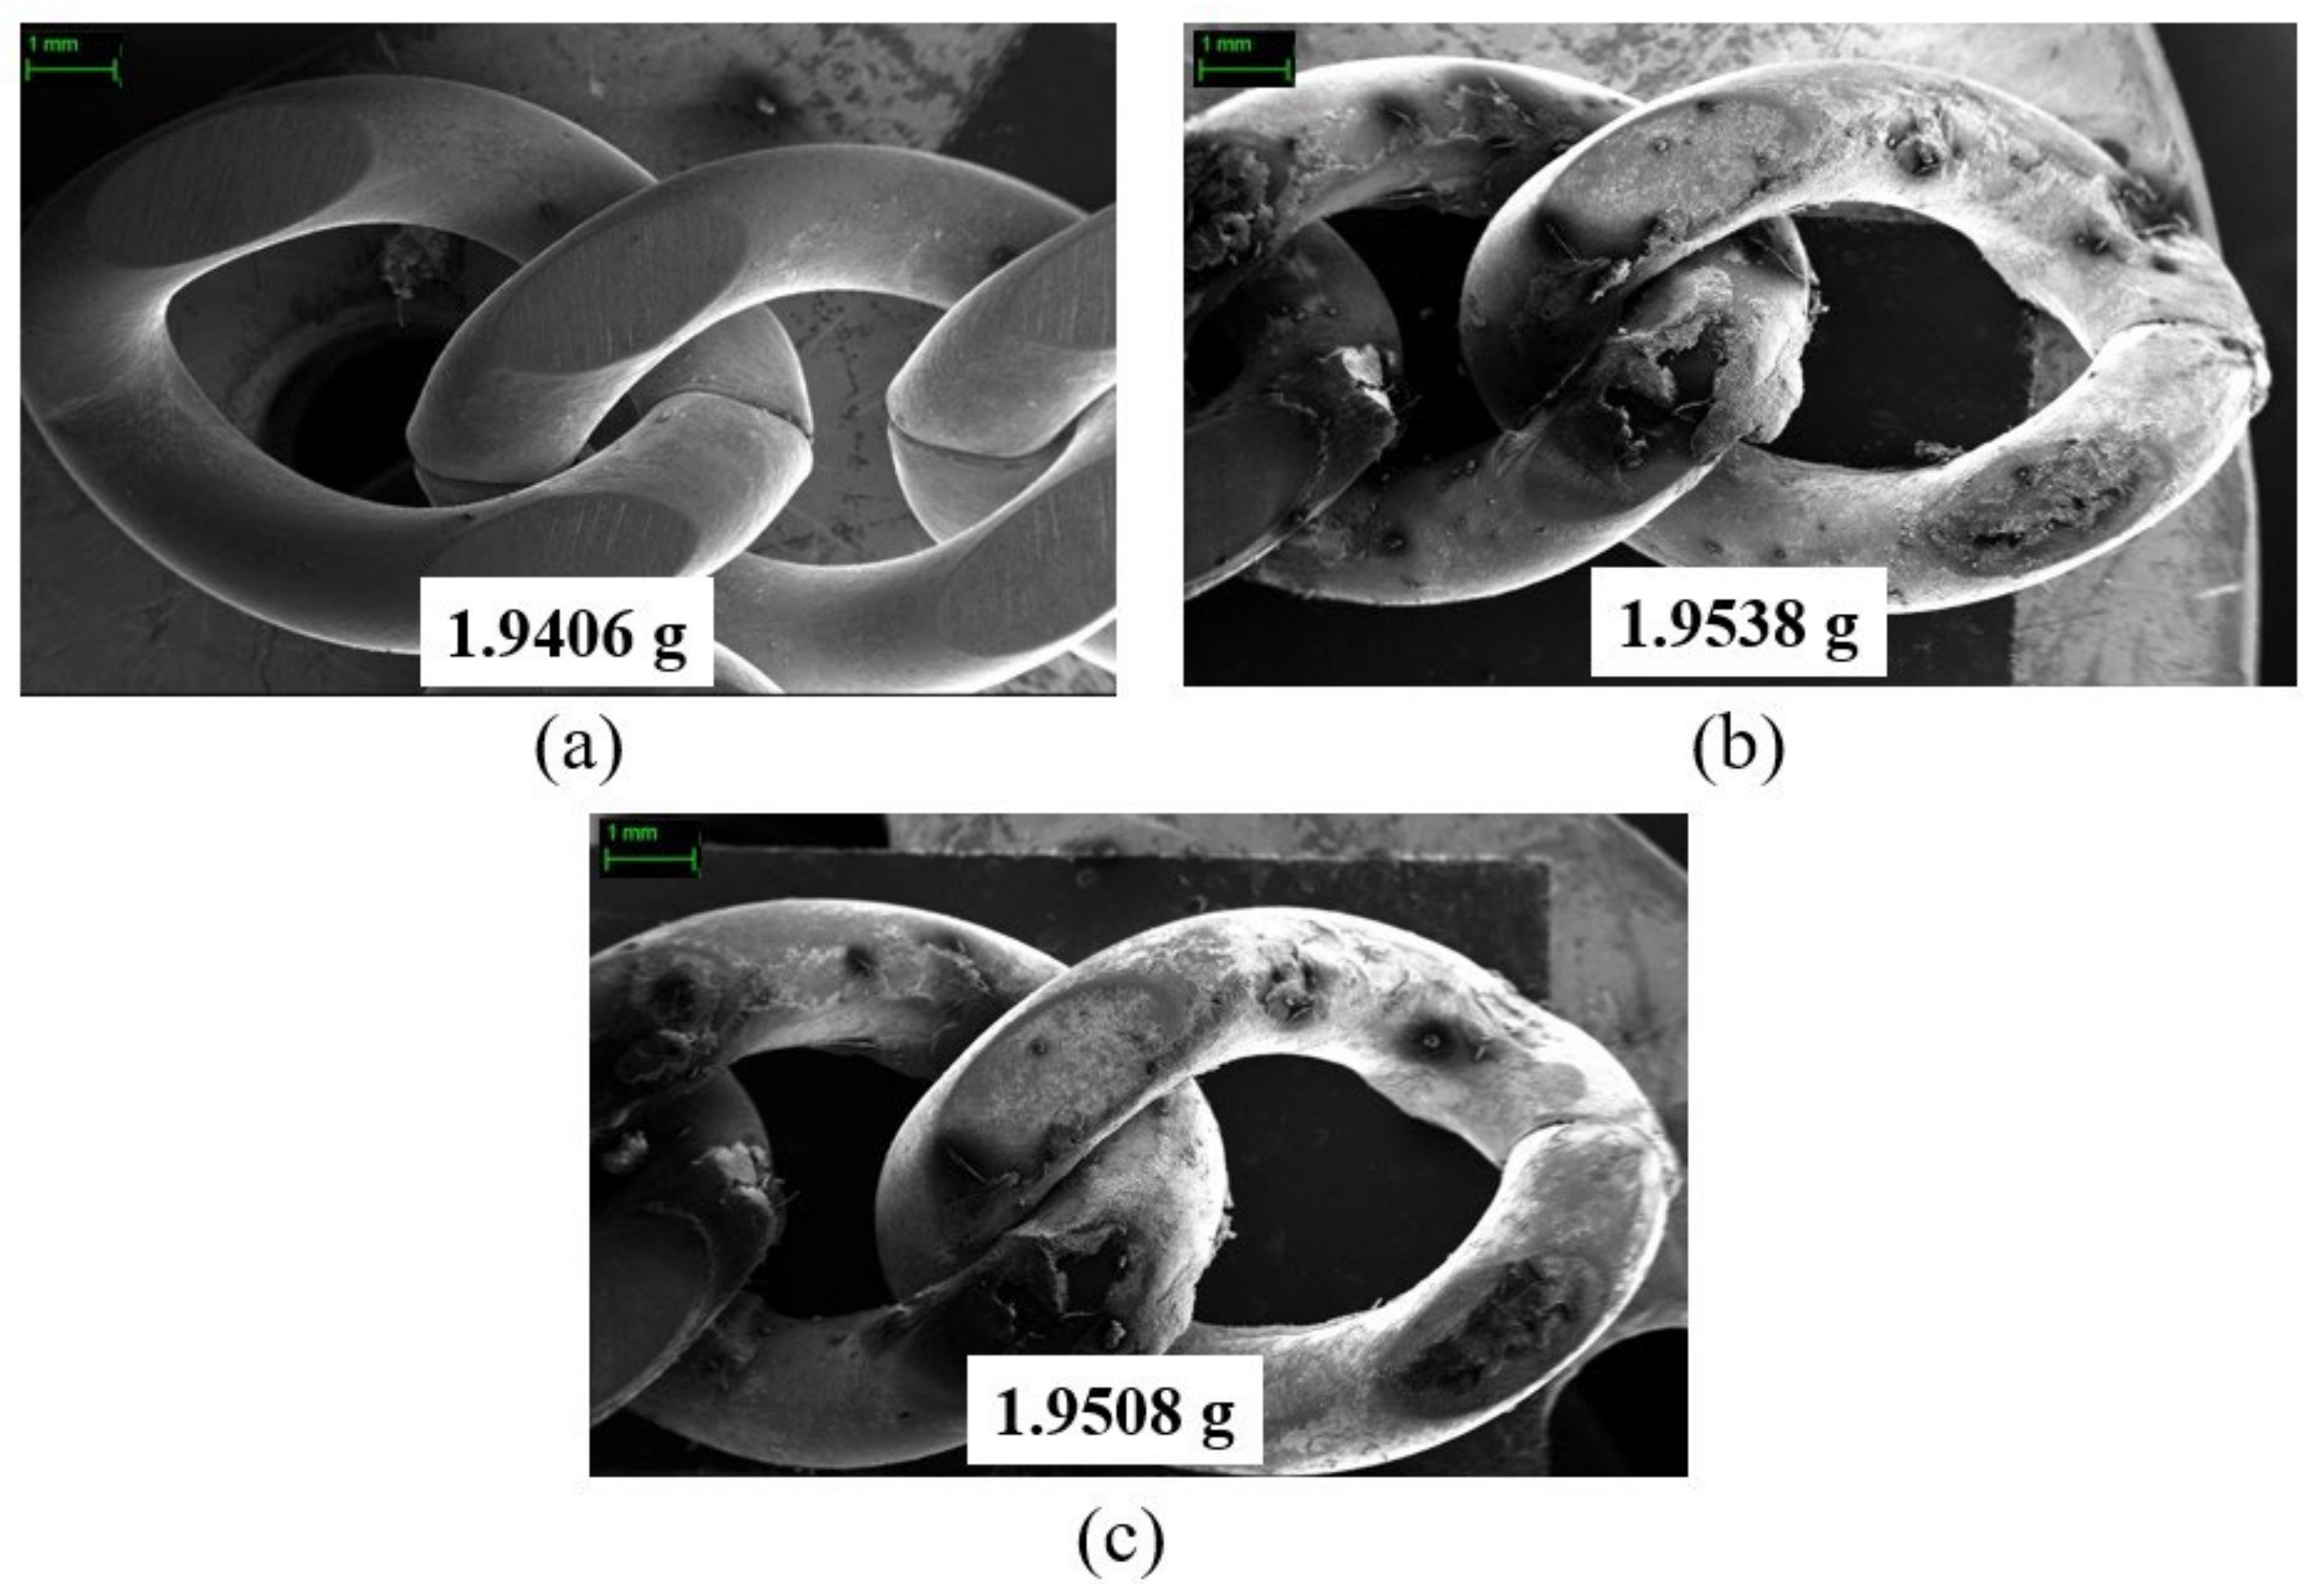
Figure 15 reports the SEM images of the control group, as explained in Figure 10, cleaning the product with water using the MUCT without ultrasonication at a room temperature of 27 °C for the (a) pre-product, (b) polished product, and (c) clean product. A small bar on the top left displays a length of 1 mm, as seen under the SEM. As shown in Figure 15a, the product was clean and dirt-free, as it had just been released from an automated jewelry machine. The product weight was 1.9406 g. After polishing the product with dubbing, the dubbing was attached to the product surface, as shown in Figure 15b, resulting in 1.9538 g of the product’s weight. When the polished product was immersed in the MUCT, which was filled with water for 3 min, without ultrasonic cleaning, the result was Figure 15c, 1.9508 g. The SEM images in Figure 15b,c appear to be indistinguishable. As expected, much dubbing remained on the product’s surface; therefore, water without ultrasonic cleaning could not remove it.
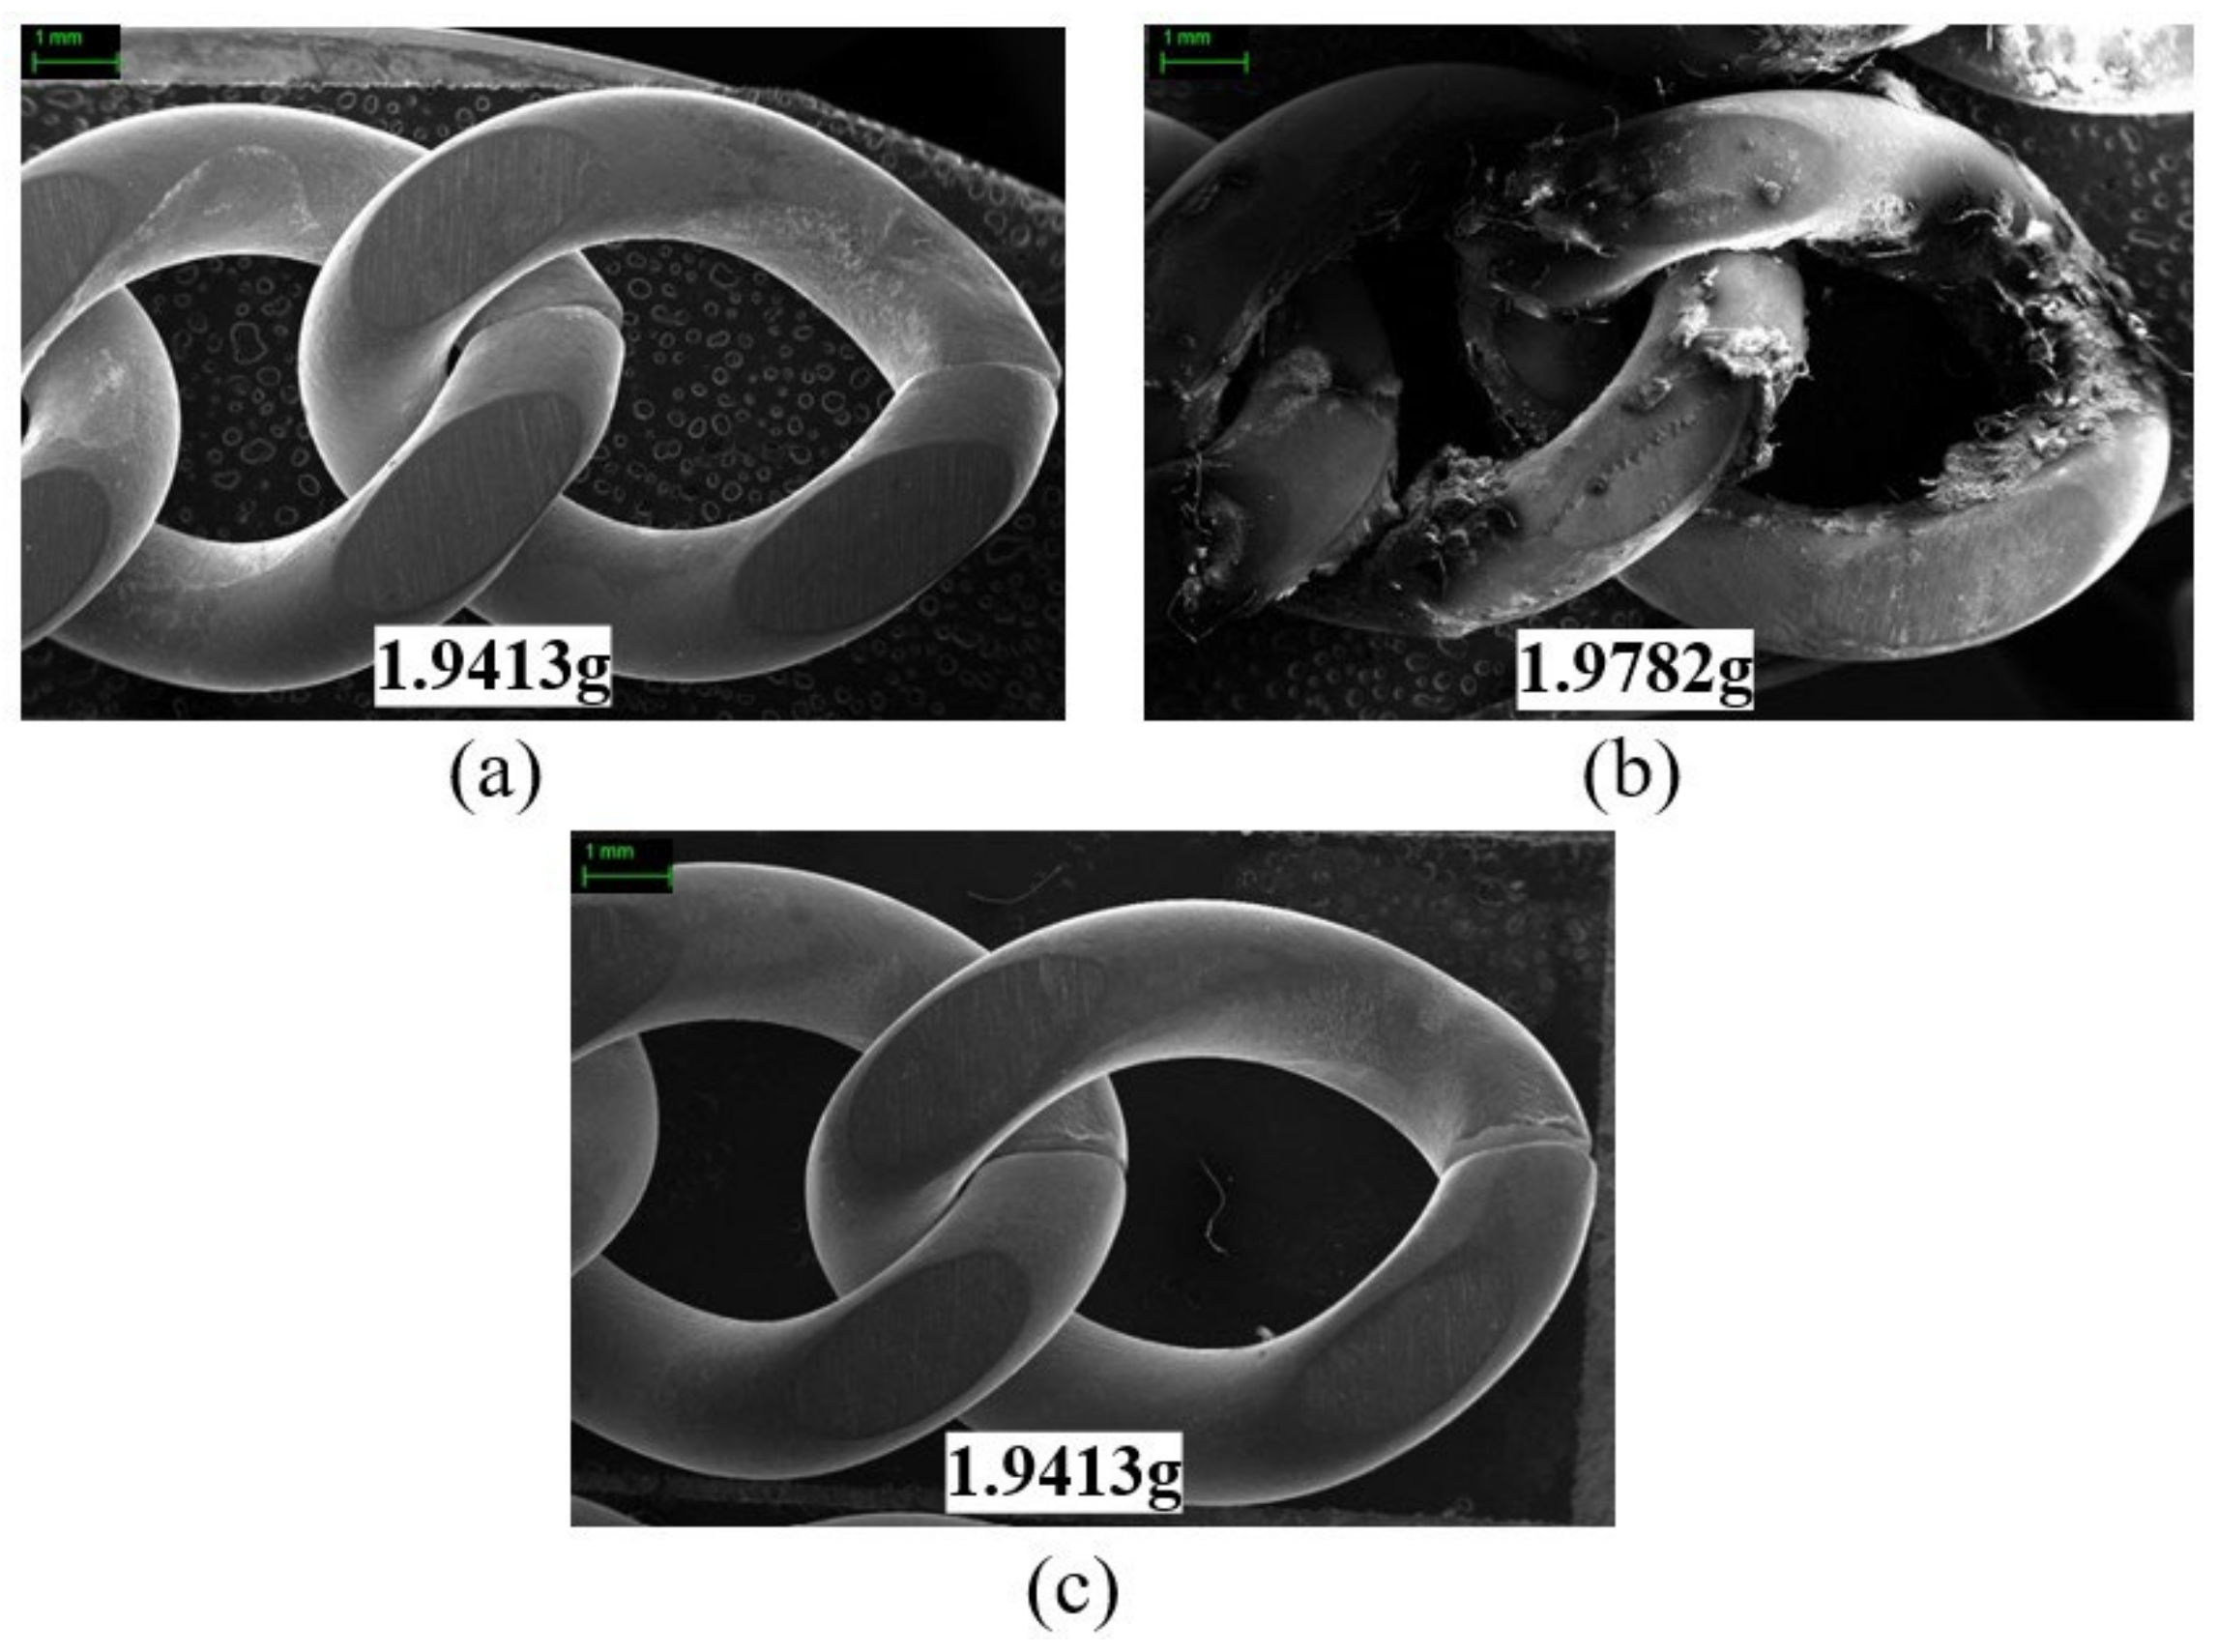
The experimental group used the same settings as in Figure 15; however, dual-frequency ultrasound was employed for cleaning at a water temperature of 27 °C, resulting in Figure 16. Compared to Figure 16b,c, most of the dubbing attached to the product’s surface was removed by ultrasonication, as expected. Therefore, dual-frequency ultrasonication removed the dubbing from the product’s surface, confirming that the MUCT can operate efficiently.
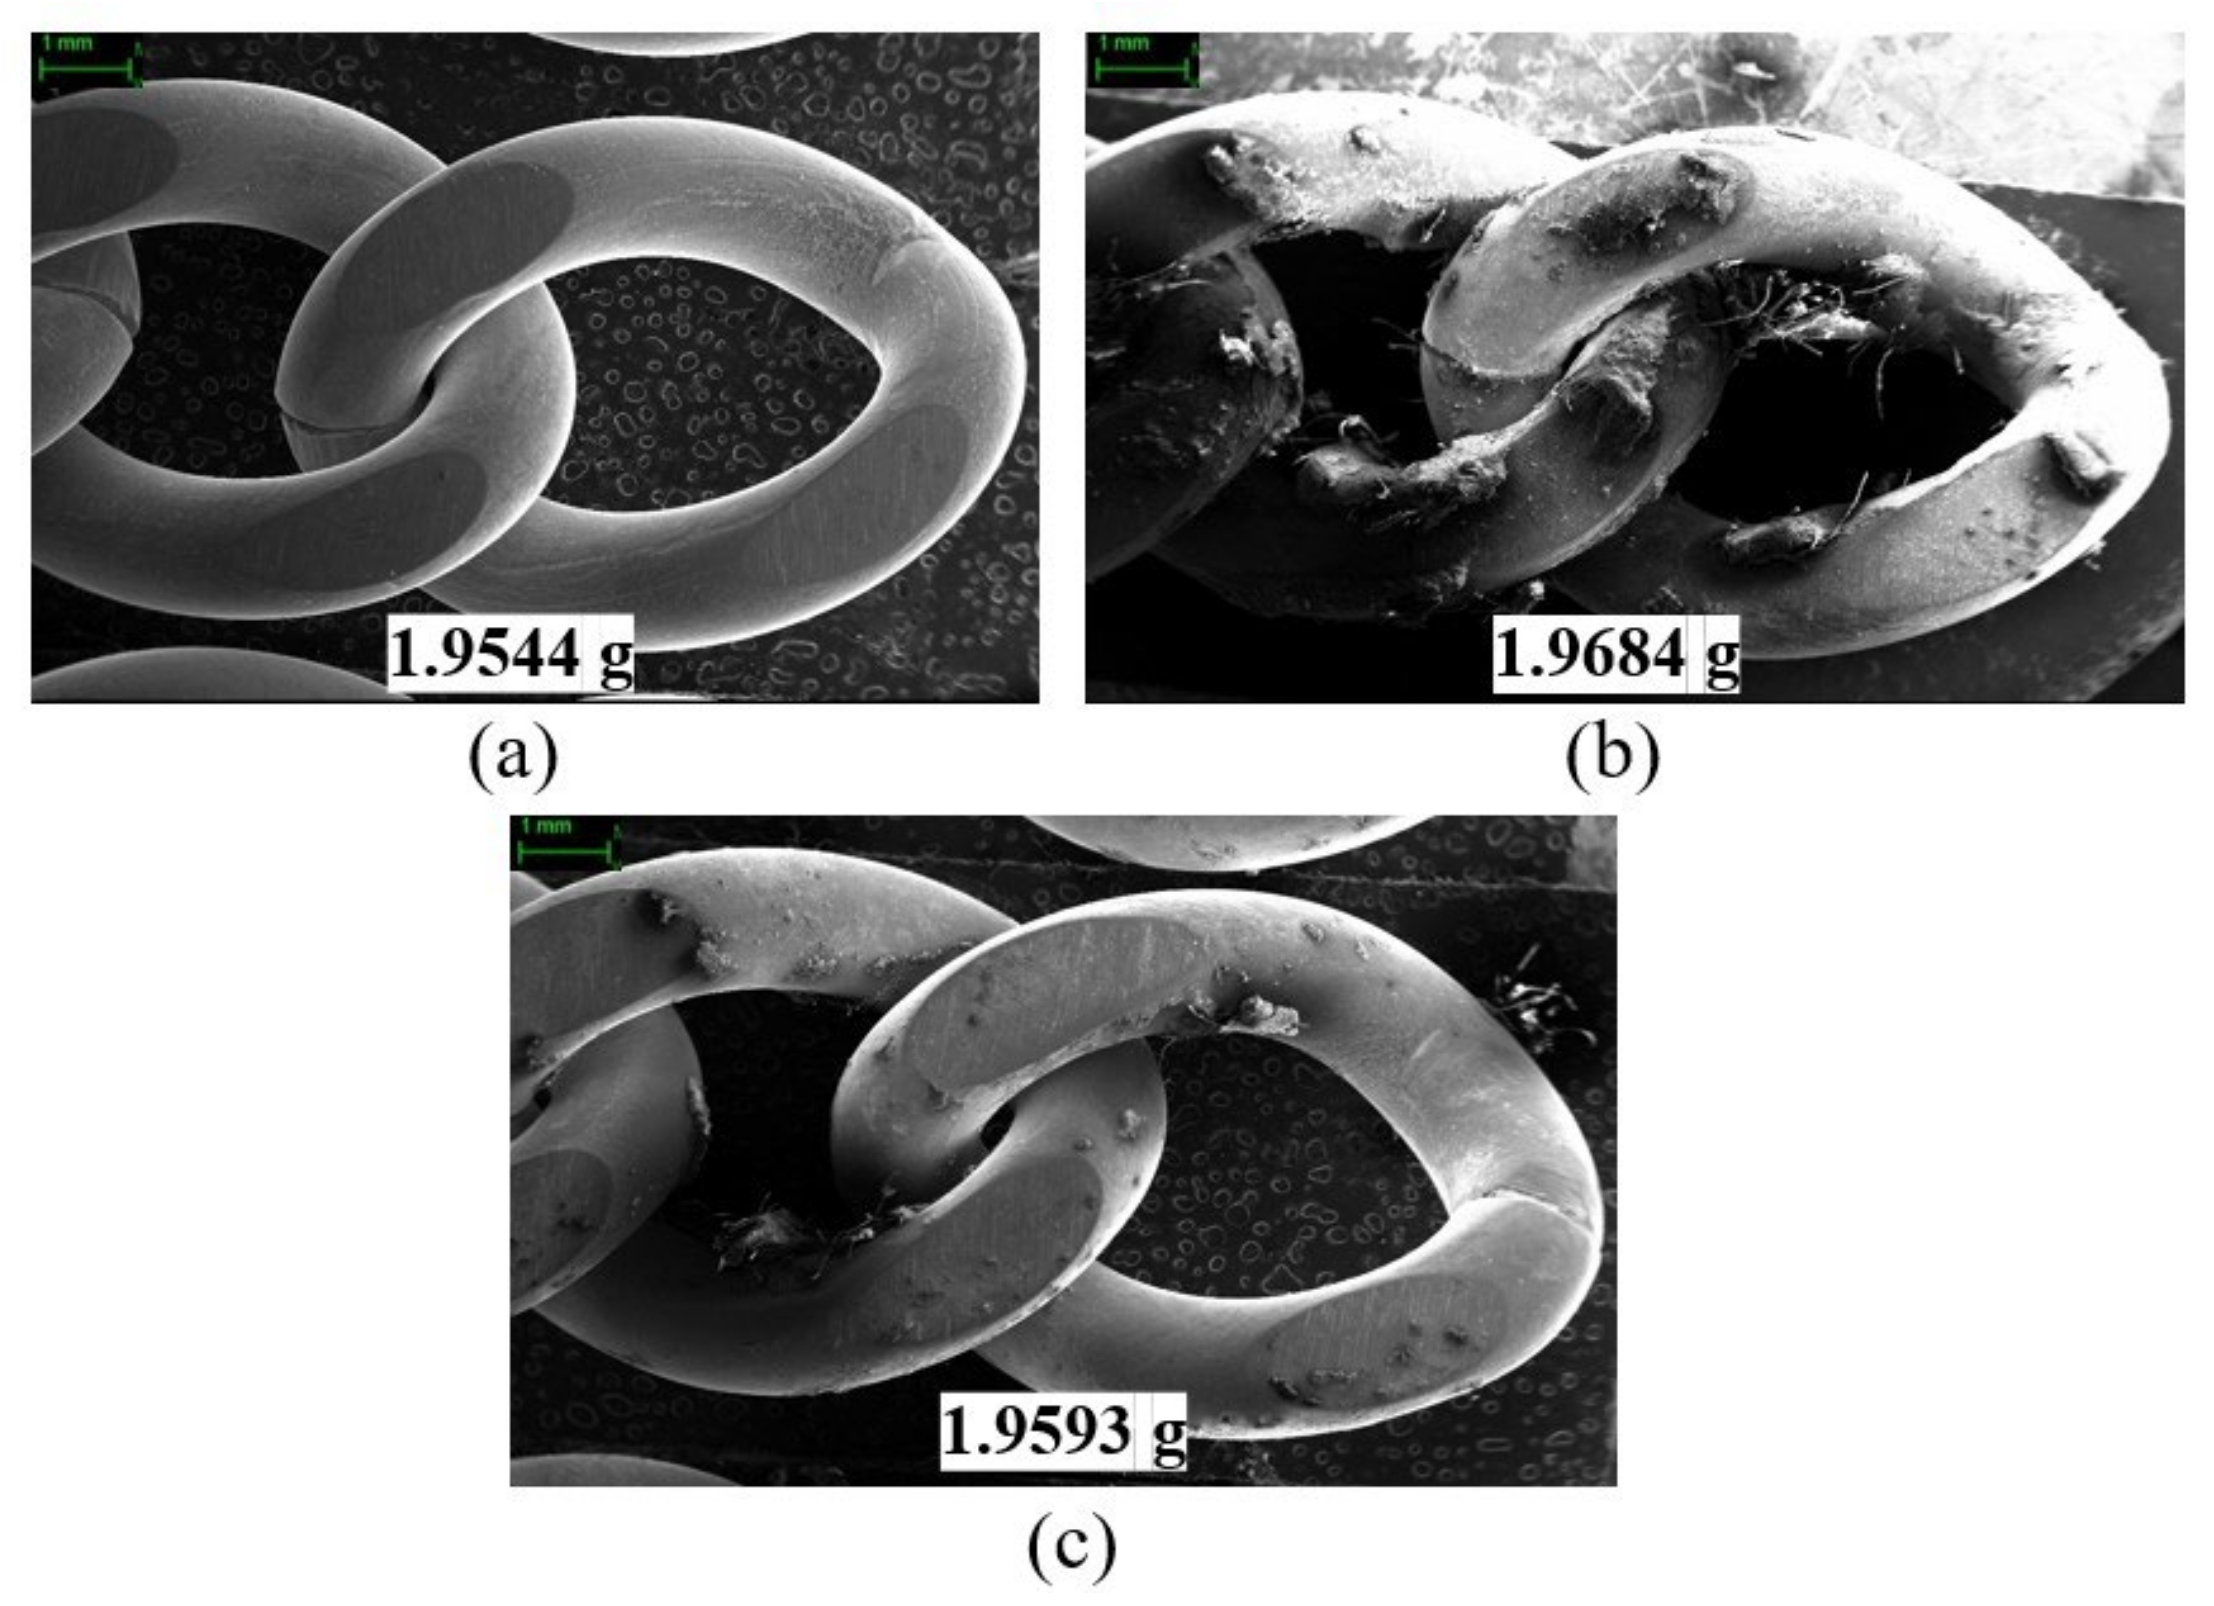
All settings remained unchanged; the product was cleaned using dual-frequency ultrasonic cleaning, with the water temperature set to 60 °C, as shown in Figure 17. Additionally, using a mixture of 97% water and 3% dishwashing liquid instead of pure water at 60 °C resulted in Figure 18. Like Figure 15 and Figure 16, dual-frequency ultrasonic cleaning with hot water removed the dubbing from the product’s surface, making it cleaner, as displayed in Figure 17c and Figure 18c. Compared to Figure 15c, Figure 16c, Figure 17c and Figure 18c, the cleanest product is the one cleaned with ultrasound and a mixture of 97% water and 3% at 60 °C, as seen in Figure 18c. The next cleanest is water at 60 °C, followed by water at 27 °C, and the least clean is water at 27 °C without ultrasonication. As presented in Figure 18c, all the dubbing was removed from the product’s surface, while it was partially removed in Figure 16c and Figure 17c and hardly removed in Figure 15c. Accordingly, hot water and mixing dishwashing liquid help increase the effectiveness of ultrasonic cleaning, as the dubbing is made of animal fat, which softens and easily comes off the product’s surface when heated. Mixing dishwashing liquid decreases both the surface tension and dynamic viscosity of water, increasing cavitation intensity, as explained in [4,6], resulting in the cleanest product.
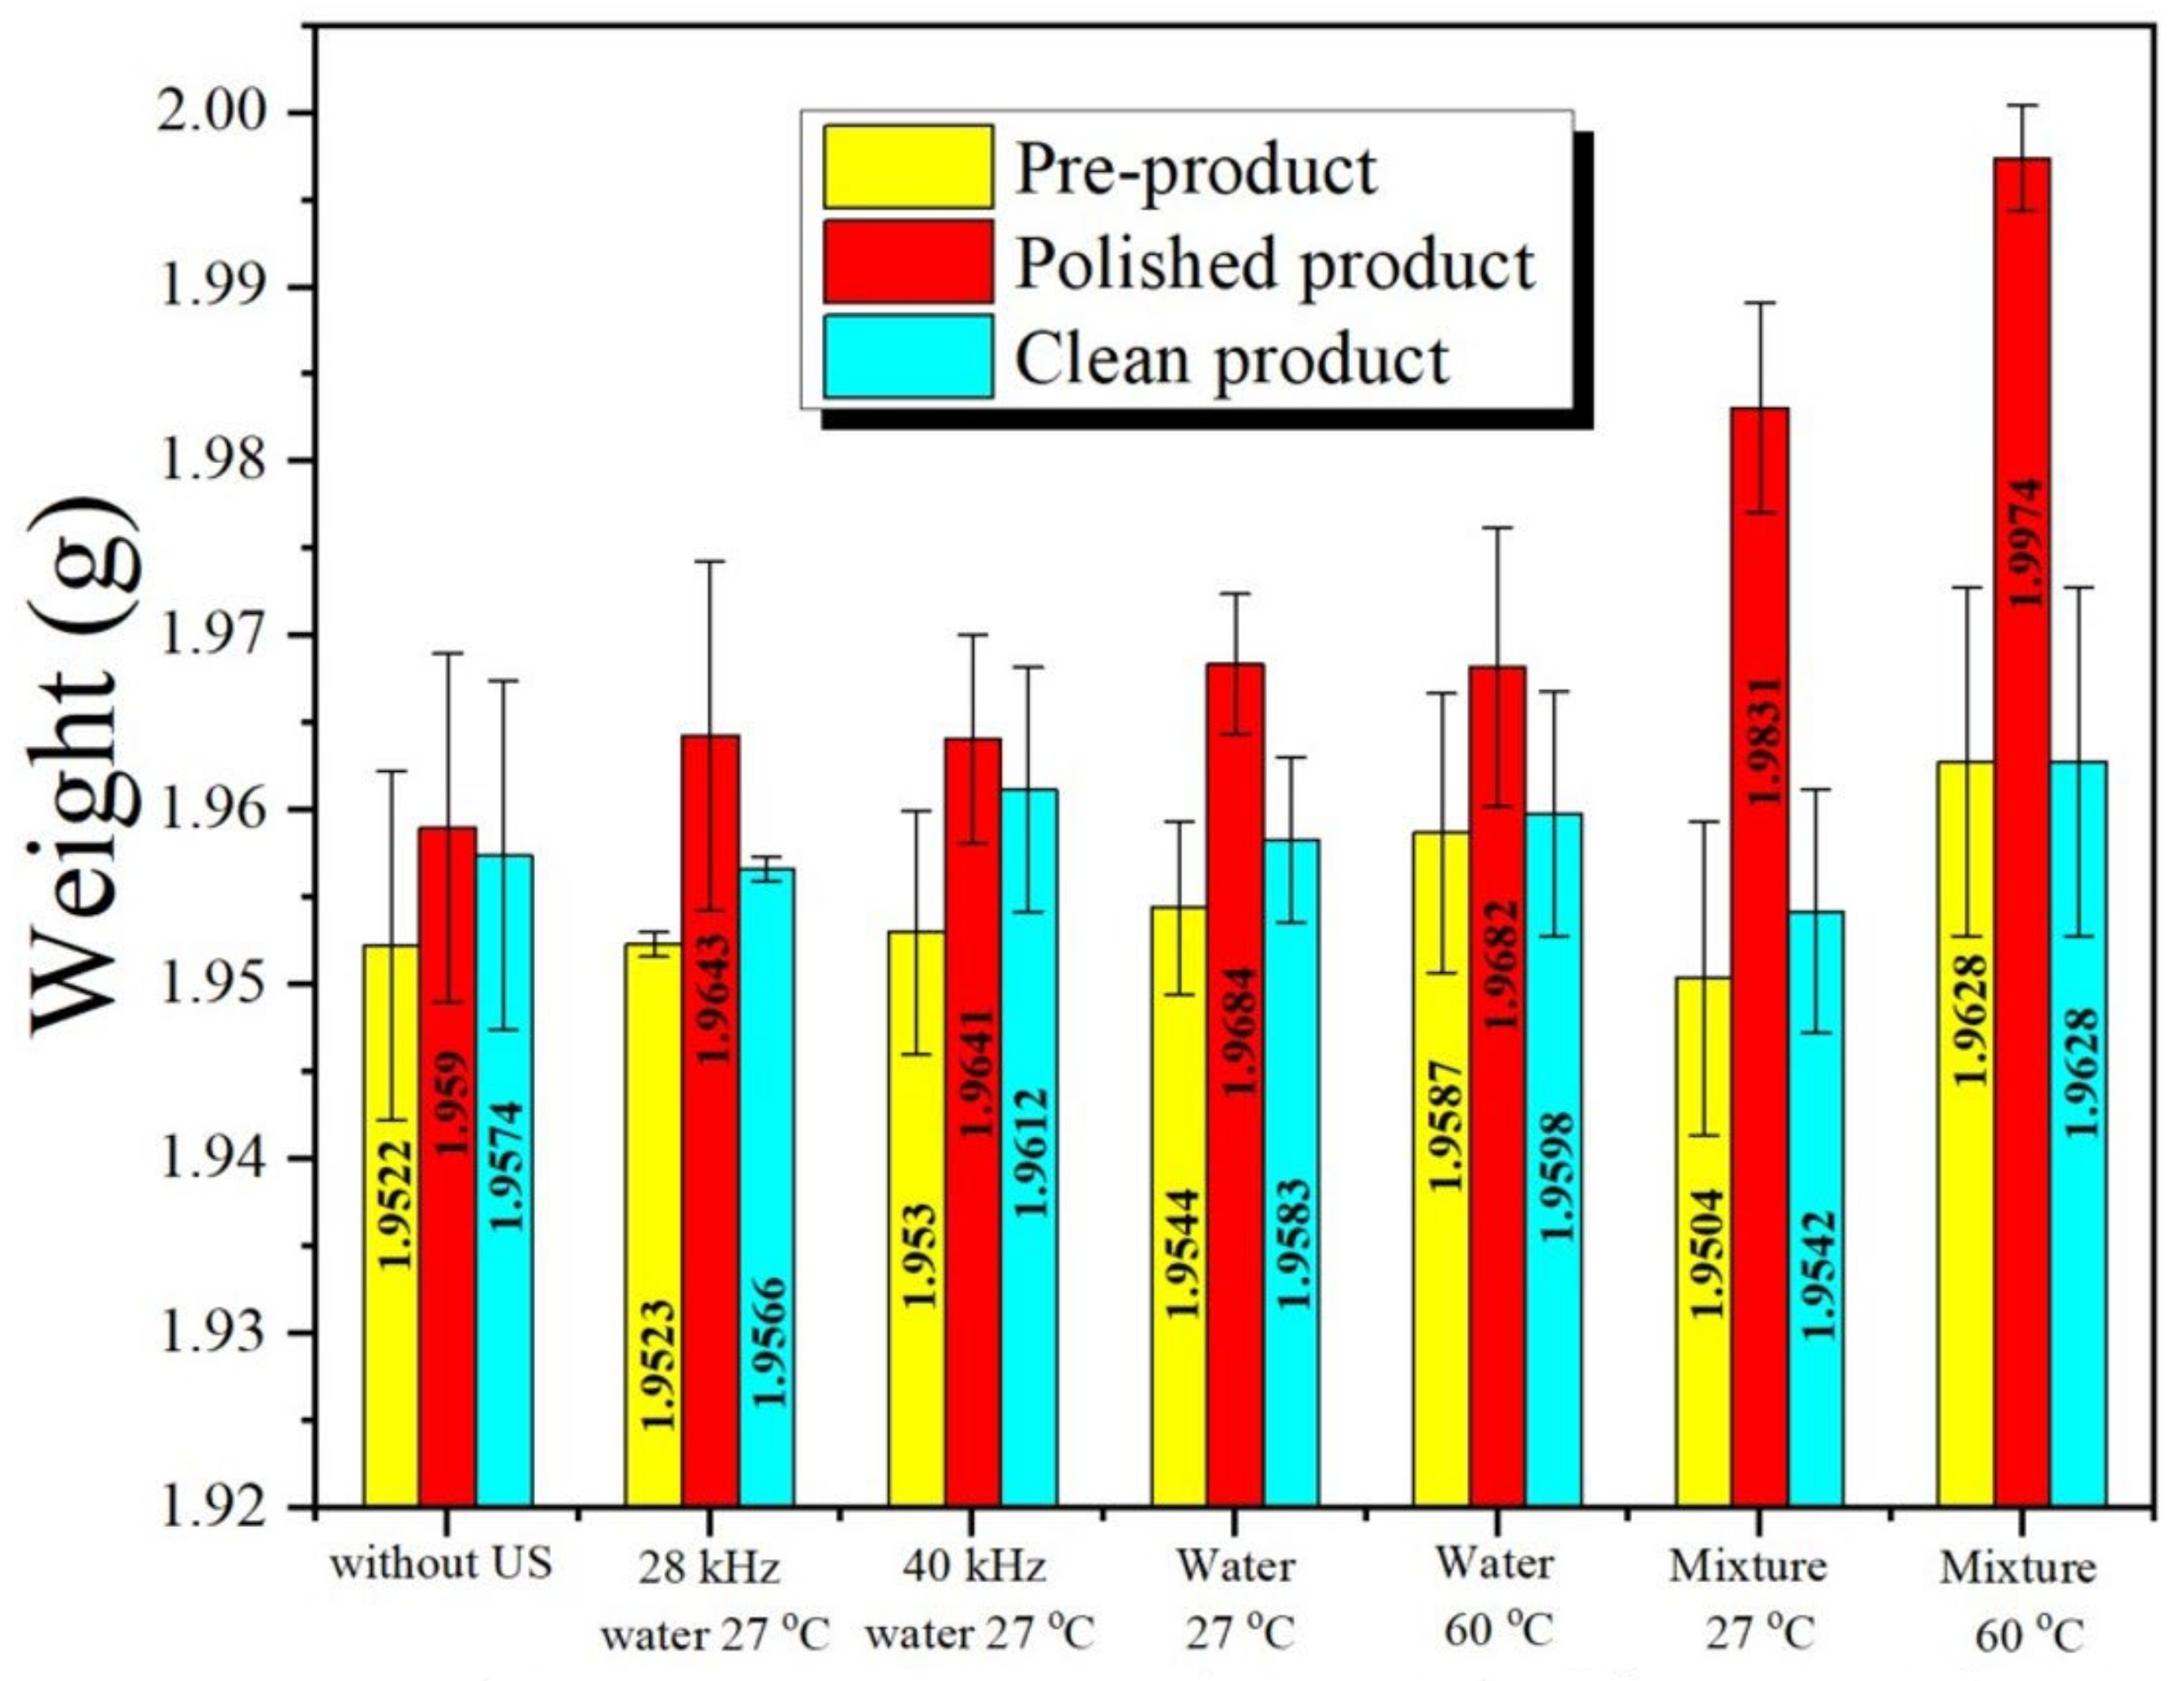
To confirm the results and discussion in Figure 15, Figure 16, Figure 17 and Figure 18, Figure 19 shows the product weights. As expected, the pre-product had the lightest weight. The polished product had the heaviest weight since it included the dubbing weight. The clean product is a middleweight between the pre-product and the polished product, as some of the dubbings were removed through ultrasonic cleaning.
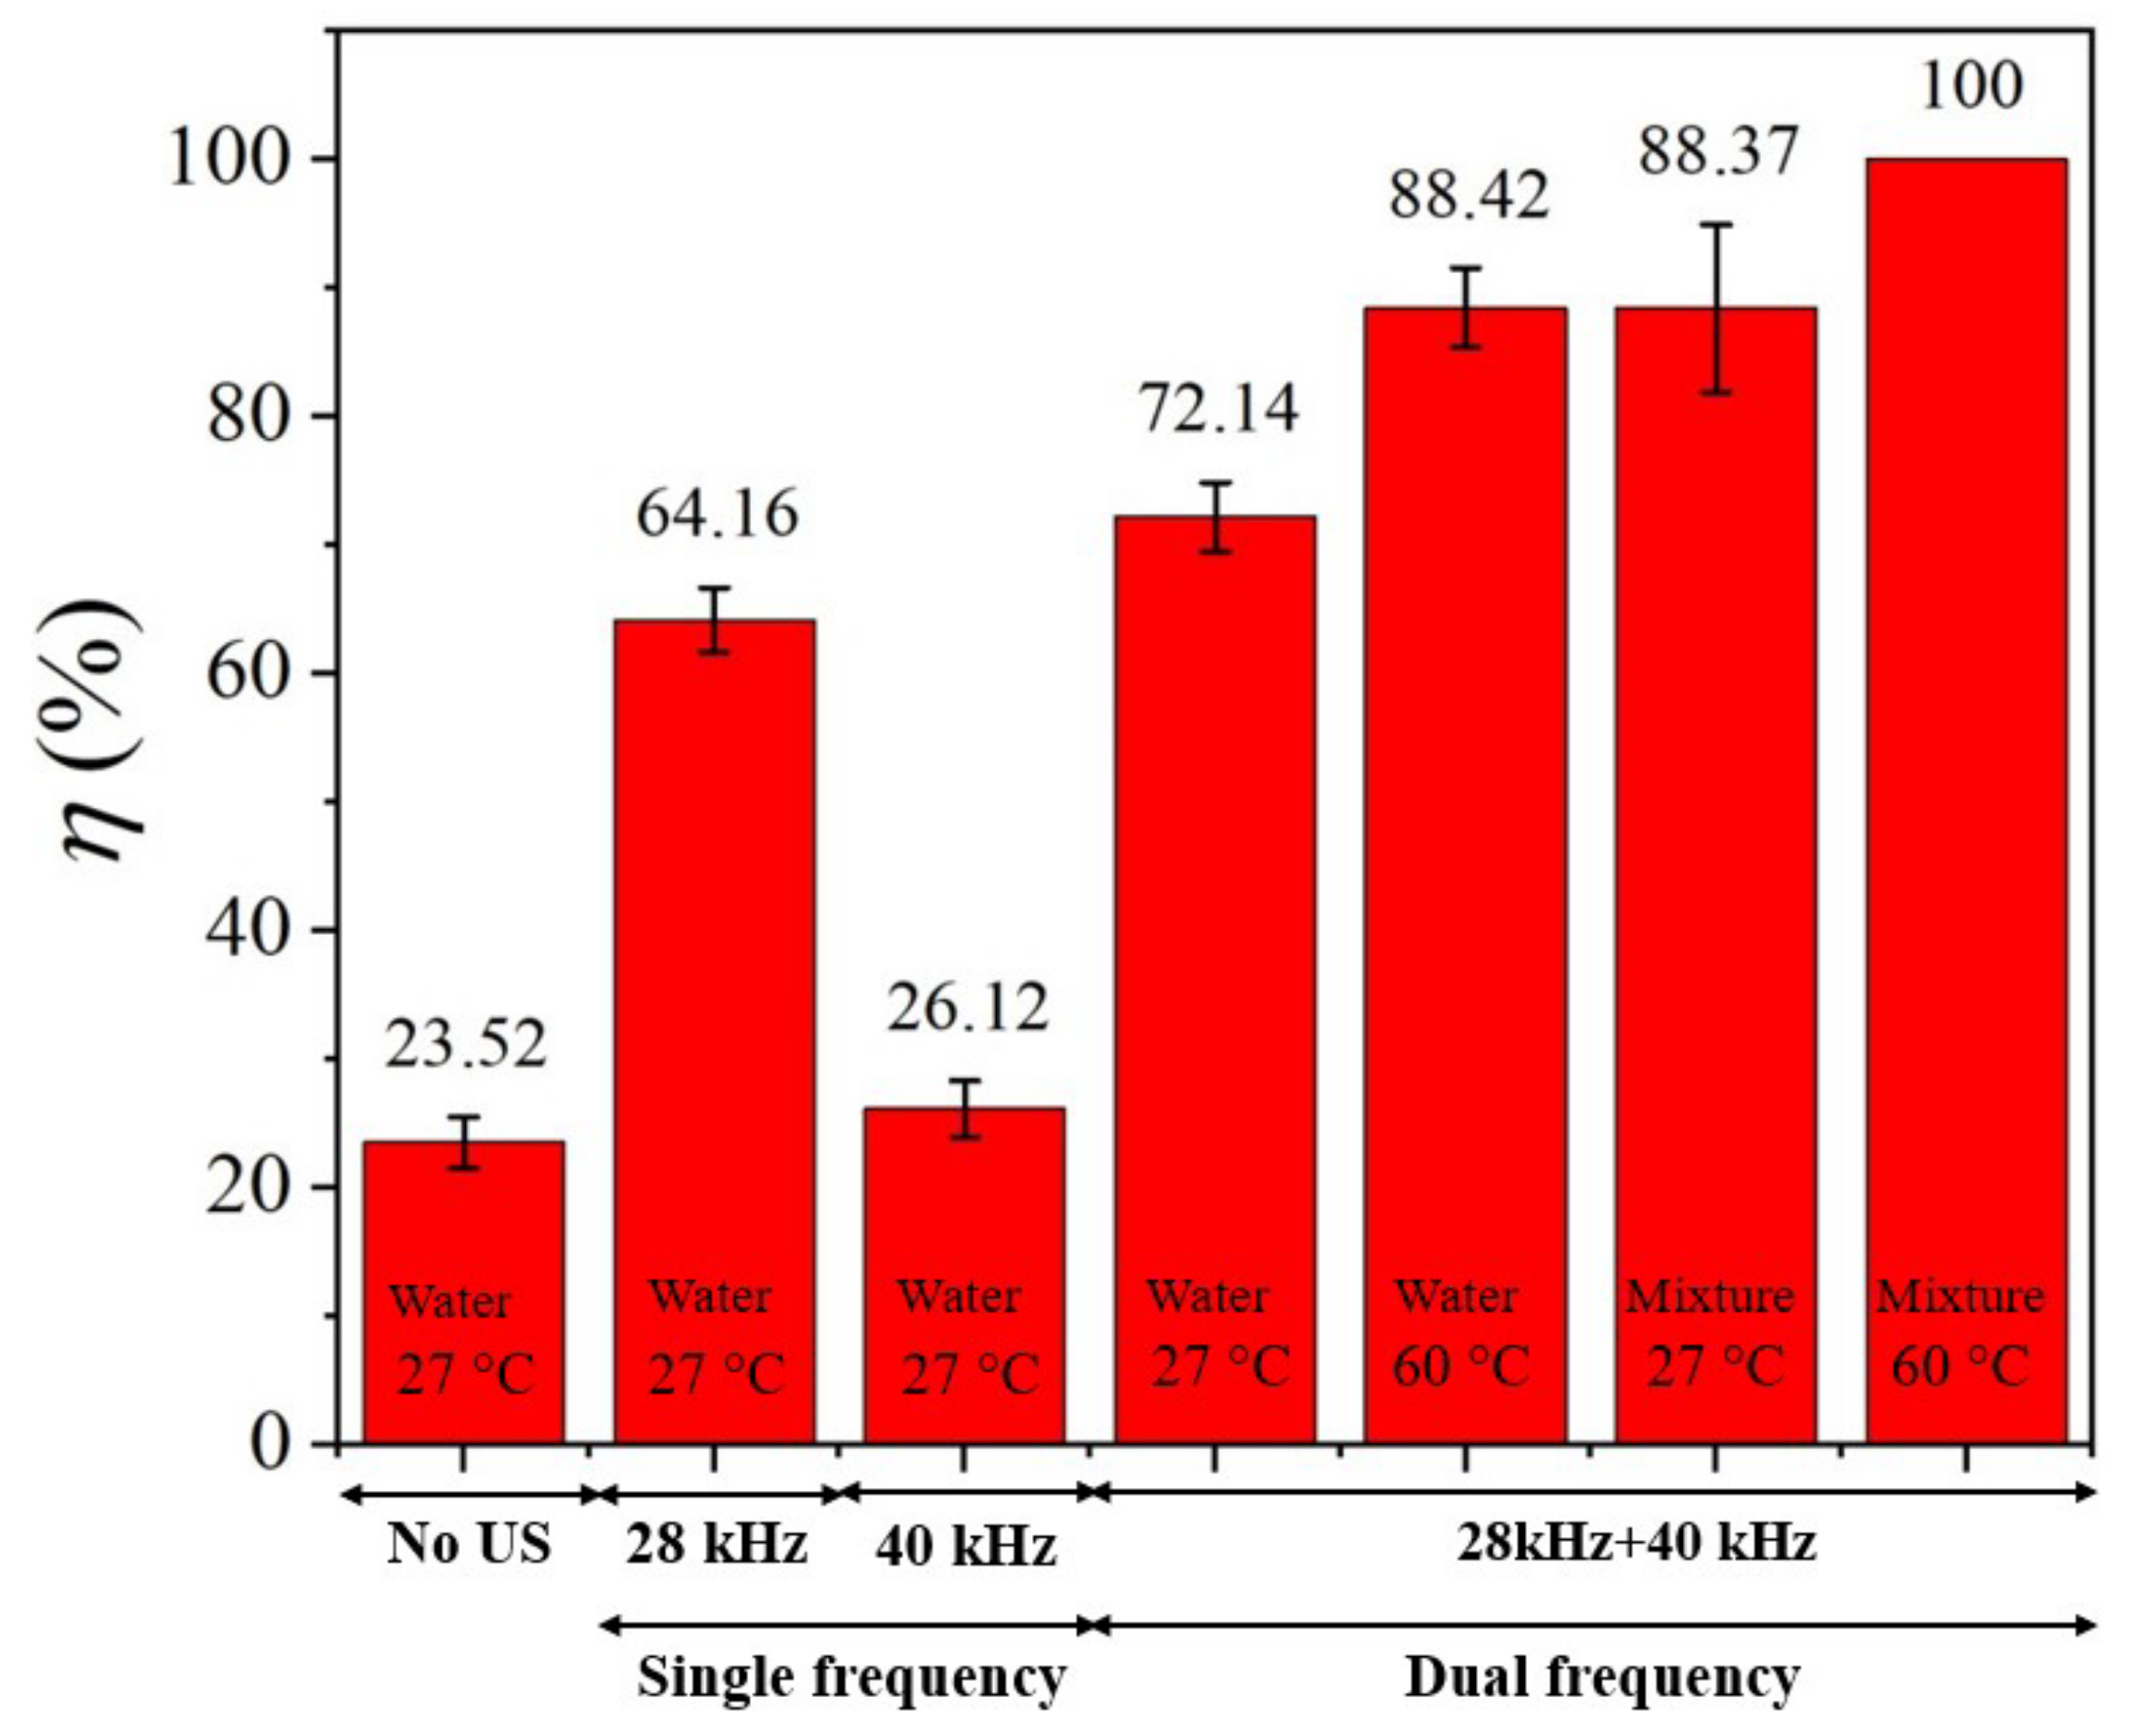
However, Figure 15, Figure 16, Figure 17, Figure 18 and Figure 19 illustrate the dubbing removal using the MUCT. They are based on qualitative analysis and do not imply the MUTC cleaning efficiency based on quantitative analysis. Therefore, in the quantitative analysis to clarify the MUCT cleaning efficiency, the results in Figure 19 were calculated for the cleaning efficiency (η) using Equation (3), which indicates the MUCT operation across various frequency modes, as shown in Figure 20.
From Figure 20, without ultrasonication (US), with water at 27 °C, the η was 23.52%, the lowest, meaning that pure water at 27 °C removed a little bit of dubbing. Or perhaps this is the water solubility efficiency of dubbing, rather than from ultrasonic cleaning. Applying the ultrasonication at a single frequency mode, the η increased to 26.12% for 40 kHz and 64.16% for 28 kHz. The η of 28 kHz was higher than the 40 kHz, implying that 28 kHz is better than 40 kHz in this cleaning process. Although the cavitation bubbles generated by 40 kHz are smaller and have low explosion energy, leading to low η, they can easily move into tiny holes and gaps in some types of jewelry surfaces. Perhaps the products employed as a case study, shown in Figure 15, Figure 16, Figure 17 and Figure 18, have dirt of a shape and size that is more suitable for 28 kHz, while 40 kHz is not suitable for these products.
In the dual-frequency mode, the η enhanced to 72.14% for the water at 27 °C. The dual-frequency mode provided the η more remarkable than the single one, which two points may explain. First, since 28 kHz can generate cavitation bubbles with a radius of about 14 μm and 40 kHz of about 7 μm [24], the dual frequency can create cavitation bubbles ranging from 7 to 14 μm. It is well known that the size of bubbles and the size of the dirt should be approximately equal for maximum ultrasonic cleaning efficiency [4,20]. Because dirt in nature tends to come in various sizes, dual-frequency generated cavitation bubbles of different sizes enhance the cleaning efficiency. Maybe the dubbing is a non-uniform dirt, which would make it sensitive to the dual-frequency mode. Second, the single frequency had four transducers, each 50 W, totaling 200 W, while the dual frequency had eight transducers, totaling 400 W. The number of cavitation bubbles increases proportionately to the power level to preserve energy conservation; therefore, the dual frequency has a higher energy than the single one, generating many cavitation bubbles of various sizes, suitable for this case study product to achieve a higher η. In addition, the η in Figure 20 are consistent with cavitation intensity in Figure 14, indicating that, when using the MUCT in cleaning this product type (Figure 1), the dual-frequency mode is the best, the 28 kHz single frequency is moderate, and the 40 kHz single frequency is the worst. Accordingly, the MUCT in a dual-frequency mode is better than the single-frequency mode, which aligns with the reports in [28,29] for cleaning hard disk drive components and in [30] for cleaning metal parts using ultrasonic cleaners. For other product types, the η may differ. Users can adjust the transducer position and frequency to enhance cleaning performance for different product types. This feature is the advantage of MUCT.
However, increasing the number of transducers and the power for a single frequency results in a greater number of cavitation bubbles, which can improve cleaning efficiency but may not outperform the η of dual frequency under the same conditions, as confirmed by the work of Awad and Nagarajan [6]. They reported that aluminum sheets cleaned more effectively using a dual frequency of 192 kHz and 172 kHz than using a single frequency of either 172 kHz or 192 kHz. Additionally, the cleanability of a single ultrasonic frequency of 58 kHz depends on the power applied. Cleanability was the highest at 80% power, indicating that the optimal power would provide the highest cleaning efficiency. Consequently, we did not focus on power or the number of transducers. Instead, we concentrated on the MUCT design with dual frequency and its operation, which is more efficient and cost-effective.
Regarding the effect of water temperature, the dual frequency with water of 60 °C in Figure 17 has the η of 88.42%, while 27 °C in Figure 16 was 72.14%, as expected since the dubbing is made of animal fat. It would soften and decompose when heated. Additionally, an increase in temperature reduces the surface tension of water, enhancing cleaning efficiency, as reported in [4,6]. In terms of solution type, using a dual-frequency mode in a mixture of 97% water and 3% dishwashing liquid removed all dubbing with the η of 100%; hence, a dual-frequency mode with a mixture at 60 °C is the best operating condition for cleaning this jewelry type. All results reported in Figure 20 were calculated from 5 samples per case. The errors were calculated from the standard deviation for each case. The error bar of the η of 100% disappears because every time the pre-product mass and the clean product mass were the same (Wpr = Wcl).
Since dishwashing liquid is available in the market, which is cheaper than the surfactant widely used by jewelry manufacturers and does not require a special order from vendors, this research helps them save costs and make their production processes more efficient. However, the dishwashing liquid concentration was limited to 3% because adding more than 3% detergent to the solution can cause toxicity. For example, toxicity can inhibit growth and may kill plants [31]. Therefore, to reduce environmental impact, a 3% concentration of dishwashing liquid is an appropriate choice, aligning with Sustainable Development Goal 6 (SDG 6): Clean water and sanitation [32]. Using less detergent decreases water pollution and supports sustainable water management. Moreover, as seen in Figure 16c, Figure 17c and Figure 18c, when examined under the SEM, ignoring the remaining dubbing, the surface of the silver jewelry before and after ultrasonic cleaning remains the same, so the MUCT and operating conditions used are safe for the jewelry and do not cause any damage.
Table 2 highlights key findings of the MUCT under different operating conditions. This table illustrates how various factors, including temperature, detergent, frequency, and transducer position, impact cleaning efficiency. According to the literature review, no ultrasonic cleaning tank has demonstrated such a broad range of performance. Additionally, the cleaning efficiency aligns with the ultrasonic cleaning principles described in [4,16,24] and previous research results [15,18,20], confirming the credibility and state-of-the-art status of this research.

3.3. Limitations and Opportunities to Develop the MUCT

Regarding the limitations, this research focuses solely on cleaning silver jewelry contaminated with dubbing. This narrow focus may limit the applicability of the results to other types of contaminants or products. Second, the computer simulations used computer-aided design (CAD) and meshing models that intentionally ignored certain components for practicality. Such simplifications may not fully capture the complex interactions in a real-world ultrasonic cleaning environment. Third, the dual-frequency mode used eight transducers (totaling 400 W) compared to 200 W in the single-frequency mode. This difference in power may affect the η. Each transducer requires 50 W due to its specifications. The dual-frequency mode uses eight transducers, so it requires 400 W, while the single frequency mode uses four transducers at 200 W. If the ultrasonic generator supplies 100 W to four transducers to reach 400 W, the single frequency mode becomes overloaded and cannot operate. Conversely, if the generator supplies 25 W to 8 transducers to reach 200 W for dual-frequency mode, the transducers’ performance becomes deficient. Transducers that operate within their specifications deliver the best performance. Fourth, the experiments were performed under a fixed sonification time (3 min) and a narrow range of water temperatures. Variations in these parameters (or using other cleaning agents) could influence cleaning efficiency, suggesting further optimization is needed. Last, cleaning efficiency was primarily evaluated through weight loss and SEM imaging. While informative, these methods may not capture all aspects of cleaning performance or potential surface damage from high cavitation intensities near transducers. However, none of the limitations will alter the conclusions drawn from this research because simulation and experimental results were consistent.
It would be beneficial to extend the technology beyond silver jewelry to other types of jewelry (e.g., gold, platinum, gemstone-embedded pieces) or even to other industries, such as medical device cleaning, automotive parts, or electronics, to further develop the MUCT. Investigating additional or variable frequency combinations beyond 28 and 40 kHz, including multi-frequency or adaptive frequency approaches in the generator’s sweep mode, can optimize cavitation effects for different contaminants and materials, thereby enhancing cleaning efficiency. Furthermore, exploring the role of temperature by testing a wider range of operating temperatures can help establish optimal conditions for different contaminants, particularly those sensitive to heat. Examining the long-term operational cost and energy efficiency of single-frequency versus dual-frequency systems could offer insights into cost savings in industrial applications. Last, understanding long-term durability, transducer wear, and MUCT maintenance under industrial conditions would be beneficial.

4. Conclusions

  • A Modern Ultrasonic Cleaning Tank (MUCT) was developed and validated through simulation and experimental testing, proving its effectiveness for jewelry manufacturing.
  • The dual-frequency design (28 kHz and 40 kHz) generated cavitation bubbles of varying sizes, enhancing cleaning efficiency compared to single-frequency operation.
  • Adjustable transducer positioning enabled users to tailor cavitation intensity for various jewelry types, overcoming the limitations of traditional fixed-position tanks.
  • Simulation results (HRA and TDA) aligned with experimental findings (foil corrosion, UPC measurements), confirming the reliability of the design methodology.
  • Cleaning tests showed that dual-frequency operation achieved superior efficiency, reaching 100% when combined with hot water and 3% dishwashing liquid at 60 °C.
  • The MUCT demonstrated cost-effectiveness by reducing detergent usage and operating time, while also aligning with sustainability goals (SDG 6).
  • This research provides a paved foundation for extending ultrasonic cleaning technology beyond silver jewelry to other industrial applications.

5. Patents

One of the outcomes from this research is a petty patent of Thailand under a grant number 24107.

Author Contributions

Conceptualization, C.C. and J.T.; methodology, C.C. and J.T.; software, C.C.; validation, C.C., P.B. and J.T.; formal analysis, J.T.; investigation, C.C. and J.T.; resources, C.C.; data curation, C.C.; writing—original draft preparation, J.T.; writing—review and editing, J.T.; visualization, C.C.; supervision, J.T.; project administration, J.T.; funding acquisition, J.T. All authors have read and agreed to the published version of the manuscript.

Funding

One of the authors (C.C.) has received financial support for graduation from King Mongkut’s Institute of Technology Ladkrabang, under grant number KREF016515. The APC was funded by School of Integrated Innovative Technology (SIITec).

Data Availability Statement

Data are contained within the article.

Acknowledgments

Pasuda Supplies and Services Co., Ltd., partially supported the experimental apparatus.

Conflicts of Interest

The authors declare no conflicts of interest.

References

  1. GIT Information Center. Thailand Gem and Jewelry Import-Export Performance January–December 2024. Available online: https://infocenter.git.or.th/en/article/article-20250207 (accessed on 9 February 2025).
  2. THIT. Thailand Aims to Become the World’s Gem and Jewelry Trading Hub in the Next 5 Years. Available online: https://thaitextile.org/th/insign/detail.590.1.0.html (accessed on 11 February 2025).
  3. Busnaina, A.; Kashkoush, I. The Effect of Time, Temperature, and Particle Size on Submicron Particle Removal Using Ultrasonic Cleaning. Chem. Eng. Commun. 1993, 125, 47–61. [Google Scholar] [CrossRef]
  4. Fuchs, F.J. Ultrasonic cleaning and washing of surfaces. In Power Ultrasonics; Woodhead Publishing: Sawston, UK, 2015; pp. 577–609. [Google Scholar]
  5. Verhaagen, B.; Rivas, D.F. Measuring cavitation and its cleaning effect. Ultrason. Sonochem. 2016, 29, 619–628. [Google Scholar] [CrossRef] [PubMed]
  6. Awad, S.B.; Nagarajan, R. Chapter 6-Ultrasonic cleaning. In Developments in Surface Contamination and Cleaning; Kohli, R., Mittal, K.L., Eds.; William Andrew Publishing: Oxford, MA, USA, 2010; pp. 225–280. [Google Scholar]
  7. Mason, T.J. Ultrasonic cleaning: An historical perspective. Ultrason. Sonochem. 2016, 29, 519–523. [Google Scholar] [CrossRef]
  8. Azam, S.M.; Ma, H.; Xu, B.; Devi, S.; Saddique, M.A.B.; Stanley, S.L.; Bhandari, B.; Zhu, J. Efficacy of ultrasound treatment in the removal of pesticide residues from fresh vegetable: A review. Trends Food Sci. Technol. 2020, 97, 417–432. [Google Scholar] [CrossRef]
  9. Patel, L.K.; Singh, A.K.; Sharma, V.; Kala, P. Analysis of a hybrid ultrasonic horn profile using finite element analysis. Mater. Today Proc. 2021, 41, 772–779. [Google Scholar] [CrossRef]
  10. Banerjee, B.; Pradhan, S.; Das, S.; Chakraborty, A.; Dhupal, D. Horn design and analysis in ultrasonic machine process using ANSYS. Adv. Mater. Process. Technol. 2021, 8, 1359–1372. [Google Scholar] [CrossRef]
  11. Wang, H.; Sun, C. Design and test of a small high frequency ultrasonic cleaning transducer. J. Phys. Conf. Ser. 2023, 2430, 012017. [Google Scholar] [CrossRef]
  12. Tommiska, O.; Mustonen, J.; Moilanen, P.; Rauhala, T.; Gritsevich, M.; Salmi, A.; Hæggström, E. FEM-based time-reversal technique for an ultrasonic cleaning application. Appl. Acoust. 2022, 193, 108763. [Google Scholar] [CrossRef]
  13. Zheng, Q.; Xu, J.; Shi, X.; Yu, Y. Design and modeling of a portable ultrasonic cleaner. Int. J. Prod. Sound Qual. 2023, 1, 3–17. [Google Scholar] [CrossRef]
  14. Lais, H.; Lowe, P.S.; Gan, T.H.; Wrobel, L.C. Numerical modelling of acoustic pressure fields to optimize the ultrasonic cleaning technique for cylinders. Ultrason. Sonochem. 2018, 45, 7–16. [Google Scholar] [CrossRef]
  15. Tangsopa, W.; Thongsri, J. Development of an industrial ultrasonic cleaning tank based on harmonic response analysis. Ultrasonics 2019, 91, 68–76. [Google Scholar] [CrossRef] [PubMed]
  16. Srathonghuam, K.; Wonganu, B.; Busayaporn, W.; Thongsri, J. Vibration analysis and development of a submersible ultrasonic transducer for an application in the inhibitory activity of pathogenic bacteria. IEEE Access 2021, 9, 142362–142373. [Google Scholar] [CrossRef]
  17. Pak, A.; Shirin Abadi Farahani, A.; Shahidi, A. Design, modeling and manufacturing a novel continues ultrasonic cleaning tank by harmonic response analysis. Iran. J. Manuf. Eng. 2022, 9, 21–27. [Google Scholar] [CrossRef]
  18. Tangsopa, W.; Thongsri, J. A novel ultrasonic cleaning tank developed by harmonic response analysis and computational fluid dynamics. Metals 2020, 10, 335. [Google Scholar] [CrossRef]
  19. Tang, J.; Cheng, Z.; Zhang, X.; Sun, J.; Liu, Z.; Zhang, H.; Tan, S.; Qiu, F. Continuous ultrasonic ozone coupling technology-assisted control of ceramic membrane fouling coupled enhanced multiphase mixing to treat dye wastewater and CFD flow field simulation. Ultrason. Sonochem. 2024, 104, 106839. [Google Scholar] [CrossRef]
  20. Tangsopa, W.; Thongsri, J. A dual frequency ultrasonic cleaning tank developed by transient dynamic analysis. Appl. Sci. 2021, 11, 699. [Google Scholar] [CrossRef]
  21. Liu, C.W.; Wu, C.W. An inventional of multifunction washing ball. IOP Conf. Series Mater. Sci. Eng. 2019, 658, 012019. [Google Scholar] [CrossRef]
  22. Ashly, K. Sonification as a sample preparation method for elemental analysis. Compr. Anal. Chem. 2003, 41, 353–369. [Google Scholar]
  23. ANSYS. Introduction to Acoustics; ANSYS Europe: Canonsburg, PA, USA, 2018. [Google Scholar] [CrossRef]
  24. Fuchs, J. Ultrasonics-Number and Size of Cavitation Bubbles. Available online: https://www.blackstone-ney.com/blog/ultrsonics-number-and-size-of-cavitation-bubbles/ (accessed on 13 February 2025).
  25. Wu, J. Acoustic streaming and its application. Fluids 2018, 3, 108. [Google Scholar] [CrossRef]
  26. NGL Cleaning Technology. UPC 3000 Ultrasonic Process Controller. Available online: https://www.ngl-group.com/wp-content/uploads/2024/09/upc-3000-en-pdf.pdf (accessed on 18 February 2025).
  27. Serway, R.A.; Jewett, J.W. Physics for Scientists and Engineers with Modern Physics, 7th ed.; Cengage Learning: Boston, MA, USA, 2008. [Google Scholar]
  28. Vetrimurugan, R.; Hooi, B. Study of ultrasonic parameters on removal of contamination from slider surface by using various cleaning chemistry. Int. J. Chem. Environ. Eng. 2012, 3, 392–396. [Google Scholar]
  29. Vetrimurugan, R.; Goodson, M.; Lim, T.; Nagarajan, S.; Siddharth, J. Experimental investigation of ultrasonic and megasonic frequency on cleaning of various disk drive components. Int. J. Chem. Eng. Appl. 2013, 4, 174–177. [Google Scholar] [CrossRef]
  30. Gopi, K.R.; Awad, S.B. Ultrasonic cleaning with two frequencies. In Handbook for Critical Cleaning, 2nd ed.; CRC Press: Florida, NW, USA, 2011; pp. 241–246. [Google Scholar]
  31. Heidari, H.; Karimi, S. Effect of contaminated water (handwashing detergent) on seed germination traits in wheat, mung bean, and chickpea. Tenside Surfactants Deterg. 2024, 61, 189–193. [Google Scholar] [CrossRef]
  32. Lawson, L.; Chowdhury, A.R. Women in Thailand’s gem and jewelry industry and the sustainable development goals (SDGs): Empowerment or continued inequity. Environ. Sci. Policy 2022, 136, 675–684. [Google Scholar] [CrossRef]
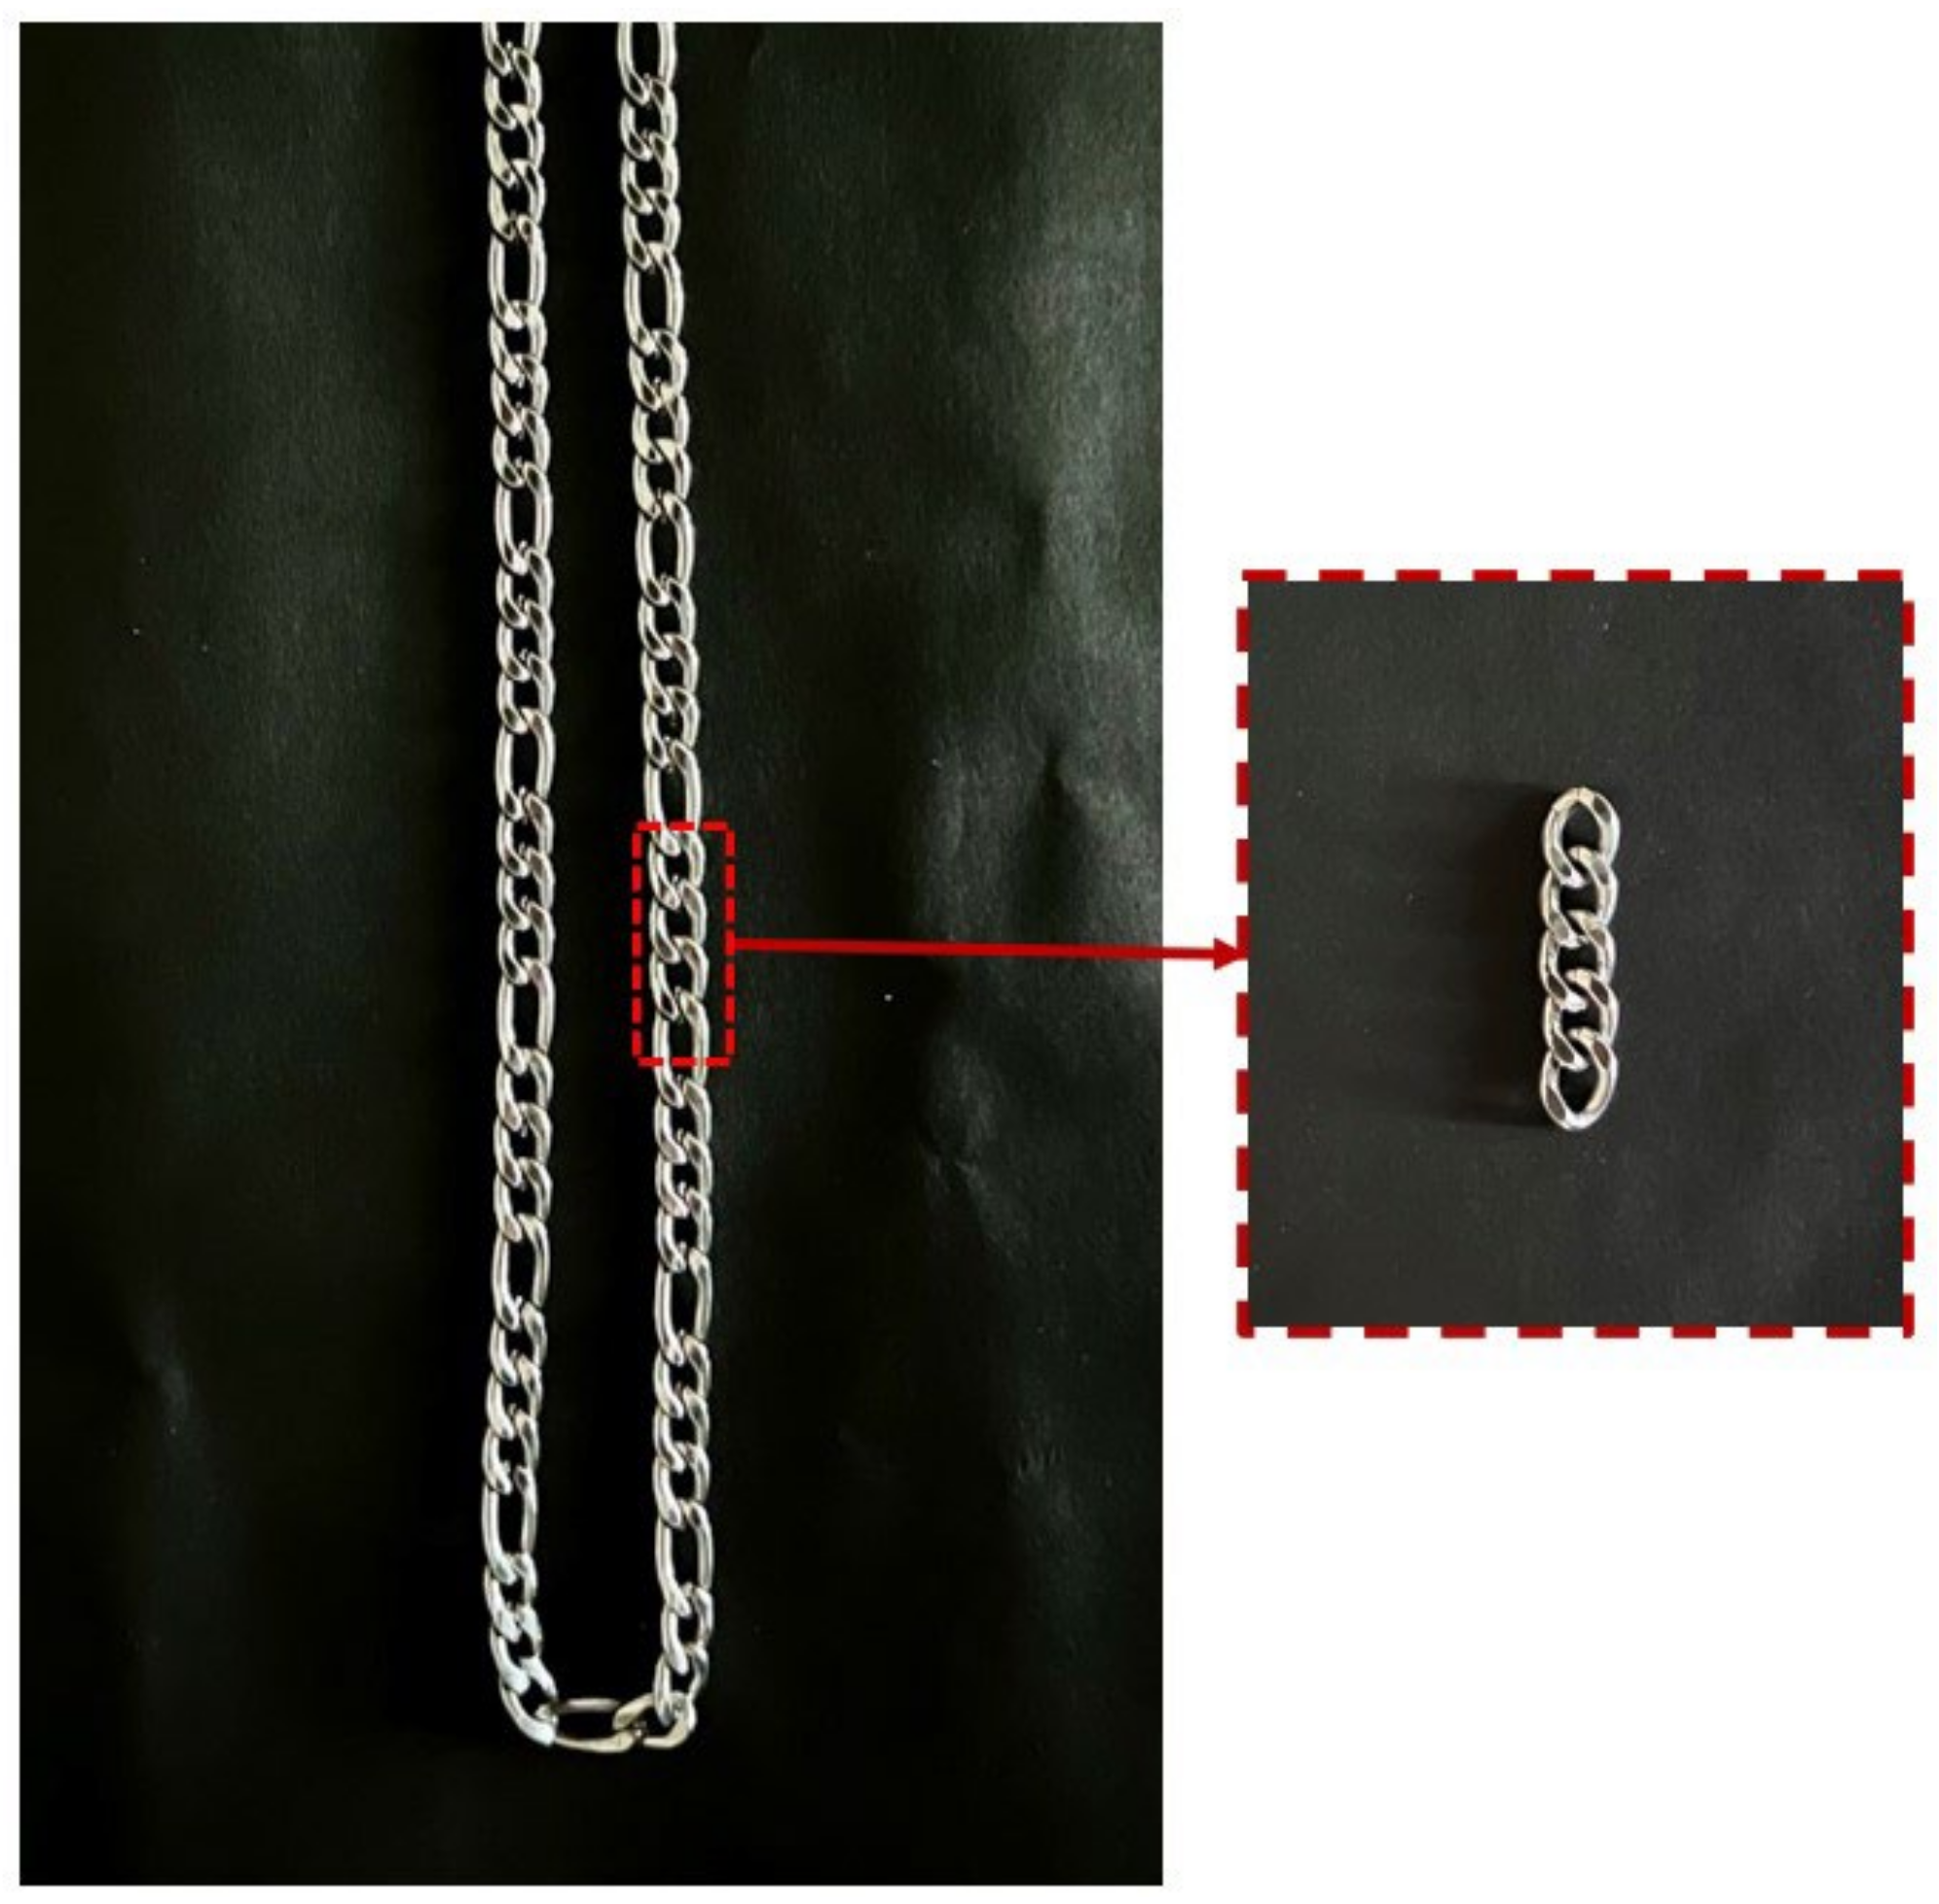
Figure 1. A silver necklace cleaned by ultrasonic processing in the jewelry manufacturing process.
Inventions 10 00090 g001
Figure 2. Jewelry cleaning process.
Inventions 10 00090 g002
Figure 3. A flowchart of the methodology.
Inventions 10 00090 g003
Figure 4. The MUCT design.
Inventions 10 00090 g004
Figure 5. The assembled MUCT.
Inventions 10 00090 g005
Figure 6. (a) CAD models and (b) mesh models.
Inventions 10 00090 g006
Figure 7. Mesh-independent analysis.
Inventions 10 00090 g007
Figure 8. The settings of (a) material properties and (b) boundary conditions.
Inventions 10 00090 g008
Figure 9. The experimental setup: (a) foil corrosion and (b) ultrasonic power concentration measurements.
Inventions 10 00090 g009
Figure 10. A cleaning diagram of the product.
Inventions 10 00090 g010
Figure 11. The foil corrosion and simulation results of acoustic pressure distribution for a single frequency of (a) 28 kHz and (b) 40 kHz using the MUCT.
Inventions 10 00090 g011
Figure 12. Comparison between the mass loss and the maximum acoustic pressure for 28 kHz and 40 kHz.
Inventions 10 00090 g012
Figure 13. The acoustic pressure distribution and corroded pattern inside the MUCT for adjusting the transducer 28 kHz on the side—(a) up 1 cm, (b) center, and (c) down 1 cm—in a dual-frequency mode.
Inventions 10 00090 g013
Figure 14. Comparison between the mass loss and the maximum acoustic pressure for adjusting the transducer at 28 kHz, up, center, and down, in a dual-frequency mode.
Inventions 10 00090 g014
Figure 15. The SEM images of the control group, cleaning the product with water without ultrasonication at a water temperature of 27 °C for (a) pre-product, (b) polished product, and (c) clean product.
Inventions 10 00090 g015
Figure 16. The SEM images of the experimental group, cleaning the product with water in a dual-frequency ultrasonication at a water temperature of 27 °C for the (a) pre-product, (b) polished product, and (c) clean product.
Inventions 10 00090 g016
Figure 17. The SEM images of the experimental group, cleaning the product with water in dual-frequency ultrasonication at a water temperature of 60 °C for the (a) pre-product, (b) polished product, and (c) clean product.
Inventions 10 00090 g017
Figure 18. The SEM images of the experimental group, cleaning the product with a mixture of 97% water and 3% dishwashing liquid in dual-frequency ultrasonication at 60 °C for the (a) pre-product, (b) polished product, and (c) clean product.
Inventions 10 00090 g018
Figure 19. The product weights of Figure 15 (without US), Figure 16 (with US and water of 27 °C), Figure 17 (with US and water of 60 °C), and Figure 18 (with US and a mixture of 60 °C).
Inventions 10 00090 g019
Figure 20. The MUCT cleaning efficiency (η) under operation in various frequency modes.
Inventions 10 00090 g020
Table 1. Material properties [18,20].
MaterialTypeValue
Water (27 °C)Water density
Acoustic velocity
Dynamic viscosity
996.45 kg/m3
1499.2 m/s
0.8592 kg/ms
Aluminum alloyDensity
Young’s modulus
Poisson’s ratio
Bulk modulus
Shear modulus
2770 kg/m3
7.1 × 10¹⁰ Pa
0.33
6.9608 × 10¹⁰ Pa
2.6692 × 101 Pa
Stainless steelDensity
Young’s modulus
Poisson’s ratio
Bulk modulus
Shear modulus
7750 kg/m3
1.93 × 10¹¹ Pa
0.31
1.693 × 10¹⁰ Pa
7.3664 × 101 Pa
Piezoelectric
(PZT4)
Density
Permittivity constant (ε0)
Stiffness matrix [cE]


Piezoelectric stress [e]
Relative permittivity (εr)
7500 kg/m3
8.854 × 10⁻¹² F/m
C11 = C22 = 1.39 × 10¹¹, C21 = 7.78 × 10¹⁰,
C31 = C32 = 7.43 × 10¹⁰, C44 = 3.06 × 10¹⁰,
C55 = C66 = 2.56 × 10¹⁰ Pa
e31 = −5.2, e33 = 15.1, e15 = 12.7 C/m2
εr11 = εr22 = 1475, εr33 = 1300
Epoxy Density
Young’s modulus x, y, z direction
Poisson’s ratio
Shear modulus
1451 kg/m3
σx, σy = 5.916 × 10¹⁰, σz = 7.5 × 10⁹ Pa

xy = 0.04, yz, xz = 0.3
xy = 3.3 × 10⁹, yz, xz = 2.7 × 10⁹ Pa
Table 2. Key findings when the MUCT operated.
Cleaning
Condition
Frequency ModeDetergentWater Temp (°C)η (%)Key findings
Water
(no ultrasonication)
--2733.33- Minimal dubbing removal; mostly due to water solubility, not ultrasonic action.
Single frequency28 kHz-2764.16- Larger cavitation bubbles; better suited for dubbing removal.
- Cleaning position: the best at the center, the worst near the transducer [15,20].
40 kHz-2738.80- Small cavitation bubbles; lower removal efficiency for this dirt type compared to 28 kHz.
- Adjusting transducer position: affecting cavitation intensity, controlling the cavitation distribution [15,18,20]
Dual frequency28 + 40 kHz-2772.14- A mix of bubble sizes (7–14 μm) [16,24] improved removal; more cavitation due to higher total power
-6088.42- High cleaning efficiency: heat softened dubbing and reduced water surface tension, enhancing cleaning
3% DWL2788.37-Combination of chemical cleaning and ultrasonic cleaning [4,24]
60100The highest cleaning efficiency: a mix of bubble sizes; number and stability of bubbles increase; easily forming and expanding bubbles; high-energy exploded bubbles [4,24]; optimal operating conditions; cost saving for jewelry manufacturer.
Disclaimer/Publisher’s Note: The statements, opinions and data contained in all publications are solely those of the individual author(s) and contributor(s) and not of MDPI and/or the editor(s). MDPI and/or the editor(s) disclaim responsibility for any injury to people or property resulting from any ideas, methods, instructions or products referred to in the content.