Article

Development and Performance Evaluation of a Vision-Based Automated Oyster Size Classification System

1
Integrated Robotics Systems R&D Division, Korea Institute of Robotics & Technology Convergence, 30 Haean-ro 1106 beon-gil, Buk-gu, Pohang-si 37553, Republic of Korea
2
Department of Mechanical Systems Engineering, College of Engineering, Pukyong National University (Daeyeon Campus), Busan 48513, Republic of Korea
*
Author to whom correspondence should be addressed.
Inventions 2025, 10(5), 76; https://doi.org/10.3390/inventions10050076
Submission received: 9 July 2025 / Revised: 12 August 2025 / Accepted: 21 August 2025 / Published: 27 August 2025
(This article belongs to the Section Inventions and Innovation in Advanced Manufacturing)

Abstract

This study presents the development and validation of an automated oyster classification system designed to classify oysters by size and place them into trays for freezing. Addressing limitations in conventional manual processing, the proposed system integrates a vision-based recognition algorithm and a delta robot (parallel robot) equipped with a soft gripper. The vision system identifies oyster size and optimal grasp points using image moment calculations, enhancing the accuracy of classification for irregularly shaped oysters. Experimental tests demonstrated classification and grasping success rates of 99%. A process simulation based on real industrial conditions revealed that seven units of the automated system are required to match the daily output of 7 tons achieved by 60 workers. When compared with a theoretical 100% success rate, the system showed a marginal production loss of 715 oysters and 15 trays. These results confirm the potential of the proposed system to improve consistency, reduce labor dependency, and increase productivity in oyster processing. Future work will focus on gripper design optimization and parameter tuning to further improve system stability and efficiency.

1. Introduction

Seafood production plays a critical role in the manufacture and distribution of a wide variety of food products, and it has established itself as one of the most important global industries [1,2]. However, the productivity of this industry remains limited due to its continued reliance on manual labor and outdated processing equipment. With the growing public interest in seafood consumption, there is increasing demand for enhanced quality control and reduced distribution time to preserve product freshness. To meet these demands and improve overall efficiency, the seafood industry is undergoing a transition from traditional labor-intensive methods to smart, digital technologies. This transformation is essential not only for improving productivity but also for ensuring the consistent and safe production of food. Automation and robotic technologies are being actively adopted to reduce production costs and improve product quality [3,4,5].
Despite this progress, most automation applications in the food industry are still limited to material handling tasks such as box packaging and palletizing. This is mainly because the wide variability in the shape, size, and texture of seafood products makes automated handling and manipulation challenging. As a result, the development of specialized grippers suited to the diverse forms of seafood has become a critical area of research. Recent studies have focused on recognizing objects on high-speed conveyor systems and performing reliable grasping using soft grippers [6].
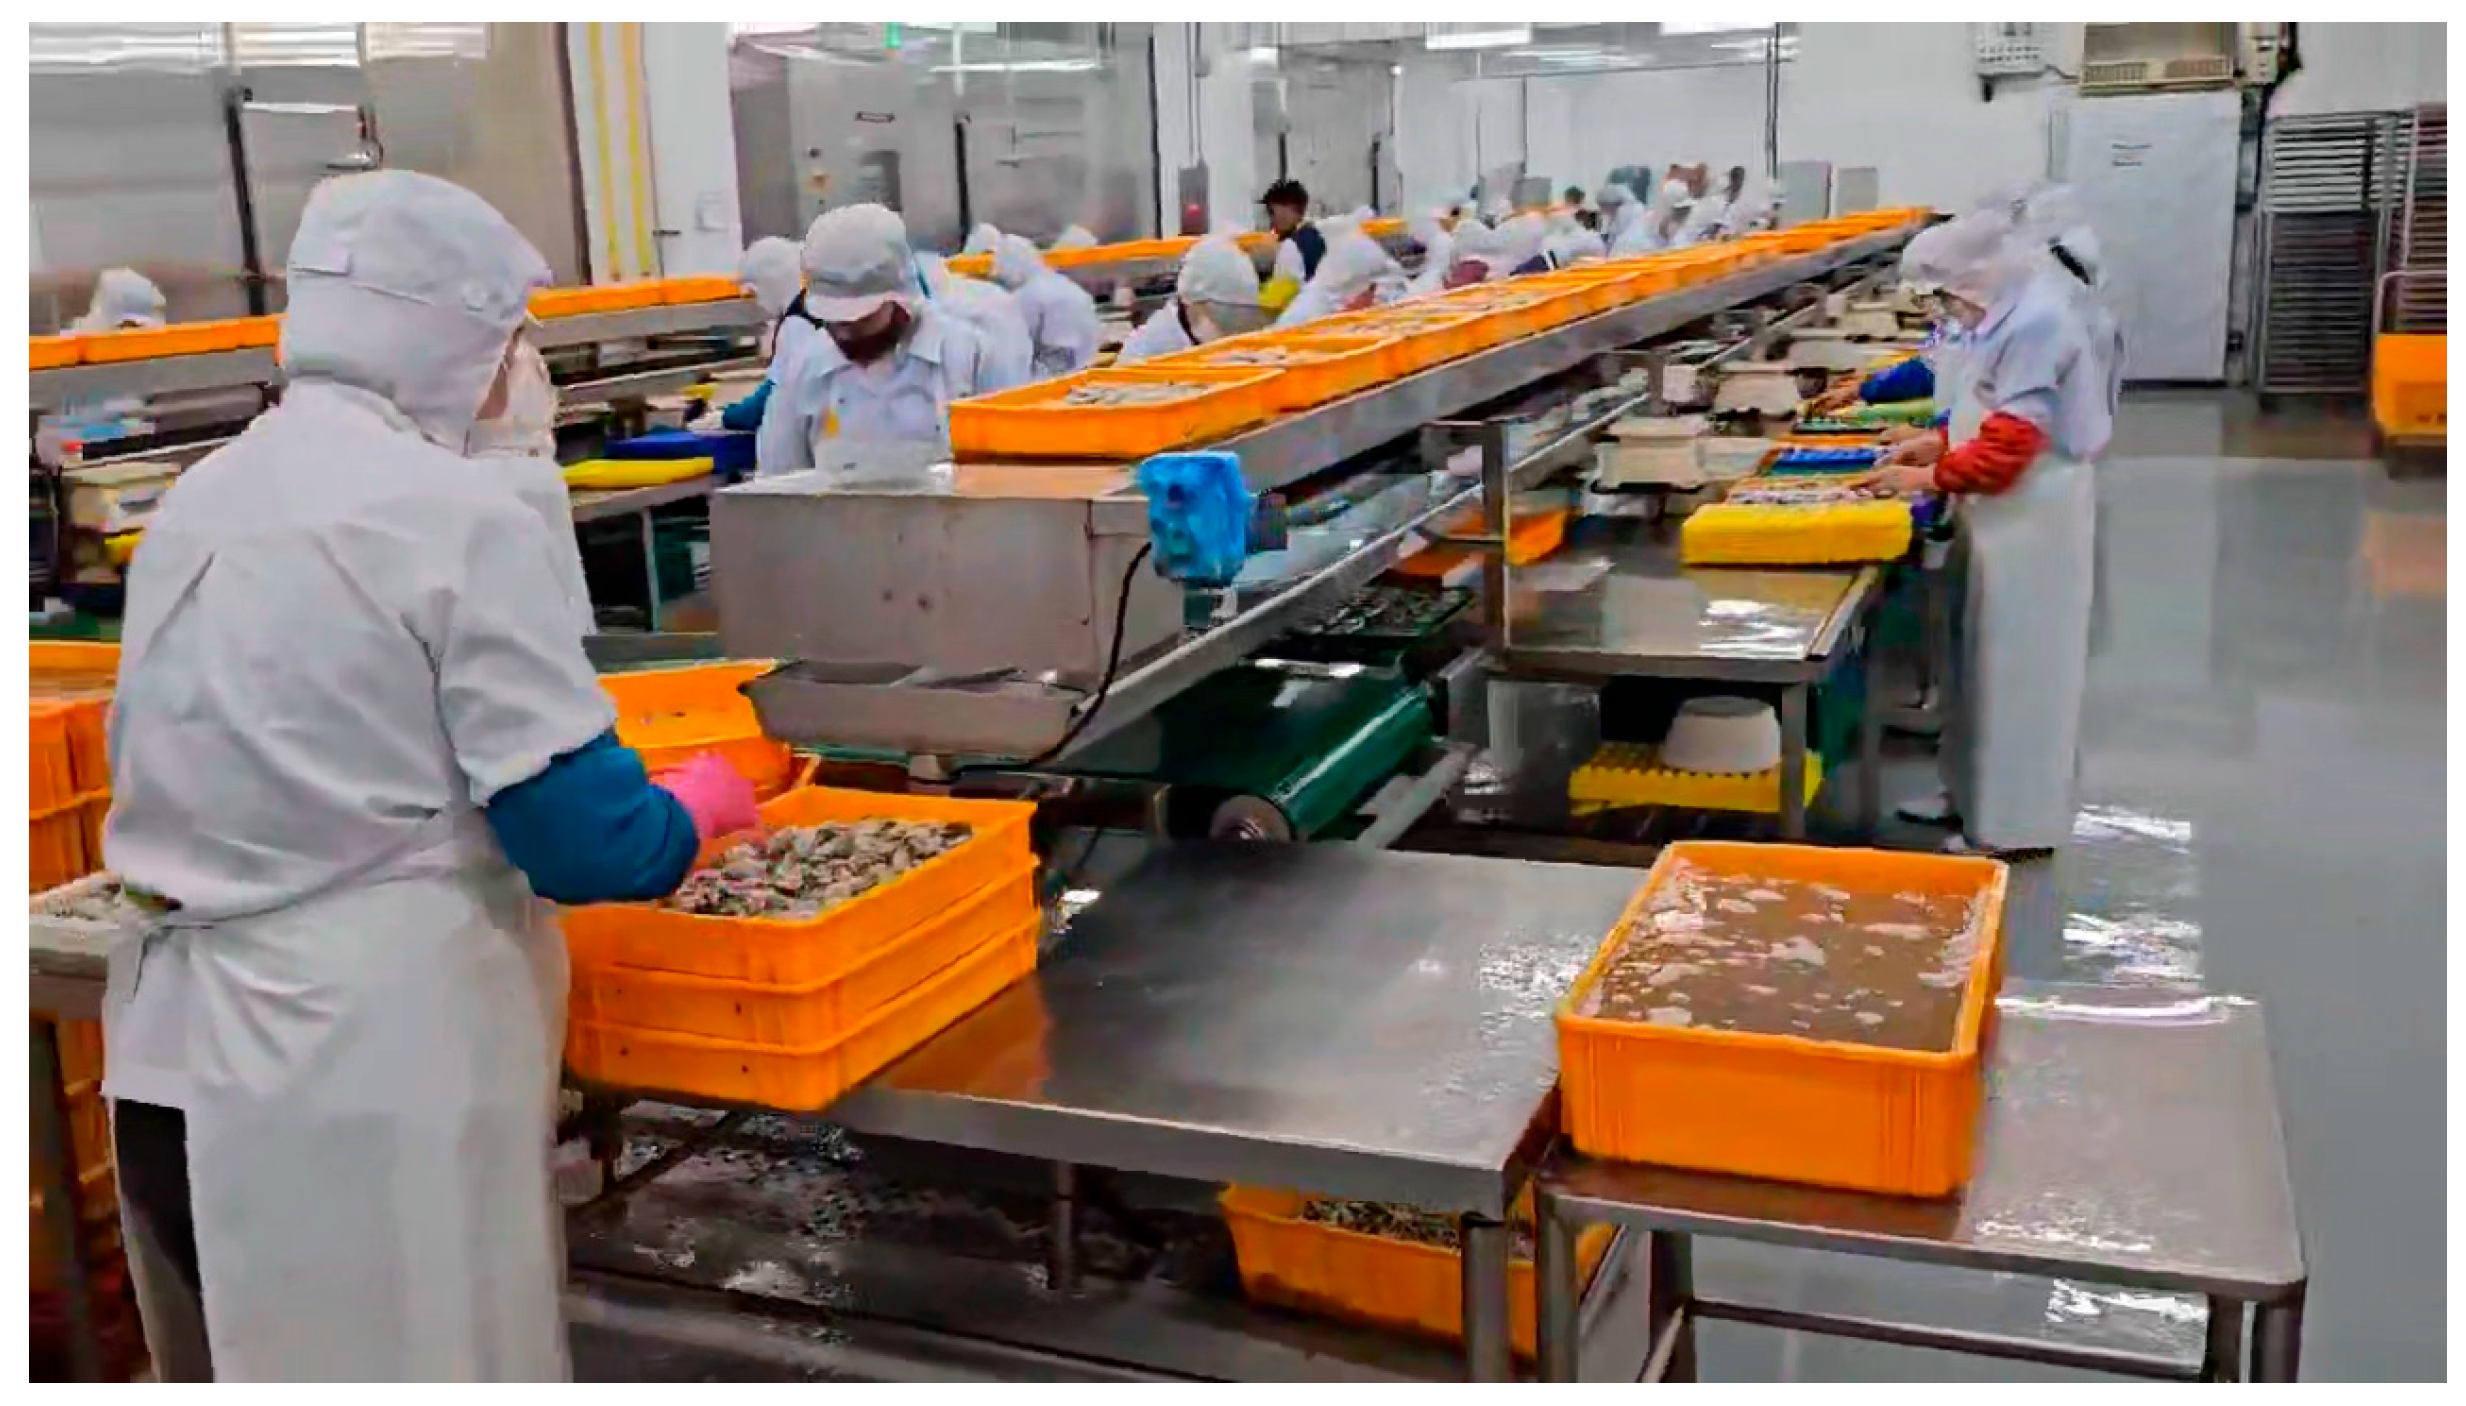
As shown in Figure 1, the conventional oyster classification process relies on electronic scales and the subjective judgment of workers to classify oysters into large, medium, and small categories. The classified oysters are then placed into fixed molds to maintain their shape and prevent physical damage during freezing [7]. After classification, the oysters go through a series of processing steps, including rapid freezing, depanning, glazing, refinement, and final packaging for distribution.
Commercial seafood graders typically perform non-contact size/quality sorting on lanes or flumes with vision inspection and pneumatic or mechanical rejection (e.g., SED Vision Grader, Lizotte, GP Graders), delivering high throughput but without closed-loop grasping or tray placement [8,9,10]. In academia, recent oyster and shrimp studies emphasize deep-learning segmentation or recognition for quality/biomass estimation and counting—such as U-Net–based oyster contour/quality analysis, robotic oyster recognition with motion prediction on conveyors, and camera-based shrimp counting/weight estimation—again focusing on classification rather than gentle pick-and-place [11,12,13,14]. By contrast, our system integrates a lightweight classical vision pipeline (adaptive thresholding with distance-transform watershed and image moments for grasp-point estimation) with a delta-robot (parallel robot) and a soft, drainage-textured gripper, enabling direct manipulation of wet, deformable oysters from a moving belt into trays under partial overlaps—thus obviating dataset collection and labeling, meeting hygiene requirements with a soft, drainage-textured gripper, and enabling end-to-end pick-and-place under mild clutter, using only classical vision.
This study proposes an automated oyster size classification process to replace the conventional manual oyster production method with a smart automation process using a parallel robot. Targeting oysters conveyed after the washing stage, an integrated automation system was developed and analyzed from the perspective of productivity, enabling continuous production through automated size classification and grasping. To achieve this, a vision-based algorithm was proposed as a core technology to accurately detect and grasp oysters in real time, despite their varying shapes and orientations. Using this algorithm, a pick-and-place system employing a parallel robot was controlled to perform precise classification and automatic placement into fixed molds. The performance of the proposed system was validated through experimental evaluations and simulations of the core technologies, demonstrating significant improvements in classification accuracy and operational efficiency compared to manual processing.

2. System Configuration of an Automated Oyster Classification Process

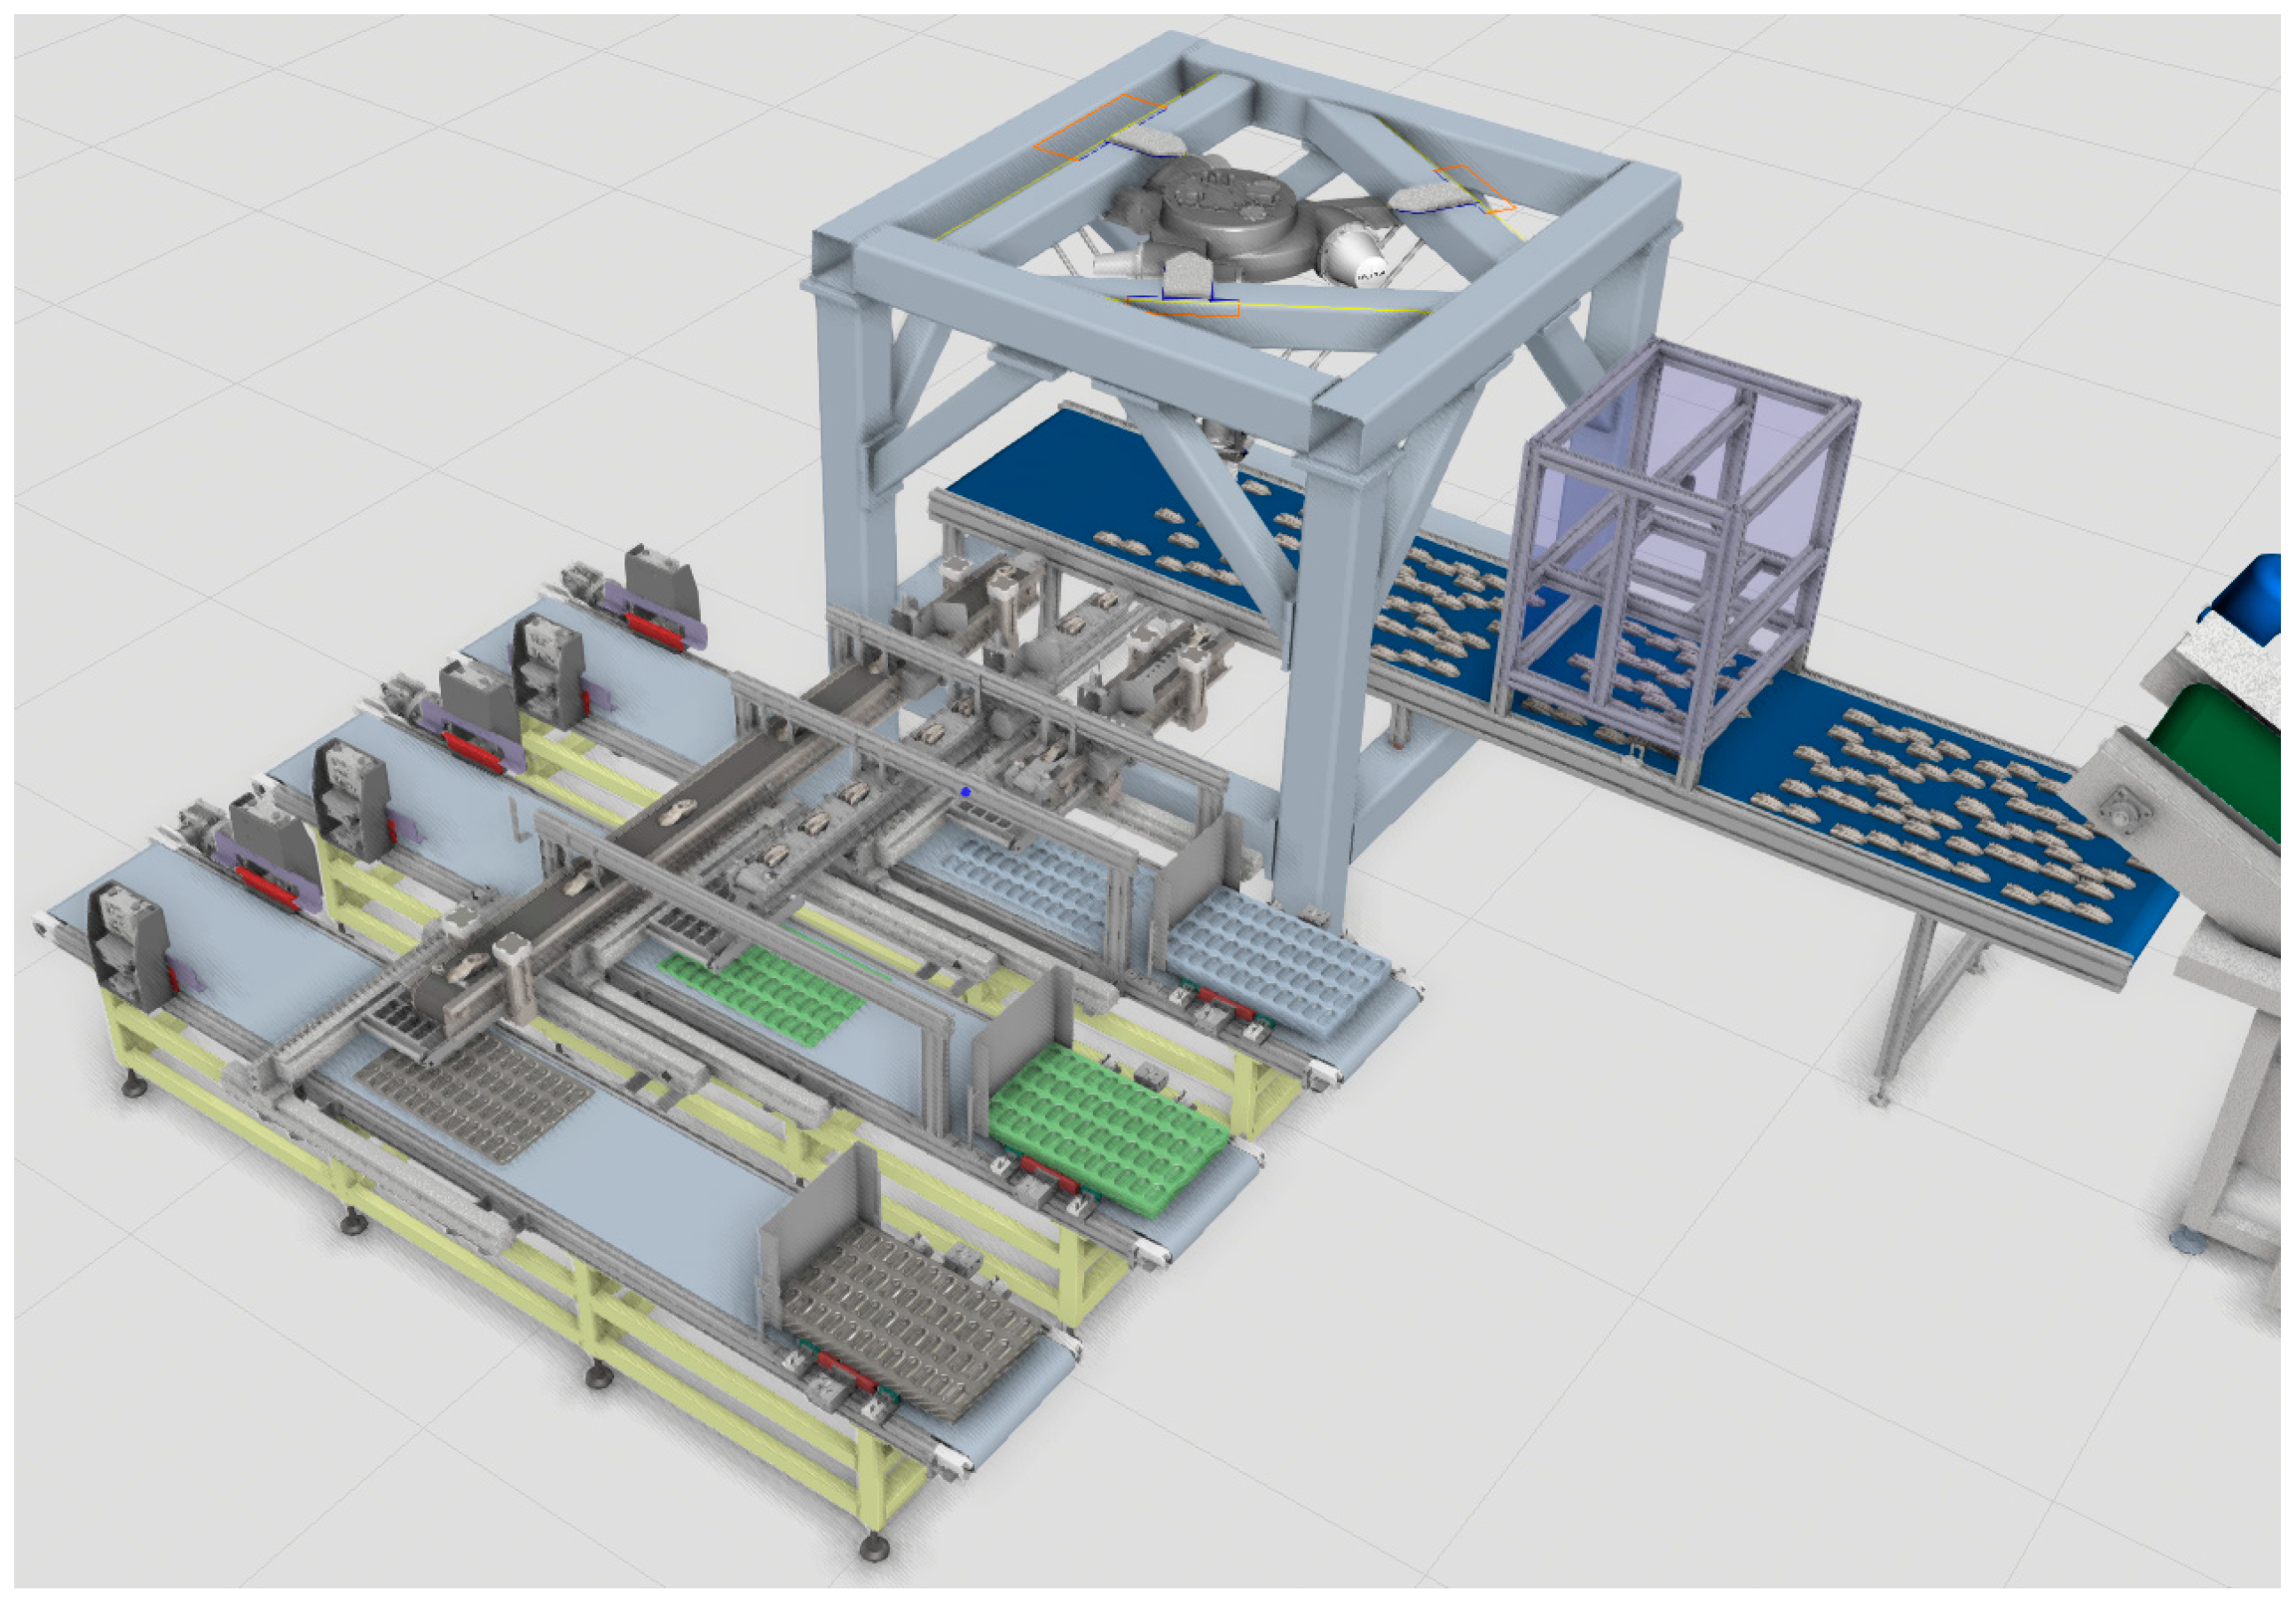
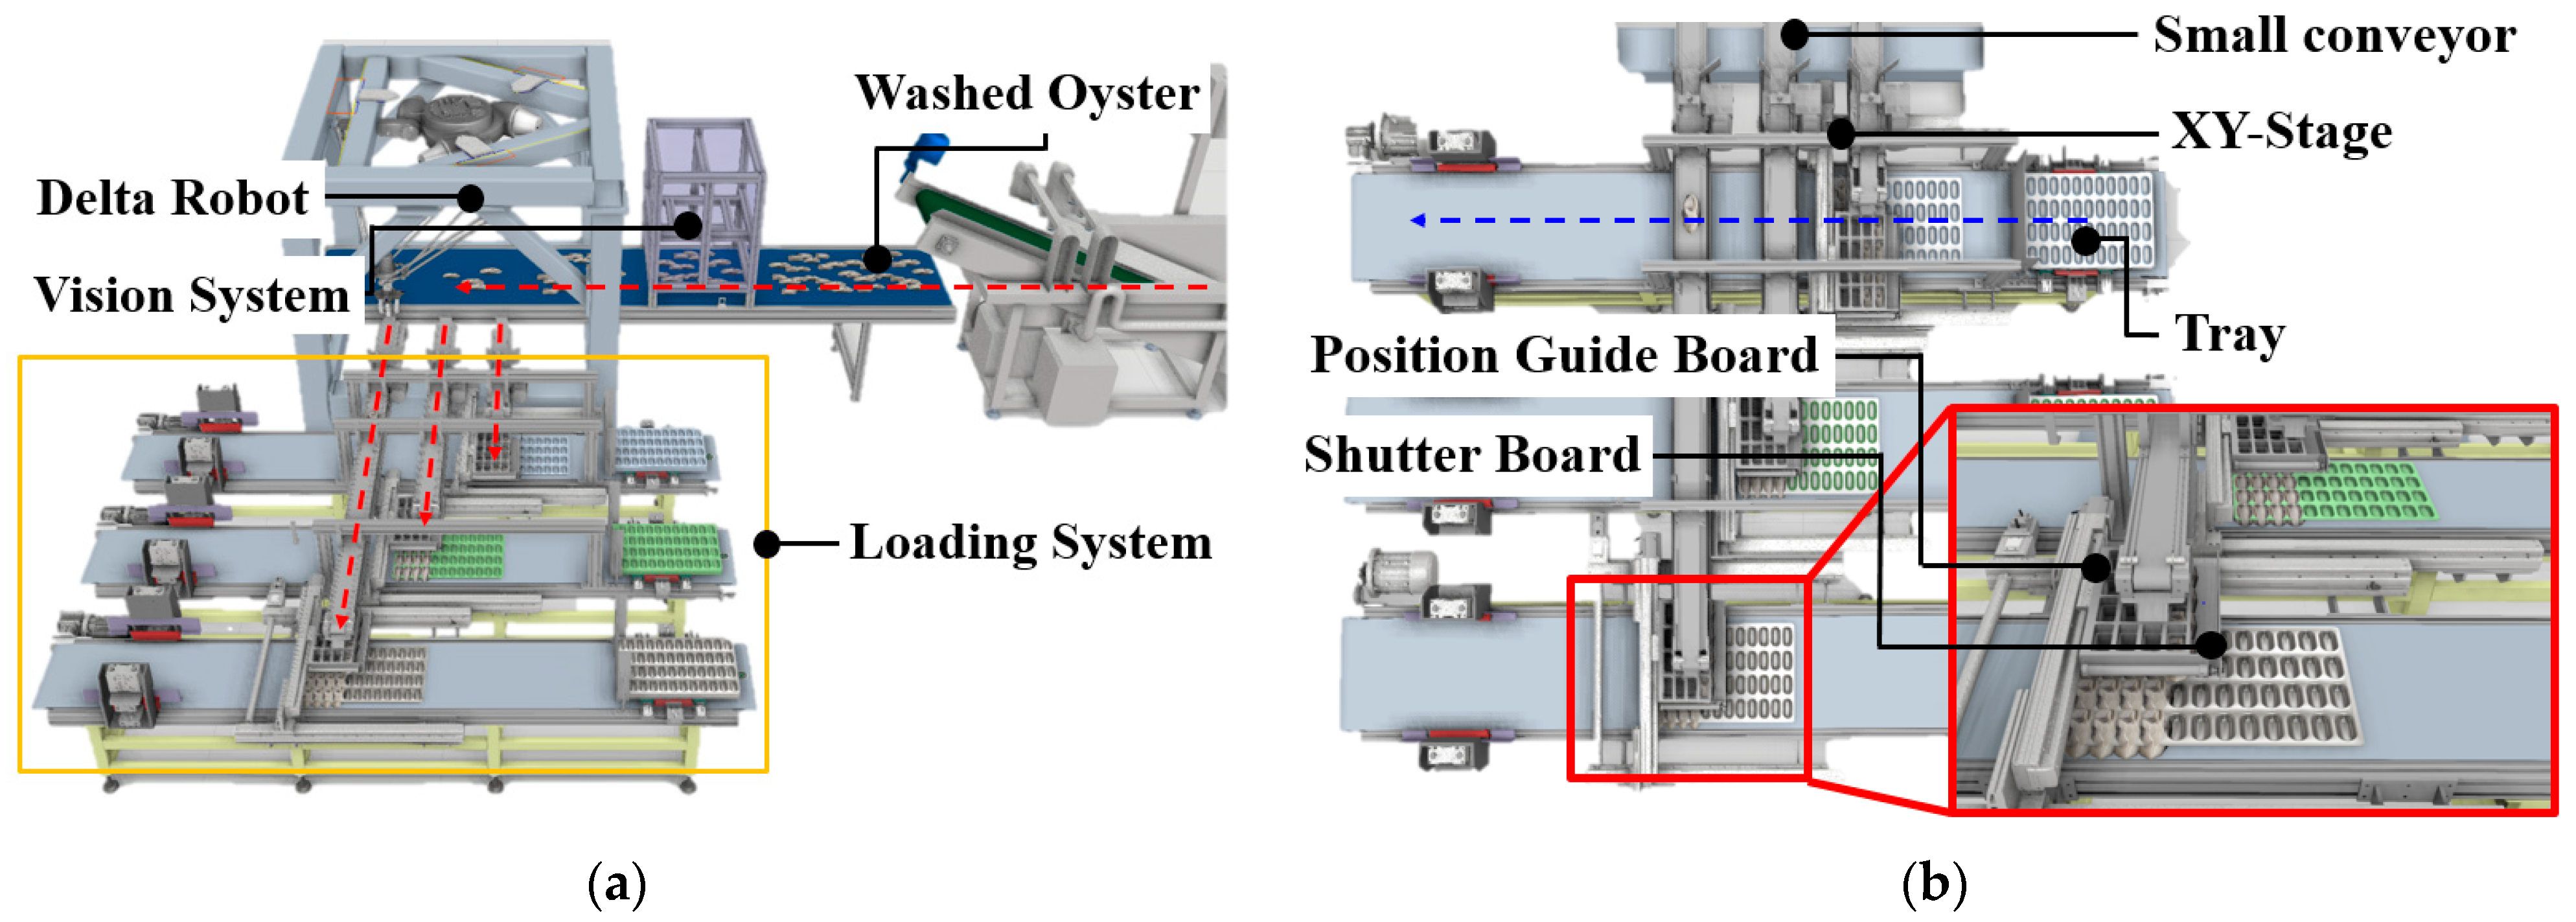
The automated oyster classification system was developed to streamline the process of oyster production by automating the classification of washed oysters by size and loading them into trays in preparation for rapid freezing. Figure 2a shows the configuration of the developed system, which consists of a vision system, a delta robot (KR3 D1200 HM, KUKA in Augsburg, Germany), and a loading system [15]. After the oysters are washed, they are transported via a conveyor to the vision system, where object detection and coordinate recognition are performed. The vision system classifies each oyster into one of three size categories—large, medium, or small—and transmits the corresponding size and positional data to the delta robot for classification. The delta robot, equipped with a soft gripper, then picks up the oysters within the designated workspace and places them onto one of the small conveyors assigned to each size category. These small conveyors subsequently transfer the oysters to the loading system. To ensure precise placement, the conveyor is temporarily paused during each robot operation cycle. Figure 2b illustrates the structure of the loading system. It is designed to accurately load the transferred oysters into trays and is composed of an XY-stage, a position guide board, and a shutter board. Both the position guide board and the shutter board are mounted on the XY-stage and can move along the X and Y axes. The system is structured with three separate lines to handle each oyster size category independently, enabling parallel and efficient loading operations.
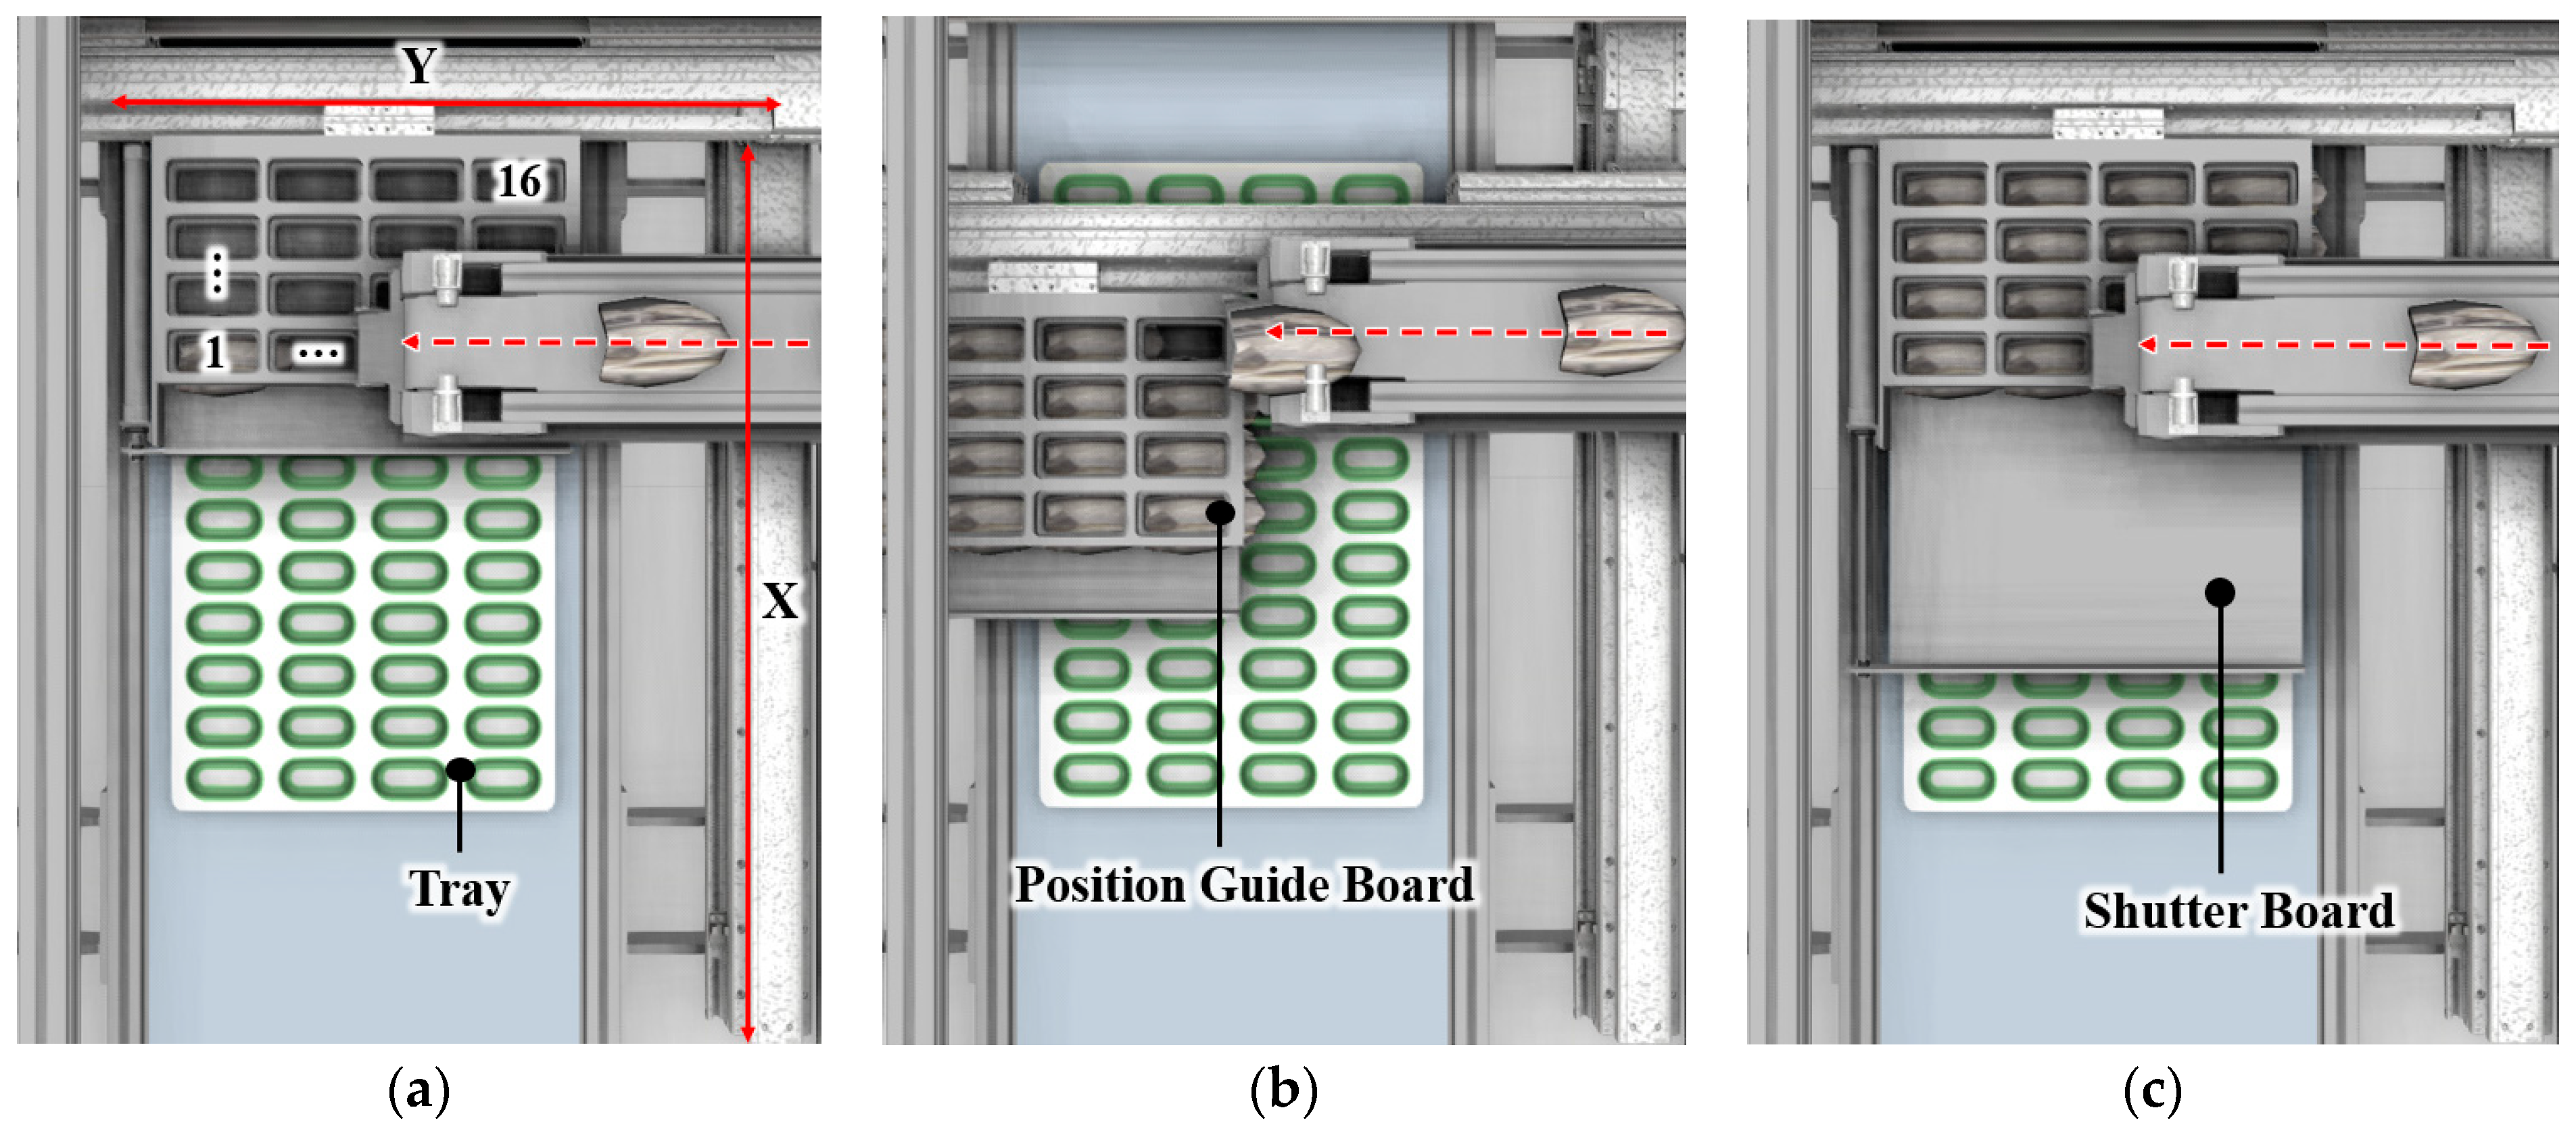
Figure 3 illustrates the loading system. It consists of an XY-stage, a position guide board, and a shutter board, which together enable the transferred oysters to be accurately loaded into trays. Both the position guide board and the shutter board are mounted on the XY-stage and are designed to move along the X and Y axes. Since the loading system sorts oysters into large, medium, and small categories, it is structured into three separate lines: the Large-line, Medium-line, and Small-line [16].
Figure 3a shows oysters being placed onto the position guide board while the shutter board remains closed. At the same time, an empty fixed tray is positioned beneath the XY-stage via the conveyor. Figure 3b depicts the position guide board moving along the X and Y axes to arrange 16 oysters in their designated positions. Figure 3c illustrates the moment when, after all 16 oysters have been placed on the guide board, the shutter board opens to load the oysters into the fixed tray. This operation is repeated three times, and once a total of 48 oysters have been loaded into the tray, the filled tray is discharged via the conveyor.
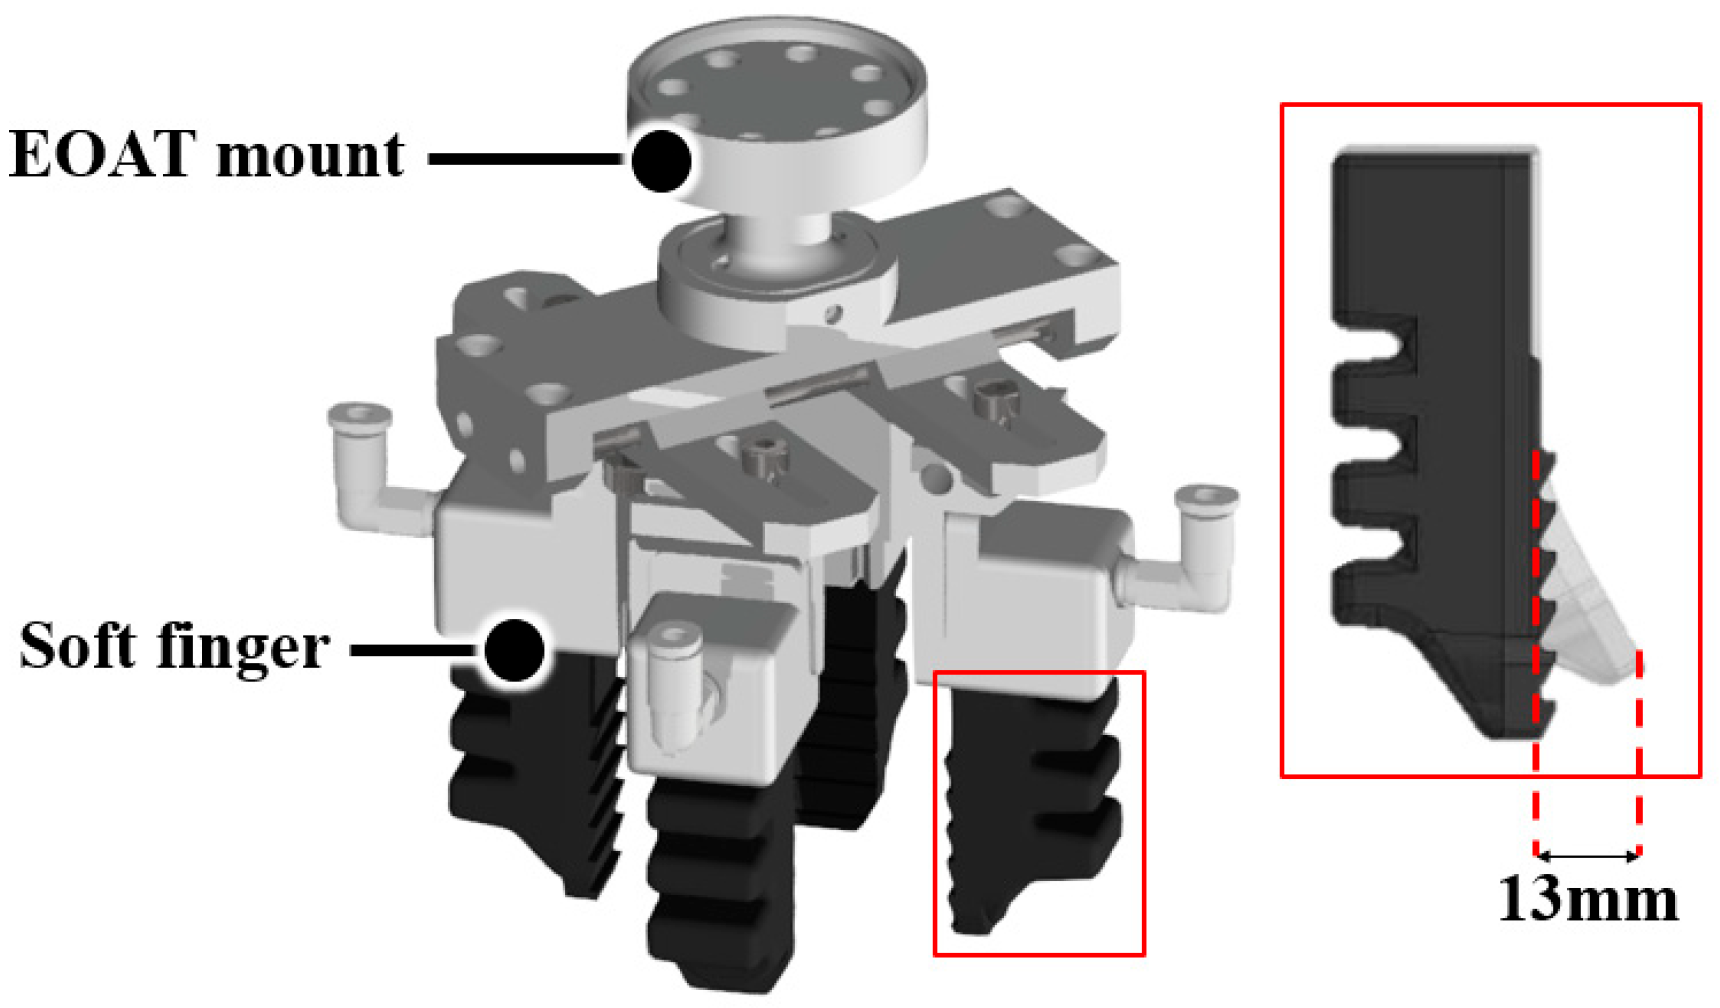
Figure 4 illustrates the soft gripper applied to the system. To effectively grasp oysters, the gripper was equipped with four soft fingers (F-B4T/LS8[P], Rochu in Zhangjiagang, China). When positive pressure is applied to the soft fingers, they bend inward toward the center, thereby converging toward the center of the gripper to securely hold the oyster. In addition, protrusions are formed on the contact surfaces with the oyster, which help prevent slippage or downward movement after grasping [17].

3. Automated Pick-and-Place System for Oyster Size Classification

3.1. Flowchart of Automated Pick-and-Place System for Oyster Size Classification

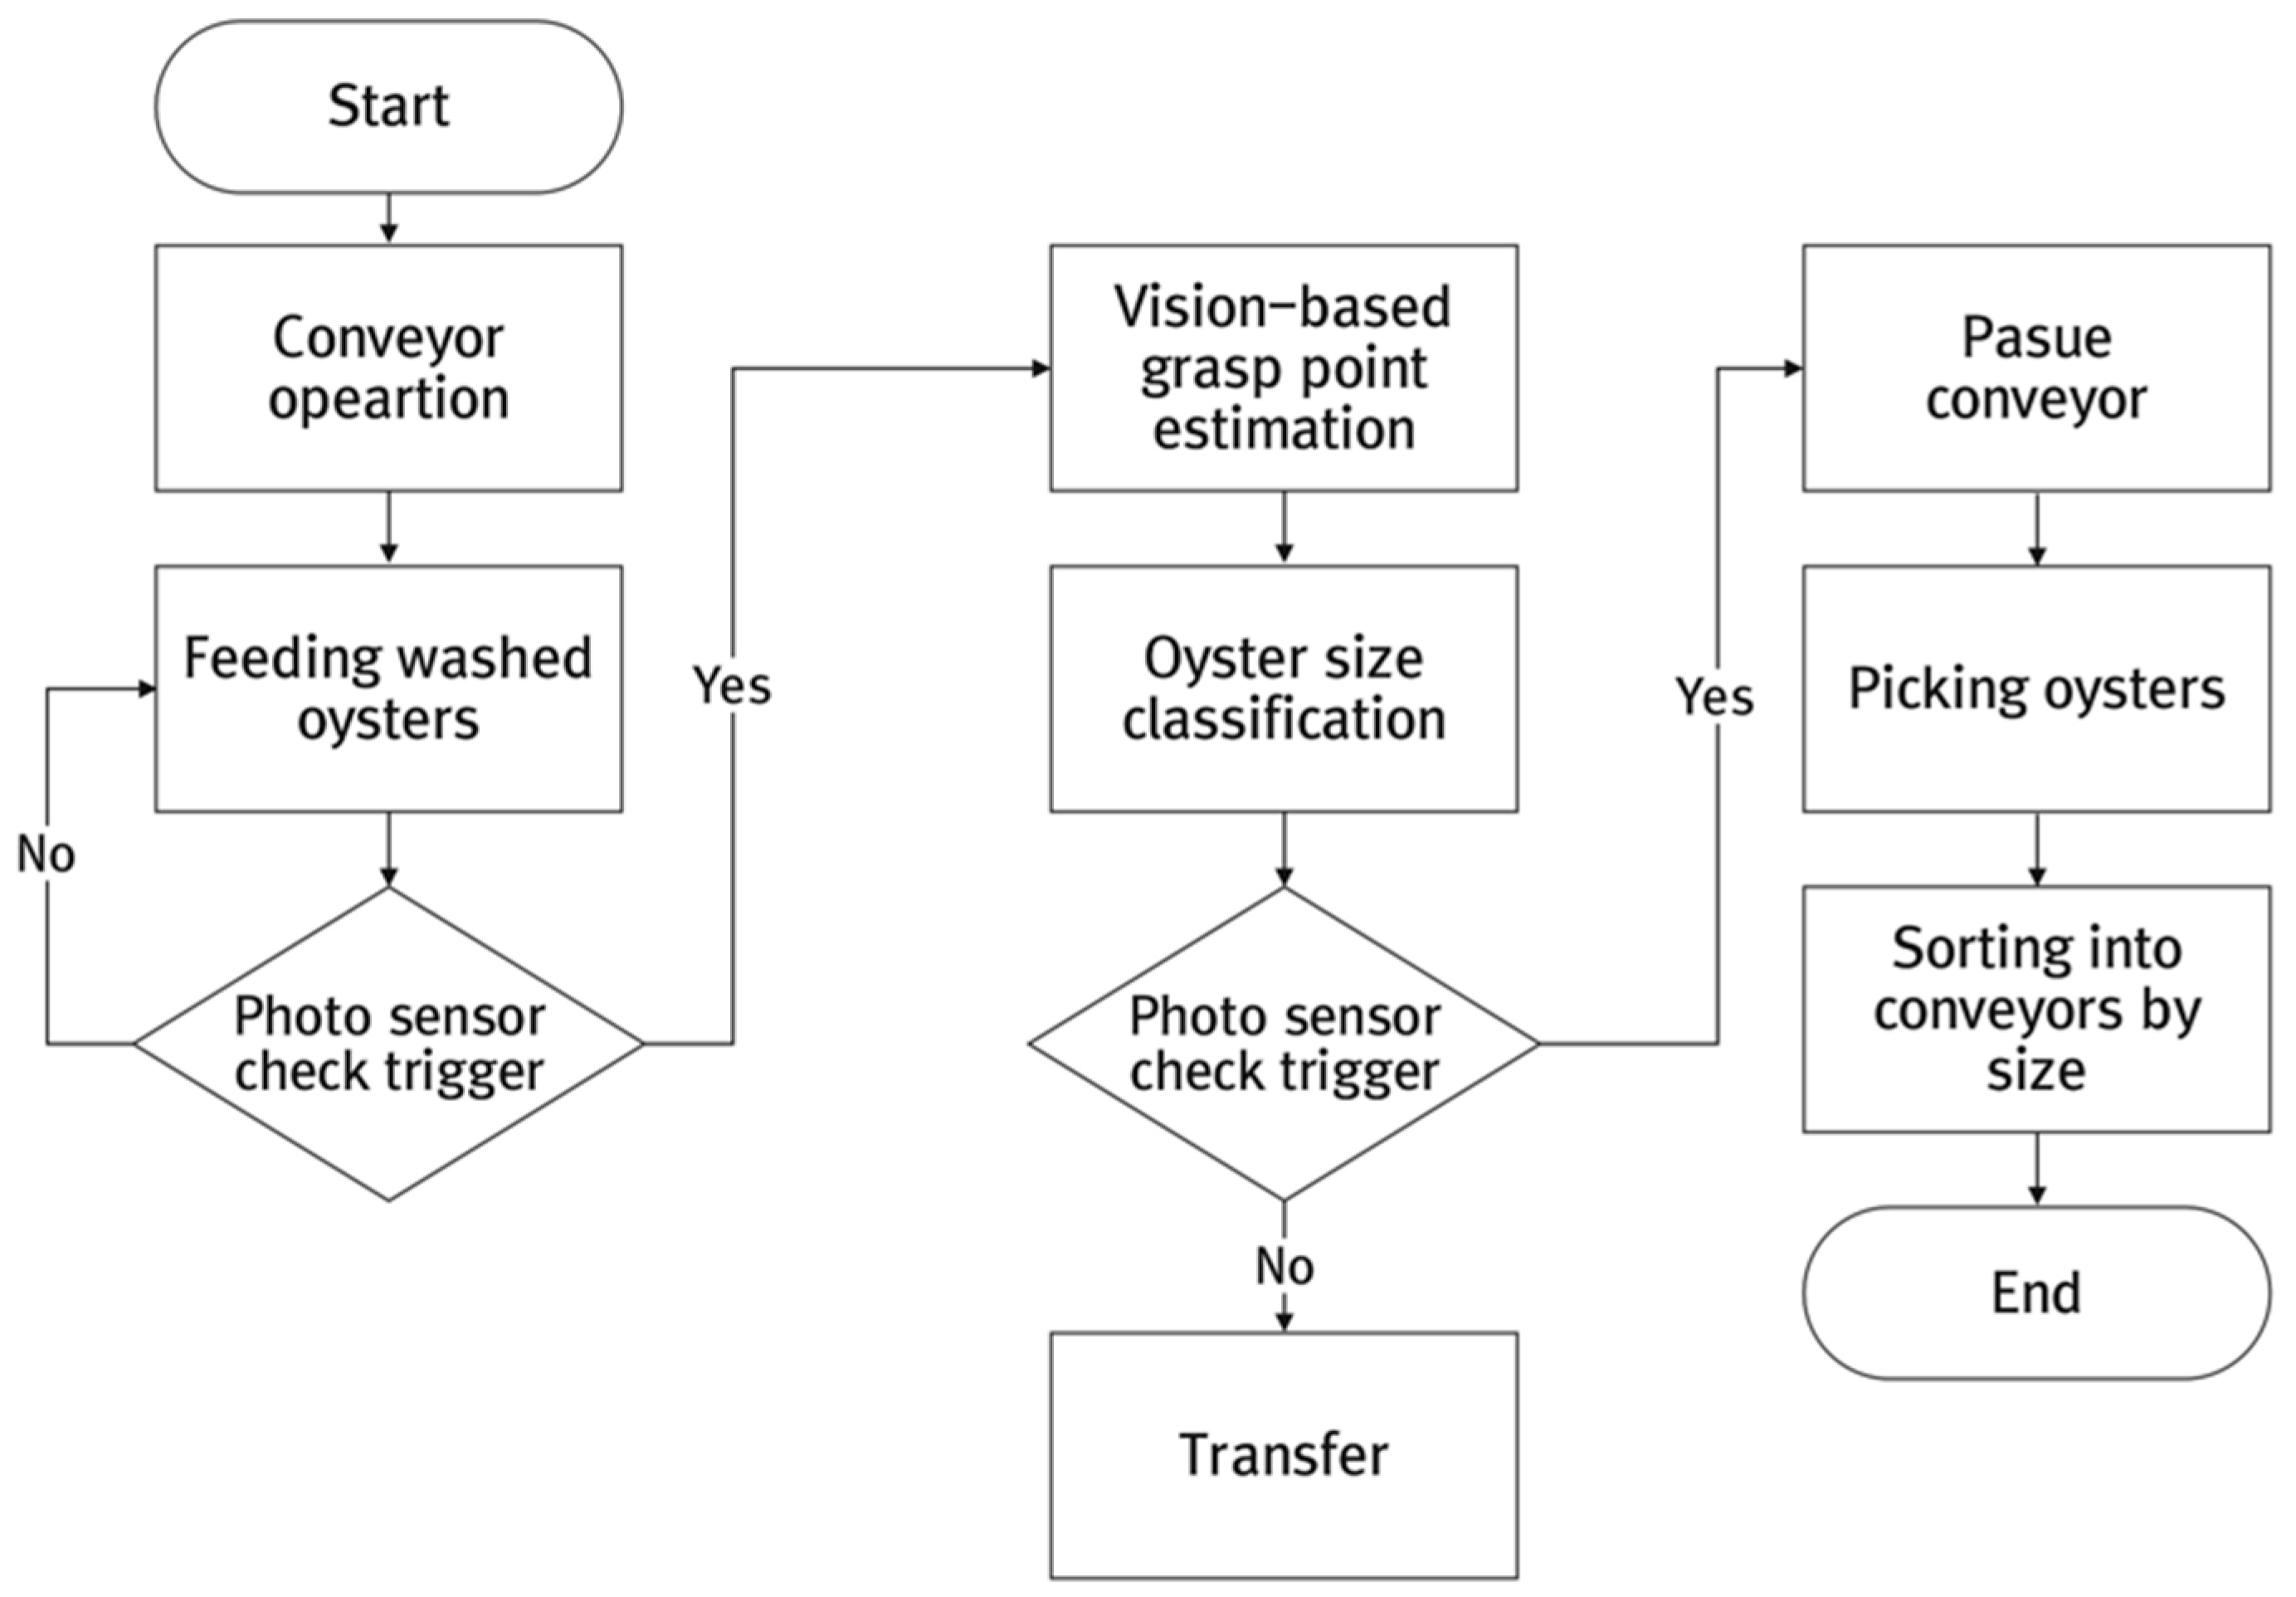
Figure 5 illustrates the flowchart of the automated pick-and-place system for oyster size classification. Washed oysters are delivered via a conveyor, and when a signal is detected by a photo sensor that confirms oyster input, a vision camera inside a dark room for the vision process identifies the size and grasping point of each oyster. Here, it was assumed that, since the cleaned oysters are positioned randomly on the conveyor, the operator rearranges those that are overlapped or located outside the recognition area to ensure accurate detection of the oysters. Using a parallel robot, the oysters are grasped and placed onto separate conveyors according to their size. The oysters placed on each size-specific conveyor are then transported and loaded into trays through a dedicated loading mechanism.

3.2. Vision-Based Grasp Point Estimation Algorithm and Size Classification Method

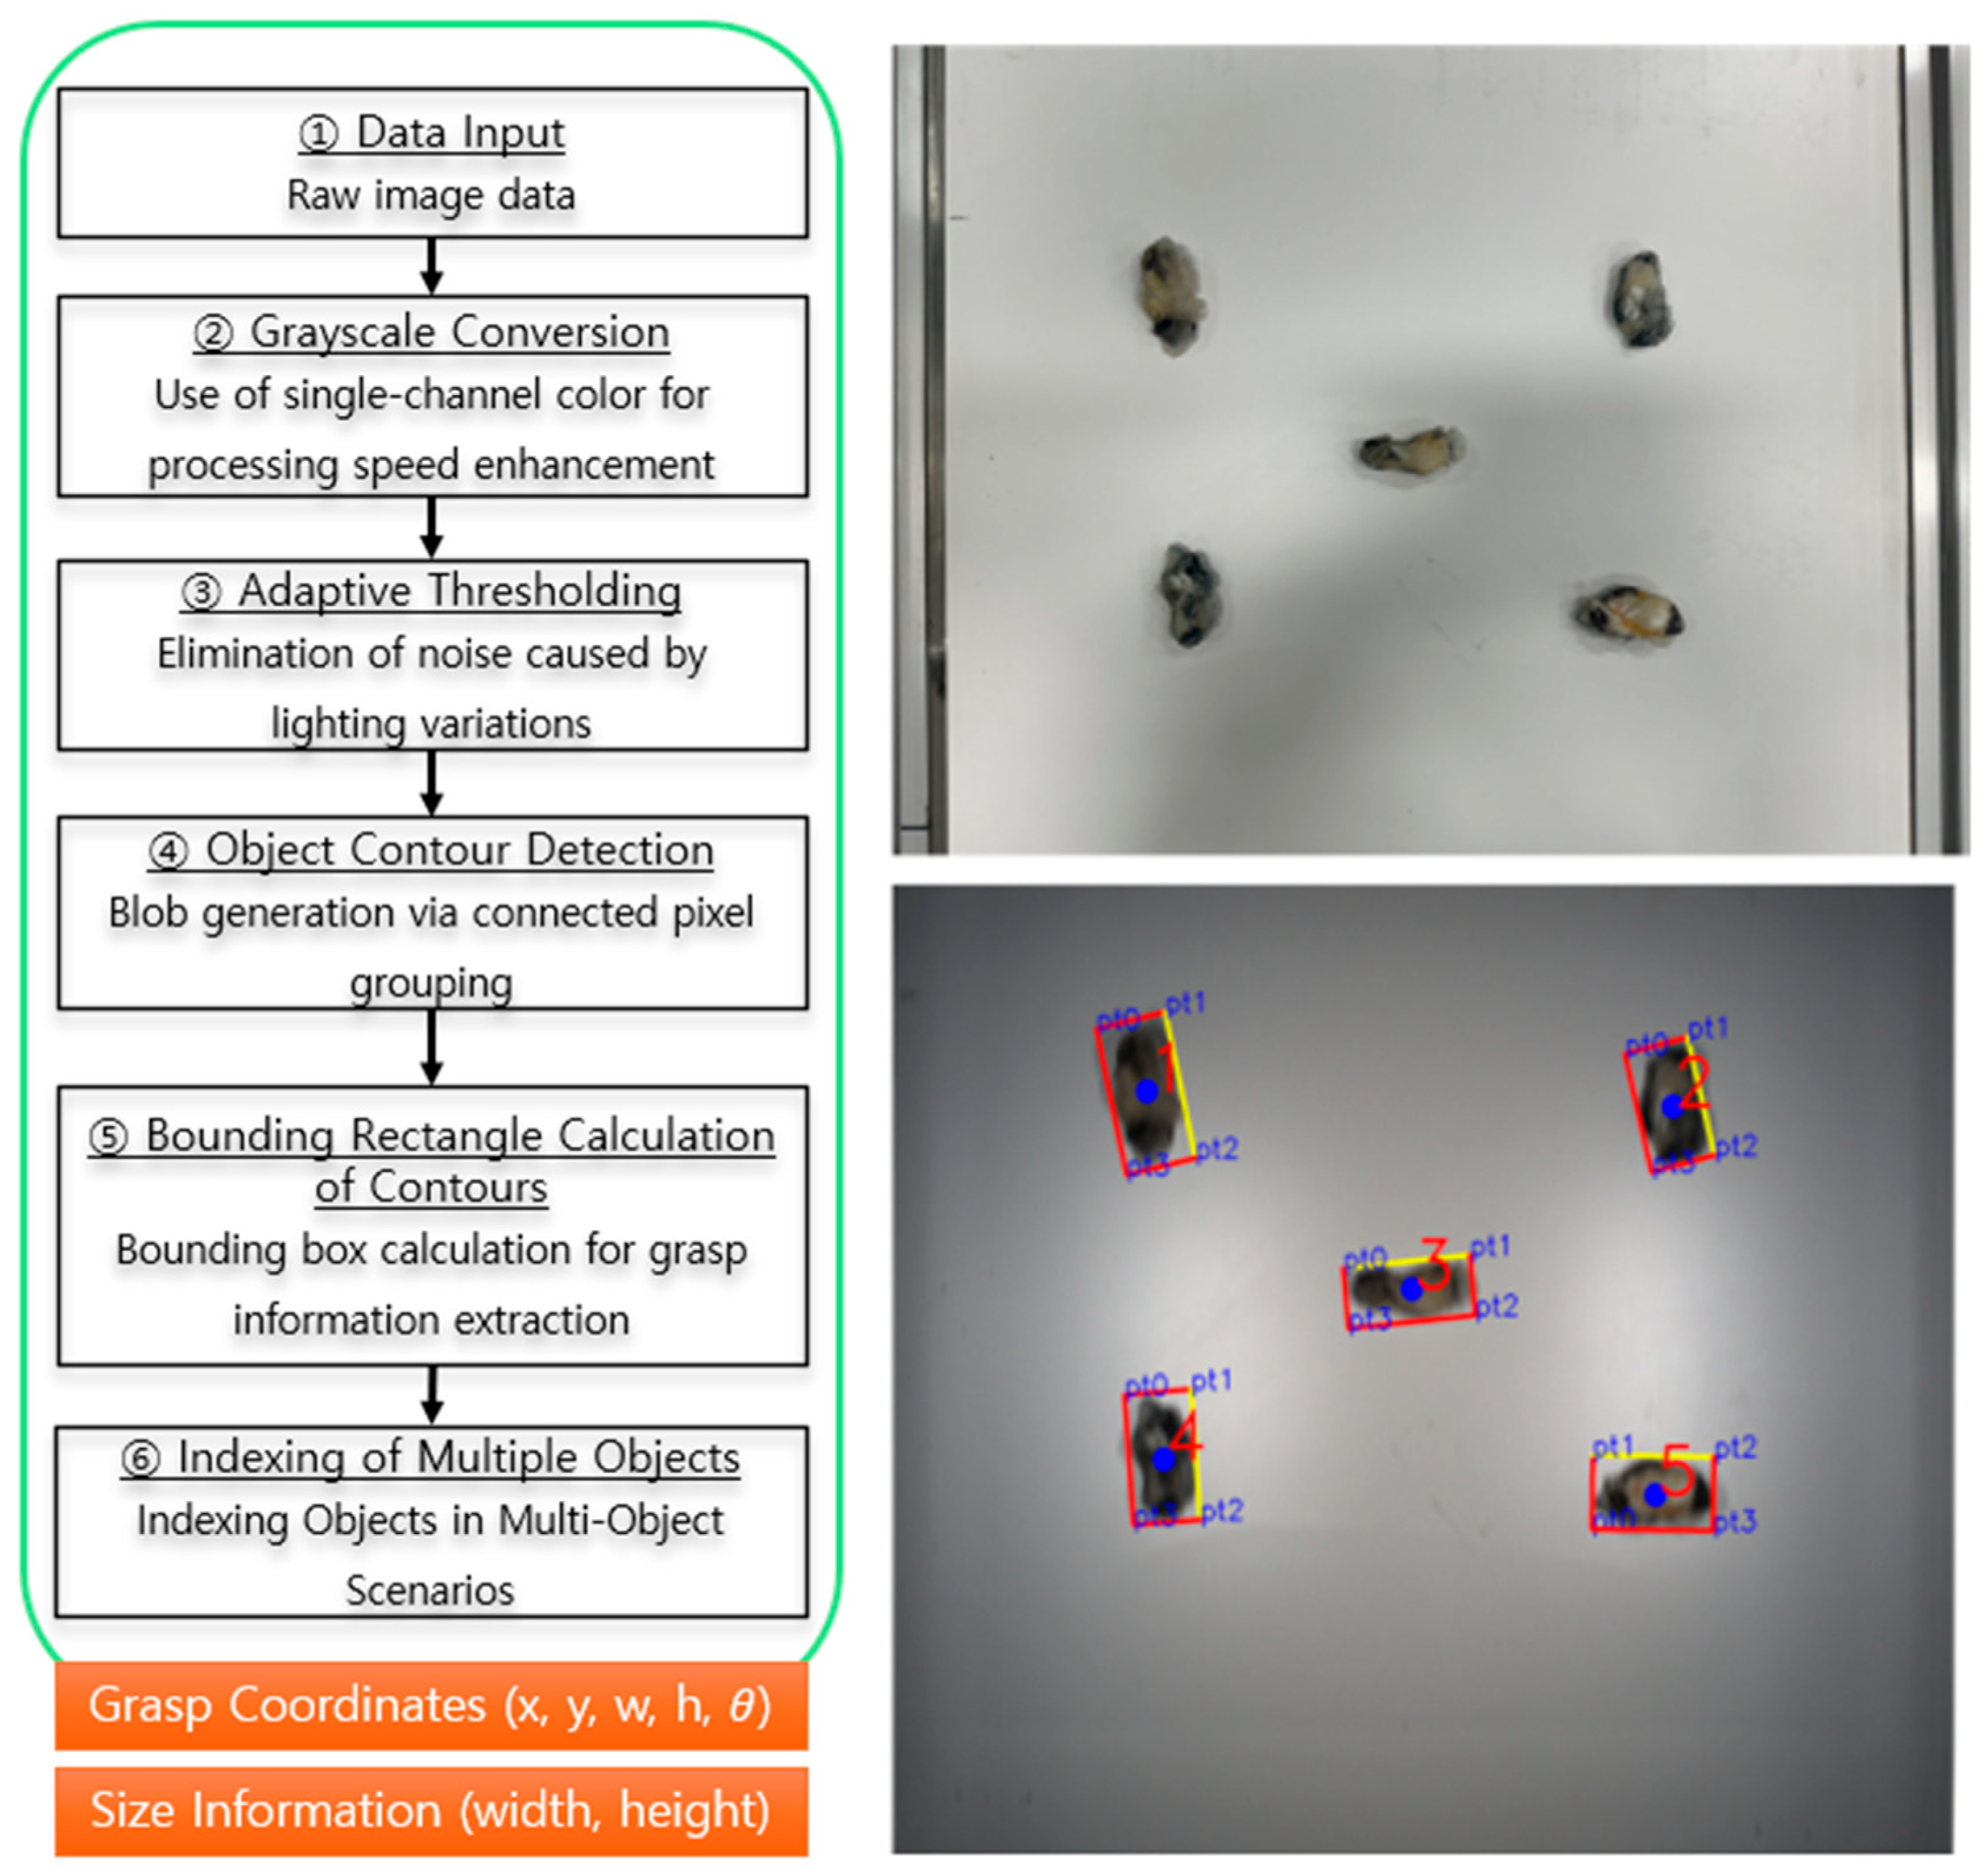
The algorithm for recognizing the size and grasping positions of multiple oysters, which are washed and transported on a conveyor, is structured as shown in Figure 6. To process the entire area of the oysters in transit, a 5 MP camera positioned at a height of 215 mm captures RGB images at 22 frames per second, covering the full width of the conveyor based on the field of view (FOV). To enhance processing speed, the captured RGB images are converted into a single-channel format. The converted images then undergo adaptive binarization and morphological operations to minimize the effects of lighting and generate bounding rectangles, which define regions of interest (ROIs). Within each ROI, image moments are calculated to determine grasping positions, and the size is classified based on the width and height of the ROI. Finally, each oyster in the image is indexed, and grasping position and size information are assigned to each detected oyster.
After defining the bounding rectangle as the region of interest (ROI), the region is binarized and subjected to morphological operations. We then define i x , y { 0 ,   1 } as the binarized pixel value after adaptive thresholding, with i x , y = 1 (white) for foreground pixels and i x , y = 0 (black) for background. Subsequently, all pixels within the ROI can be scanned and summed as shown in Equation (1):
S   = x = 1 ,   y = 1 i x , y  
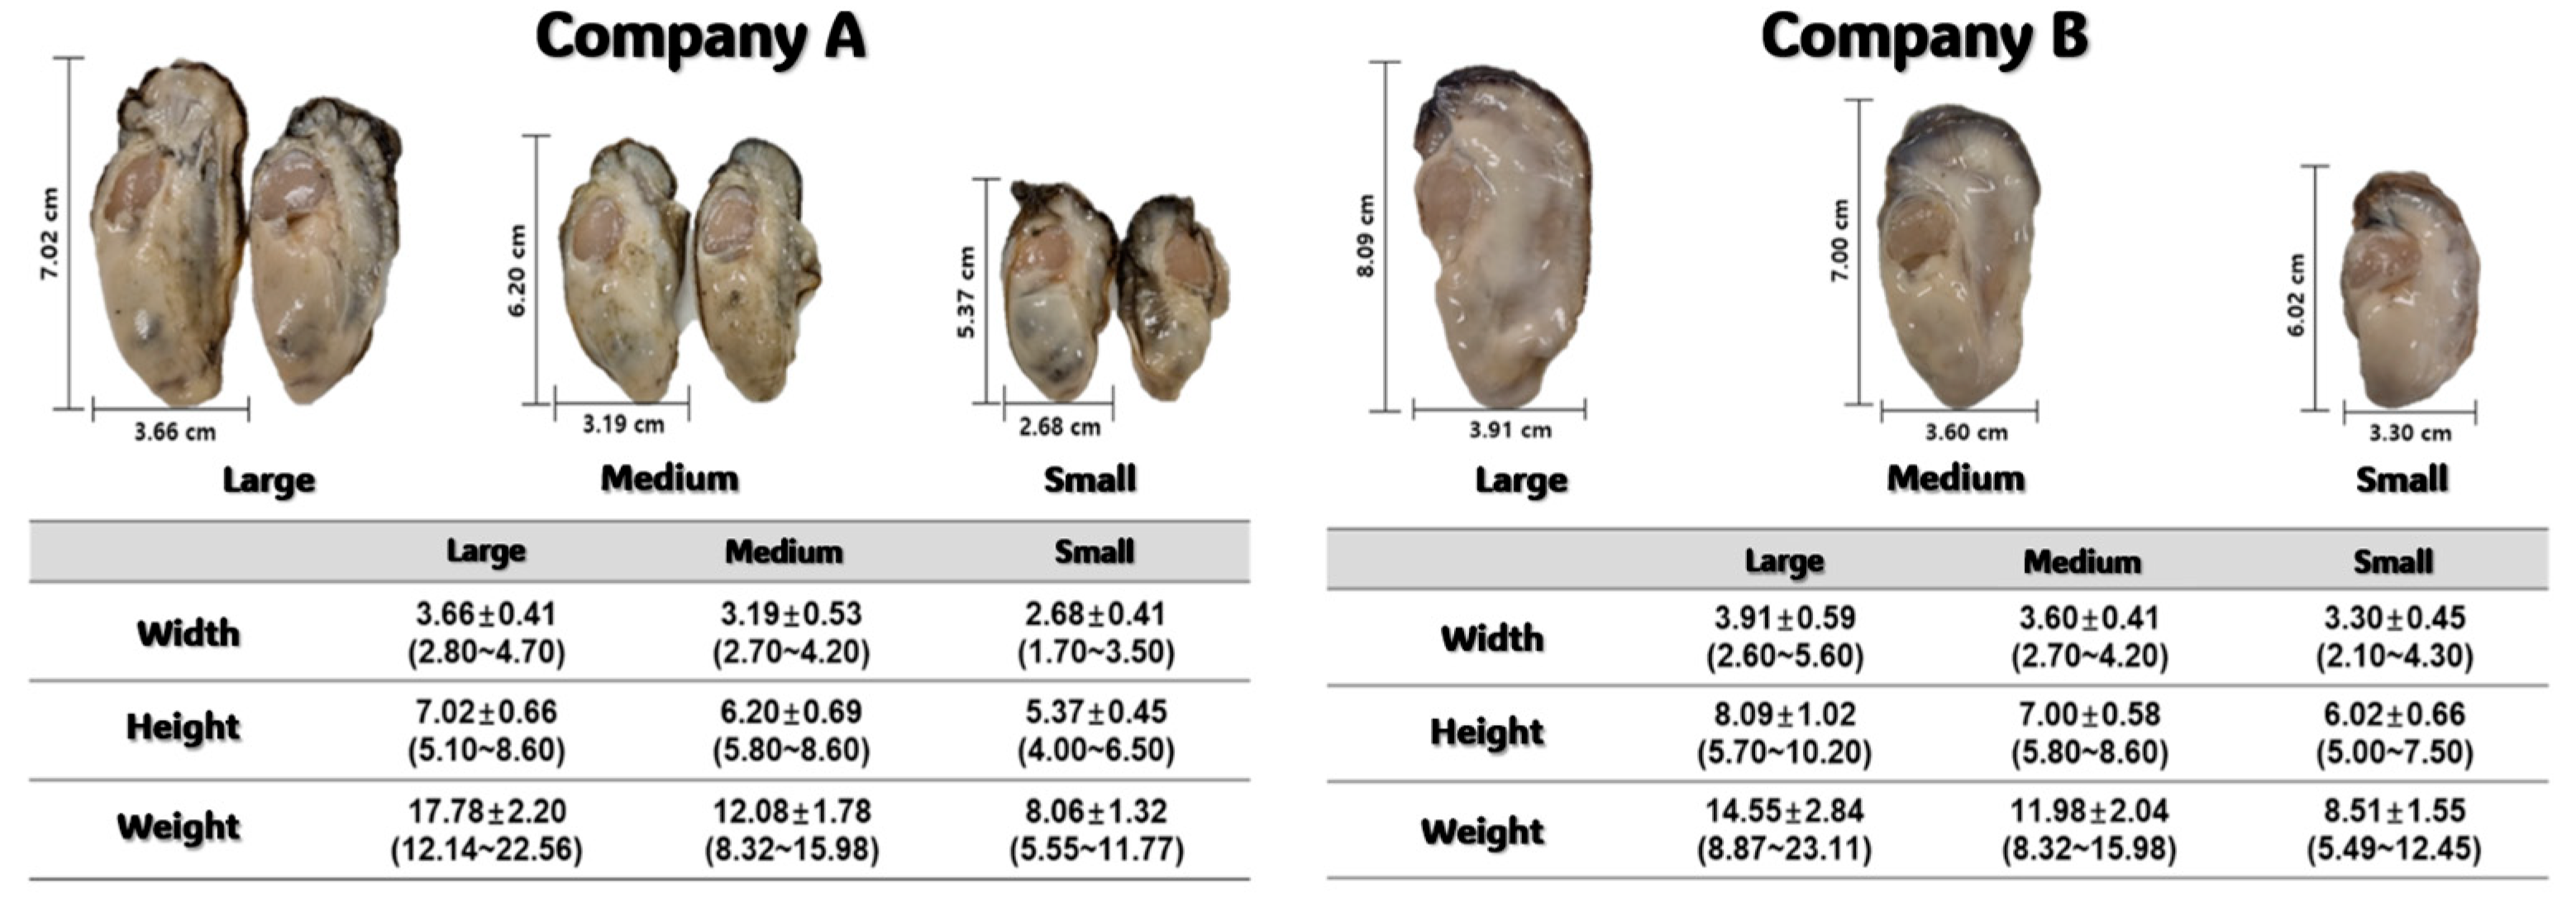
S denotes the area, and i x , y represents the pixel value when the point is 1 (white). The actual size classification was based on oyster area data obtained from seafood processing companies in South Korea, as shown in Figure 7. The results derived from the equations were converted into mm2 area units and then categorized into three size groups: large (L), medium (M), and small (S). Images captured during the experiments depict model oysters whose dimensions were calibrated to match the real-size measurements obtained in our field investigation.
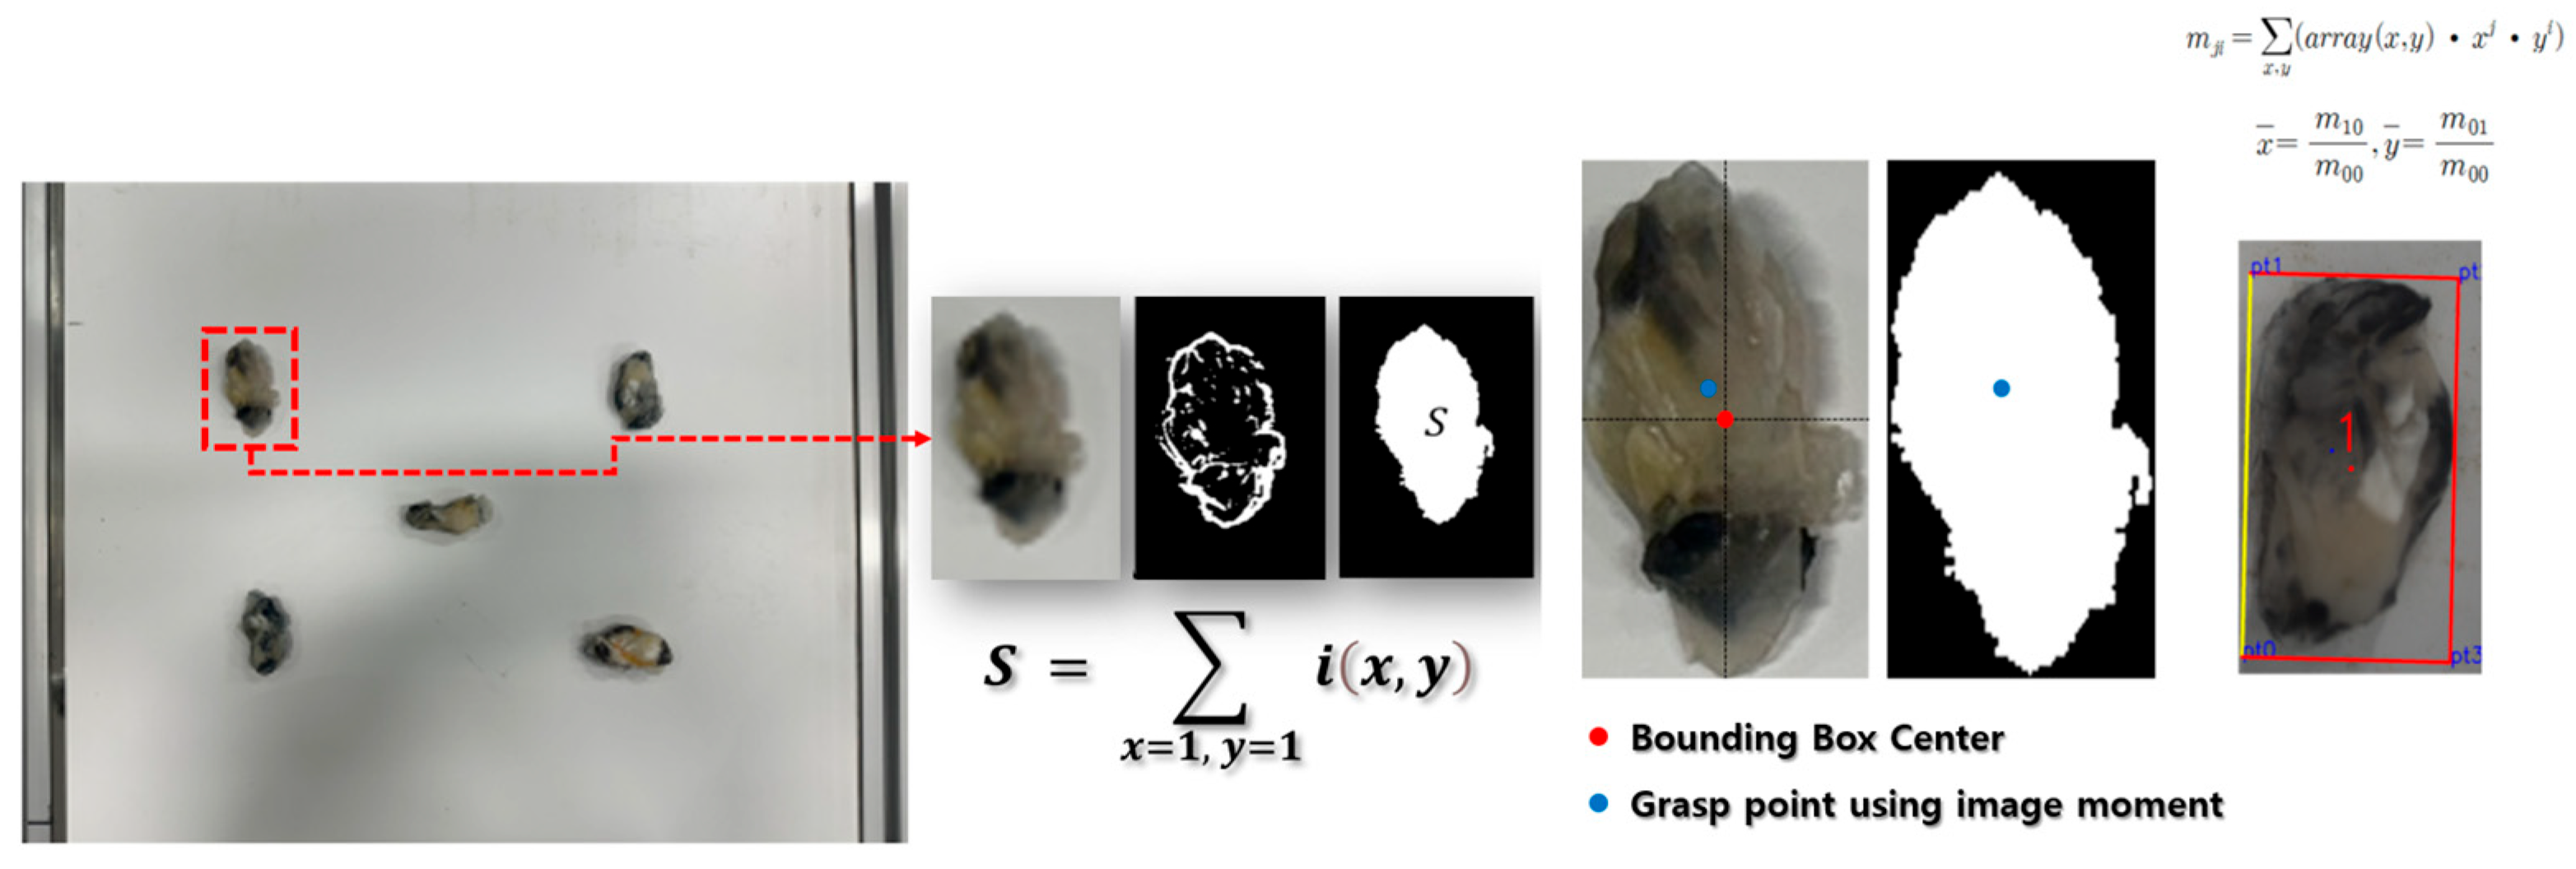
To estimate the grasp point of an oyster based on image data, a bounding rectangle is first generated according to the shape of the oyster. In the initial stage, the center of this bounding rectangle was directly used as the grasp point. However, for asymmetrical or complex-shaped objects, the pixel intensity and mass distribution tend to be unbalanced, making the rectangle center an inaccurate grasp point, especially when the object is rotated or tilted. In addition, when objects overlap, the calculated center may become unreliable. To address these issues, image moments are employed to estimate a more appropriate grasp point. Image moments represent the weighted average of pixel intensities within a region. As illustrated in Figure 8, a comparison between the center of the bounding rectangle (red dot) and the moment-based grasp point (blue dot) shows that the blue point is more suitable for asymmetrical oyster shapes. The spatial moment m j i is calculated using Equation (2), and the centroid coordinates corresponding to the grasp point ( x ¯ , y ¯ ) are derived using Equation (3):
m j i = x = 1 ,   y = 1 i x , y · x j · y i
x ¯ = m 10 m 00   ,   y ¯ = m 01 m 00

3.3. Transformation of Vision-Based Coordinates to Robot Workspace Coordinates

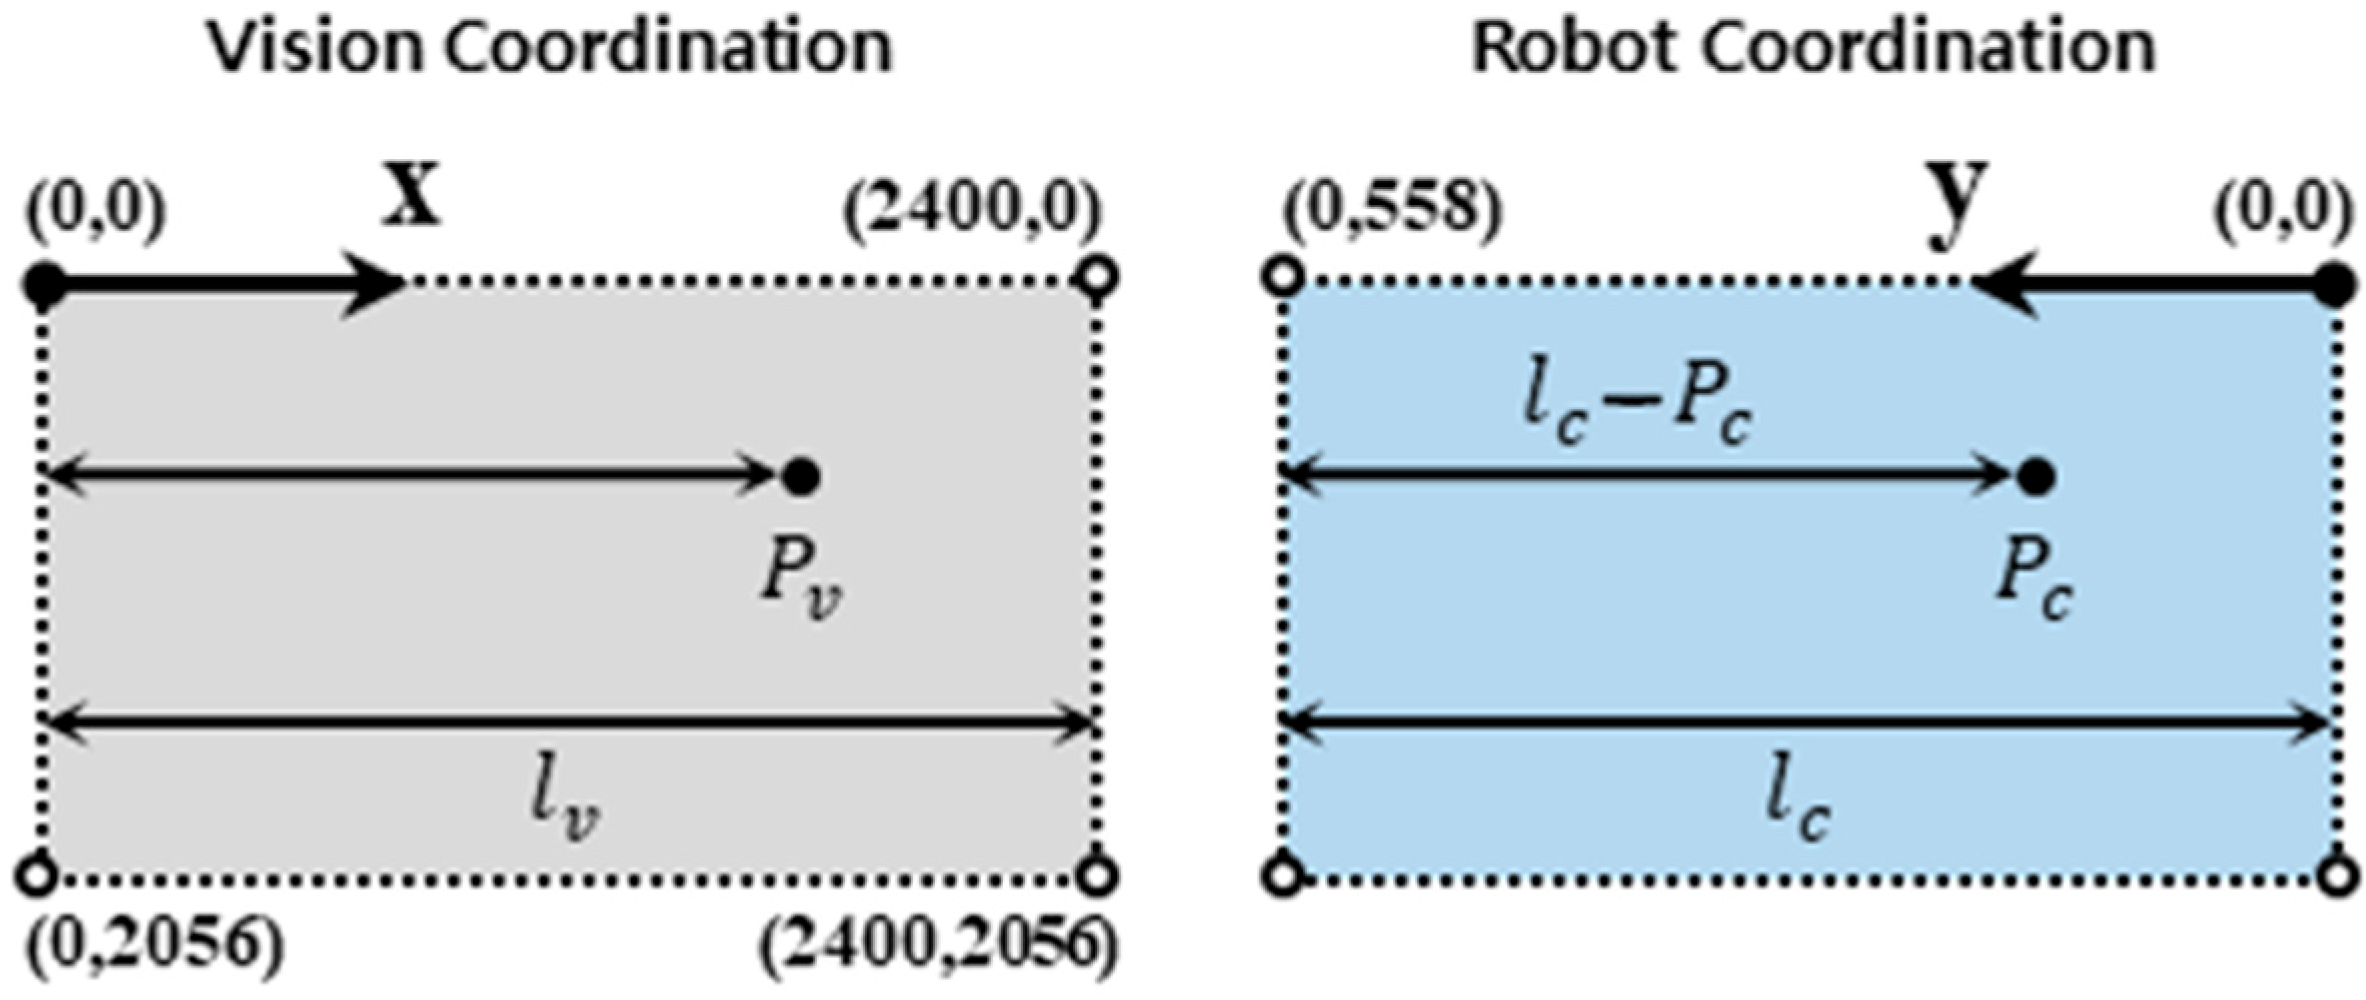
The coordinates recognized within the camera’s field of view must be transformed into coordinates corresponding to the conveyor belt so that the robot can grasp oysters on the conveyor. Figure 9 illustrates the vision camera area along with the corresponding conveyor area. In the vision camera coordinate system, the origin is located at the top-left corner, with the x-value increasing toward the right. l v denotes the width of the vision camera image, and P v represents the position of an oyster within the camera area. In contrast, the conveyor coordinate system has its origin at the top-right corner, with the y-value increasing toward the left. l c denotes the width of the conveyor, and P c refers to the position of the oyster in the conveyor area that corresponds to the same location as P v in the vision area. A transformation equation is used to map the vision coordinates to the conveyor coordinates so that the grasp point detected by the vision system can be delivered to the robot for execution.
Since the positive x-direction in the vision image corresponds to the negative y-direction in the robot’s coordinate system, the length of P v is equal to l c P c . This relationship is expressed as a proportional formula, as shown in Equation (4).
P c = l c l c l v × P v

4. Performance Evaluation of the Automated Pick-and-Place System for Oyster Size Classification

4.1. Vision-Based Grasp Point Estimation Algorithm and Size Classification Method

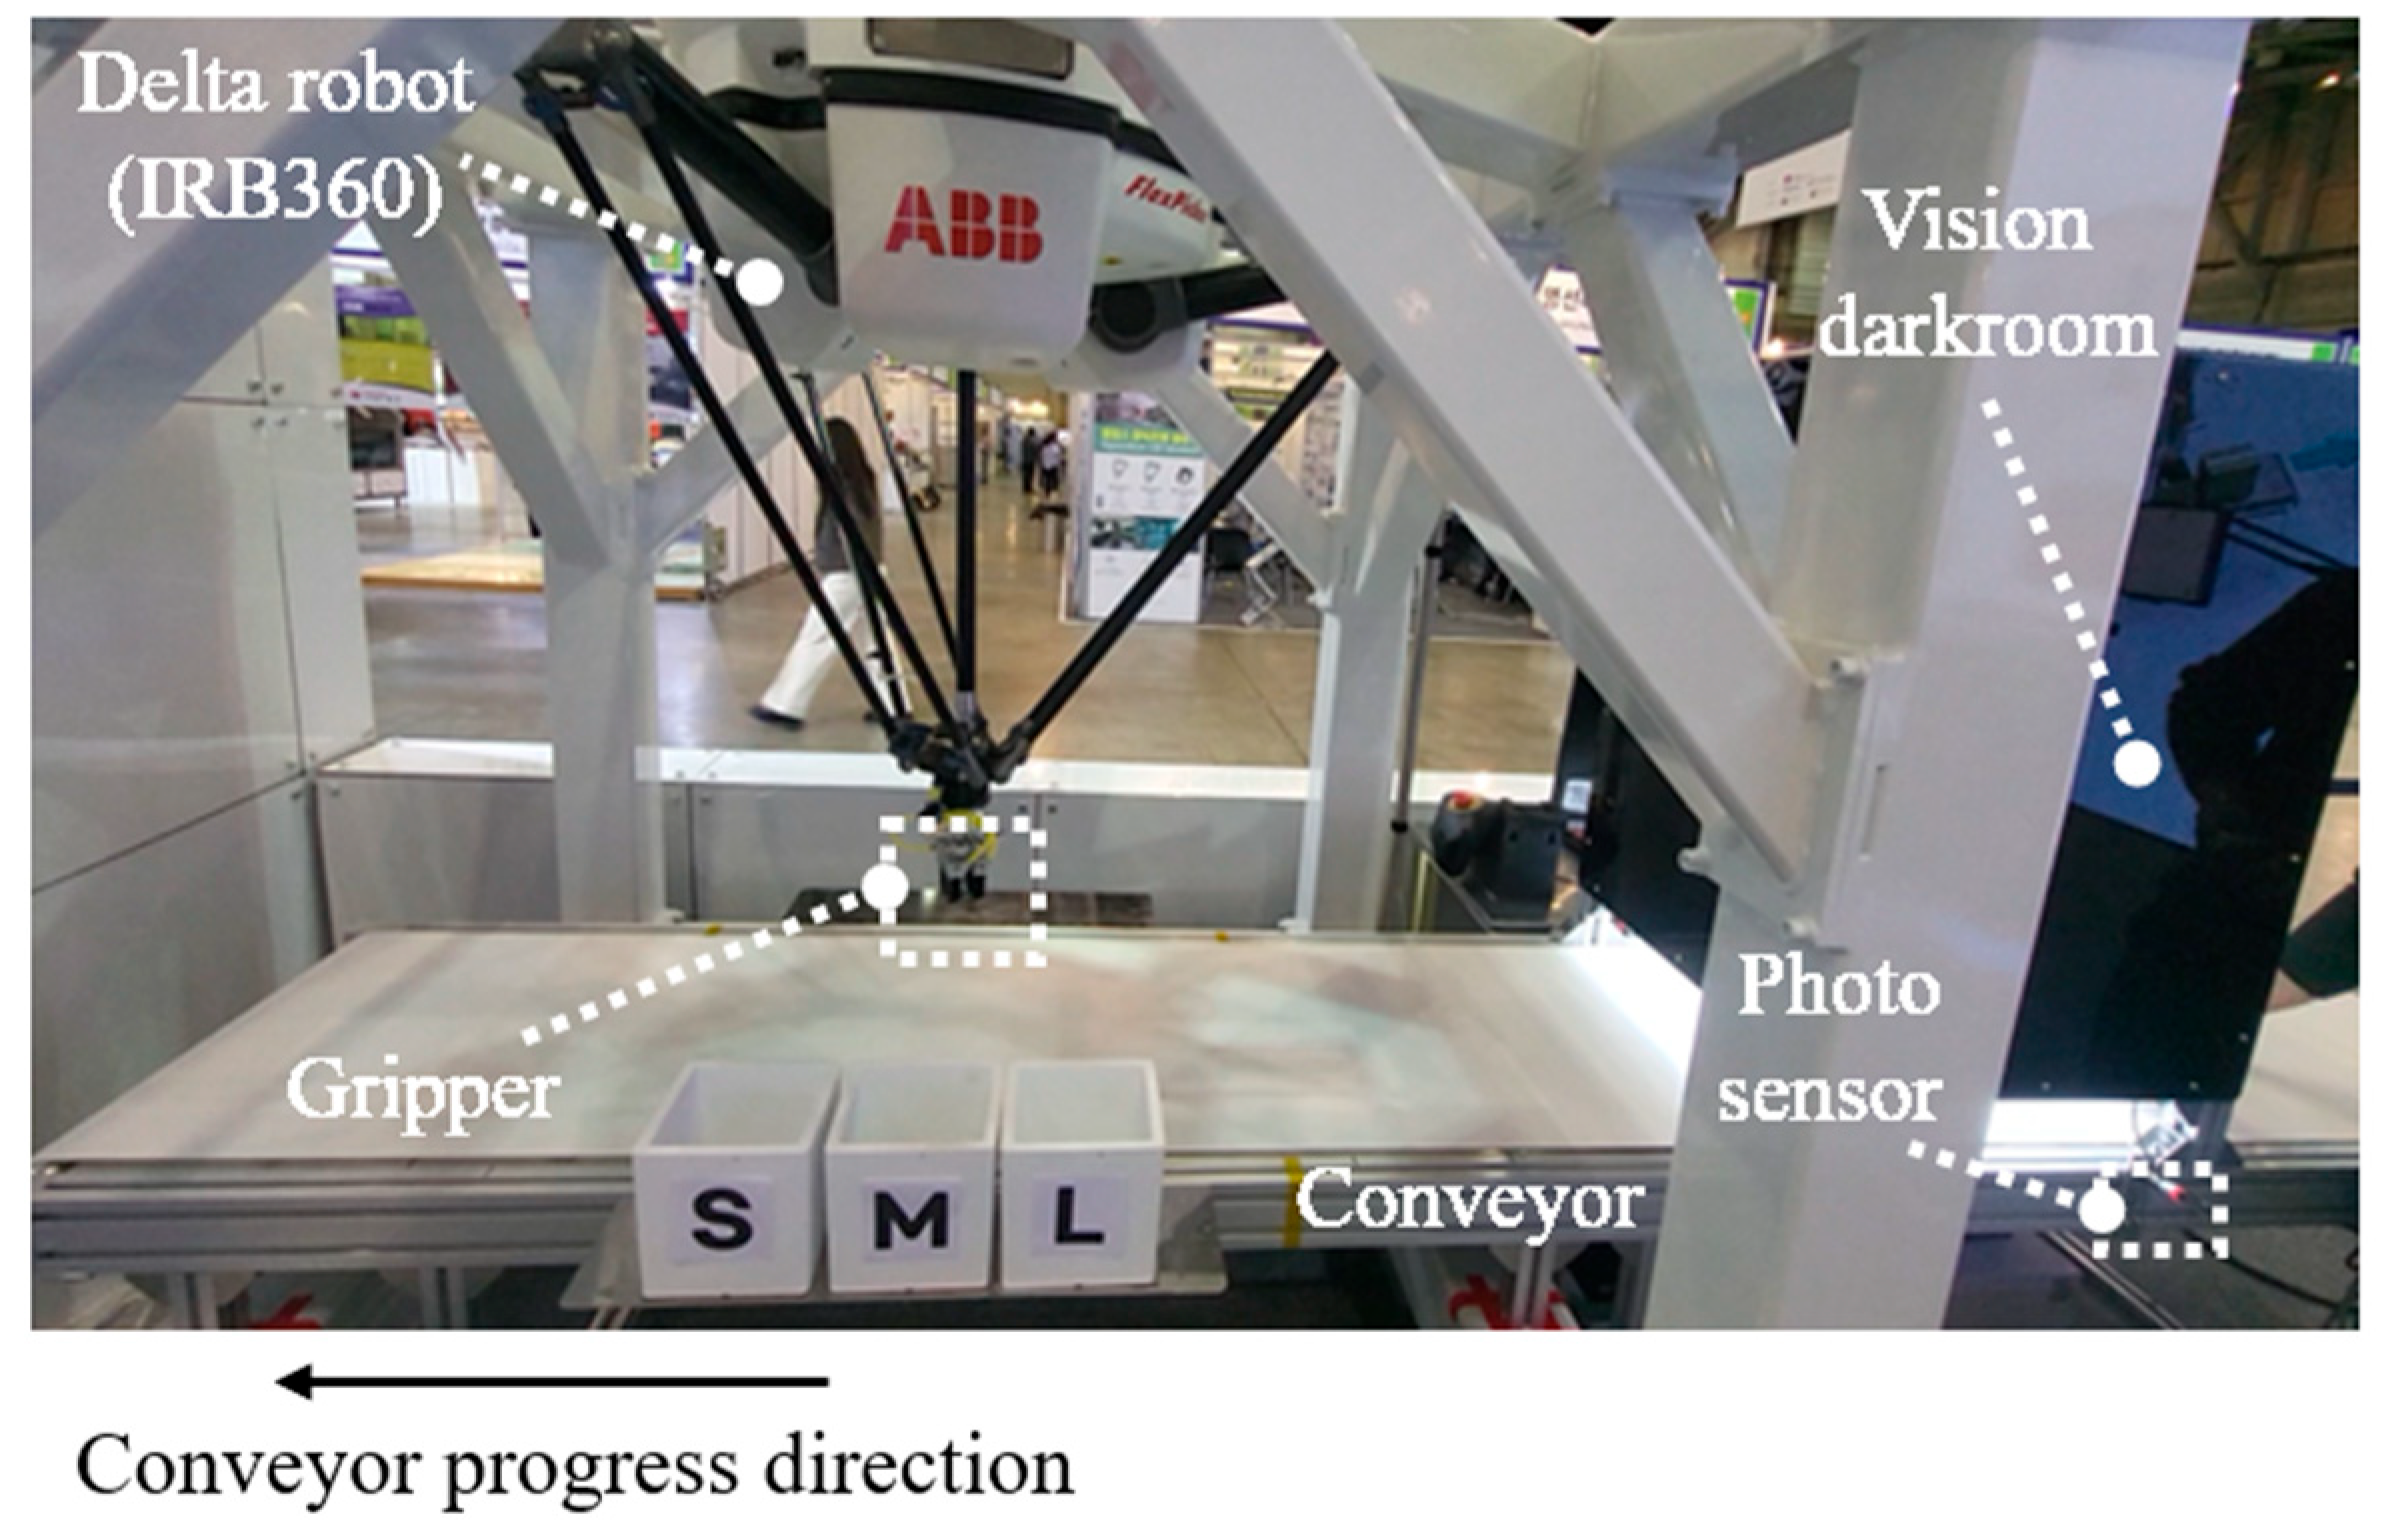
Figure 10 illustrates the configuration of the testbed constructed in this study to evaluate the performance of core technologies for automating the oyster processing line. The testbed consists of a conveyor, a dark room for the vision process, an internal camera for oyster recognition, a photo sensor to detect oyster input, a parallel robot for grasping, and classification buckets for classification. As shown in Figure 10, although a soft gripper is typically attached to the end of the parallel robot for grasping, it was replaced with a camera to verify the performance of vision-based grasp point estimation. If the estimation is accurate, the grasping point should coincide with the center of the camera image, since the center of the gripper and the center of the camera image are aligned during operation.
The experimental results are compared and summarized in Table 1. Mechanical errors were not considered in this evaluation. The average error when using the center of the bounding box as the grasp point was measured to be 200 pixels in the x-direction and 150 pixels in the y-direction. In contrast, the method using image moment-based grasp point estimation significantly reduced the error to 28 pixels in the x-direction and 20 pixels in the y-direction as shown in Figure 11. Based on calibration measurements conducted during the experiment, a conversion factor of 0.2325 mm per pixel was defined for the distortion-corrected image. Applying this factor, the algorithm was found to reduce the average error by approximately 40 mm in the x-direction and 30 mm in the y-direction. Mechanical errors were not considered in this evaluation.

4.2. Grasping Performance Evaluation Based on Multiple Oyster Recognition

For the performance evaluation of the automated oyster classification process, the camera was replaced with a soft gripper, and oysters of various sizes were used to conduct size-based automated classification tests. Following the classification criteria previously mentioned from a survey by a Korean seafood processing company, the oysters were categorized into three size groups: small (S), medium (M), and large (L), as defined in Table 2. In this study, each test trial involved a total of 10 oysters, consisting of 2 small, 5 medium, and 3 large oysters.
A performance test for recognition and grasping was conducted by randomly placing 10 oysters of different sizes on the conveyor. We selected 10 oysters per trial because all items fit within a single camera frame view and this unit matches one robot-conveyor cycle, enabling stable repetition of the insert-grasp-classify sequence. To ensure successful grasping by the gripper, the oysters were arranged to avoid overlapping and positioned so that all 10 oysters could be captured within a single camera frame. As the oysters passed through the dark room where the camera was installed, the system recognized the size and orientation of each oyster and calculated its category, grasp point, and grasp direction. Once the oysters entered the working range of the robot, the parallel robot grasped each oyster according to the detected grasp point and direction and sorted them into the corresponding bucket based on the recognized size. In this study, the sorting test using 10 oysters was repeated 10 times, enabling the evaluation of automated size classification and grasping performance for a total of 100 oysters.
Table 3 presents the results of the automated size classification and grasping performance evaluation. In the repeated tests of sorting 10 oysters across 10 trials, the size classification showed an average success rate of 99%. The system also achieved an average grasping success rate of 99%. Regardless of the recognition results, some failures occurred during the grasping process, mainly due to slippage caused by surface moisture on the oysters or small oysters slipping through the gripper fingers. These issues are considered mechanical problems that can be improved through future gripper design optimization. The experimental process of recognizing and grasping 10 oysters can be seen in Figure 11. Detailed results of recognition and grasping success rates for all 10 oysters across 10 trials are provided in Appendix A.

5. Productivity Evaluation Based on Process Simulation

As shown in Figure 12, a process simulation was conducted using the Visual Components software environment to perform a comparative productivity analysis between the conventional manual oyster classification process and the developed automated oyster classification system. The simulation was based on the actual working conditions of Deokyeon Seafood Co., Ltd. in Tongyeong-si, a domestic oyster processing company in South Korea. In the manual process, 60 workers operate for 8 h a day, achieving a daily production volume of 7 tons. Based on harvest data from October to the following May, the distribution of oyster sizes was approximately 30% large, 50% medium, and 20% small, with average weights of 20 g, 15 g, and 10 g, respectively. It was confirmed that, assuming a 100% recognition and grasping success rate, at least seven automated systems would be required to match the production volume of the manual process.
Table 4 summarizes the environmental parameters and values configured in the simulation. Based on the performance evaluation, a recognition and grasping success rate of 99% was applied to the simulation, and the results are shown in Table 5. The 8 h simulation demonstrated that a single automated oyster classification system could produce 1472 filled trays. To match the production volume of the manual process, it was determined that at least seven automated systems would be required. Compared to a theoretical scenario with a 100% recognition and grasping success rate, the number of processed oysters decreased by approximately 715, and the tray output was reduced by about 15 trays.

6. Conclusions

In this study, we developed and evaluated an automated oyster classification system capable of classifying oysters by size and placing them into trays for freezing, thereby automating a process traditionally reliant on manual labor. By incorporating a vision-based recognition algorithm and a parallel robot equipped with a soft gripper, the system demonstrated high classification and grasping accuracy—99% each. Experimental validations confirmed that the use of image moment-based grasp point estimation significantly enhanced grasping precision compared to bounding-box center methods. In simulation, the system showed that one unit could produce 1472 trays in an 8 h shift, and at least seven units would be needed to match the manual daily output of 7 tons under current performance metrics. Compared to a hypothetical 100% success rate, the difference in production amounted to approximately 715 oysters and 15 trays.
This study provides clear evidence that an automated oyster classification process can significantly enhance efficiency, consistency, and productivity. Future work will focus on enhancing mechanical components, particularly through the optimization of gripper design to reduce slippage of small-sized objects [18,19]. Additionally, system parameters will be refined to further improve overall throughput, operational stability, and process reliability. To further substantiate identification performance in complex environments, we will, as future work, evaluate CNN-based approaches (e.g., YOLO) alongside the current classical pipeline and report objective metrics—precision, recall, F1, and mAP—under higher density, occlusion, and illumination variation. The proposed system is designed for scalable deployment via modular units that can be replicated across lanes and integrated at the factory testbed, with OMS-based orchestration supporting parallel, line-level scale-out. Field adaptation is addressed through planned analyses of environmental variability (e.g., moisture, residues) and error sources, with iterative optimization on the testbed prior to rollout with partner companies. Readiness for deployment is supported by a living-lab pathway (on-site verification and applicability evaluation), progression toward TRL-8 commercialization, and program benchmarks (recognition/inspection accuracy > 90% and in-line operation at 6 m/min). Economic feasibility (NPV/IRR/BCR) will guide scale decisions during technology transfer and diffusion.
7. Patents

There are no patents resulting from the work reported in this manuscript.

Author Contributions

Conceptualization, J.L. and M.J.; methodology, J.B.; software, J.B.; validation, J.B., S.K., C.-H.L. and M.J.; formal analysis, J.B.; investigation, J.B.; resources, J.L.; data curation, S.K.; writing—original draft preparation, J.B.; writing—review and editing, J.L. and M.J.; visualization, C.-H.L.; supervision, J.L. and M.J.; project administration, J.L.; funding acquisition, J.-H.S. All authors have read and agreed to the published version of the manuscript.

Funding

This research was funded by Ministry of Oceans and Fisheries, grant number 20210671.

Acknowledgments

This research was supported by Korea Institute of Marine Science & Technology Promotion (KIMST) funded by the Ministry of Oceans and Fisheries (20210671).

Conflicts of Interest

The funders had no role in the design of the study; in the collection, analyses, or interpretation of data; in the writing of the manuscript; or in the decision to publish the results.

Abbreviation

The following abbreviation is used in this manuscript:
ROIRegion Of Interest

Appendix A

The results of recognizing and classifying 10 oysters per trial across a total of 10 tests are shown in Table A1. The ‘Index’ indicates the picking order, with smaller numbers corresponding to earlier pick attempts, while oyster sizes were randomly assigned in each test. If the recognized size did not match the actual size of the oyster during the recognition process, an ‘X’ was marked and shaded in the ‘Success’ column. In Trial 4, the 9th oyster, originally classified as size M, was incorrectly recognized as size L. This was attributed to the fact that oysters do not have a fixed shape and tend to spread out more on the conveyor, leading to a larger perceived size during recognition. Similarly, in the picking phase, failures to correctly grasp the oyster were also marked with a shaded ‘X’ in the ‘Success’ column. In Trial 10, the 3rd oyster was not properly grasped and was dropped, which was confirmed to be due to its small size causing slippage during grasping. The average recognition and picking success rates across 10 trials with 10 oysters each are summarized at the bottom of the table.
Table A1. Experimental Results of Oyster Handling: Success Rates and Failure Causes per Trial.
TrialIndexFeedingRecognitionPicking
SizeSizeSuccessSuccess
11MMOO
2MMOO
3MMOO
4SSOO
5MMOO
6MMOO
7MMOO
8LLOO
9SSOO
10MMOO
21MMOO
2MMOO
3SSOO
4MMOO
5LLOO
6SSOO
7MMOO
8MMOO
9MMOO
10MMOO
31MMOO
2MMOO
3MMOO
4SSOO
5MMOO
6MMOO
7MMOO
8SSOO
9MMOO
10LLOO
41MMOO
2MMOO
3SSOO
4LLOO
5SSOO
6MMOO
7MMOO
8MMOO
9MLXO
10MMOO
51MMOO
2SSOO
3SSOO
4MMOO
5MMOO
6MMOO
7MMOO
8MMOO
9LLOO
10MMOO
61MMOO
2MMOO
3MMOO
4MMOO
5MMOO
6MMOO
7SSOO
8MMOO
9SSOO
10LLOO
71SSOO
2SSOO
3MMOO
4MMOO
5MMOO
6MMOO
7MMOO
8MMOO
9MMOO
10LLOO
81SSOO
2MMOO
3MMOO
4SSOO
5MMOO
6MMOO
7LLOO
8MMOO
9MMOO
10MMOO
91MMOO
2MMOO
3SSOO
4MMOO
5MMOO
6SSOO
7MMOO
8MMOO
9LLOO
10MMOO
101MMOO
2MMOO
3MMOO
4SSOX
5SSOO
6MMOO
7LLOO
8MMOO
9MMOO
10MMOO
Success rate Average99.0099.00

References

  1. Cojocaru, A.L.; Liu, Y.; Smith, M.D.; Akpalu, W.; Chávez, C.; Dey, M.M.; Dresdner, J.; Kahui, V.; Pincinato, R.B.M.; Tran, N. The “Seafood” System: Aquatic Foods, Food Security, and the Global South. Rev. Environ. Econ. Policy 2022, 16, 306–324. [Google Scholar] [CrossRef]
  2. Botta, R.; Asche, F.; Borsum, J.S.; Camp, E.V. A review of global oyster aquaculture production and consumption. Marine Policy 2020, 117, 103952. [Google Scholar] [CrossRef]
  3. Deepika, C.; Taj, K.; Bedar, P. Automation in Production Systems: Enhancing Efficiency and Reducing Costs in Mechanical Engineering. Nanotechnol. Percept. 2024, 20, 1436–1447. [Google Scholar] [CrossRef]
  4. Zhang, R.; Chen, X.; Wan, Z.; Wang, M.; Xiao, X. Deep Learning-Based Oyster Packaging System. Appl. Sci. 2023, 13, 13105. [Google Scholar] [CrossRef]
  5. Nishimura, Y.; Sun, L.; Wang, Y.; Wang, H.; Yang, X. Soft Grippers in Robotics: Progress of the Last 10 Years. Machines 2022, 12, 887. [Google Scholar]
  6. Kim, S.; Baek, J.; Jeong, M.; Suh, J.; Lee, J. Development of Fishcake Gripping and Classification Automation Process Based on Suction Shape Transformation Gripper. Inventions 2024, 9, 17. [Google Scholar] [CrossRef]
  7. Florida Department of Agriculture and Consumer Services. Shellfish Processing: Rules and Regulations. In Division of Food Safety; Florida Department of Agriculture and Consumer Services: Tallahassee, FL, USA, 2022. Available online: https://ccmedia.fdacs.gov/content/download/65886/file/shellfish-processing-rules-and-regulations.pdf (accessed on 15 June 2025).
  8. SED Graders. Global Leaders in Automatic Oyster Grading Technology. Available online: https://sedgraders.com (accessed on 10 August 2025).
  9. Oyster Grader. Lizotte Machine Vision. Available online: https://www.lizottemachinevision.com/product/oyster-grader (accessed on 10 August 2025).
  10. Oyster Sorting Technology. GP Graders. Available online: https://gpgraders.com/sorting-solutions/oyster-sorting-technology/ (accessed on 10 August 2025).
  11. Zhao, F.; Hao, J.; Zhang, H.; Yu, X.; Yan, Z.; Wu, F. Quality recognition method of oyster based on U-net and random forest. J. Food Compos. Anal. 2024, 125, 105746. [Google Scholar] [CrossRef]
  12. Qu, H.-R.; Wang, J.; Lei, L.-R.; Su, W.-H. Computer Vision-Based Robotic System Framework for the Real-Time Identification and Grasping of Oysters. Appl. Sci. 2025, 15, 3971. [Google Scholar] [CrossRef]
  13. Wang, M.; Cai, Z.; Chen, Y.; Yang, S.; Chen, L.; Hu, Q. Shrimp Counting Algorithm Using a Small-Scale Labeling Model. Electronics 2024, 13, 4737. [Google Scholar] [CrossRef]
  14. Genç, İ.Y.; Gürfidan, R.; Açikgözoğlu, E. Quality Determination of Frozen-Thawed Shrimp Using Machine Learning Algorithms Powered by Explainable Artificial Intelligence. Food Anal. Methods 2025, 18, 935–945. [Google Scholar] [CrossRef]
  15. KUKA AG. KR DELTA Robot in Hygienic Design for Food Processing: High-Speed Pick-and-Place Applications. KUKA Application Note, 2021; pp. 1–6. Available online: https://www.kuka.com/en-de/products/robot-systems/industrial-robots/kr-delta-roboter (accessed on 18 June 2025).
  16. Moon, J.S.; Lee, H.J.; Kim, S.C.; Lee, E.S.; Cadangin, J.; Joo, B.H.; Park, S.J.; Hur, Y.B.; Nam, T.J.; Choi, Y.H. Effect of Different Regional Characteristics of Spawning and Growing Sites on Growth and Taste of Pacific Oyster, Crassostrea gigas. Dev. Reprod. 2024, 28, 175. [Google Scholar] [CrossRef] [PubMed]
  17. Allison, A.; Hanson, N.; Wicke, S.; Padır, T. HASHI: Highly Adaptable Seafood Handling Instrument for Manipulation in Industrial Settings. In Proceedings of the 2024 IEEE International Conference on Robotics and Automation (ICRA), Yokohama, Japan, 13–17 May 2024; IEEE: New York, NY, USA, 2024; pp. 4191–4197. [Google Scholar]
  18. Nikafrooz, N.; Fuge, Z.; Leonessa, A. Grasp control of a cable-driven robotic hand using a PVDF slip detection sensor. arXiv 2022, arXiv:2202.06140. Available online: https://arxiv.org/abs/2202.06140 (accessed on 11 July 2025). [CrossRef]
  19. Yang, W.; Chen, Y.; Trotter, A.; Kang, B. Advancing Oyster Phenotype Segmentation with Multi-Network Ensemble and Multi-Scale Mechanism. arXiv 2025, arXiv:2501.11203. Available online: https://arxiv.org/abs/2501.11203 (accessed on 11 July 2025). [CrossRef]
Figure 1. Oyster classification process by human workers.
Inventions 10 00076 g001
Figure 2. System configuration of the automated oyster classification process: (a) Automated process system for oyster classification; (b) Oyster tray loading mechanism.
Inventions 10 00076 g002
Figure 3. Automated oyster placement and loading process: (a) Oyster placement on the position guide board using XY-axis movement. Sixteen oysters are aligned before loading; (b) Completed loading of 48 oysters into the fixed tray after three placement cycles; (c) Drop after alignment by the position guide board.
Inventions 10 00076 g003
Figure 4. Soft gripper applied to the automated oyster classification system.
Inventions 10 00076 g004
Figure 5. Flowchart of automated oyster pick-and-place system.
Inventions 10 00076 g005
Figure 6. Flowchart of vision-based grasp point estimation and size classification.
Inventions 10 00076 g006
Figure 7. Survey on the size and weight of oysters by seafood processing companies.
Inventions 10 00076 g007
Figure 8. Grasp point estimation using image moment calculation.
Inventions 10 00076 g008
Figure 9. The vision camera area along with the corresponding conveyor area.
Inventions 10 00076 g009
Figure 10. Configuration of performance evaluation testbed.
Inventions 10 00076 g010
Figure 11. Grasp point refinement test for verification of optimal grasping point.
Inventions 10 00076 g011
Figure 12. Productivity analysis of the automated oyster classification process simulation.
Inventions 10 00076 g012
Table 1. Comparison of grasp point deviation from image center between two algorithms.
Case 1 1Case 2 2
X (Error) [px]Y (Error) [px]X (Error) [px]Y (Error) [px]
(1)216149287
(2)2501994144
(3)276200432
(4)1451351232
(5)1872781014
(6)146603233
(7)271304419
(8)1779515
(9)502574834
(10)28498185
1 Grasp point using center of bounding box. 2 Grasp point using image moment calculations.
Table 2. Definition of test oyster sizes according to classification criteria by size survey.
No.Length [mm]Width [mm]Weight [g]Size Label
(1)442311S
(2)452410S
(3)583318M
(4)583020M
(5)573120M
(6)613116M
(7)603217M
(8)773323L
(9)693725L
(10)694022L
Table 3. Number of successes classification and grasping with oysters.
Number of Successes Classification [Count]Number of Successes Grasping [Count]
Trial 11010
Trial 21010
Trial 31010
Trial 4910
Trial 51010
Trial 61010
Trial 71010
Trial 81010
Trial 91010
Trial 10109
Success rate [%]99.0099.00
Table 4. Process simulation parameters.
Environment VariableValueUnit
Cycle time 10.4s/cycle
Transfer conveyor speed 1833mm/s
Classification system conveyor speed 400mm/s
Stage positioning speed 375mm/s
Shutter opening and closing time 0.2s
Tray ejection and replacement time0.5s
1 Cycle time of Delta robot for pick-and-place operations.
Table 5. Productivity estimation of automated oyster classification systems.
ResultValueUnit
Total number of oysters processed70,695EA
Total number of trays1472EA
Disclaimer/Publisher’s Note: The statements, opinions and data contained in all publications are solely those of the individual author(s) and contributor(s) and not of MDPI and/or the editor(s). MDPI and/or the editor(s) disclaim responsibility for any injury to people or property resulting from any ideas, methods, instructions or products referred to in the content.