1. Introduction
The validation of geospatial data represents a fundamental challenge in modern intelligent systems, particularly when multiple data sources provide conflicting location information. Traditional validation approaches rely on simple distance-based metrics or manual verification processes that often fail to leverage the rich contextual information available in modern reporting systems. This limitation becomes critical in applications where precise location data directly impacts safety outcomes and resource allocation decisions. The work on a patent for safe routing of autonomous vehicles [
1,
2] exemplifies this challenge, where inadequate crash location data quality emerged as a fundamental barrier to implementation, necessitating the development of the multimodal validation framework presented in this work.
The complexity in geospatial validation has several roots: time-pressured data collection environments, the integration of structured coordinates with unstructured narrative descriptions, visual diagram interpretation requirements, and the need for accuracy verification. When analyzing crashes, precise localization is a prerequisite for proper classification, yet current systems frequently capture location information inaccurately due to the demands placed on law enforcement officers at the scene of a crash.
The precision of geospatial data directly impacts the effectiveness of safety interventions, as infrastructure modifications, signage placement, and enforcement strategies must be accurately targeted. The World Health Organization reports that road crashes result in 1.35 million fatalities annually worldwide, representing the leading cause of death for individuals aged 5–29 [
3]. Inaccurate location data compromises the spatial targeting essential for evidence-based safety interventions. In the United States, traffic crashes resulted in almost 41,000 fatalities in 2023, with economic losses approaching USD340 billion annually [
4]. These statistics demonstrate how improvements in data validation systems can have significant real-world impact through enhanced safety analysis and intervention targeting.
Current approaches to location validation face several limitations: the reliance on single-source validation, inability to process multimodal information, lack of systematic credibility assessment, and insufficient integration of contextual data [
5]. The practical implications of these limitations include false identification of safety hotspots, misallocation of infrastructure investments, and reduced effectiveness of safety analysis in transportation systems [
6].
Recent advances in artificial intelligence, particularly large language models and multimodal processing capabilities, provide new opportunities to address these validation challenges. However, the existing research has not systematically explored the integration of these technologies into a unified validation framework capable of processing diverse data types while accounting for the varying reliability of different information sources.
This paper addresses the need for intelligent geospatial validation systems by developing a novel computational framework that combines credibility scoring algorithms, multimodal AI analysis, and spatial validation techniques. Building on the recommendations of Imprialou and Quddus [
7] for enhanced data post-processing methods, our approach represents an advancement in the automated location validation methodology with potential applications extending beyond transportation to other domains requiring geospatial data quality assurance.
1.1. Data Quality Issues in Crash Reporting
Crash data quality deficiencies significantly impact safety analyses, from hazard identification to predictive modeling applications. These challenges manifest across multiple dimensions of data integrity and stem from systematic sources within the reporting process.
Completeness: Under-reporting varies systematically by crash severity and road user type. While fatal crashes achieve near-complete reporting rates, substantial gaps exist for minor crashes and vulnerable road users [
8,
9]. A meta-analysis across 13 countries reveals decreasing capture rates by injury severity: 95% for fatal injuries, 70% for serious injuries requiring hospitalization, 25% for slight injuries treated as outpatients, and only 10% for very slight injuries [
10].
Spatial Accuracy: Researchers have found that location errors affect approximately 25% of crash records in high-income countries [
11], despite widespread GPS adoption [
6,
12]. These inaccuracies directly compromise the identification of high-risk locations and the effectiveness of targeted safety interventions, forming the primary focus of this investigation.
Temporal Precision: The accurate capture of the time and date of a crash enables the analysis of crash patterns across environmental conditions, traffic volumes, and seasons. Temporal data also facilitates a correlation analysis between crashes and specific road conditions or traffic events.
Classification Consistency: A severity assessment requires standardized scales (e.g., KABCO versus AIS injury scales [
13]) and consistent application across jurisdictions. Variations in classification protocols complicate comparative analyses and resource allocation decisions.
1.2. Error Taxonomy and Sources
As illustrated in
Figure 1, crash data quality issues manifest across five categories, each stemming from distinct but interacting sources. Empirical evidence from electronic reporting systems demonstrates that systematic approaches can significantly reduce these errors [
12], particularly for location data where officers often lack expertise in spatial referencing systems.
Factual Error: This is the incorrect capture of observable details due to hurried data entry or adverse field conditions. Electronic systems with validation checks have proven effective in reducing such errors [
12].
Standard Variation: This is the inconsistent classification approaches across jurisdictions, exemplified by different injury scales [
13] or the inconsistent application of directional coding standards [
12].
Fidelity Variation: This is the systematic differences in detail requirements between agencies, ranging from general location descriptions to precise spatial coordinates.
Contextual Omission: This is the missing information critical for analysis, often excluded due to institutional priorities rather than data availability.
Temporal Issues: This is the inaccurate timing data resulting from field constraints or imprecise recording practices.
The interaction between these error types necessitates multi-dimensional validation approaches that can systematically address institutional, practical, and procedural deficiencies simultaneously.
1.3. How Crash Location Is Recorded by Law Enforcement Officers
Crash location recording procedures vary across jurisdictions. We were able to obtain both detailed crash reporting instructions and associated crash data for three states: Florida, Ohio, and Texas. Based on our review of these states, we find several common approaches to documenting crash locations, though specific requirements differ among them.
In Florida, crash location reporting offers four options to identify the crash site [
14]:
Street, Road, or Highway: Record the name of the highest classification of the trafficway where the crash occurred. For parking lot crashes, include the address; for private property, specify private property and the address.
Street Address: Provide the street address number if applicable. This field is not required if other location data such as latitude/longitude, intersection, or milepost is used.
Latitude and Longitude: Enter the coordinates of the crash location in float format (e.g., −85.869586). The latitude and longitude values are optional and can substitute for other location fields.
Intersection or Milepost: Specify the distance and direction from the nearest intersection or milepost. The measurements can be in feet or miles, and the direction should indicate N, S, E, or W.
Ohio [
15] maintains stricter requirements, mandating latitude and longitude coordinates for all crashes, unlike Florida’s optional approach. Texas [
16] is similar to Florida, allowing but not requiring GPS coordinates. Both Ohio and Texas provide fields for route numbers and road names, with clear rules for prioritizing route systems and using secondary references in intersections.
The approaches across Florida, Ohio, and Texas reflect different priorities in balancing flexibility, precision, and redundancy:
Latitude and Longitude: While optional in Florida and Texas, these coordinates are mandatory in Ohio, showing varying approaches to geospatial data collection.
Road System and Street Names: All three states require the use of street names or roadway systems when available, with Texas implementing detailed hierarchical rules.
Street Address Requirements: Texas specifically emphasizes that GPS coordinates do not replace the need for street address information, which must always be provided. Florida offers more flexibility by allowing latitude/longitude to substitute for other fields.
International Perspectives: The Swedish Model
International standards for crash reporting can deviate significantly from those in the United States. Sweden, for instance, is recognized as a leader in traffic safety and is the birthplace of Vision Zero—a strategy aimed at eliminating all traffic fatalities and severe injuries [
17].
According to Swedish guidelines for law enforcement officers, the location of a crash must be captured in a manner that leaves no doubt as to where the incident occurred. This is achieved by the following:
Precise Location Identification: Documenting the accident site using the road number and/or street name, along with the distance to the nearest intersecting street or road.
Supplementary Locality Data: Including the name of the district, municipality, or locality when possible.
Enhanced Precision via GPS: When available, employing GPS coordinates to pinpoint the exact location of the incident.
The method employed in Sweden is similar to practices observed in some U.S. states—emphasizing the need for detailed and unambiguous location information. However, regarding technical precision, Ohio’s crash reporting system is the most stringent among the examples discussed, through the mandatory use of GPS coordinates for all crash reports. While this approach is intended to promote precise geolocation by capturing latitude and longitude data, practical challenges such as data entry errors can still result in inaccuracies. Thus, the benefit of the mandated precision offered by GPS data may sometimes obscure underlying data quality issues, such as those discussed in the preceding section.
1.4. Literature Review
The impact of inaccurate crash data on road safety analyses is likely significant. When Imprialou and Quddus [
7] reviewed the literature, they found that data quality problems vary in severity and extent across different attributes and are especially severe for crash location and timing, challenges in linking databases due to inconsistencies, misclassification of crash severity, incomplete or inaccurate demographic information of those involved, and incorrect identification of factors contributing to crashes. Multiple studies [
11,
18] have documented substantial location error rates across different jurisdictions and datasets.
The validation of traffic accident locations from police reports has challenged researchers for decades, with various methodological approaches proposed. Work by Levine and Kim in the late 1990s [
19] pointed to the need for “[e]fforts to enhance data quality [involving] better training and standardization of location reporting throughout the entire data management process.”
Subsequent research has explored multiple methodological trajectories. Tarko et al. [
20] addressed the challenge of linking crash records to specific road locations when location data is poor quality. A probabilistic linking technique (the Fellegi–Sunter method) was used to match crash records with road inventory data, testing it on 137 crash records and 37 state intersections. Although the method could identify probable links for most crashes, it typically assigned each crash to 2–3 possible roads rather than a single location due to insufficient road data limitations of the estimation method. In their conclusions, Tarko et al. expressed hope that future improvements could come from better probability estimation and electronic crash reporting.
The error rate in crash locations varies across studies. Miler et al. [
18] found that 33.5% of crashes in a database of 8550 observations had inaccurate location attributes. Their innovative approach employed fuzzy string matching using the Jaro–Winkler distance, achieving a 15% improvement over classical methods. This work was particularly notable for its use of OpenStreetMap data, which provided access to local variants of street names.
Imprialou et al. [
21] developed a novel probabilistic crash mapping algorithm (CM-MLOGIT) for dense urban networks, achieving 97.1% accuracy without relying on road names. Their method employs a hierarchical data structure where candidate road links are nested within vehicles and vehicles within crashes. The algorithm uses a multilevel logistic regression model based on two primary variables: the distance between reported crash location and candidate segment, and the difference between vehicle direction and link direction. Their approach significantly outperformed simpler methods based on minimum distance and angular difference. The authors demonstrated that vehicle-by-vehicle examination combined with optimal distance and angular measurements can effectively map crashes in complex urban environments, despite the inherent inaccuracies in administratively collected crash location data. Their findings highlight the impact of location mapping accuracy on subsequent spatial crash analyses and road safety decision-making.
Deka and Quddus [
5] developed a new machine neural network to accurately map traffic accidents to their correct road segments, addressing the limitations of existing methods. Using artificial neural networks (ANNs) and pattern matching, their approach accounts for inherent uncertainties in police-recorded accident data and road network information. When tested on UK accident data from 2012, their algorithm achieved significantly better accuracy than traditional methods, showing a ∼15% improvement in correct accident mapping compared to existing approaches. The method has already been implemented by the UK Highways Agency and can be adapted for use with other accident datasets.
While these crash mapping approaches have achieved high accuracy rates in their respective domains, they address fundamentally different validation challenges than the multimodal framework presented in this work. Existing methods primarily focus on crash-to-road mapping and single-source geocoding correction, whereas our approach introduces a novel paradigm for validating consistency across multiple authoritative data sources. The integration of visual diagram analysis, narrative text processing, and credibility scoring represents a distinct methodological contribution that establishes new performance baselines rather than incrementally improving existing geocoding approaches.
Chung & Chang [
22] assessed police-recorded accident data against Vehicle Black Box (VBB) data in Incheon, Korea (2010–2011). Their analysis of 206 matched accidents revealed the following:
Location accuracy: Average deviation 84.84 m; 91% within 150 m.
Timing accuracy: Average deviation 29.05 min; 96% within 60 min.
Speed accuracy: Average deviation 9.03 km/h; 90% within 20 km/h.
Higher injury severity correlates with more accurate speed recording.
Looking toward the future, Imprialou and Quddus [
7] suggest that emerging intelligent crash reporting systems, incorporating GPS-based applications and automated data collection, could significantly reduce location errors. Electronic reporting implementations [
12] have demonstrated improvements in location accuracy, though challenges remain in areas such as spatial referencing consistency. These systems are being implemented in several countries, including the US, the UK, and Italy, though their adoption faces challenges related to cost, training requirements, and potential technological vulnerabilities.
1.4.1. Emerging Multimodal AI Applications in Traffic Safety
The application of multimodal AI to transportation safety represents an emerging research frontier, with initial explorations focusing primarily on accident analysis and risk prediction rather than data validation. Recent preprint research has begun exploring multimodal approaches for traffic safety applications, though none have addressed the specific challenge of geospatial data validation.
Wu, Li, and Xiao [
23] propose AccidentGPT, a multimodal foundation model for traffic accident analysis that incorporates diverse input data to reconstruct accident processes automatically. Their work demonstrates the potential of multimodal AI for understanding traffic incidents but focuses on post-incident analysis rather than data quality assurance. Similarly, Karimi Monsefi et al. [
24] present CrashFormer, a multimodal architecture designed to predict crash risk using historical accidents, weather data, map imagery, and demographic information. While their approach successfully integrates multiple data modalities for predictive purposes, it does not address the fundamental data quality issues that our research targets.
These emerging applications highlight the growing recognition of multimodal AI’s potential in transportation safety, yet they also underscore the gap our work addresses: the absence of systematic approaches for validating the spatial accuracy of the foundational data that such systems depend upon.
1.4.2. Research Gap
While previous work has established various methodologies for location validation, from probabilistic matching to sophisticated map-matching algorithms, these approaches have generally relied on either exact string matching or predetermined similarity metrics. Recent preprint research has begun exploring multimodal AI applications for traffic safety [
23,
24], but these efforts focus on accident analysis and risk prediction rather than addressing the fundamental data quality challenges that compromise such systems.
The potential of leveraging modern language models’ semantic understanding capabilities for geospatial validation remains largely unexplored in peer-reviewed literature. Furthermore, while advanced algorithms using artificial intelligence concepts have achieved high accuracy rates in correcting crash locations, no research has systematically integrated visual diagram analysis with textual narrative processing for location validation purposes.
Our work addresses these gaps by developing and evaluating the first LLM-based multimodal approach specifically designed for geospatial data validation, potentially offering a more robust and adaptable solution that could see wider practical adoption than existing single-modality approaches.
1.5. Research Objectives
The objectives of this research include the following:
To develop an intelligent computational framework for automated geospatial data validation using multimodal AI techniques;
To create a dynamic credibility scoring algorithm that systematically integrates diverse information sources for location verification;
To evaluate the framework’s effectiveness through comprehensive testing on real-world crash location datasets;
To establish a methodology suitable for potential integration into electronic reporting systems and intelligent transportation infrastructure.
2. Materials and Methods
Our proposed solution uses both structured data validation and visual–textual analysis for location validation. The primary data source is crash reports from the Ohio Department of Transportation, a facsimile of which is shown in
Figure 2. These reports contain rich structured and unstructured information, including both ODOT (Ohio Department of Transportation) and ODPS (local police department) coordinates, reference location information, narrative description, and a crash diagram.
We implement our solution in object-oriented Python (version 3.11) with considerations for efficiency and accuracy. This section describes the implementation in detail.
2.1. Multimodal Analysis Framework
For the visual–textual analysis, we employ a multimodal large language model to extract structured information from both crash diagrams and narrative text. The narrative analysis component uses a structured prompt to extract street names and intersection status from crash descriptions:
{
"role": "system",
"content": """Extract the main streets involved in the crash...
Rules for streets:
- Include highway prefixes in standardized format:
* STATE ROUTE ## → SR ##
* COUNTY ROAD ## → CR ##
* UNITED STATES ROUTE ## → US ##
- Private drives should be labeled as "PRIVATE DRIVE"
- If a street name cannot be determined, use null
Provide your response as valid JSON with exactly these keys:
’street1’, ’street2’, ’intersection’."""
}
The system returns structured JSON output with three fields, street1, street2, and intersection (boolean), enabling direct integration with subsequent spatial validation steps.
The diagram analysis leverages the same multimodal LLM to extract street names and geometric relationships from crash scene diagrams, providing an independent verification source for narrative-derived location information. This dual-modality approach enables cross-validation between textual descriptions and visual representations of crash locations.
2.2. Geospatial Database Infrastructure
To support comprehensive location validation, we constructed a robust geospatial database incorporating multiple authoritative data sources. County and state milepost data were obtained from the Ohio Department of Transportation’s Traffic Information Management System (TIMS) [
25]. These CSV datasets contain precise coordinates for mileposts along state routes, county roads, and highways throughout Ohio, providing essential reference points for validating crash locations reported relative to mile markers.
For comprehensive road network validation, we use Overture Maps data, an open-source collaborative mapping initiative that provides high-quality, standardized geospatial data. We extract the complete Ohio road network from Overture’s global transportation dataset by applying spatial boundary filtering to isolate road segments within Ohio’s geographic boundaries. This process captures road identifiers, primary names, functional classifications, and precise geometric representations for all road types, from major interstate highways to local residential streets.
All the data sources are systematically imported into DuckDB, a high-performance analytical database system that enables efficient spatial queries and distance calculations essential for our validation methodology. The system performs coordinate transformations from WGS84 (EPSG:4326) to Ohio North projection (EPSG:32617) for accurate distance calculations in meters:
def _calculate_distance(self, loc1: Location, loc2: Location) -> float:
project = pyproj.Transformer.from_crs(’EPSG:4326’, ’EPSG:32617’,
always_xy=True).transform
p1_proj = transform(project, Point(loc1.longitude, loc1.latitude))
p2_proj = transform(project, Point(loc2.longitude, loc2.latitude))
return p1_proj.distance(p2_proj)
Administrative boundary validation is implemented using PostGIS-compatible spatial functions:
point_geom = f"ST_Contains(geom, ST_Transform(ST_GeomFromText" \
f"(’POINT({lat} {lon})’), ’EPSG:4326’,’EPSG:32617’))"
query = f"SELECT * FROM {table} WHERE {point_geom}"
The integration of these diverse data sources—crash reports, milepost references, and comprehensive road networks—within DuckDB’s spatial analysis framework enables our validation system to cross-reference location information across multiple authoritative sources. This multi-source approach significantly enhances the reliability and accuracy of crash location validation and correction by providing multiple independent verification pathways for each reported crash location.
This multi-faceted approach offers several potential advantages over traditional methods:
1. Multi-source Verification: By comparing the coordinates given by the Department of Transportation (ODOT) and the Police (ODPS), we increase confidence in location accuracy.
2. Contextual Understanding: Our approach leverages a multimodal LLM to extract and compare information from crash diagrams and written narratives.
3. Spatial Validation: Geospatial database queries verify consistency with administrative boundaries and known road networks.
4. Progressive Confidence Building: Rather than binary validation, we implement a credibility scoring system that accumulates evidence across multiple dimensions.
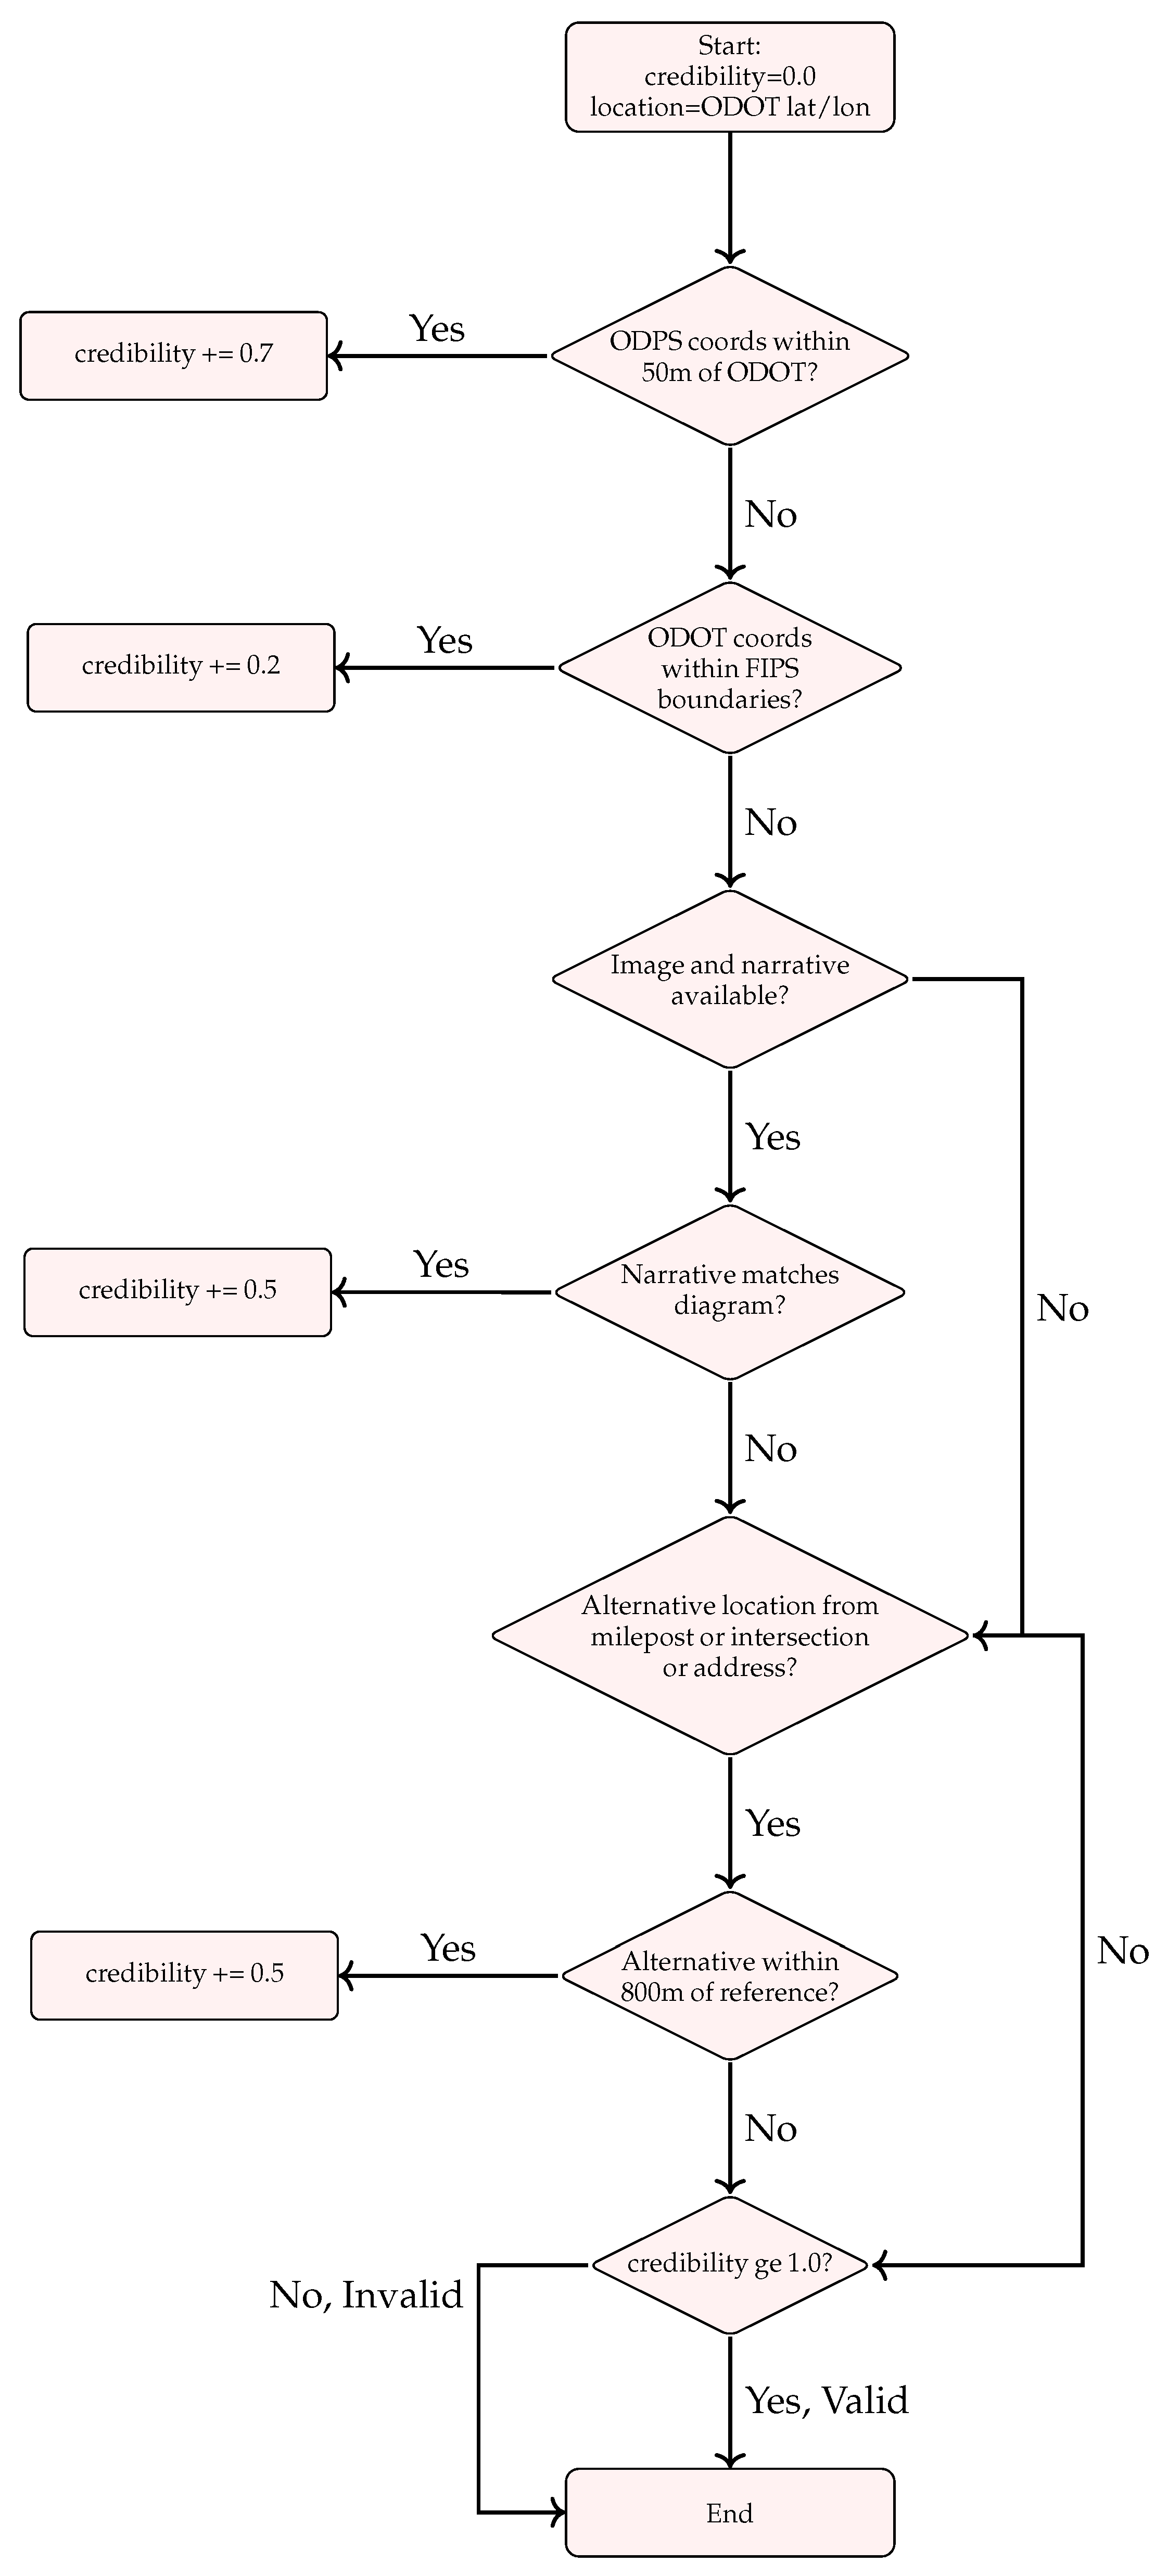
2.3. Credibility-Based Validation Framework
We build a cumulative credibility score by summing the results of weighted validation checks—each check returns a value of 1 if it passes and 0 if it fails. Formally, for a crash report
r, this can be expressed as
where
is the weight assigned to validation method
i, and
indicates whether validation method
i succeeded for report
r.
To compute accurate distances between coordinates, we transform latitude and longitude pairs from WGS84 (EPSG:4326) to UTM Zone 17N projection (EPSG:32617), which allows us to calculate Euclidean distances in meters:
where
and
are the projected coordinates, and
T represents the spatial transformation
from geographic coordinates to projected coordinates.
Weight Selection Methodology: The weights in our credibility scoring framework were determined through expert judgment based on the relative reliability and importance of each validation method in crash location verification. The coordinate consistency check receives the highest weight () as direct GPS coordinate agreement provides the strongest evidence of location accuracy. Administrative boundary verification receives a lower weight () as it provides only coarse-grained validation. Multimodal analysis and reference point validation receive moderate weights (), reflecting their value as independent verification sources, though with inherent uncertainties in interpretation.
These weights represent an initial heuristic approach based on domain knowledge and represent a limitation of the current work. The threshold requirement () ensures that multiple validation checks must pass regardless of specific weight values, providing robustness against individual weight selection choices. Future research should investigate optimal weight determination through systematic evaluation against ground truth datasets or through machine learning approaches that could learn optimal weights from validated training data.
Figure 3 shows the flowchart of our validation system, which builds credibility through four key checks:
Note on Credibility Threshold: Our weights intentionally sum to more than 1.0 (specifically to 1.9) because we require at least two validation checks to pass before accepting a location. With our threshold , a report cannot be validated with just one check, regardless of which check passes.
2.4. Reference Point Strategy Selection
Our system dynamically selects the appropriate validation strategy based on the reference point type specified in the report:
For intersection references (type 1), we execute spatial queries against the Ohio road network to identify precise intersection coordinates:
SELECT ST_AsText(ST_Centroid(ST_Intersection(r1.geometry,
r2.geometry))) as point
FROM ohio_roads r1, ohio_roads r2
WHERE r1.name ilike ’%{location_road_name}%’
AND r2.name ilike ’%{reference_road_name}%’
AND ST_Intersects(r1.geometry, r2.geometry)
For milepost references (type 2), we query our ODOT milepost database matching route numbers and milepost values. For house number references (type 3), we use Nominatim, an open-source geocoding service based on OpenStreetMap data, with addresses constructed as “{reference_road_name} {location_road_name}, {locality}, OH”.
2.5. Real-Time Application
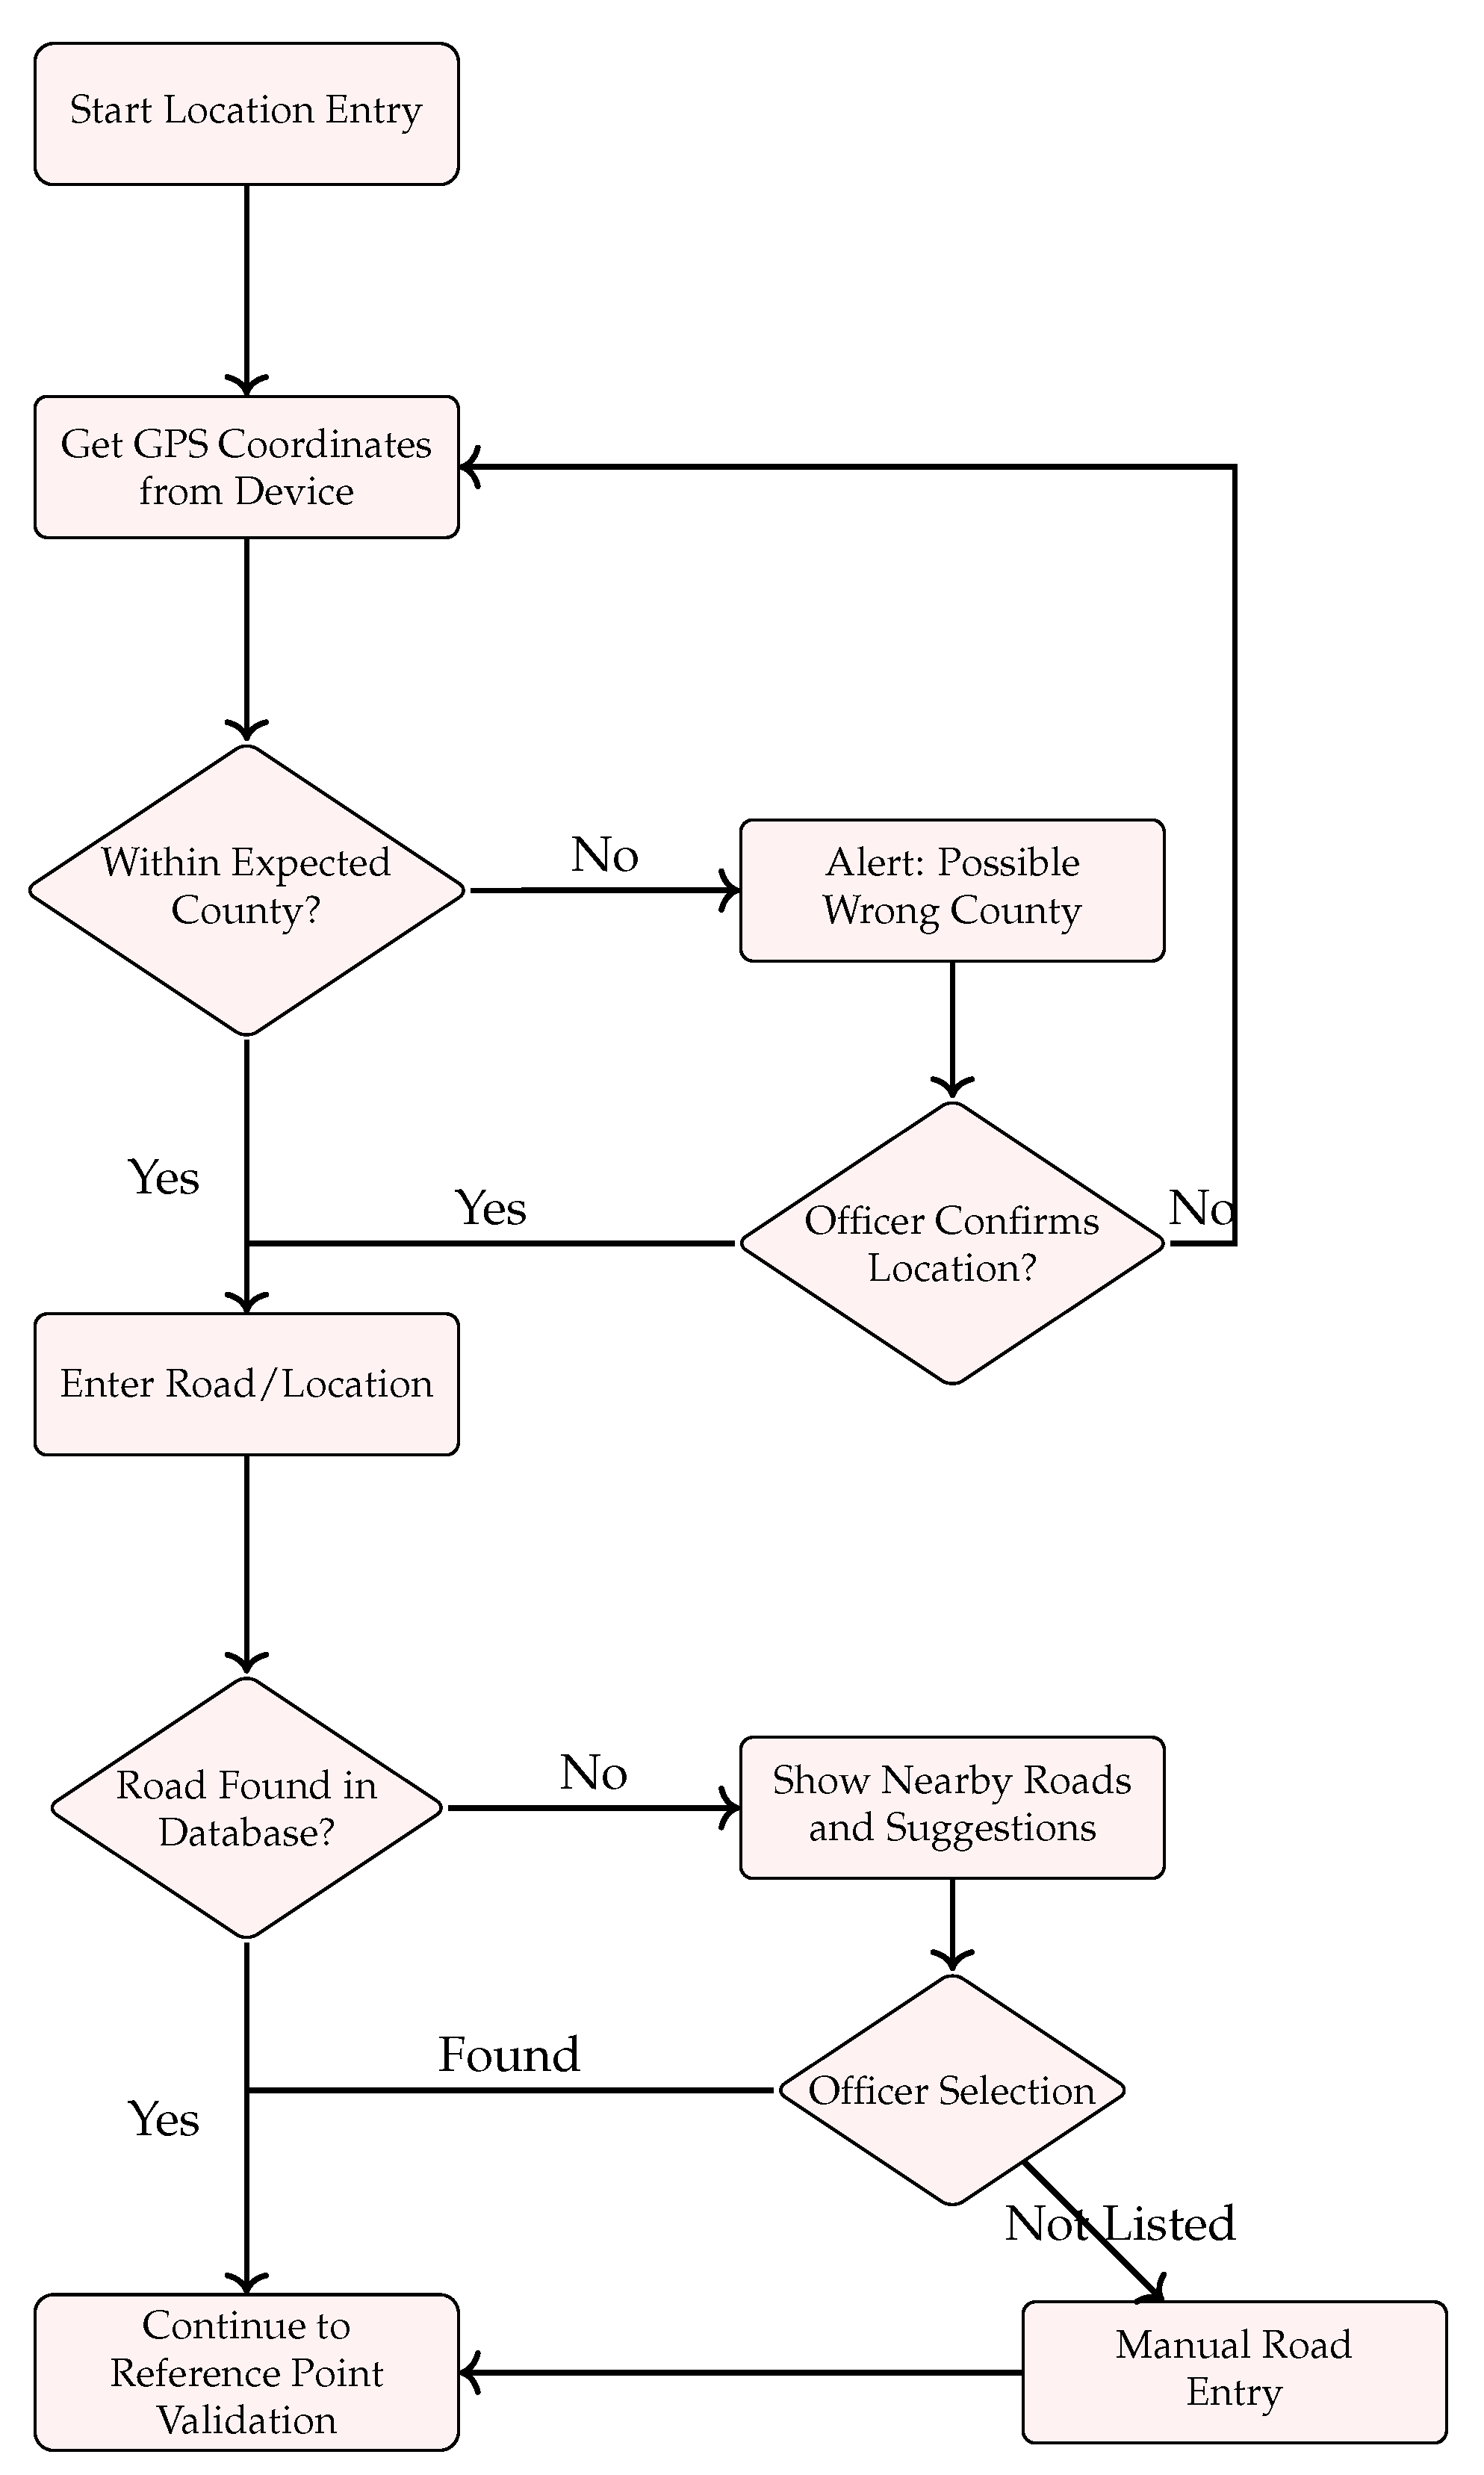
Figure A1 and
Figure A2 illustrate the systematic process for validating location data during incident entry. This process ensures accurate geographical information through a two-stage validation approach: county-level validation and road-level verification.
The process begins with automatic GPS coordinate acquisition from the officer’s device. These coordinates undergo immediate validation against the expected county boundaries. When the coordinates fall within the expected county, the system proceeds directly to road entry. However, if the coordinates indicate an unexpected county, the system alerts the officer and requires confirmation. This geographic validation step prevents inadvertent out-of-jurisdiction entries while maintaining flexibility for legitimate cross-boundary cases.
Following county validation, the system progresses to road-level verification. The entered road/location is checked against an authorized database. For roads not immediately found, the system provides nearby suggestions to account for potential spelling variations or unofficial road names. Officers can select from these suggestions or, if necessary, proceed with manual road entry. This multi-tiered approach balances automation with officer discretion, ensuring both accuracy and operational flexibility.
The process concludes by transitioning to reference point validation only after both county and road information have been properly verified. This structured approach maintains data integrity while accommodating the various scenarios officers encounter in the field.
3. Results
We ran our algorithm on a sample of 5000 crashes in Ohio, with approximately 1000 random samples for each severity level recorded in Ohio (fatal, serious injury suspected, minor injury suspected, injury possible, and property damage only).
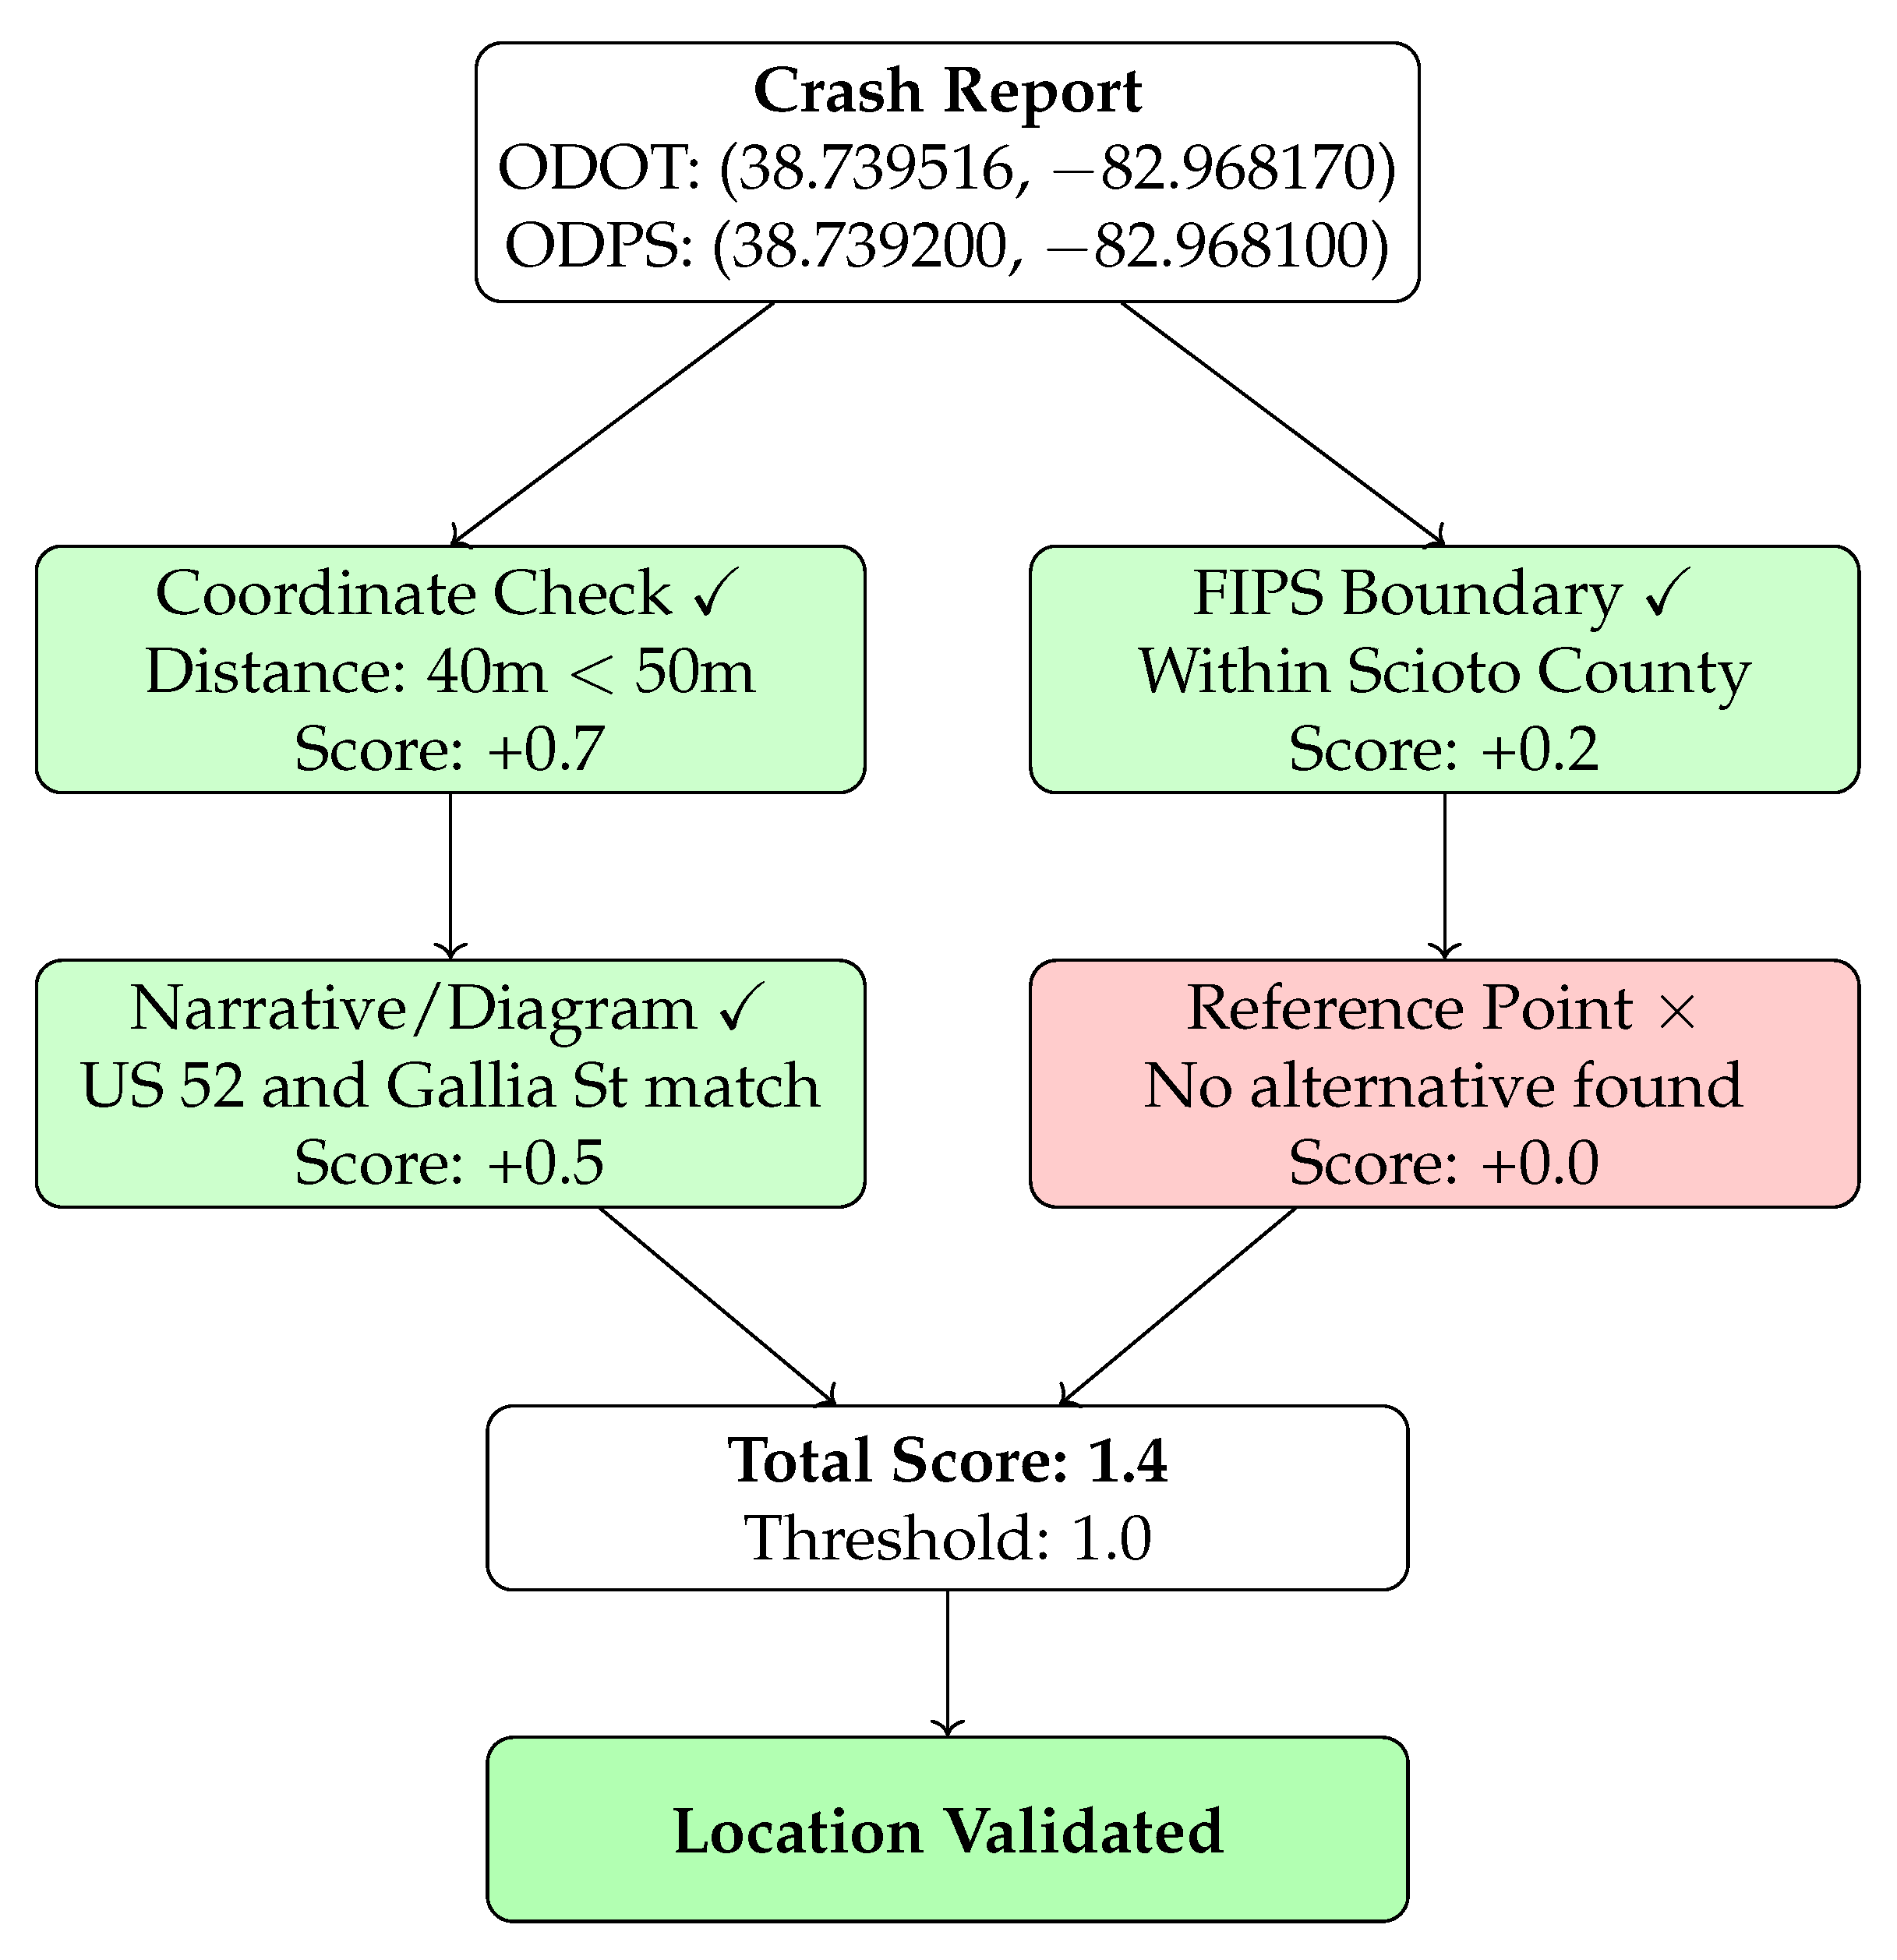
Figure 4 shows an example data point and its outcome.
Our analysis revealed that approximately 20% of reports required location corrections, indicating significant geospatial discrepancies in official crash data. The correction rates showed some variation across severity levels: 17.7% for fatal crashes, 20.3% for serious injuries, 21.5% for minor injuries, 22.8% for possible injuries, and 20.1% for property damage-only cases. Statistical analysis confirmed that these differences were neither statistically significant (
= 8.798, df = 4, and
p = 0.066) nor practically meaningful, with a negligible effect size (Cramér’s V = 0.042) and a maximum difference of only 5.1 percentage points. The overall correction rate was precisely estimated at 20.5% [95% CI: 19.4%, 21.6%], with individual severity-level confidence intervals clustering within a narrow range (
Table 1). This relatively consistent pattern across severity categories suggests that location validation challenges are fundamental to crash reporting methodology rather than being influenced by crash severity.
While the maximum difference of 5.1 percentage points approaches conventional significance thresholds, research has shown that crash mapping and validation improvements require substantial implementation complexity and resources [
7]. Given that all severity levels cluster consistently around 20% correction rates, with no systematic pattern related to crash characteristics, the operational benefits of implementing severity-specific validation procedures would not justify the additional system complexity and resource requirements.
The nature of these corrections varied systematically based on reference point types. Intersection references (type 1) dominated the validation process across all severity levels, accounting for 931 of 1027 successful corrections (90.7%). Milepost references (type 2) were less common but still significant, particularly for fatal crashes where they represented 19.8% of corrections compared to 7.9% for property damage-only crashes. House number references (type 3) proved extremely rare, appearing in only two cases, both for property damage-only crashes.
Table 1 presents a comprehensive summary of our validation results across the 5000 crash reports analyzed. The consistent correction rates across severity categories reinforce our finding that location validation challenges are systematic rather than severity-dependent.
These findings reveal important patterns in crash location reporting. The predominance of intersection-based corrections (90.7%) likely reflects two key factors: (1) the higher frequency of crashes at intersections, which are known conflict points in the roadway network, and (2) the relative ease of validating locations where two named roads meet, providing clear reference points for both manual and automated correction systems. Despite this intersection bias, the presence of successful corrections using milepost and house number references, particularly in fatal crashes, demonstrates the value of maintaining multiple reference systems in crash location validation. The consistent correction rates across severity categories (approximately 20%) suggests that location reporting challenges represent a systematic issue in crash reporting infrastructure rather than being influenced by the specific circumstances or severity of individual crashes.
4. Discussion
The value of comprehensive data integration is not limited to academic studies [
6,
11,
12] but is also recognized in national reporting systems. For instance, Sweden’s national traffic injury reporting system, STRADA, categorizes the degree of completeness in injury reporting based on the integration of various data sources [
26].
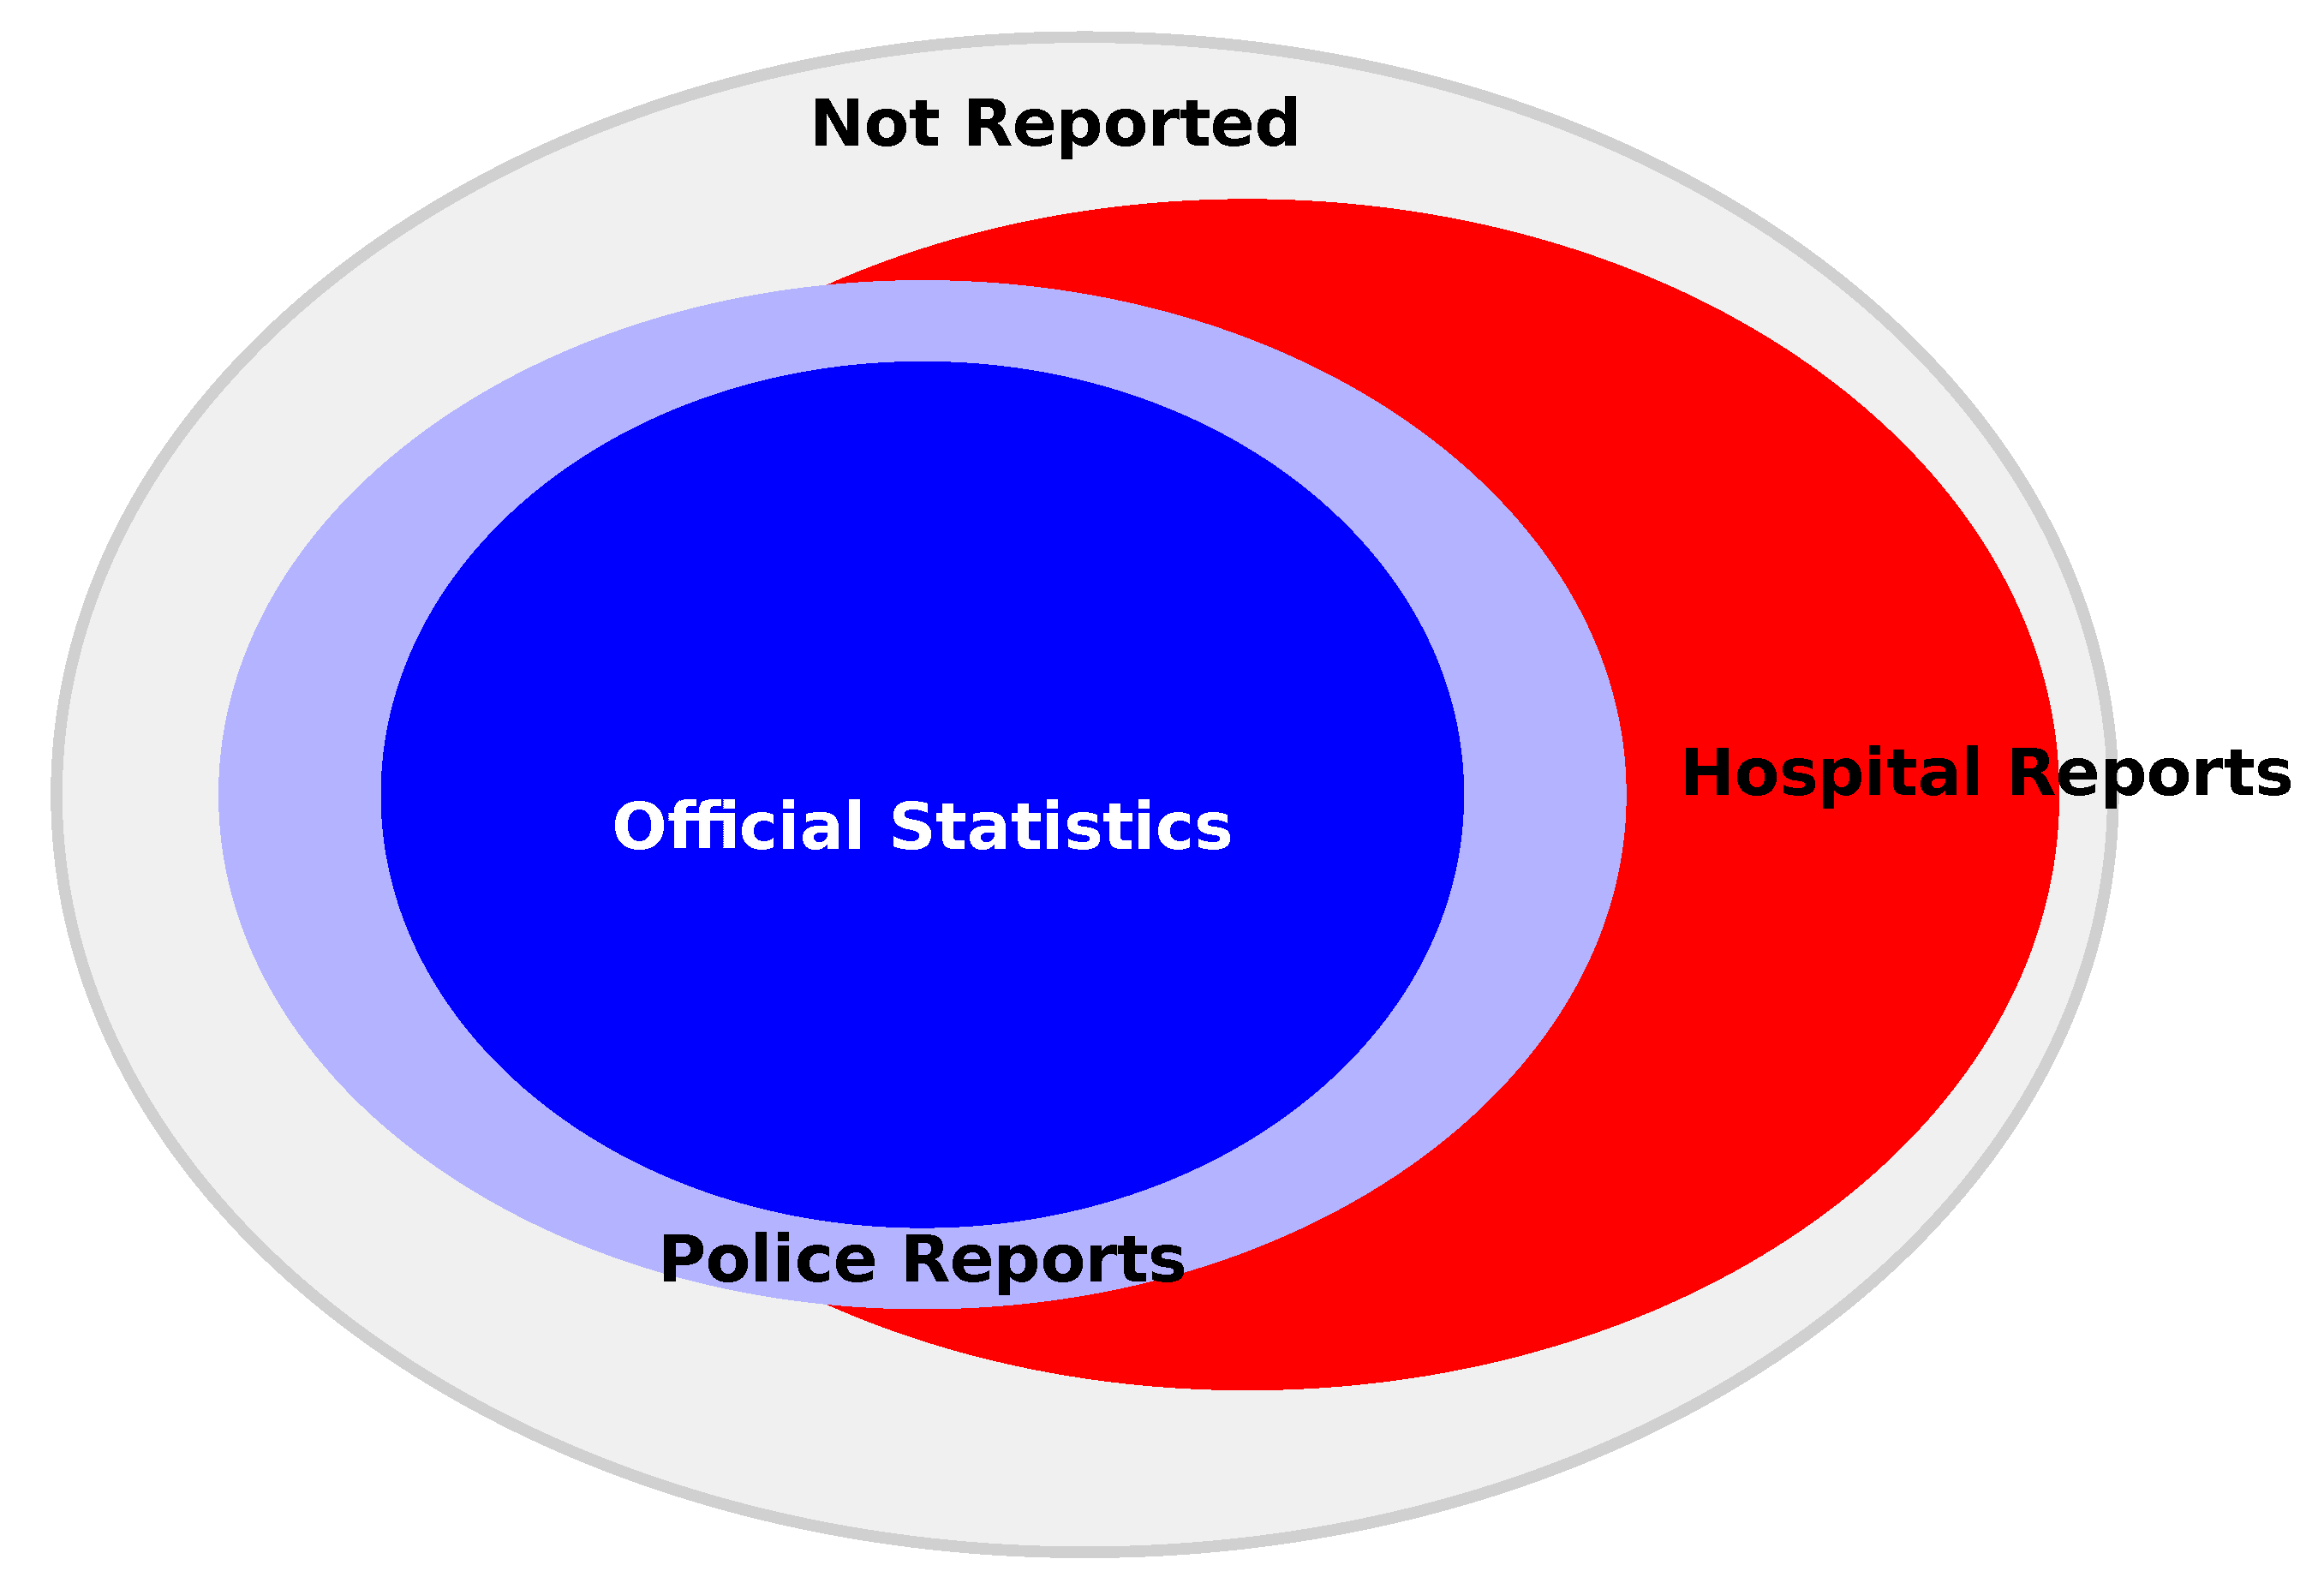
Figure 5 illustrates this categorization, demonstrating how different combinations of data sources contribute to a more complete picture of road accidents. Note that even when including both police reports and hospital reports, a subset (grey in
Figure 5) of crashes are not reported anywhere. In fact, a 2017 study in Sweden [
27] found that only about 63% of traffic-related injuries were captured in STRADA, while the Patient Registry (PAR) captured approximately 65% of cases. The overlap between these systems was surprisingly low, with only about 30% of road traffic injuries being recorded in both systems.
In Sweden, hospitals are legally mandated to report all patients injured on public roads to the national injury database [
28]. While similar data consolidation efforts exist in the United Kingdom and the Netherlands, these practices remain voluntary rather than legally required. Beyond official reporting systems, some academic researchers have successfully incorporated insurance data to complement police and hospital records [
29]. However, such insurance data are typically only available for specific time-bound analyses and rarely accessible at regional or national levels.
4.1. Event Data Recorders in Europe
As of July 2024, new vehicles sold in the European Union must include an Event Data Recorder (EDR), devices designed to capture critical crash-related data, such as vehicle speed, braking activity, seatbelt usage, and airbag deployment, providing valuable insights into crash dynamics. However, to address privacy concerns, the EU regulations explicitly exclude the recording of GPS location, audio, video, or any data that could identify the driver or passengers. Without GPS details, EDRs are not going to help improve crash location accuracy, however.
4.2. Automated Reporting by Manufacturers
California has introduced legislation [
30] to addresses the need for more comprehensive and accurate reporting of autonomous vehicle incidents. Key provisions of this bill include the following:
Requiring manufacturers of autonomous vehicles to report to the Department of Motor Vehicles (DMV) on any vehicle collision, traffic violation, or disengagement.
Establishing a system for public reporting of incidents involving autonomous vehicles, with a process for the DMV to verify and investigate these reports.
Implementing penalties for non-compliance, including fines and potential suspension or revocation of a manufacturer’s permit.
4.3. Connected Vehicle Data Opportunities
Connected Vehicles are generally thought of as fully autonomous, but even with semi-autonomous vehicles, it would be possible for vehicles to share data. Work is underway on protocols for such data sharing [
31,
32], and although privacy will need to be maintained, formalizing data collection and sharing hold promise for a better future when it comes to data quality.
4.4. Future Research
This study introduces a novel multimodal artificial intelligence framework for automated geospatial data validation that integrates credibility scoring algorithms, spatial analysis, and large language model interpretation. Our empirical evaluation using 5000 geospatial records demonstrates the effectiveness of this computational approach, with the framework successfully identifying validation requirements in approximately 20% of cases through systematic multi-source analysis.
The key computational contributions of this work include the following:
The development of a dynamic credibility-based scoring algorithm that systematically integrates multiple sources of geospatial information with weighted validation metrics.
A demonstration that validation reliability varies significantly based on reference point types and initial coordinate consistency, providing insights for adaptive validation strategies.
The implementation of a modular computational framework that processes structured coordinates, visual diagrams, and narrative text through unified validation pipelines.
The integration of multimodal LLMs with spatial database queries to extract and validate location information from diverse data formats.
These contributions collectively represent a significant advancement in the intelligent geospatial validation methodology and establish a foundation for automated data quality assessment in location-dependent applications. The framework’s modular architecture enables adaptation to various domains requiring precise geospatial data validation, from emergency response systems to autonomous vehicle applications.
Several promising avenues for advancing this computational framework emerge from this work:
Real-time Processing Optimization: This includes enhancing the framework’s computational efficiency for real-time deployment in electronic reporting systems and intelligent infrastructure applications.
Specialized Model Development: While our current implementation utilizes general-purpose multimodal LLMs, future research could explore domain-specific model fine-tuning for improved accuracy in visual diagram interpretation and narrative analysis.
Cross-Domain Validation: This includes expanding the framework’s application to other geospatial validation domains such as property records, environmental monitoring, and emergency response systems to demonstrate broader computational generalizability.
Connected Systems Integration: This includes exploring integration with emerging connected device ecosystems and automated data collection systems to create comprehensive validation networks for intelligent infrastructure applications.
4.5. Technical Limitations
Several technical limitations of the current computational framework should be acknowledged:
Data Format Dependencies: The framework requires specific structured data elements, including coordinate pairs, reference point information, and multimodal content. Adaptation to different data schemas requires modification of the validation pipeline.
Multimodal Processing Constraints: LLM interpretation performance varies based on input quality and standardization. The framework’s effectiveness depends on consistent formatting and the quality of visual and textual inputs.
Reference Database Integration: Validation accuracy relies on the quality and currency of spatial reference databases. The framework’s modular design allows for database updates, but performance depends on underlying data completeness.
Computational Scalability: While our implementation processes batches efficiently, large-scale deployment would require optimization for distributed processing and memory management.
Ground Truth Validation: The framework’s validation is based on consistency checking rather than absolute ground truth verification, which would require extensive manual field validation for comprehensive assessment.
4.6. Framework Implementation Considerations
Based on our computational framework development, we offer the following considerations for system deployment:
- 1.
System Integration:
The validation framework’s modular design enables integration with existing electronic reporting systems.
Standardized data input formats facilitate adoption across different organizational systems.
The credibility scoring approach provides quantitative validation metrics for decision support.
- 2.
Computational Considerations:
The framework’s threshold-based processing optimizes computational resource allocation.
Batch processing capabilities support large-scale validation operations.
The modular architecture allows for selective implementation of validation components based on available data.
- 3.
Adaptability:
The framework can be adapted to different geospatial validation domains through the modification of reference databases and validation criteria.
Multimodal components can be adjusted based on available data types and quality requirements.
The credibility scoring system can be recalibrated for different application domains.
- 4.
Privacy and Security:
This research presents a proof-of-concept prototype that requires comprehensive privacy measures for production deployment.
Crash diagrams and narratives may contain sensitive geographic and personally identifiable information requiring automated redaction and sanitization.
Production systems must implement geographic generalization, visual sanitization of diagrams, and secure data management practices.
Compliance frameworks must address privacy regulations such as GDPR and CCPA while maintaining data utility for validation purposes.
The current framework provides a foundation for future privacy-preserving multimodal AI applications in sensitive data environments.
This computational framework establishes a foundation for intelligent geospatial validation that extends beyond single-domain applications, providing a scalable methodology for automated data quality assessment in any system requiring precise location verification. The integration of multimodal AI techniques with spatial analysis represents a significant step forward in developing intelligent systems for automated data validation and quality assurance.


