1. Introduction
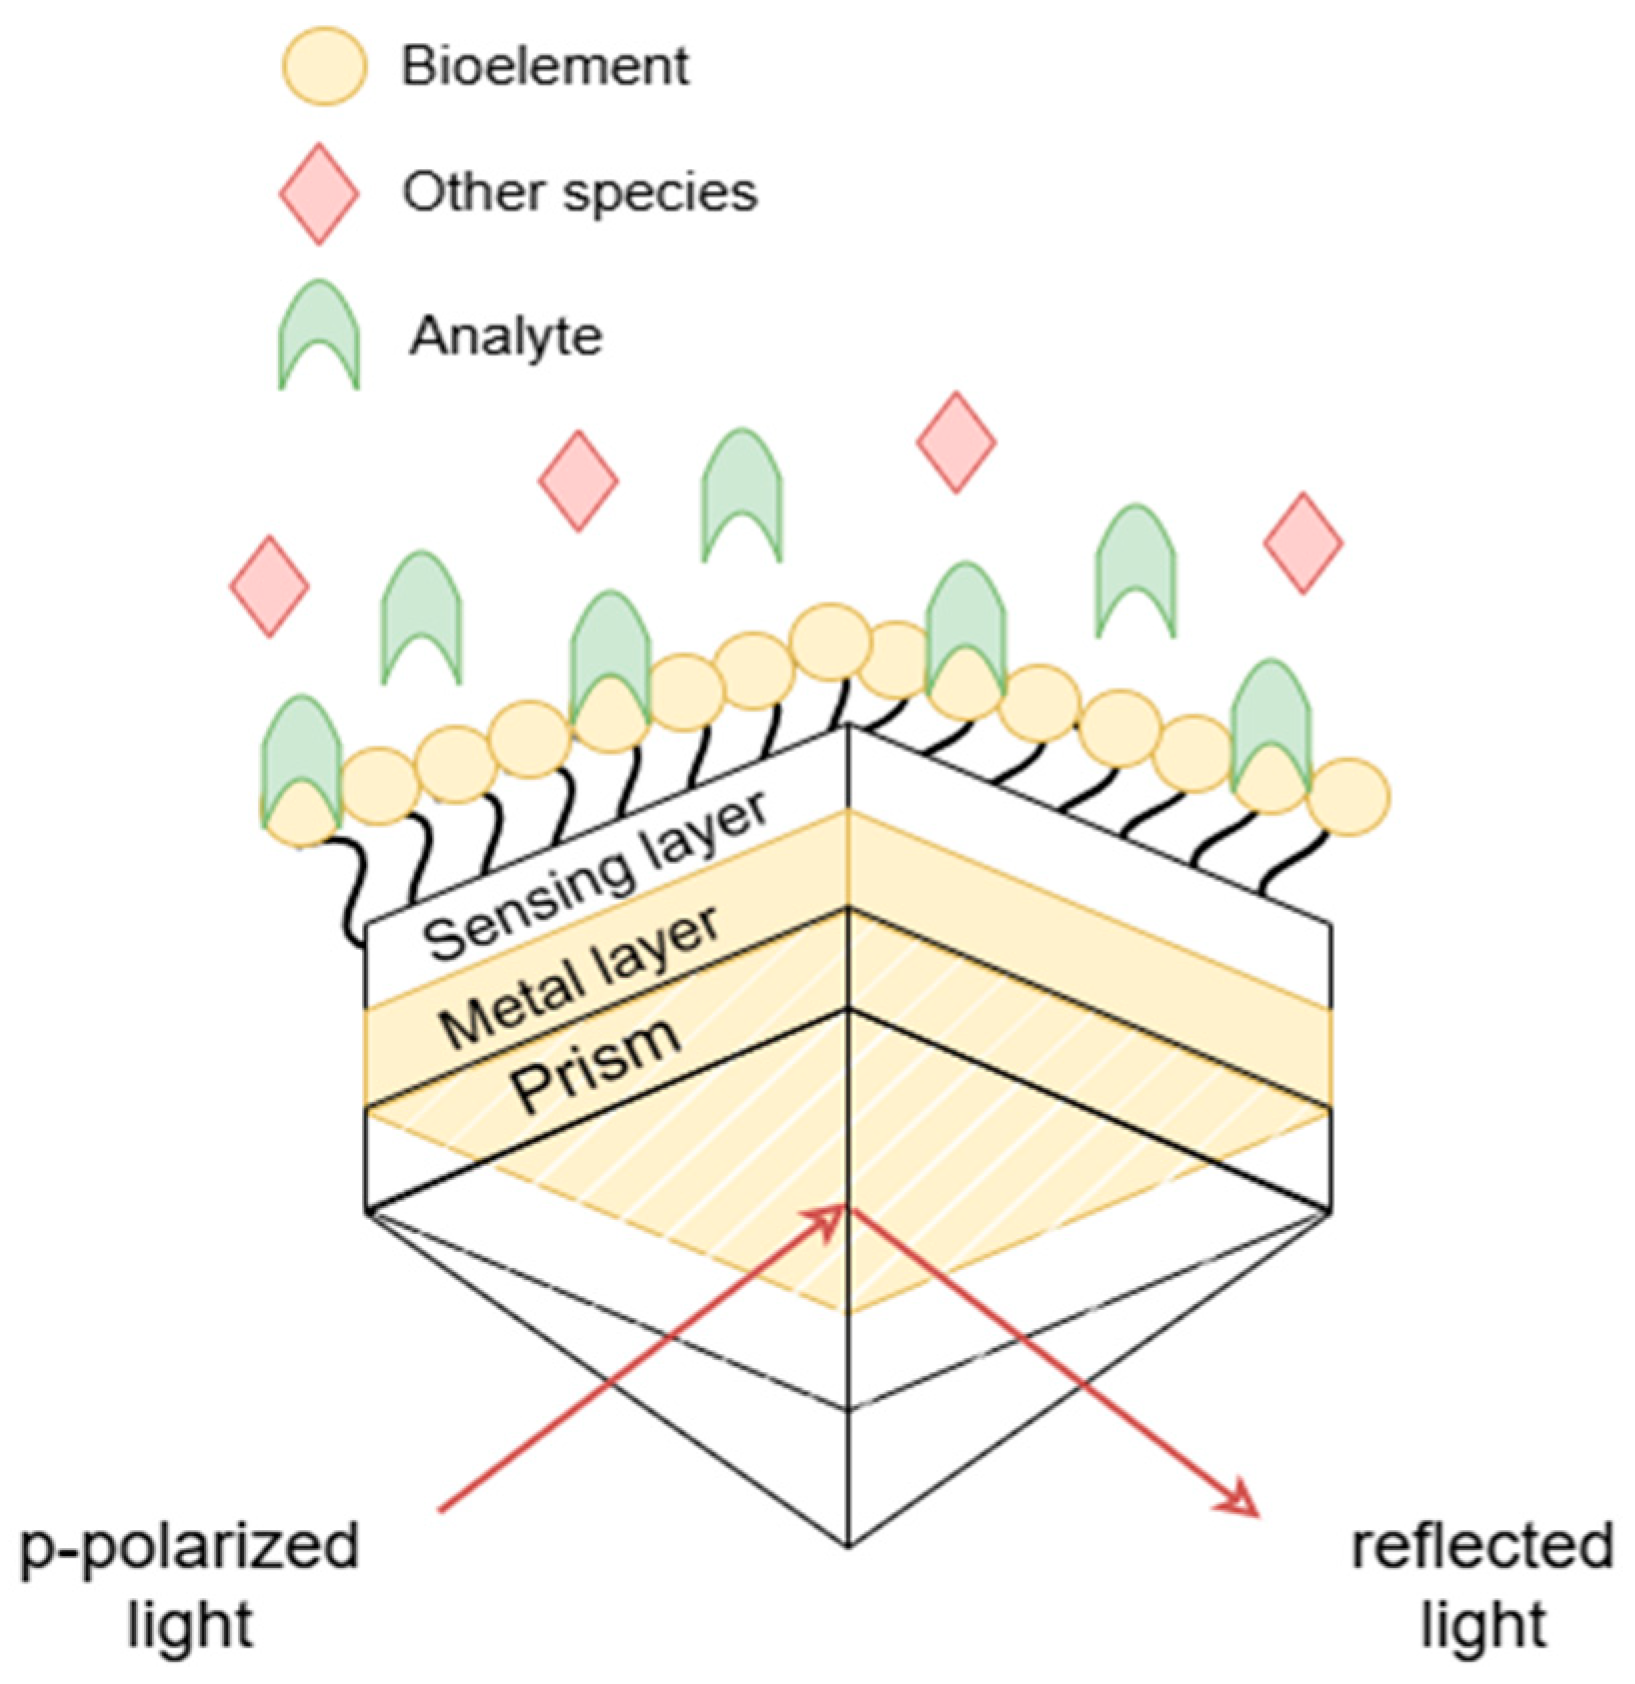
Surface plasmon resonance (SPR) is an optical phenomenon that arises from the interaction between incident light and free electrons on a metal surface, enabling the detection of molecular interactions, such as antigen–antibody binding events. SPR-based biosensors exploit multilayer material structures at the nanometric scale, with sensor performance closely linked to the selection of materials, structural configuration, and layer thickness [
1]. In a typical SPR setup, a prism is employed to match the momentum between the incident photons and surface plasmons, enabling resonance excitation at the metal-dielectric interface [
2,
3], as illustrated in
Figure 1.
Owing to their high sensitivity, real-time monitoring, and label-free operation, SPR biosensors are widely used for detecting target analytes in medical [
4,
5,
6], industrial [
7,
8] and environmental applications [
9,
10]. These devices offer several advantages, such as high sensitivity, real-time detection, and label-free operation, among others [
11].
Enhancing the sensitivity of these devices remains a central challenge, addressed through approaches such as optimizing multilayer configurations, incorporating nanostructured or dielectric materials [
12,
13], and employing hybrid interrogation methods that combine angular and spectral analysis [
14]. In parallel, signal processing techniques—particularly curve smoothing and noise reduction—play a critical role in improving spectral accuracy and reliability [
15,
16].
Smoothing algorithms are essential for mitigating experimental noise in optical spectra and improving the identification of resonance conditions. However, the effectiveness of each method depends on the specific characteristics of the signal, requiring a balance between noise suppression and the preservation of relevant spectral features [
17].
In this context, the present study introduces an open-source computational tool developed in MATLAB for SPR biosensor analysis and characterization. The tool integrates traditional and hybrid analysis strategies, as well as four smoothing techniques—Gaussian filter, Savitzky–Golay filter, spline smoothing, and Exponentially weighted moving average (EWMA)—to refine spectral data and improve the precision in determining the resonance angle. It features an interactive graphical interface that allows users to import experimental data, configure analysis parameters, visualize results, and export them for further use.
By combining analytical flexibility and ease of use, this tool provides researchers with a robust framework to optimize SPR sensor performance and address common limitations related to signal instability and environmental noise. The main contributions and highlights of this study include (1) the proposal of an innovative open-source tool for optimized SPR biosensor analysis; (2) the implementation of hybrid and traditional techniques to improve data interpretation; (3) the inclusion of various smoothing methods to minimize experimental noise and enhance biosensor sensitivity; and (4) the development of an interactive interface that facilitates the tool’s usability for researchers and professionals in the field.
This paper is structured as follows:
Section 2 presents the theoretical foundations of surface plasmon resonance (SPR) biosensors, highlighting their experimental configurations and working principles, discusses the main data smoothing techniques applied to SPR biosensors, detailing the methods used to reduce experimental noise and improve spectral analysis accuracy and approaches a review of the current state-of-the-art and recent advances in SPR biosensor analysis and simulation tools.
Section 3 describes the development of the computational tool, including its implementation, functionalities, and graphical interface. Finally,
Section 4 presents the conclusions and future work, emphasizing the study’s contributions and potential improvements, such as implementing thermal compensation techniques.
2. Surface Plasmon Resonance (SPR) Biosensors
This section presents a comprehensive overview of the key characteristics of surface plasmon resonance biosensors, which are widely used for real-time and label-free detection of biomolecular interactions. We explore their fundamental operating principles, sensitivity factors, and material configurations. In addition, we discuss the data smoothing techniques employed to enhance the analysis of SPR spectral curves by minimizing experimental noise and improving the accuracy of resonance point detection. Finally, a review of the current state-of-the-art approaches and recent advances in SPR biosensor analysis is provided, highlighting the relevance and potential of combining traditional and advanced processing techniques.
2.1. Surface Plasmon Resonance (SPR) Fundamentals
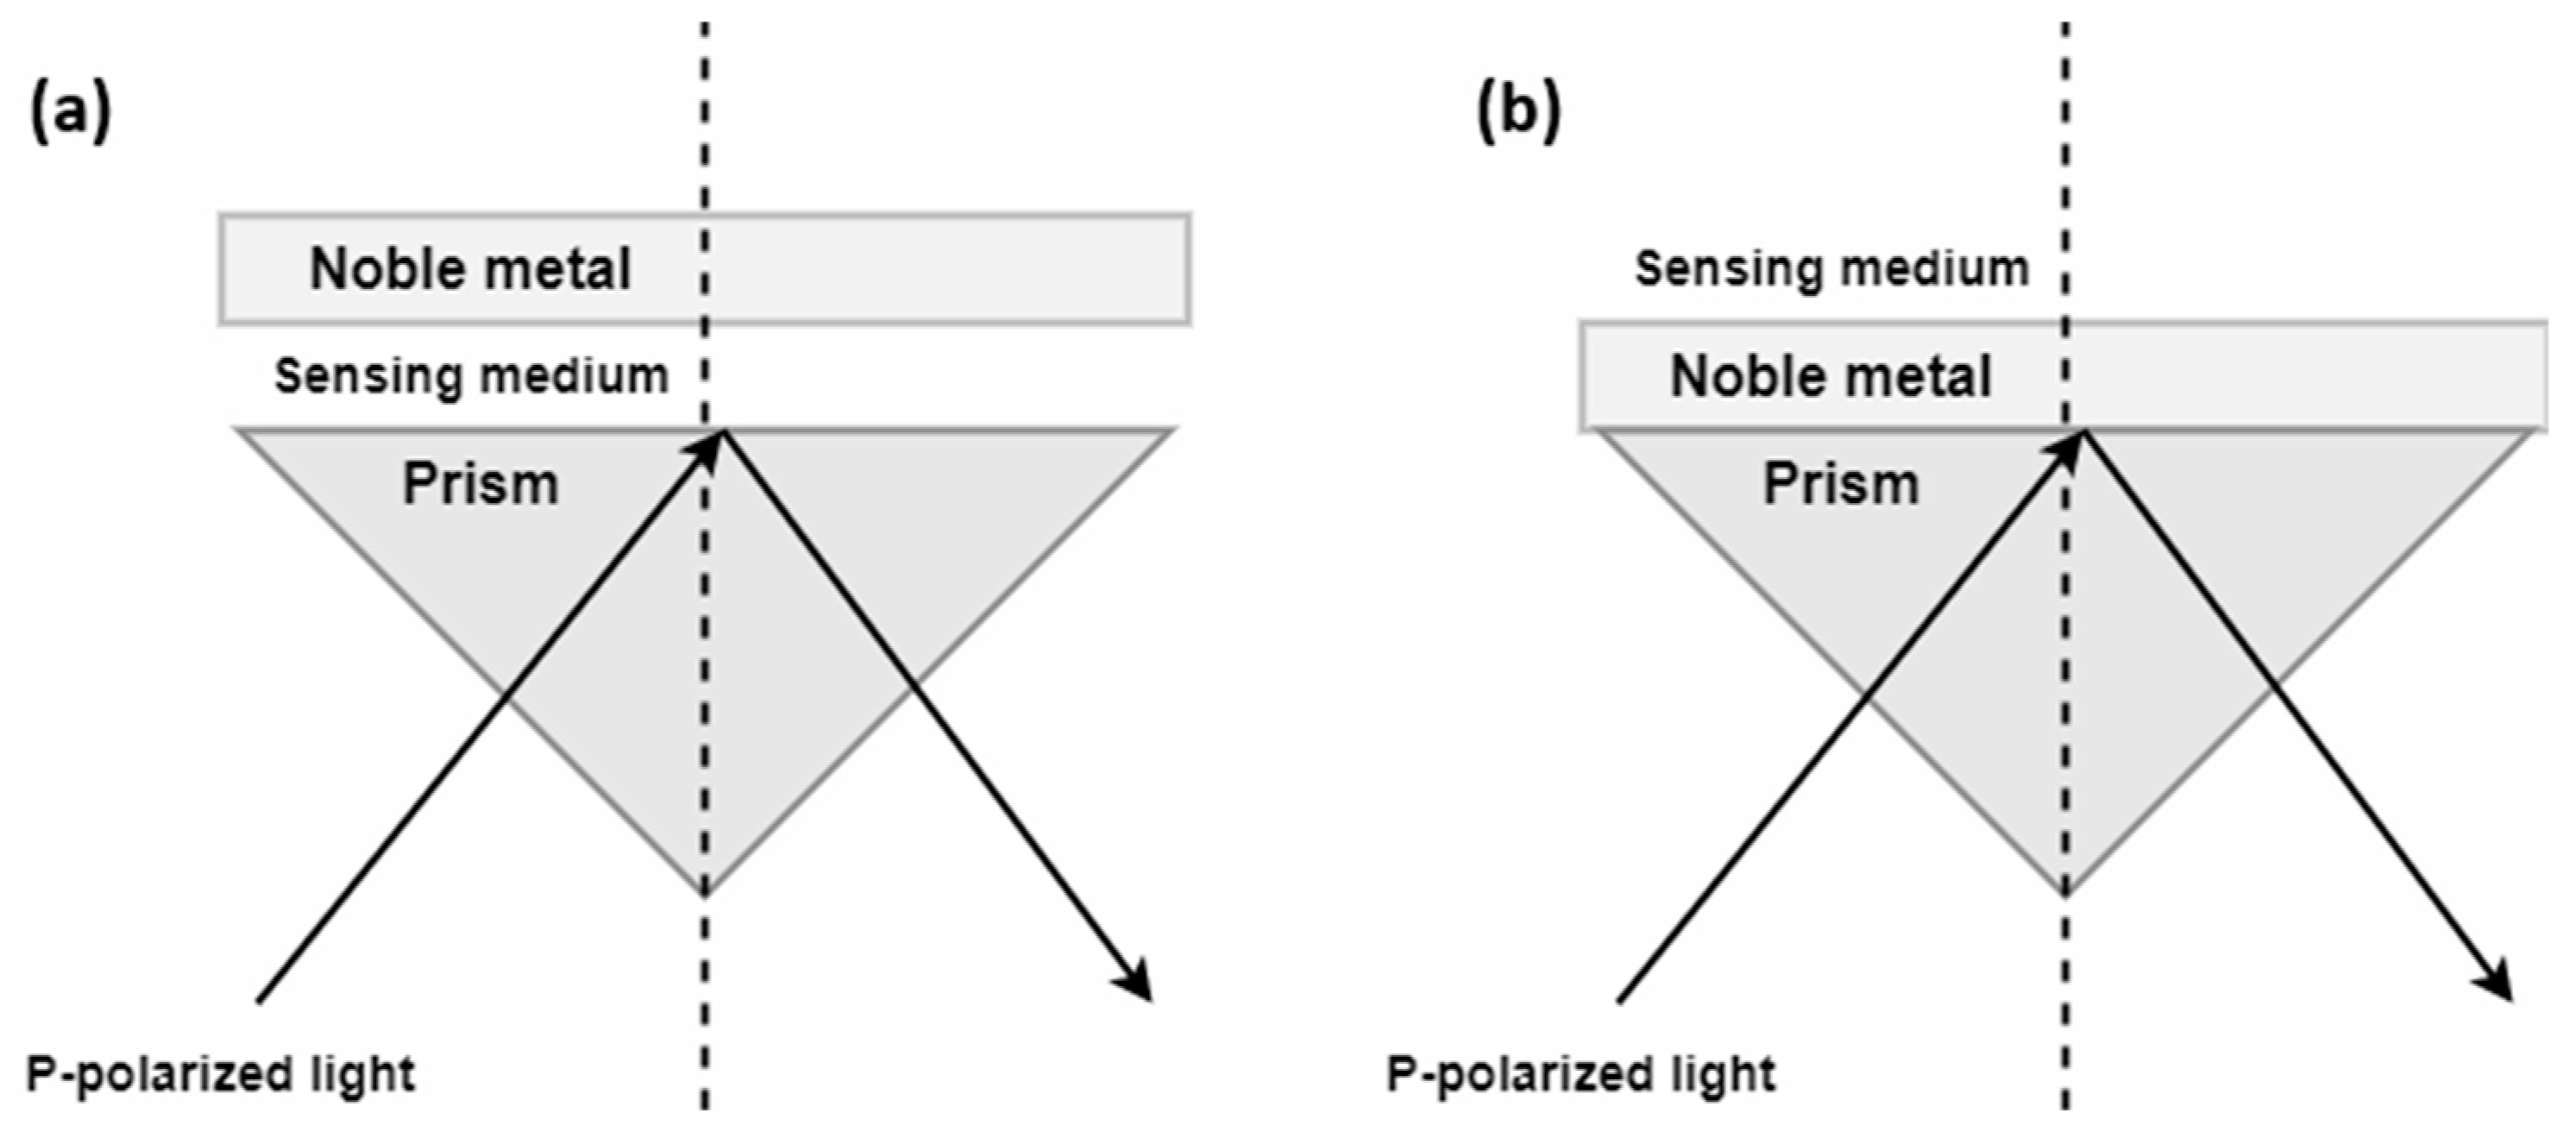
Otto and Kretschmann proposed two systems to excite surface plasmons, with the latter being the most commonly used in commercial instruments. In the Kretschmann configuration, polarized light passes through a prism to the interface where the metal layer is in direct contact with it [
18]. In the Otto configuration, an air gap separates the prism base from the metal layer, requiring greater structural precision to maintain proper sample flow.
The Kretschmann configuration is the more conventional approach, as the metal layer is positioned directly above the prism, resulting in more efficient plasmon generation. In contrast, the Otto system requires maintaining a constant gap between the metal and the glass, making its implementation more complex [
19]. Both configurations are illustrated in
Figure 2.
The characteristic reflectance curve can provide various insights into the monitored process, such as data on the critical angle () where maximum surface plasmon resonance occurs. The observed parameter, depending on the chosen investigative technique, changes according to the refractive index of the layer near the sensor surface, which is directly related to the presence and concentration of the analyte.
Conventional SPR data analysis, based on angular or spectral investigation, relies on variations in optical reflectance as a function of either the incidence angle or the wavelength of light. However, this traditional approach has limitations, such as reduced sensitivity to small concentration variations and susceptibility to experimental noise.
To overcome these drawbacks, it is possible to modify the physical structure of the biosensor by adding layers of materials such as graphene and molybdenum disulfide (MoS2), which enhance the sensitivity and selectivity of these devices [
21,
22].
In recent years, in addition to structural modifications, hybrid approaches that simultaneously combine multiple variables—such as angle and wavelength—have been explored to enhance the accuracy and robustness of SPR sensors. By incorporating different variables, it is possible to generate a three-dimensional analysis and determine the optimal operating point for a given analyte.
The traditional method calculates reflectance as a function of the incidence angle at a user-defined wavelength, identifying the minimum reflectance (SPR critical resonance angle). Determining the critical resonance angle or minimum reflectance is essential for quantifying biomolecular interactions on the sensor surface.
The behavior of light in a multilayer SPR biosensor can be described using the transfer matrix theory and Fresnel’s equation for reflection. The mathematical model for reflectance in a multilayer system can be calculated based on Fresnel coefficients, considering the polarization of the incident light, as described in [
23].
The traditional approach is widely used due to its simplicity and accuracy in determining the resonance angle, but it may be limited by experimental noise and environmental variations. To overcome these limitations, hybrid approaches and data smoothing techniques can be applied to refine the results and improve sensor sensitivity.
In the hybrid method, both the resonance angle and the wavelength are included in the analysis. A 3D scan was implemented to correlate multiple parameters and optimize sensor sensitivity.
The hybrid approach for SPR biosensors provides a more detailed and reliable analysis by combining spectral and angular information. Wavelength scanning within a well-defined range enables the precise identification of the minimum reflectance, optimizing the detection of biomolecular interactions. From the results displayed in a three-dimensional graph, the user can obtain valuable insights into the device’s behavior across different wavelengths, allowing for the detection of the influence of light components in the system.
2.2. Smoothing Techniques for SPR Biosensors
SPR technology is highly sensitive to variations in the substance being analyzed but may face challenges in detecting low concentrations in non-invasive methods. Such monitoring depends not only on the hardware but also on the algorithms used to process the collected signals. Therefore, the use of filters or techniques for curve smoothing ensures that the data remains useful and reliable for users [
24]. To minimize experimental noise and improve analysis accuracy, four smoothing methods were implemented, which will be described below.
2.2.1. Gaussian Filter
Gaussian filtering is a widely used technique in data analysis and signal processing, particularly effective in systems with linear or nonlinear state transition models for smoothing data and reducing noise [
25]. It applies a normal distribution function to assign greater weight to data points closer to the central value, resulting in a smooth transition between data points. This technique effectively preserves the overall structure of the data while suppressing unwanted fluctuations.
Gaussian filtering represents the belief about the current state through a Gaussian distribution, whose mean is an affine function of the measurement, and is represented by Equation (1). In linear systems, there are two main approaches: (i) Optimal filtering, which aims to minimize estimation error and (ii) Robust filtering, which is designed to handle system uncertainties. For Gaussian linear systems, optimal filtering leads to the formulation of the Wiener–Kolmogorov filter and its extension, the well-known Kalman filter [
26].
where
represents the standard deviation, controlling the level of smoothing, and
x and
y represent the spatial coordinates within the filter matrix.
The Kalman filter is a recursive algorithm that provides state estimates of a dynamic system based on noisy measurements and is widely used in navigation and tracking applications. In nonlinear systems, techniques such as the Extended Kalman Filter (EKF) and the Unscented Kalman Filter (UKF) are employed to handle the complexity of nonlinear relationships between variables, allowing for more precise state estimation [
27].
Data obtained from SPR biosensors often contain noise due to environmental fluctuations, signal interference, or variations in experimental conditions. Gaussian filtering can be applied to smooth these data, reducing noise and enhancing signal clarity. In [
28], a SPR sensor coupled with a digital Gaussian filter was proposed, improving detection performance by utilizing the central angle shift calculated from a double shift instead of the conventional resonance angle shift, resulting in a nearly twofold increase in refractive index sensitivity.
2.2.2. Savitzky–Golay Filter
The Savitzky–Golay filtering method is a data smoothing technique based on the application of a polynomial fit within a sliding window across the dataset. Developed by Savitzky and Golay in 1964, this technique was initially used to reduce noise in chemical spectra, demonstrating its effectiveness in preserving the shape and height of wave peaks [
29]. Unlike other smoothing filters, this method minimizes the sum of the squared differences between the fitted values and the original data, allowing for the retention of important features, such as peaks and valleys, while reducing unwanted fluctuations [
30].
The Savitzky–Golay filter can be understood as a weighted moving average filter, where the weights are determined by a polynomial of a chosen degree. It is similar to a finite impulse response (FIR) filter, and its effectiveness depends on two main parameters: (1) window size, which defines the number of data points considered in the polynomial fit; and (2) polynomial degree, which determines the flexibility of the smoothing function. Small window sizes and high-degree polynomials can lead to noisy signals (flexible smoothing), while large windows and low-degree polynomials can cause signal distortion (rigid smoothing). Therefore, selecting appropriate parameters is crucial to balance noise removal and signal detail preservation [
31]. For each signal point, a sliding window of size Ns used to fit a polynomial of order k to the data being smoothed.
In recent years, this technique has been widely adopted in various fields, including multi-spectral signals fluctuation filtering [
32], and noise removal in electrocardiograms (ECG) [
33]. Its versatility ensures that it remains an essential tool for applications requiring efficient smoothing without the loss of critical structural features. The Savitzky–Golay filter is particularly useful in scenarios where smoothing must preserve the overall curve shape, making it ideal for applications such as SPR biosensors.
In [
34], the Savitzky–Golay filter was applied as a smoothing technique to process SPR biosensor output data, effectively removing outliers while preserving the original signal structure. This facilitated the precise identification of signal pattern changes caused by molecular binding. After applying this filtering method, the data were analyzed using change-point detection and polynomial regression to isolate the baseline and predict its trend, allowing for more accurate calculation and quantification of the SPR sensor response. The developed algorithm demonstrated an error rate below 15%, making the data analysis process faster and more reliable.
2.2.3. Splines Smoothing
Spline smoothing is a widely applied technique in curve modeling for datasets, using segmented polynomials to create continuous representations that adjust to data variations. Its main advantage is its flexibility, allowing it to capture patterns without imposing strict constraints. This approach is particularly useful in statistics, functional data analysis (FDA), and trend visualization [
35].
The smooth transition between segments is ensured by the continuity and differentiability of splines (sectional polynomial functions), making them effective for various applications. There are different categories of this technique, including regression splines and penalized splines (P-splines). Regression splines subdivide the predictor variable interval, fitting distinct polynomials in each section, which allows capturing nonlinear patterns [
36]. However, an excessive number of degrees of freedom can lead to overfitting. Penalized splines (P-splines) impose constraints on coefficients to reduce model complexity, allowing better adaptation to high-variability data with noise presence [
37].
A cubic spline, for example, S(x) consists of multiple cubic polynomials
Si(x) defined over consecutive intervals
where each subinterval is modeled by a cubic polynomial, as described in Equation (2).
For the spline to be smooth and continuous, it must satisfy the conditions of continuity, boundary constraints, first derivative, and second derivative. Instead of interpolating all points exactly, a smoothed curve can be obtained by minimizing the error function, as described in Equation (3).
where the first term minimizes the difference between the original data and the fitted spline, while the second term prevents abrupt changes in curvature, ensuring smoother transitions. The λ parameter controls the degree of smoothing.
In [
38], SPR biosensors were used for high-sensitivity biochemical detection with rapid response times. The study proposed a fast-wavelength scanning SPR spectroscopic system, employing an advanced spectral curve fitting method (4-PSCR) to enhance precision and speed in analysis. Spline smoothing allows for the precise interpolation of spectral data, effectively reducing noise and ensuring the accurate identification of the resonance wavelength. This enables the detection and imaging of biomolecules, including the spike protein of the coronavirus, with high accuracy and potential for efficient screening.
2.2.4. Exponentially Weighted Moving Average (EWMA)
The exponentially weighted moving average (EWMA) adjusts the mean of a time series by assigning greater weight to the most recent values, making it more sensitive to rapid changes compared to the simple moving average, which treats all values equally. This characteristic makes EWMA particularly effective in detecting anomalies and trends in rapidly changing data, allowing the model to adapt quickly to new information [
39]. EWMA is defined by Equation (4). Where
s the smoothing factor,
is the original value at time
t and
is the smoothed value at the previous time step. Thus, the resulting value is a combination of the current value and the previously smoothed value.
The EWMA approach is advantageous in fields such as quality control and demand forecasting, where rapid response to changes is critical. In [
24], the study discusses advancements in non-invasive and minimally invasive glucose monitoring technologies, exploring sensors and biosensors, including surface plasmon resonance (SPR) based biosensors, and signal filtering methods such as Exponentially weighted moving average (EWMA) filtering. One application of EWMA mentioned in the study is its use as the second stage of a multi-step filtering process, where a locally weighted polynomial is initially applied to identify glucose variations unrelated to physiological phenomena. EWMA is then employed to selectively smooth noisy signal regions, ensuring efficient noise reduction without compromising essential information.
2.3. State of the Art in SPR Biosensor Simulation Tools
Recent advancements in surface plasmon resonance (SPR) biosensor technology have led to significant improvements in sensitivity, miniaturization, and multiplexing capabilities. Modern SPR systems integrate nanostructured materials such as graphene, MoS₂, and dielectric layers to enhance signal response and analyte binding efficiency. Additionally, the emergence of portable and smartphone-based SPR platforms has expanded the accessibility of this technology to point-of-care diagnostics and field applications. In parallel, computational methods for signal analysis have evolved to address challenges related to experimental noise and environmental variability. In this evolving landscape, several studies have contributed to the theoretical and practical development of SPR biosensor simulations, offering diverse perspectives on materials, configurations, and analytical frameworks.
In Liu, et al. offers a comprehensive overview of the historical development of surface plasmon resonance (SPR) technology and introduces the fundamental principles underlying SPR signal detection. It highlights recent applications of SPR sensors across various fields, addressing their figures of merit as well as inherent limitations. Furthermore, it presents personal perspectives and future development trends in sensor preparation and design, which are considered critical for enhancing SPR sensor performance [
40].
In Phillips, et al. presents a comparative analysis between an SPR biosensor simulation coded in Python—which incorporates the application of electric polarization on the sensor surface—and the same simulation implemented in MATLAB. The primary objective is to explore the process of converting MATLAB code to Python and to evaluate the advantages and limitations of running SPR simulations in Python, particularly with the aim of assessing the feasibility of performing such simulations on more affordable computing platforms, such as the Raspberry Pi [
41].
Kumari, et al. presents a reviews the evolution of SPR (surface plasmon resonance) technology, tracing its development from the early observations of polarized light interacting with metal-coated diffraction gratings to modern advancements [
42]. It outlines the fundamental principles underlying SPR and its application in real-time detection of biomolecular interactions. The review also highlights the contributions of various researchers in advancing the understanding of the SPR phenomenon and the development of SPR-based biosensors.
Huraiya, et al. presents the design of a surface plasmon resonance (SPR) biosensor based on a photonic crystal fiber (PCF) with an optimized bowtie configuration. The biosensor was engineered for the sensitive detection of various analytes, offering a high performance index. The optimized structure enables external refractive index (RI) analysis within the range of 1.32 to 1.44, using a gold coating and tunable geometrical parameters. The study focuses on maximizing sensitivity through optimized geometry and advanced material engineering [
43].
Ashrafi, et al. presents a comprehensive review of the fundamental principles underlying surface plasmon resonance (SPR), elucidating its detection mechanisms through various experimental configurations and examining the global expansion of the SPR sensor market. Furthermore, it explores recent technological advancements, including innovative sensor architectures, multimodal detection strategies, engineered nanostructured interfaces, and the incorporation of smart materials and heterostructures [
44].
Xu, et al. introduces the mechanisms underlying the construction of high spatial resolution SPR imaging (SPRi) systems and presents various experimental configurations, ranging from prism-coupled SPRi and surface plasmon resonance microscopy (SPRM) to surface plasmon scattering microscopy (SPSM). It summarizes recent and promising applications, including molecular interaction analysis, molecular profiling and imaging, single-entity tracking, and single-cell analysis. Additionally, it addresses the major challenges faced over the past decade and outlines future research directions [
45].
Ayache, et al. presents a comprehensive simulation-based investigation into the design and performance optimization of a surface plasmon resonance (SPR) biosensor. The primary aim is to enhance sensitivity and precision by integrating optical and colorimetric biosensing techniques. The biosensor is examined and simulated using the COMSOL Multiphysics platform, allowing for in-depth analysis of its structural and functional parameters [
46].
Anshori, et al. presents the development of a web-based SPR signal processing system. The application, built using Python’s Matplotlib and Bokeh libraries, enables users to upload, visualize, and analyze SPR biosensor data directly online. The data are stored via Firebase, and the platform offers features such as interactive plotting, automated labeling, and export of results. The main emphasis lies in accessibility and streamlined analysis, aiming to facilitate SPR data interpretation without the need for local software installation [
47].
In comparison to Phillips, et al. which focuses on increasing accessibility to SPR simulations by translating MATLAB code into Python, the current study goes significantly further by developing a complete, standalone computational platform with user-friendly GUI features and advanced signal processing techniques to ensure robust and accurate analysis of SPR data, extending its utility to real experimental scenarios and low-cost hardware environments [
41]. While Liu, et al. and Kumari, et al. offer a broad and detailed review of the technological evolution and applications of SPR sensors, the current work adds to the field by introducing a concrete solution to one of its longstanding limitations: experimental noise [
40,
42].
By implementing and validating various curve smoothing methods against public experimental datasets [
48], this study bridges the gap between conceptual knowledge and practical execution, delivering an applied tool that complements and enhances the theoretical insights of earlier reviews. In contrast to the focus on physical structure optimization found in Huraiya, et al., the present advances the domain by proposing a versatile computational platform that integrates simulation, hybrid angular-wavelength analysis, and real-time data visualization. This multi-approach framework significantly expands the scope of SPR applications, allowing simultaneous parameter optimization [
43].
While Ashrafi, et al. provides a comprehensive overview of SPR system development and commercialization, this work advances the field by introducing a validated computational tool that directly addresses experimental limitations such as signal noise [
44]. Compared to Xu, et al. which emphasizes high-resolution SPR imaging, the present tool enhances resonance angle accuracy in conventional setups, offering a practical and accessible solution [
45]. Unlike Ayache, et al., focused solely on simulations, this work bridges simulation and experimentation by enabling precise analysis of real data [
46]. Additionally, while Anshori, et al. presents a simplified web platform, this study delivers a more complete analytical environment, incorporating advanced signal processing, visualization, and experimental validation, thus better supporting high-precision SPR research [
47].
Villarim, et al. presents the development of an interactive simulation platform for multilayer surface plasmon resonance (SPR) biosensors, designed to optimize the structural configuration and evaluate sensor performance parameters such as sensitivity, detection accuracy, and quality factor. Implemented in MATLAB, the tool allows users to customize the biosensor by adding or removing layers (e.g., TiO
2, SiO
2, MoS
2, graphene) and to simulate its optical response based on real-time changes in refractive index. The simulation results demonstrated that the inclusion of advanced materials like graphene and MoS₂ significantly enhanced the sensitivity—up to 16.59% for gold and 12.99% for silver configurations. However, this sensitivity gain was accompanied by a decrease in detection accuracy and quality factor due to the widening of the reflectance dip. The platform stands out as a cost-effective and user-friendly solution for researchers aiming to analyze and design SPR biosensors, particularly for biomedical applications such as the detection of cardiac and cancer biomarkers [
20].
The present study represents a substantial advancement in the field of surface plasmon resonance (SPR) biosensing by effectively bridging theoretical modeling and practical application. It introduces an open-source computational tool that integrates multilayer physical structure simulation, advanced signal processing techniques, and an intuitive graphical user interface (GUI). Unlike prior static or simulation-only approaches, this dynamic, user-accessible platform directly addresses persistent challenges such as experimental noise and imprecise resonance angle detection, thereby supporting more robust and reproducible experimental workflows.
Building upon the authors’ earlier work Villarim, et al. —which focused on SPR modeling through the Transfer Matrix Method—this study extends that foundation by developing a comprehensive and experimentally validated platform using MATLAB App Designer. Beyond structural simulation, the tool incorporates traditional and hybrid interrogation modes (angular and spectral), real-time spectral visualization, quantitative curve smoothing, and seamless export of analytical results, all within a user-friendly environment [
20].
A key innovation of the tool is the integration of four quantitative curve smoothing techniques—Gaussian Filter, Savitzky–Golay, smoothing splines, and Exponentially weighted moving average (EWMA)—each rigorously evaluated using statistical metrics such as correlation, MAE, RMSE, and standard deviation. To ensure realistic validation, the study employs a publicly available experimental dataset [
48], which provides real reflectance measurements across varying refractive indices and is widely recognized as a benchmark for SPR signal analysis. This dataset has been extensively used in previous studies and materials development, underscoring its relevance and reliability for testing noise reduction and resonance point detection methods under practical condition [
49,
50,
51,
52].
Furthermore, the tool introduces a novel 3D hybrid analysis framework that combines angular and wavelength interrogation, enabling more accurate and multidimensional characterization of SPR biosensor responses. This enhancement surpasses the one-dimensional methodology of [
20] and allows simultaneous optimization of key parameters. By integrating and validating the tool with such a robust dataset, the study ensures not only methodological rigor but also practical applicability, delivering a complete solution for SPR biosensor analysis, performance evaluation, and experimental reproducibility.
3. Computational Tool
The computational tool for the analysis of SPR optical biosensors was developed using Matlab
® software (Version R 2023a), with the App Designer tool. As a result, an executable file will be generated, allowing any user to utilize the software for free without the need for licenses. The application offers four main navigation tabs: Traditional Analysis, Hybrid Analysis, Smoothing Techniques, and User Assistance. The navigation path to be followed by the user is illustrated in
Figure 3.
The flowchart shown in
Figure 3 begins with the definition of the type of analysis to be performed (green). The user can choose between three analytical approaches: traditional (pink), hybrid (blue), and smoothing curve technique (yellow). Selecting traditional analysis (pink), the user defines the sensor’s structural characteristics and the wavelength of the incident light, resulting in an angular investigation of different SPR biosensor models. In hybrid analysis (blue), the metallic layer, minimum and maximum wavelength values, and the increment step are defined. The result is a three-dimensional analysis that simultaneously combines angular and spectral investigations. Opting for the smoothing curve technique (yellow), experimental data are loaded, and the tool evaluates the most suitable smoothing technique to improve sensitivity and reduce noise in the analysis. All resulting data can be exported to a (*.xlsx) file for further analysis and interpretation. The processing is completed after storing the results (green).
The first proposal to improve the signal-to-noise ratio in SPR biosensors is associated with increasing sensitivity by adding layers of specific materials for a given analyte. Thus, the application was designed to simulate such modifications, allowing the addition or removal of layers and evaluating their impact on sensor response.
The SPR biosensor proposed by [
20] used to validate the simulation tool, is illustrated in
Figure 4. The detection layer consists of a PBS (
phosphate-buffered saline) solution with a refractive index of 1.34. Additionally, optional material layers (
—titanium dioxide,
—silicon dioxide,
—molybdenum disulfide, and graphene) can be added to increase sensitivity and selectivity in detecting the target analyte, improving the signal-to-noise ratio.
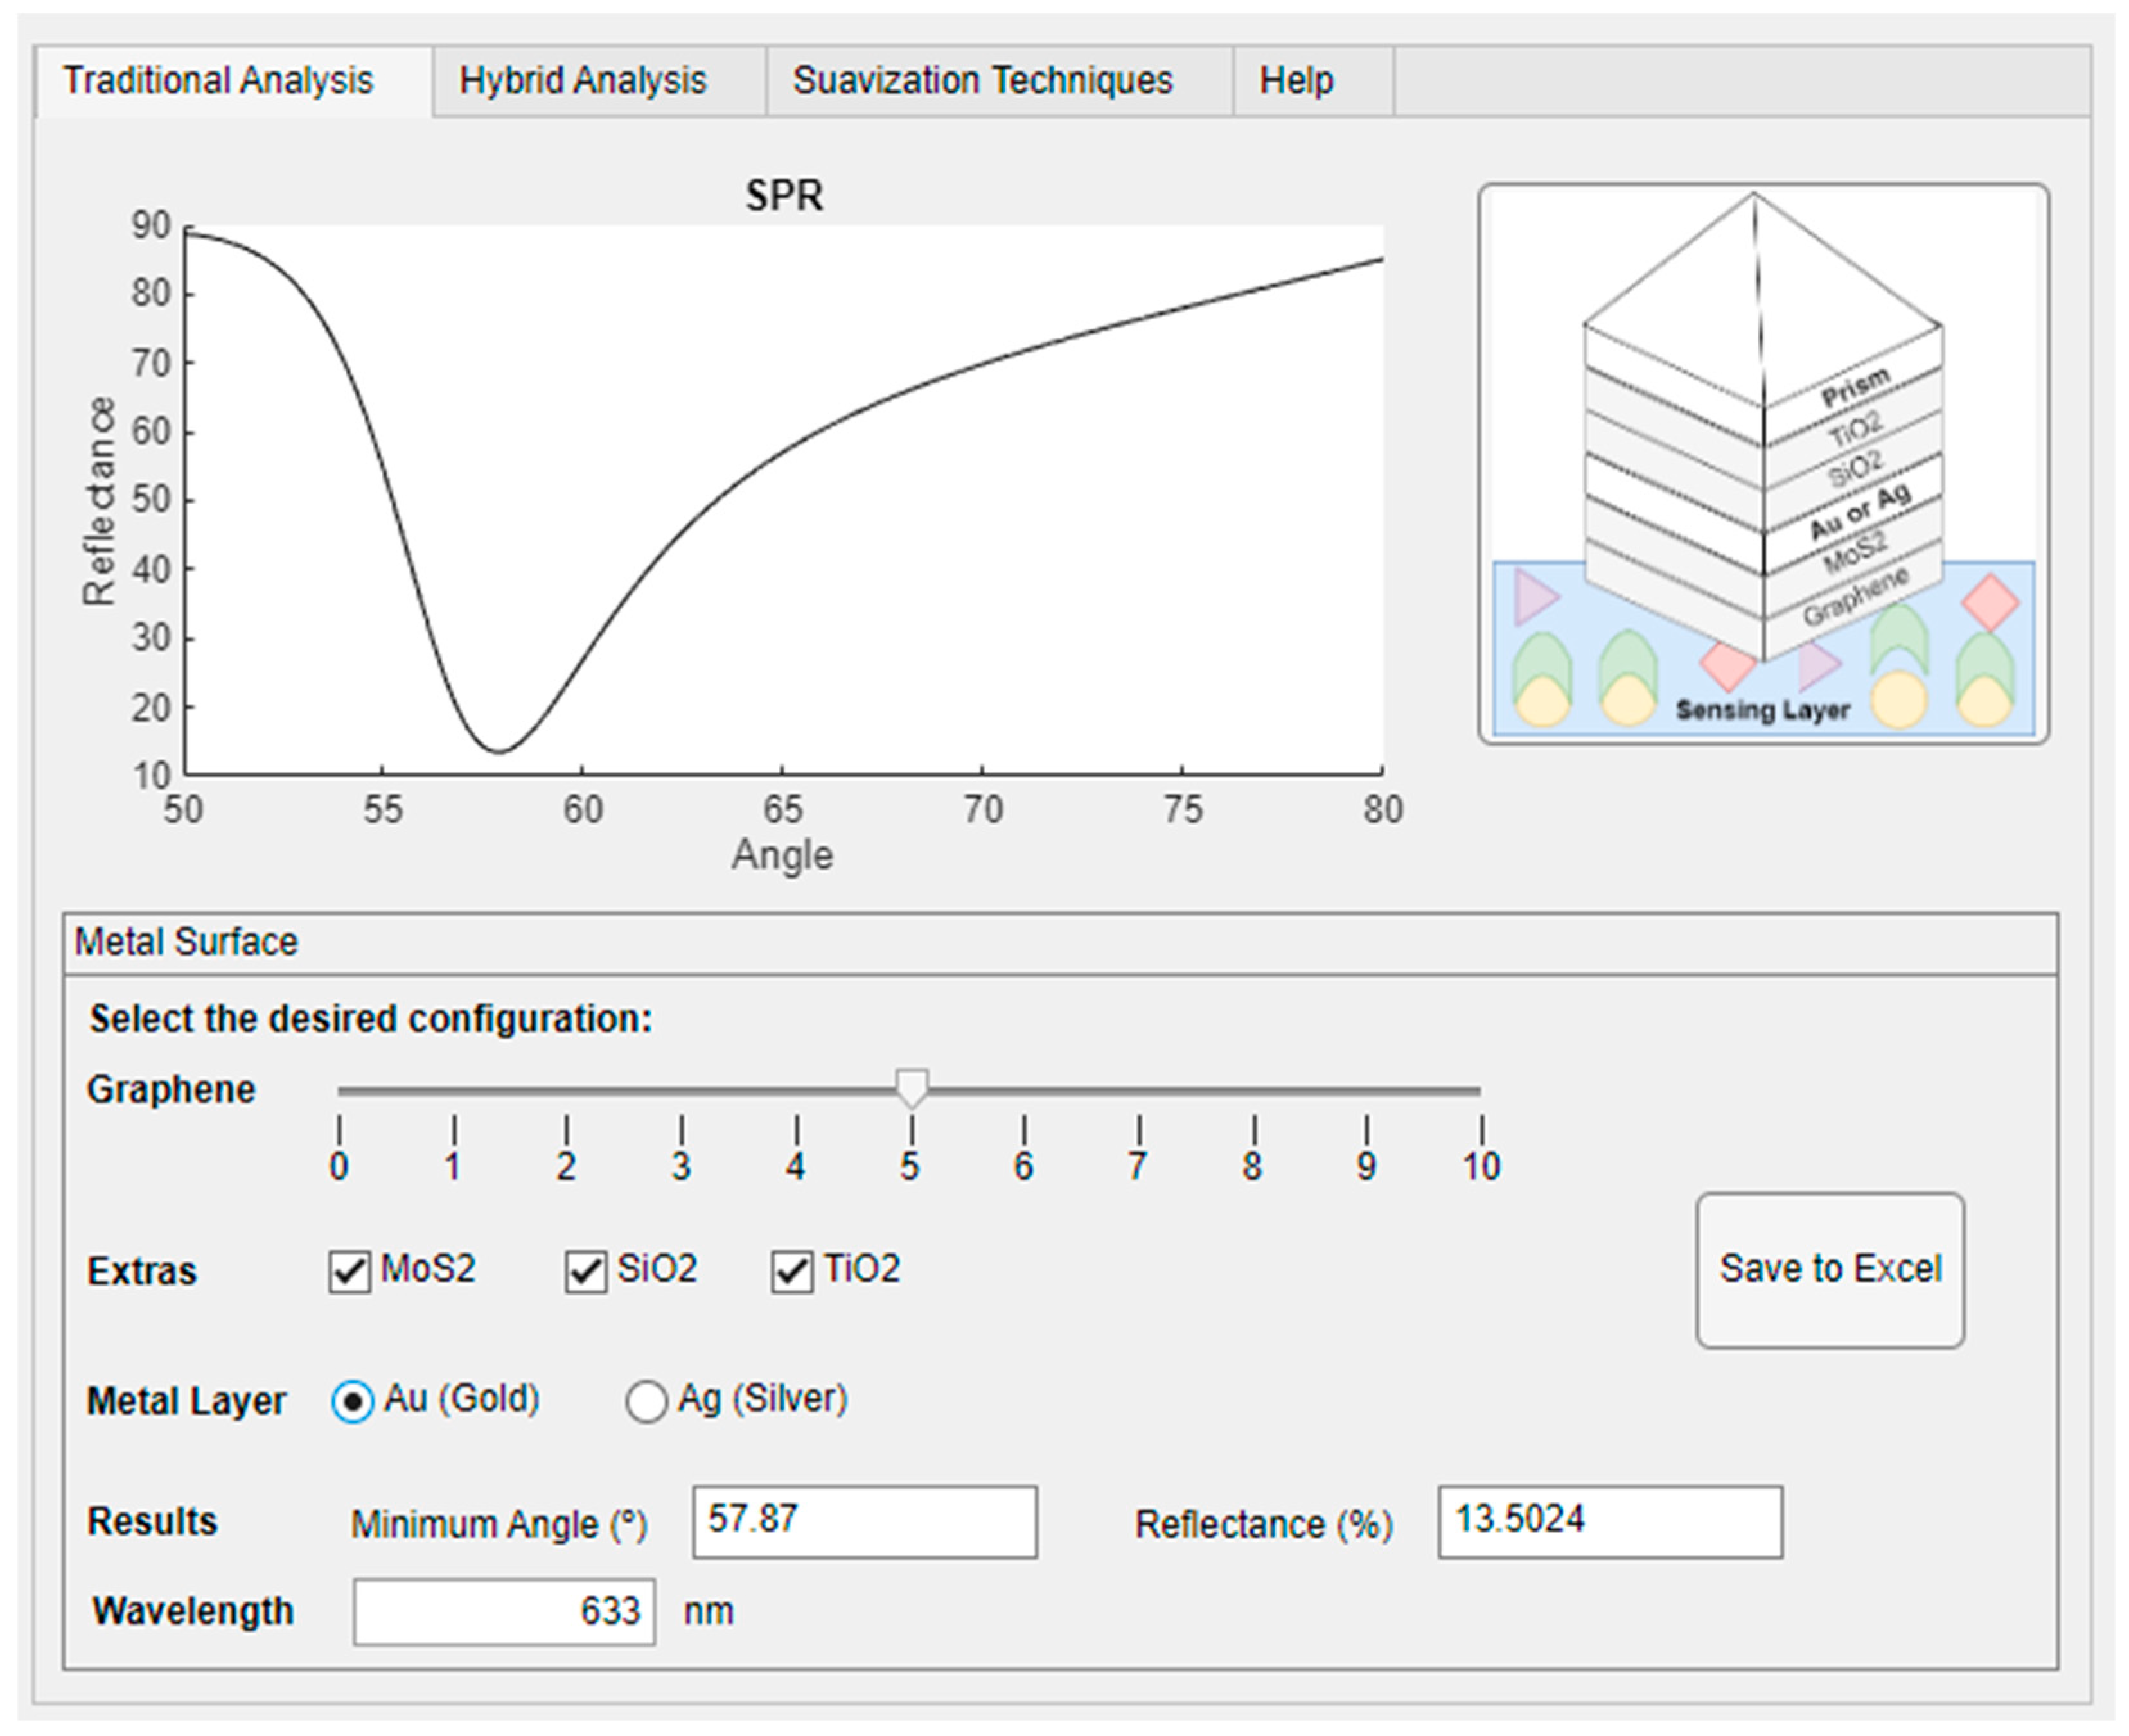
The user must select the metallic layer (gold—Au or silver—Ag), as illustrated in
Figure 5. The wavelength value must be defined in the editable “Wavelength” field (nm). Additionally, extra material layers can be included, customizing the sensor to evaluate variations in its parameters. A slider bar allows adjusting the number of graphene layers, ranging from 0 to 340 nm.
The tool was tested in different structural configurations to evaluate its functionality and the impact of variations on sensor response. The user can visualize the minimum reflectance angle and export the results to a Microsoft Excel spreadsheet for future analysis. In the evaluated case, the adopted λ value was 633 nm.
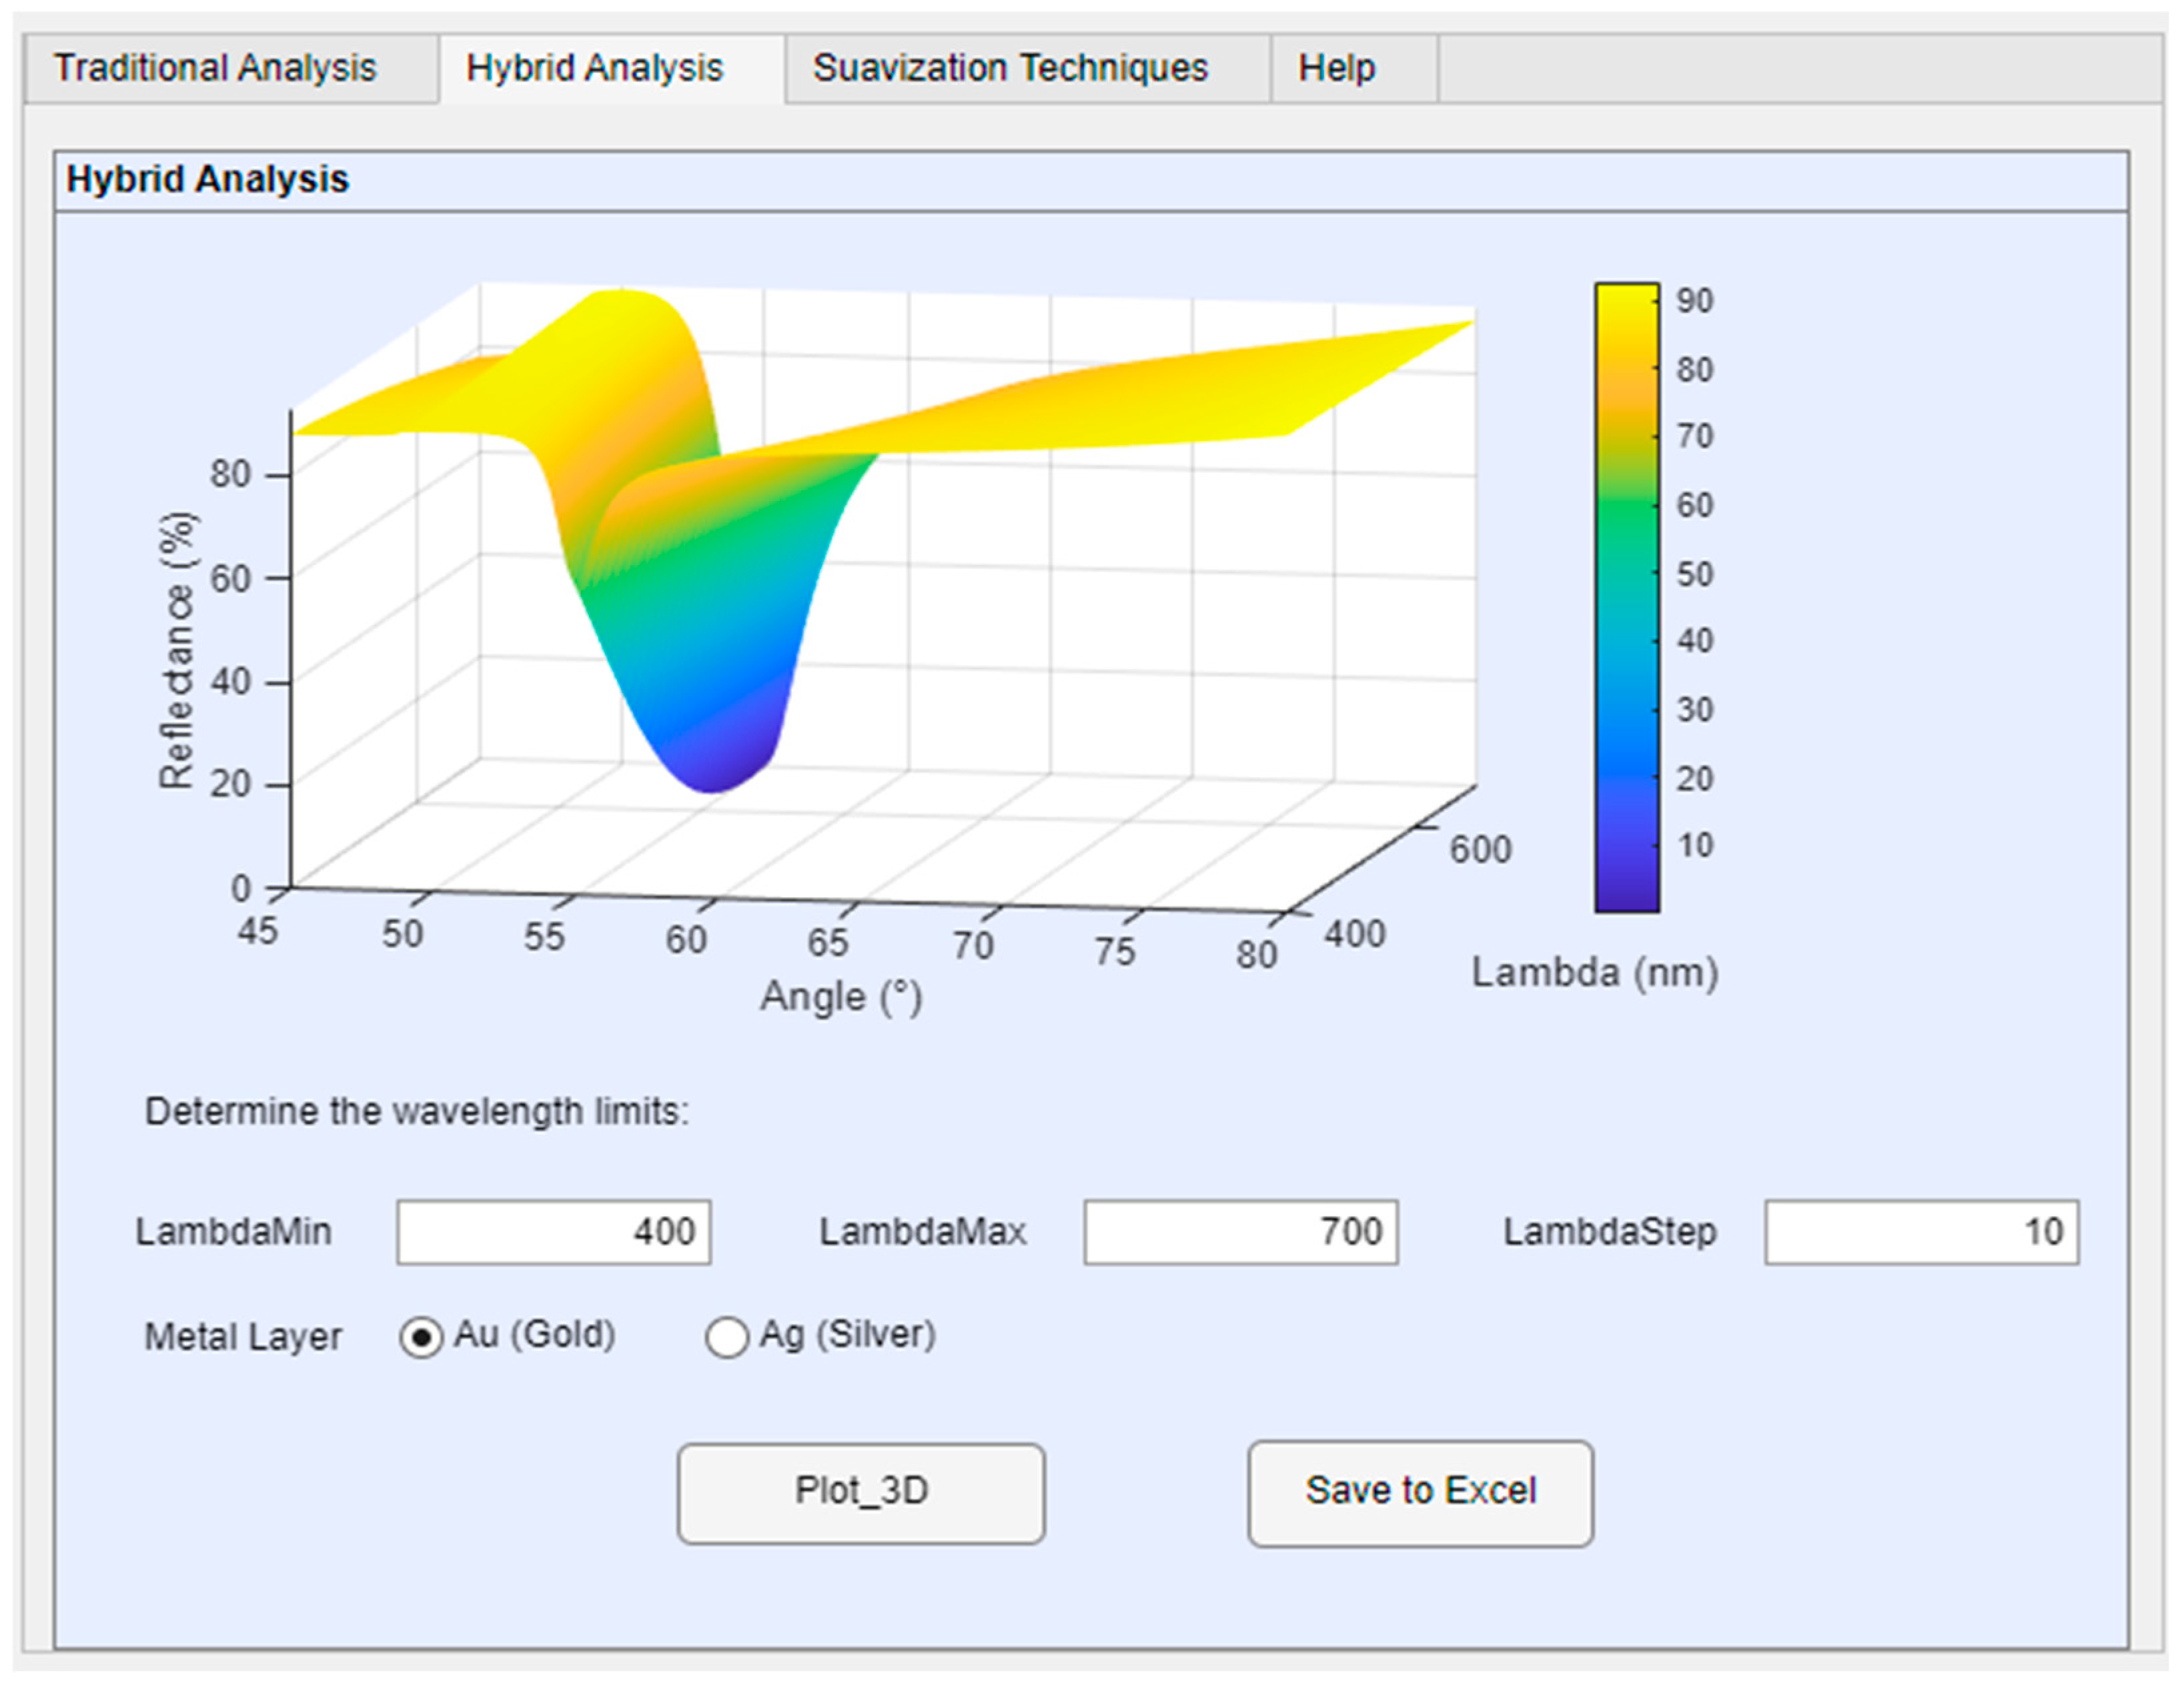
Hybrid analysis combines variations in the incidence angle and wavelength to determine the SPR position in a multilayer structure (prism, metallic layer—gold or silver—and detection medium), as illustrated in
Figure 6. This approach allows for greater precision in determining the resonance position, providing a three-dimensional response surface where the reflection coefficient is evaluated as a function of angle and wavelength simultaneously.
Therefore, wavelength variation was also added to the simulation tool. The user can determine the optimal positioning of angle and wavelength for various possibilities based on the mathematical model. The user must input the maximum and minimum limit values for wavelength analysis, as well as the increment step, as shown in
Figure 6. After defining the parameters in the editable text boxes, the application will calculate the reflectance value for each combination of λ and θ.
Hybrid analysis combines information from different physical variables to provide a comprehensive understanding of a system. To perform the hybrid analysis, a spectral scanning range is defined , considering the following points. (i) The minimum value is determined by the sensor response limit and the laser range (). (ii) The maximum value is determined by the wavelength where the SPR effect is still observed (). (iii) The step is determined by the spectral resolution of the experimental system (). The set of analyzed wavelengths is defined as: λi = λmin + i · ∆λ, i = 1, 2, …, N. Where N is the total number of points within the observed range. The 3D graph is generated with incidence angle information on the X-axis, wavelength on the Y-axis, and reflectance on the Z-axis. In SPR sensors, different wavelengths can be used to improve resolution or detect multiple analytes simultaneously.
The generated 3D graph is interactive and can be viewed from the desired angle. The results can be saved in Excel for data acquisition and processing. Therefore, with hybrid analysis, using operational values such as angle or wavelength, it is possible to infer the optimal operating point without the need for experimental tests, reducing costs and implementation time. Furthermore, the ability to analyze a wide range of wavelength values contributes to detecting the influence of the light source composition used in the experiments and the environment in which the equipment is located.
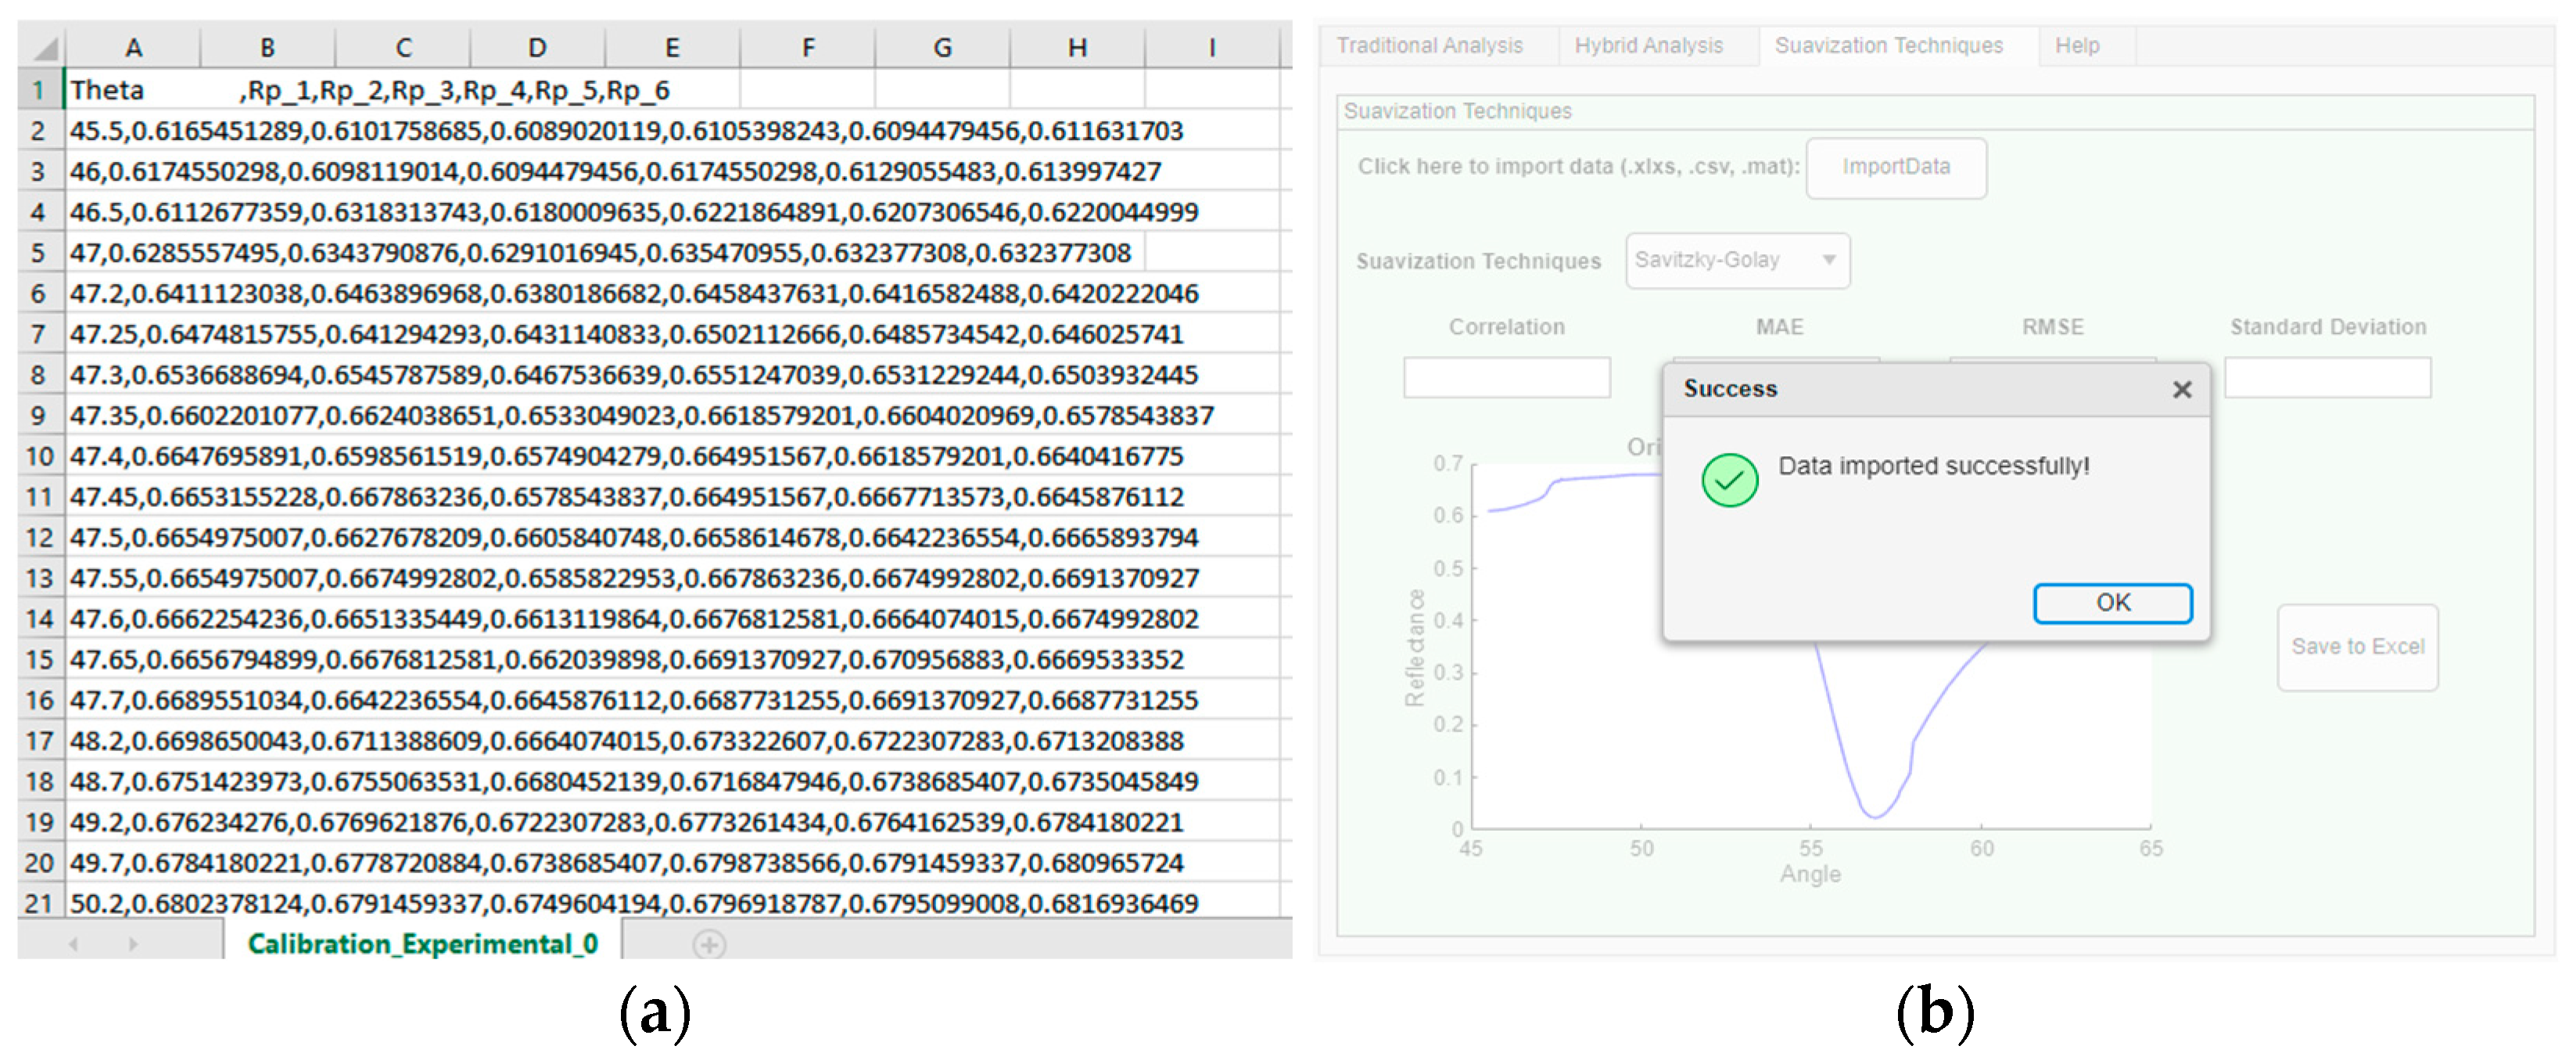
Experimental data analysis involves curve smoothing to reduce noise impact and detect possible trends. Four widely used methods for this purpose are the Savitzky–Golay filter, Gaussian filter, exponentially weighted moving average, and smoothed spline, each presenting distinct characteristics. In this tab, illustrated in
Figure 7, the user can upload an experimental data file in *.csv, *.xlsx, or *.mat format. If a file is successfully selected, a confirmation message will be displayed, as seen in
Figure 8. To test and verify the developed software, a publicly available scientific analysis database by [
48].
The experimental validation in this study was carried out using publicly available datasets that include both theoretical and experimental data [
48]. These datasets provide real reflectance measurements across various angles and refractive indices, enabling a reliable assessment of the computational tool’s performance in realistic scenarios. It was possible to test the effectiveness of the implemented signal processing techniques. This dataset has been widely used in the literature [
49,
50,
51] as a benchmark for SPR sensor analysis and includes reflectance data collected under controlled conditions, using gold-coated SPR sensors with different percentages of cell coverage. The measurements were performed with and without the presence of living cells, enabling the analysis of changes in the refractive index at the sensor interface.
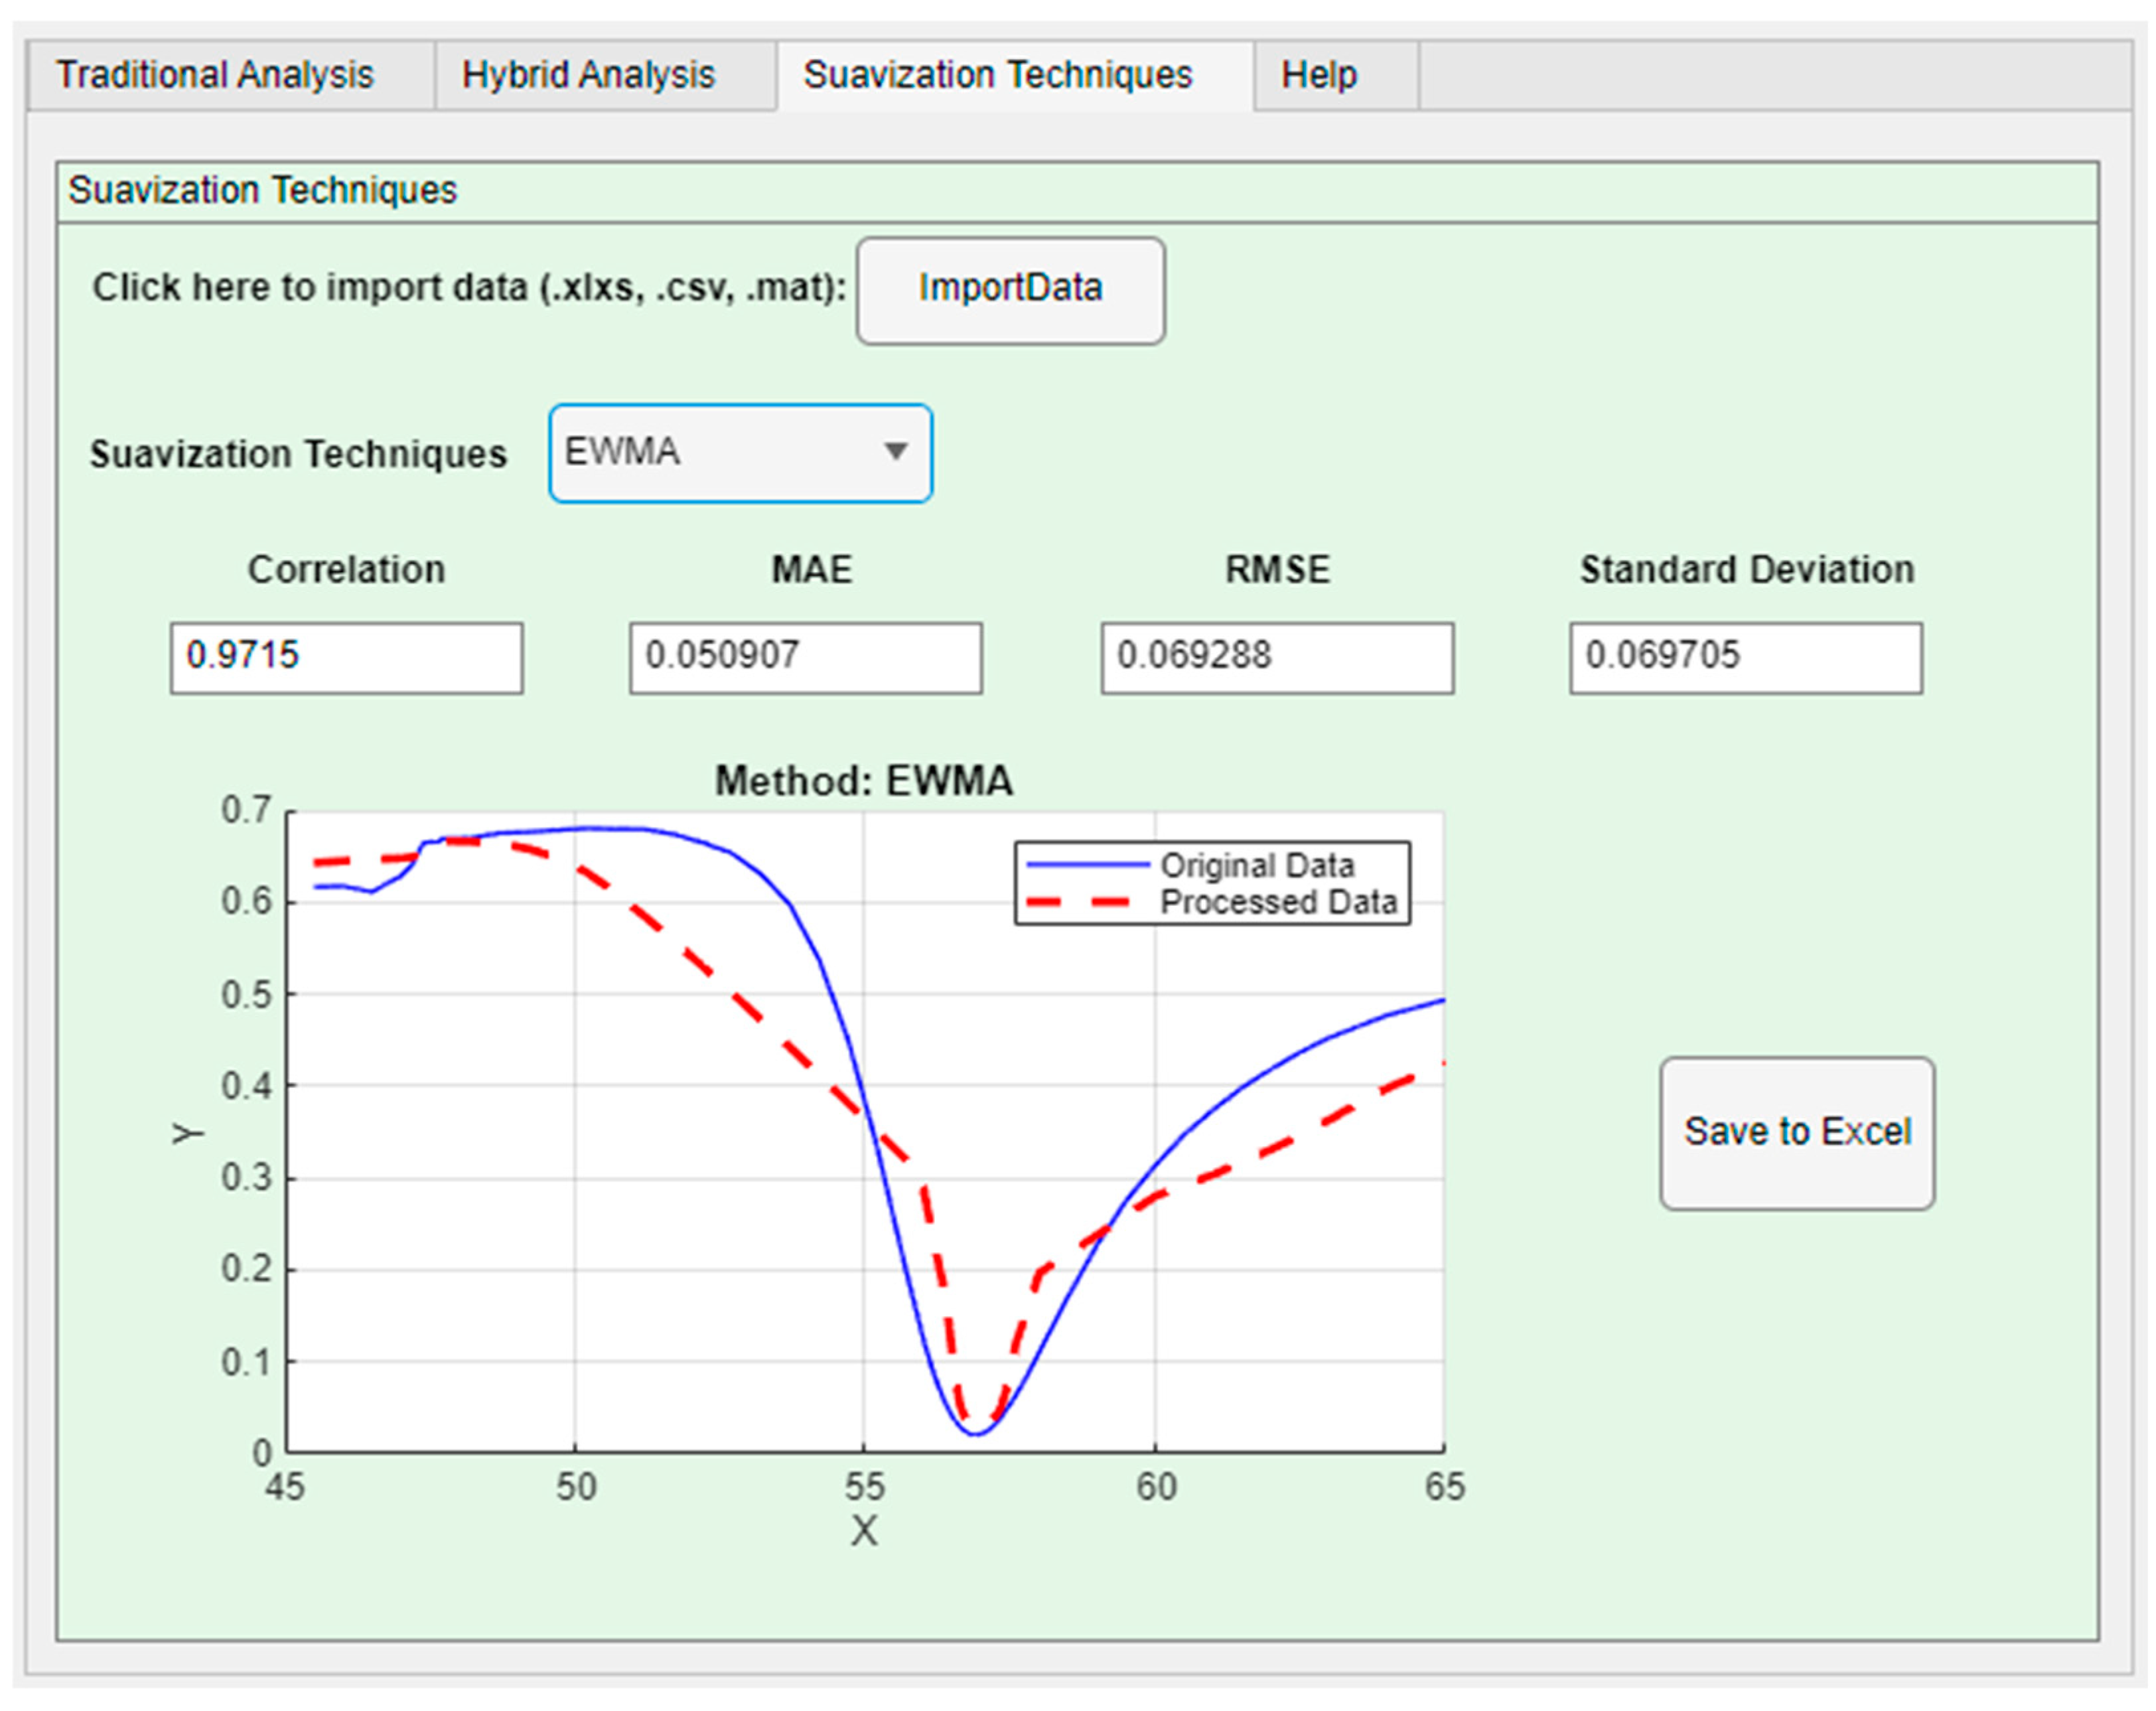
The smoothing technique can be selected from the dropdown menu. In
Figure 9, the method chosen among the four available options was the exponentially weighted moving average, allowing real-time graphical visualization of the processed curves. After selection, parameters for quantitatively evaluating the effectiveness of each method in smoothing the curve compared to the original are displayed to the user, including correlation, mean absolute error, standard deviation, and root mean square error.
Considering an experiment with a structure containing a prism, a gold metallic layer, and a substrate layer [
48], the developed tool was tested with four different smoothing techniques. The results were analyzed by comparing the applied methods and evaluating the obtained correlation coefficients, which are listed in
Table 1. The objective of this comparison was to verify the effectiveness of each technique in preserving the structure of the SPR spectra and reducing experimental noise, ensuring accurate and reliable analysis.
In
Table 1, the analyzed parameter values are observed. The correlation coefficients were calculated between the smoothed data and the original curve, allowing the quantification of each method’s fidelity to the raw spectrum. The results demonstrated that the Savitzky–Golay filter and Spline Smoothing achieved the best performance, indicating that these approaches preserve the fundamental characteristics of SPR spectra while minimizing unwanted noise. These findings are supported by studies that affirm that smoothed splines and Savitzky–Golay can be used to enhance signal quality in luminescence measurements, especially in experiments requiring temporal and spatial data analysis [
53,
54].
The Gaussian filter, although effective in removing high-frequency noise, showed a slight attenuation of resonance peaks, leading to a minor loss of detail in the smoothed curve. Therefore, when applied to SPR biosensors, they are often modified using bimodal strategies [
55], for example. The Exponentially weighted moving average (EWMA) exhibited lower accuracy in preserving the amplitude of the spectra, requiring an adjustment of the smoothing factor (
for better results.
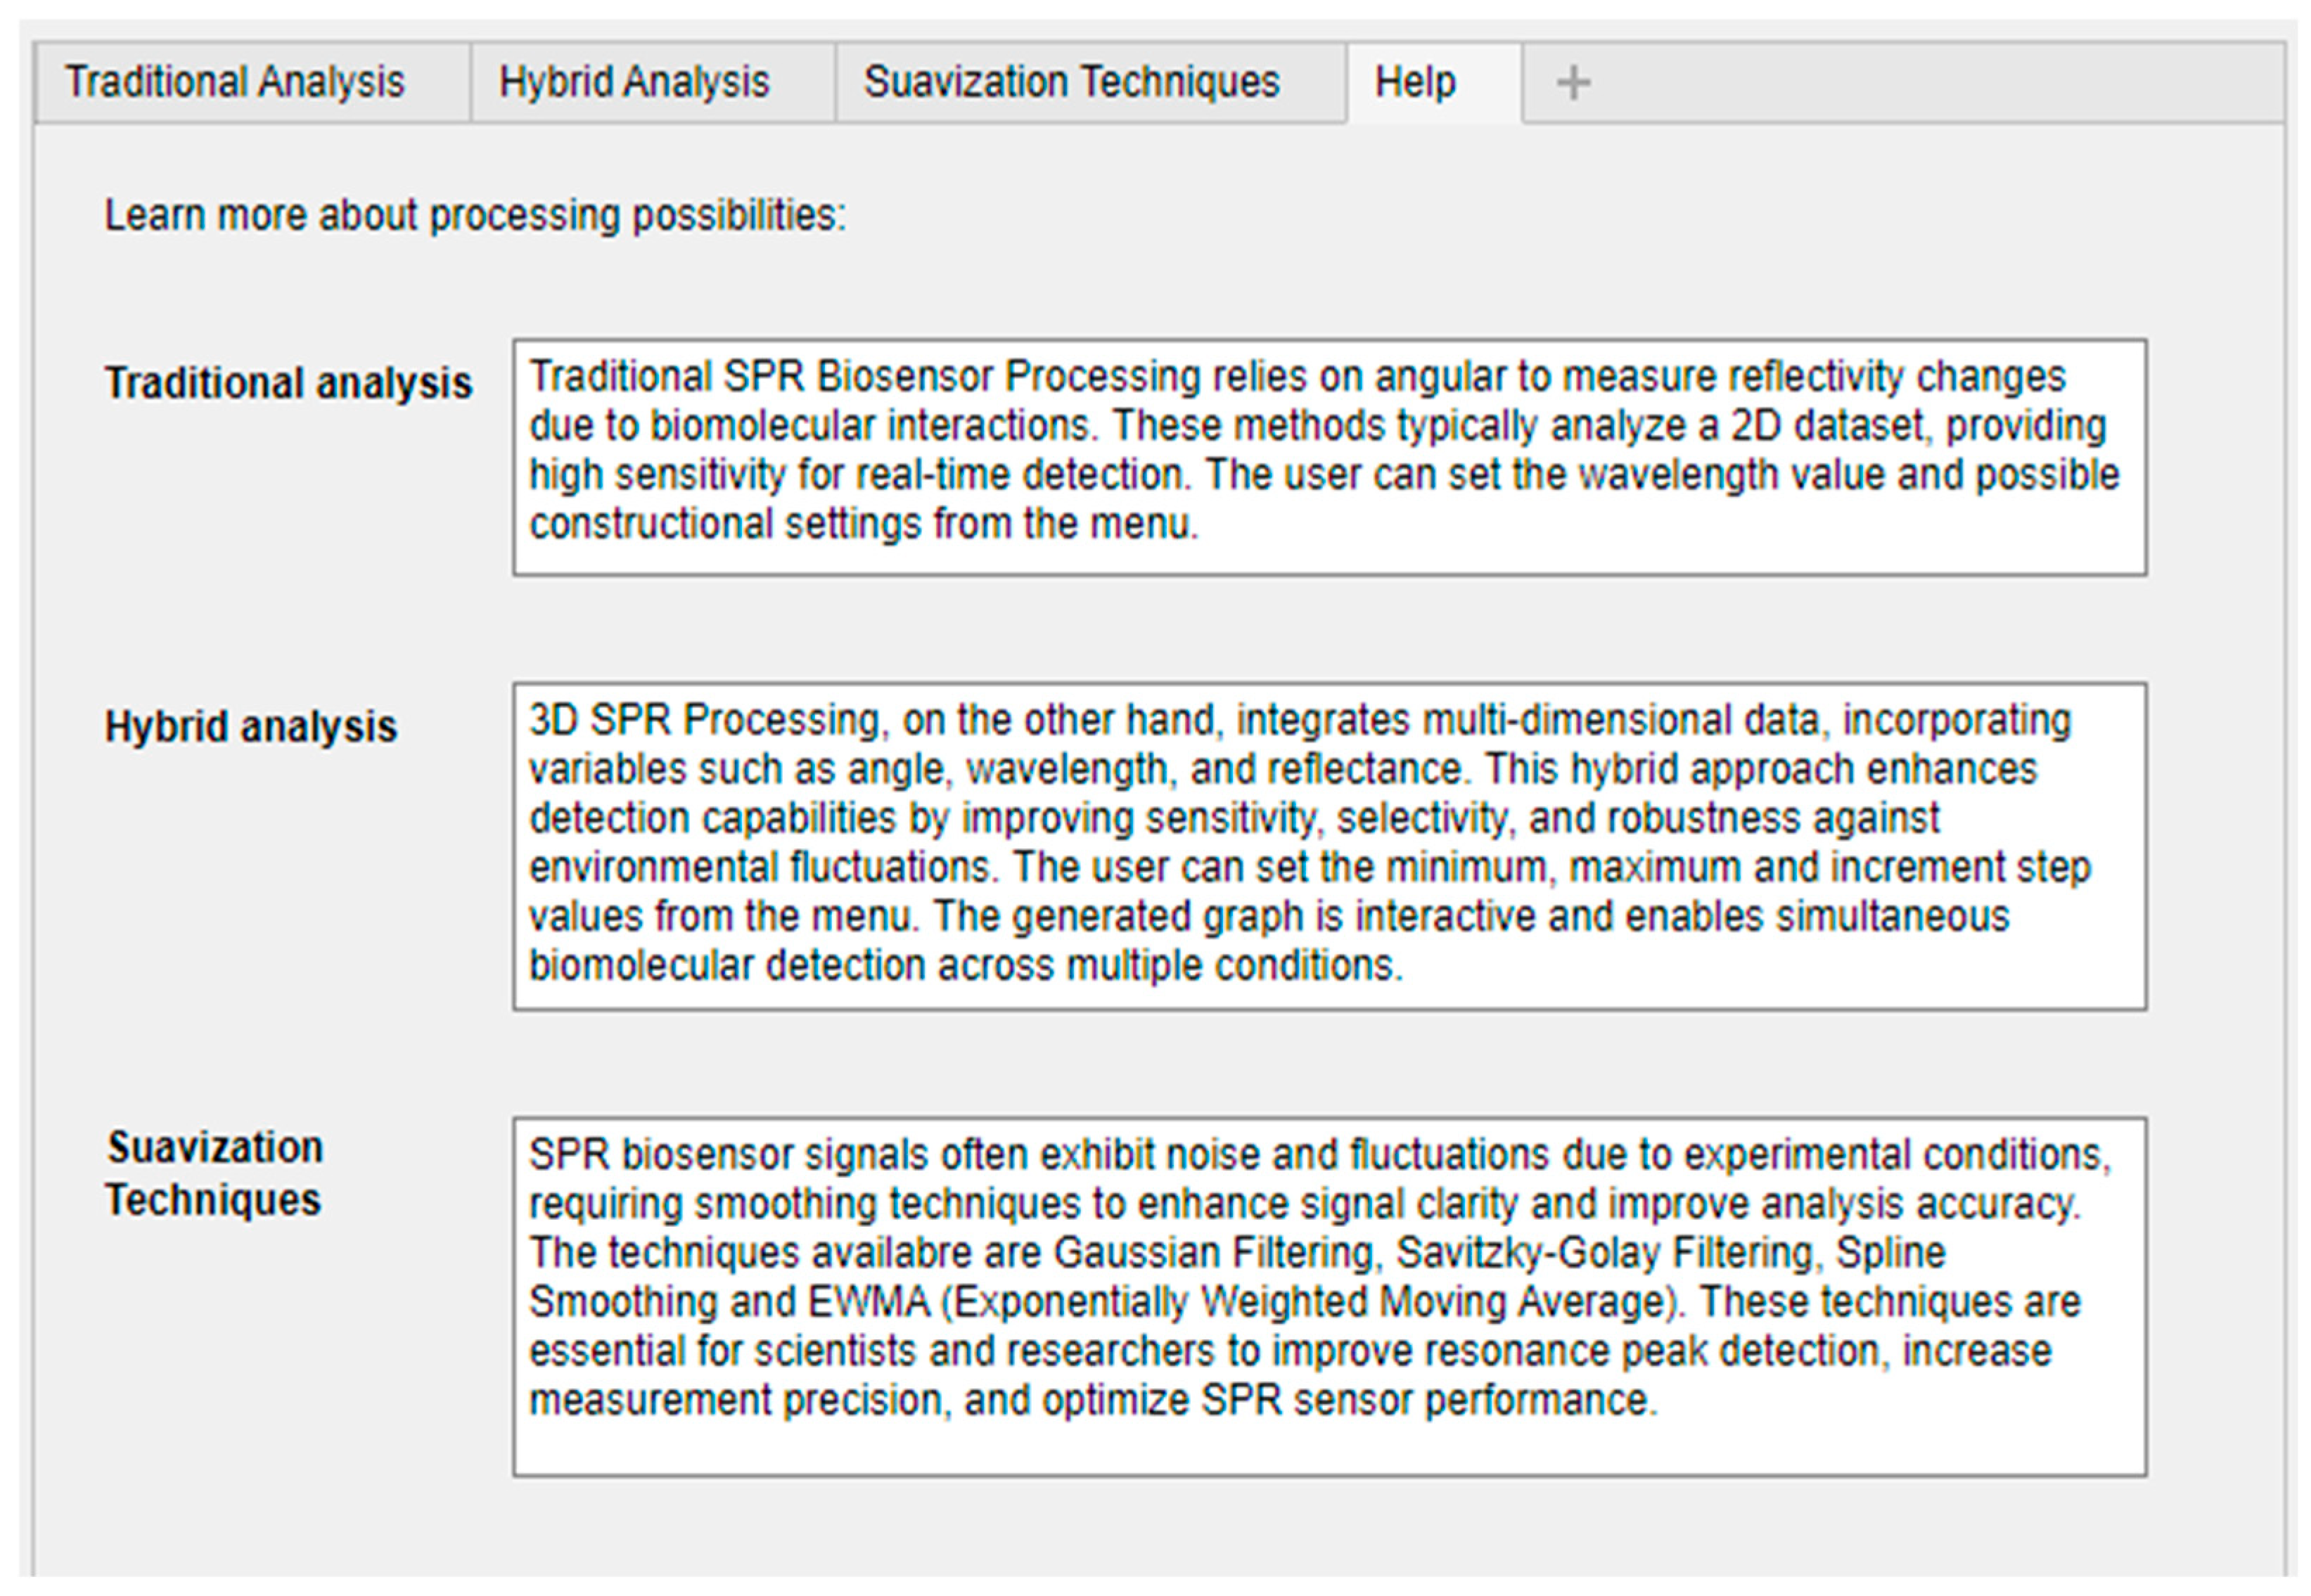
In each tab of the computational tool, results can be saved in an Excel spreadsheet, allowing for later analysis and data processing. Another feature that assists the user is the “Help” screen, as seen in
Figure 10, which provides explanations for each available function, helping to resolve any doubts.
These results confirm that incorporating smoothing techniques in SPR biosensor analysis can significantly enhance the quality of experimental spectra, reducing the impact of environmental variations and experimental fluctuations without compromising data integrity. The ability to compare different methods within the developed tool offers a flexible and adaptable approach for researchers, enabling them to choose the best smoothing technique according to the characteristics of the experiment and analysis requirements.
4. Conclusions and Future Works
This paper presented the development of a computational tool for the analysis and characterization of SPR biosensors, allowing the application and comparison of different signal processing and curve smoothing approaches and comparison between different forms of its construction. The tool, implemented using MATLAB to provide an interactive, intuitive, and efficient environment, assists researchers in interpreting SPR spectra and optimizing sensors based on surface plasmon resonance. The main contribution of this study was the implementation of three processing strategies: (i) traditional reflectance analysis, considering the variation in light intensity as a function of the incidence angle; (ii) a hybrid approach that integrates multiple parameters for a more robust and precise analysis of the optical behavior of SPR biosensors; and (iii) the application of curve smoothing techniques, which are essential for minimizing experimental noise and improving the identification of the resonance angle.
According to the results of the experimental tests performed, the tool proved effective in analyzing and processing SPR biosensor data, resulting in significant improvements in the precision of resonance angle determination and the stability of the experimental spectra. The tool also allowed for a qualitative-quantitative comparison between different smoothing methods, highlighting the influence of these approaches on the quality of the spectra and the reliability of the results. The implementation of the smoothing techniques showed that the Savitzky–Golay filter and spline smoothing were the most effective in preserving the peaks and structure of the SPR spectra, ensuring a significant reduction in noise without compromising data fidelity. In addition, the tool was designed to be user-friendly, offering an intuitive graphical interface that allows users to import experimental data, adjust analysis parameters, and export results to Excel spreadsheets, thereby facilitating data interpretation and experiment optimization.
The results obtained and presented demonstrate that the developed tool is capable of significantly enhancing the characterization of SPR biosensors, making the analysis more precise, less susceptible to external interference, and facilitating the identification of the resonance angle with a smaller margin of error.
As a continuation of the research, the researchers intend to enhance the tool’s functionalities. Among the proposed improvements, the implementation of thermal compensation techniques stands out, which will automatically correct variations in the spectra caused by environmental fluctuations, increasing the stability of the analyses. In addition, the expansion of biosensor modeling options is suggested, including new materials and structures to optimize the sensitivity of SPR sensors. Another possible enhancement is the development of a standalone version of the tool, eliminating the need for MATLAB licenses and making its use more accessible to different laboratories and researchers. The incorporation of machine learning techniques is also proposed, which could be employed to detect patterns in the experimental spectra, improve the automatic identification of the resonance angle and determine the best smoothing technique for each experiment performed. Finally, a comparison with reference experimental methods is recommended, validating the effectiveness of the implemented techniques and ensuring their practical applicability in real-world scenarios.
The authors believe that with these proposed improvements, the computational tool will become a laboratory device for the characterization of SPR biosensors, contributing to the advancement of research and the development of new SPR biosensors for a wide range of applications.


 ,
, 


