
Case Study—Based Overview of Some Contemporary Challenges to Power Quality in Ship Systems

Abstract
:1. Introduction
2. Maritime Power Systems
3. How to Assess Power Quality on Ships?
3.1. Electric Power Quality and Its Assessment in Ship Systems
- parameters describing a risk of loss of power supply continuity and
- parameters of voltage and currents in all the points of the analyzed system.
- imprecise definitions of related power quality indices,
- a lack of unambiguous recommendations concerning application of adequate algorithms and measurements procedures,
- limited applicability of commercial solutions of power quality analyzers, hitherto available on the market (e.g., for varying frequency systems),
- standards and rules concerning a continuous monitoring of electric power quality are not exhaustive.
3.2. Power Quality Indices
- a majority of existing rules concerning ship systems do not determine the aggregation times for particular indices of voltage waveform distortions,
- in the rules under discussion the same value of limit levels of particular harmonics is defined, what is a very controversial approach considering different effect on the given object of different orders harmonics,
- in the related standards for ship systems, the limit levels for interharmonics and subharmonics are not defined, whilst the disturbances of this kind occur frequently in ship networks fitted with electronic converter subsystems,
- similarly to previous objection, in the same standards, lack of limit contents of the disturbing components in the frequency band above usually accepted number of harmonics, i.e., 40 or 50 is noted,
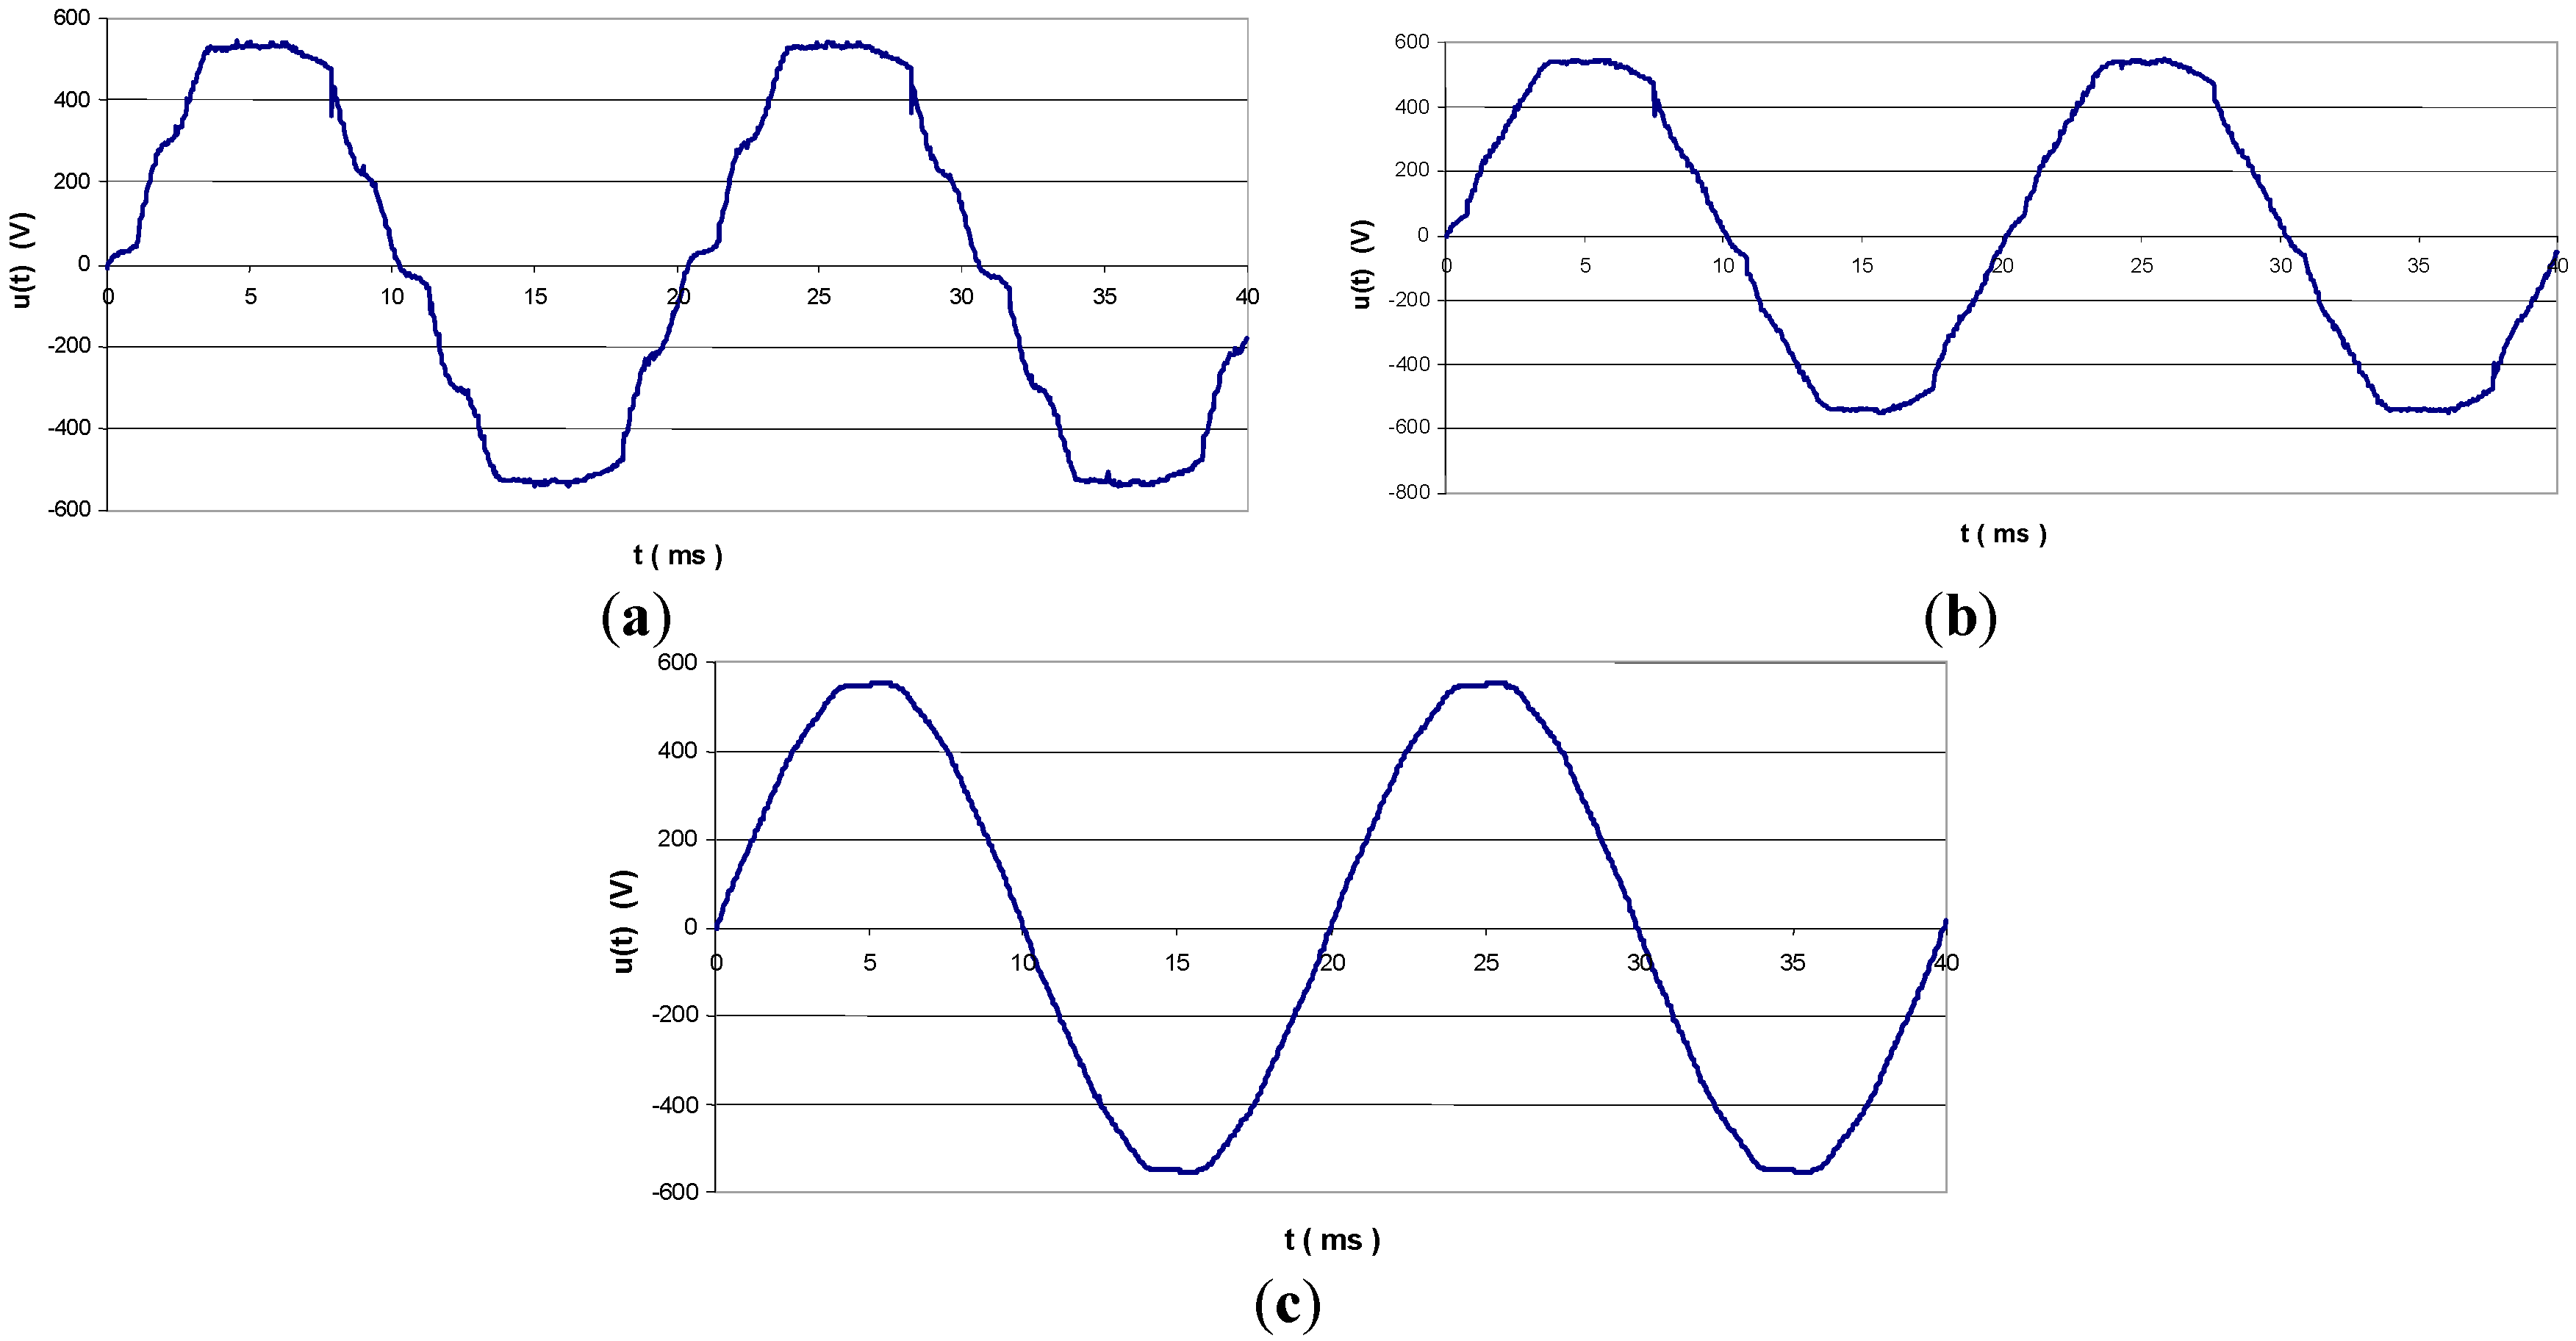
- and finally, a very imprecise definition of THD in accordance with traditional approach.
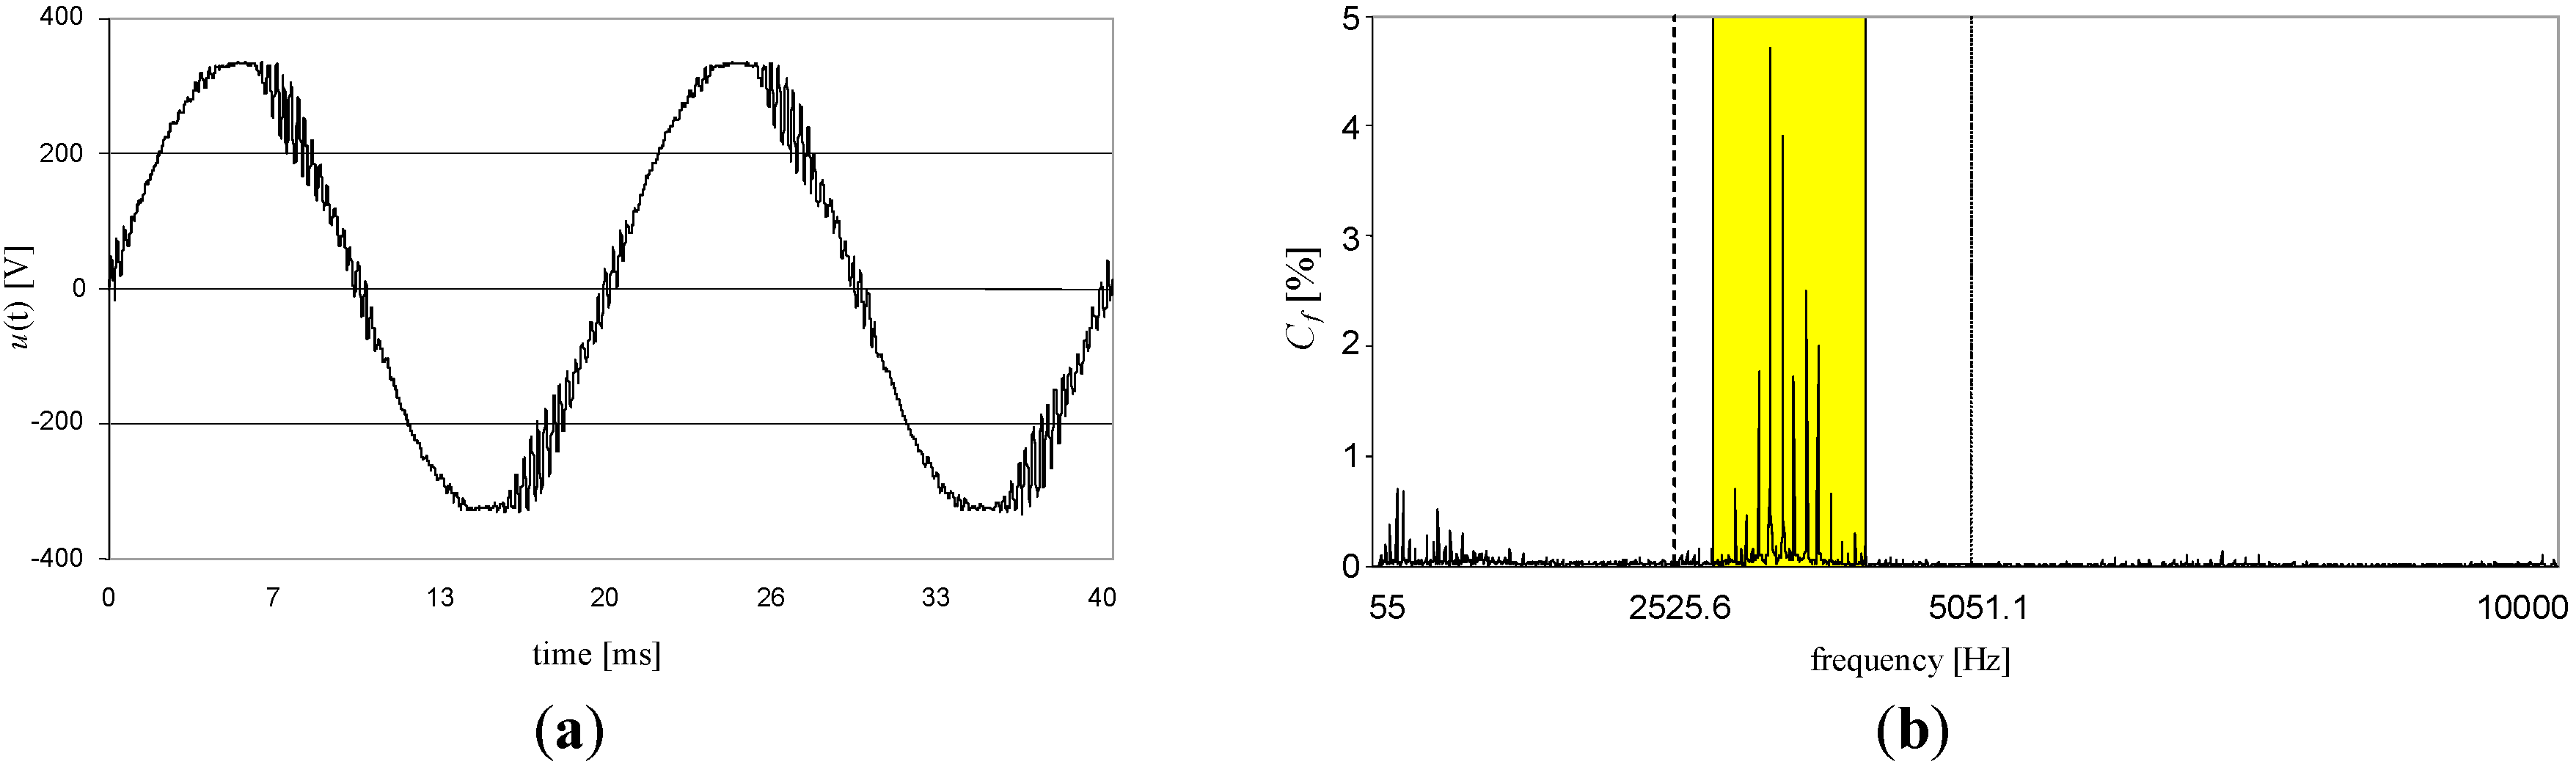
- one must forget about all factors based on harmonics only, like THD50 calculated up to 50th harmonic or even THD100 calculated up to 100th harmonic,
- TWD factor is the only viable solution but proper frequency band of input signal has to be chosen carefully,
- the determining of only TWD10 kHz and TWD2.5–10 kHz factors would be enough for typical and less typical cases monitoring.
3.3. Measurement Methods of Power Quality Indices
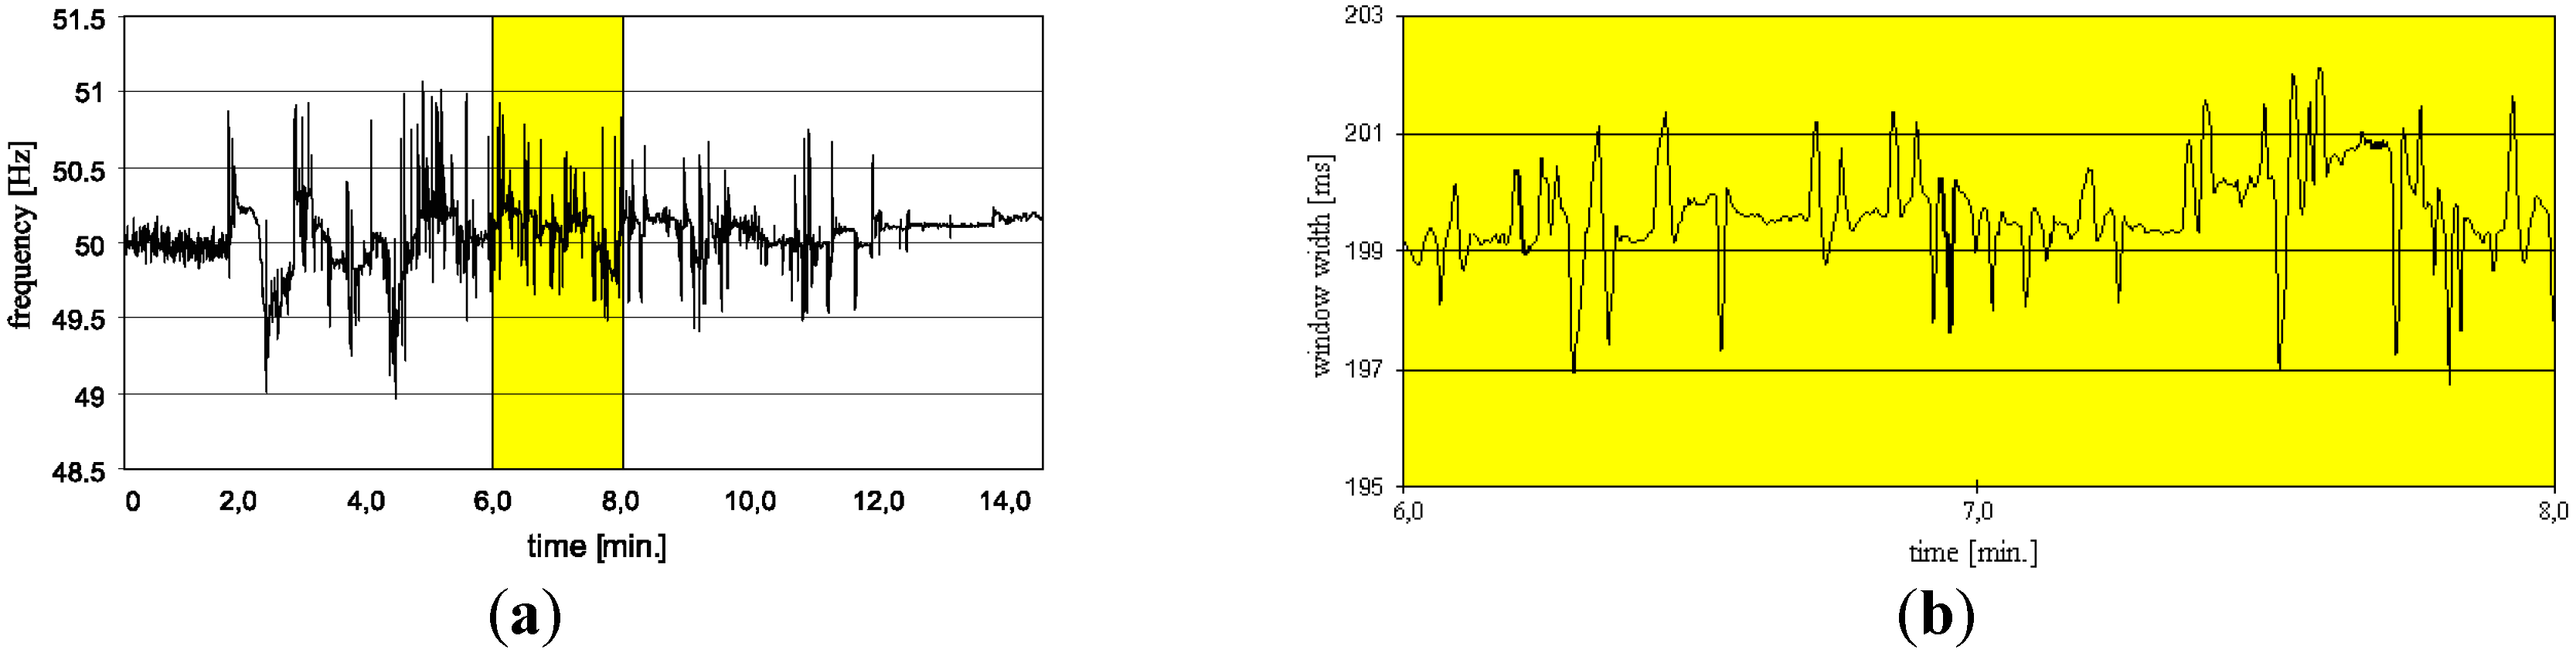
- window width equal to exactly 10 periods of the fundamental period for 50 Hz systems and 12 periods of the fundamental period for 60 Hz systems, corresponding roughly to 200 ms,
- rectangular window (Hanning weighting is allowed only in the case of a loss of synchronization),
- a Discrete Fourier Transform DFT,
- sampling frequency sufficient for the analysis of frequency components up to 9 Hz,
- the fundamental frequency should be calculated as the ratio of the number of integral cycles counted during the 10-s time clock interval, divided by the cumulative duration of the inter cycles,
- concept of voltage harmonic subgroups, where the Fourier transform analysis assumes that the signal is stationary. However, in reality, the voltage magnitude and frequency of the power system may fluctuate, spreading out the energy of harmonic components to adjacent interharmonic frequencies,
- time aggregation, combination of several sequential values of a given parameter (each determined over identical time intervals) to provide a value for a longer time interval.
- discarding FFT algorithm as a basic tool for spectrum estimation,
- implementing asynchronous (i.e., non-coherent) sampling and next application of chirp Z-transform CZT or interpolation in the time-domain (i.e., programmable re-sampling), and further Fast Fourier Transform FFT.
- there are no rules concerning methods of respective parameters measurement in ship systems and the relevant IEC standards related to land power systems have not been mentioned neither in rules of ship classification societies, nor in IEC 60092-101 ship standard,
- generally, lack of threshold value of power quality indices and adequate aggregation times in standards and rules of ship classification societies, besides of the Polish Register of Shipping rules and UK Defense Standards, where these kind of data in selected areas are included,
- moreover, lack of recommendations addressed to assessment of harmonic components in the frequency band above 50th harmonic in ship systems, only two exceptions are noted: Polish Register of Shipping requires this kind of assessment in frequency band above 50th harmonic up to 10 kHz, and American Bureau of Shipping has recommended the measurement of harmonic components above 50th harmonic up to 100th harmonic on ships equipped with Active Front End (AFE) drives.
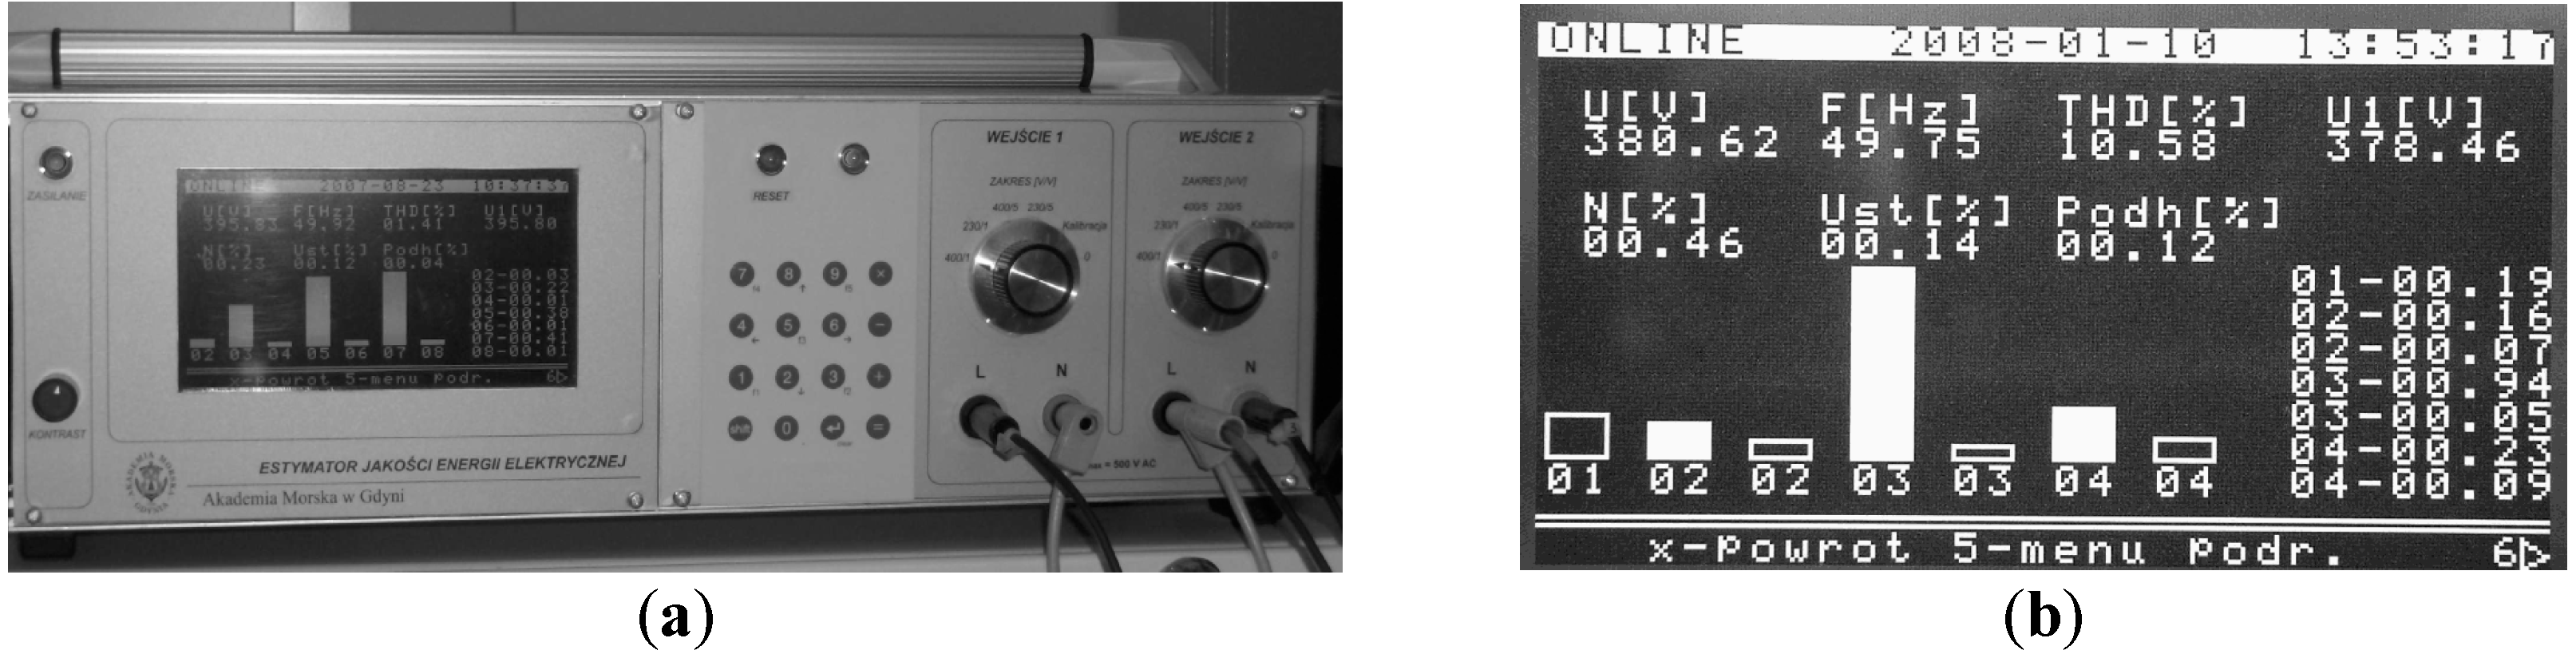
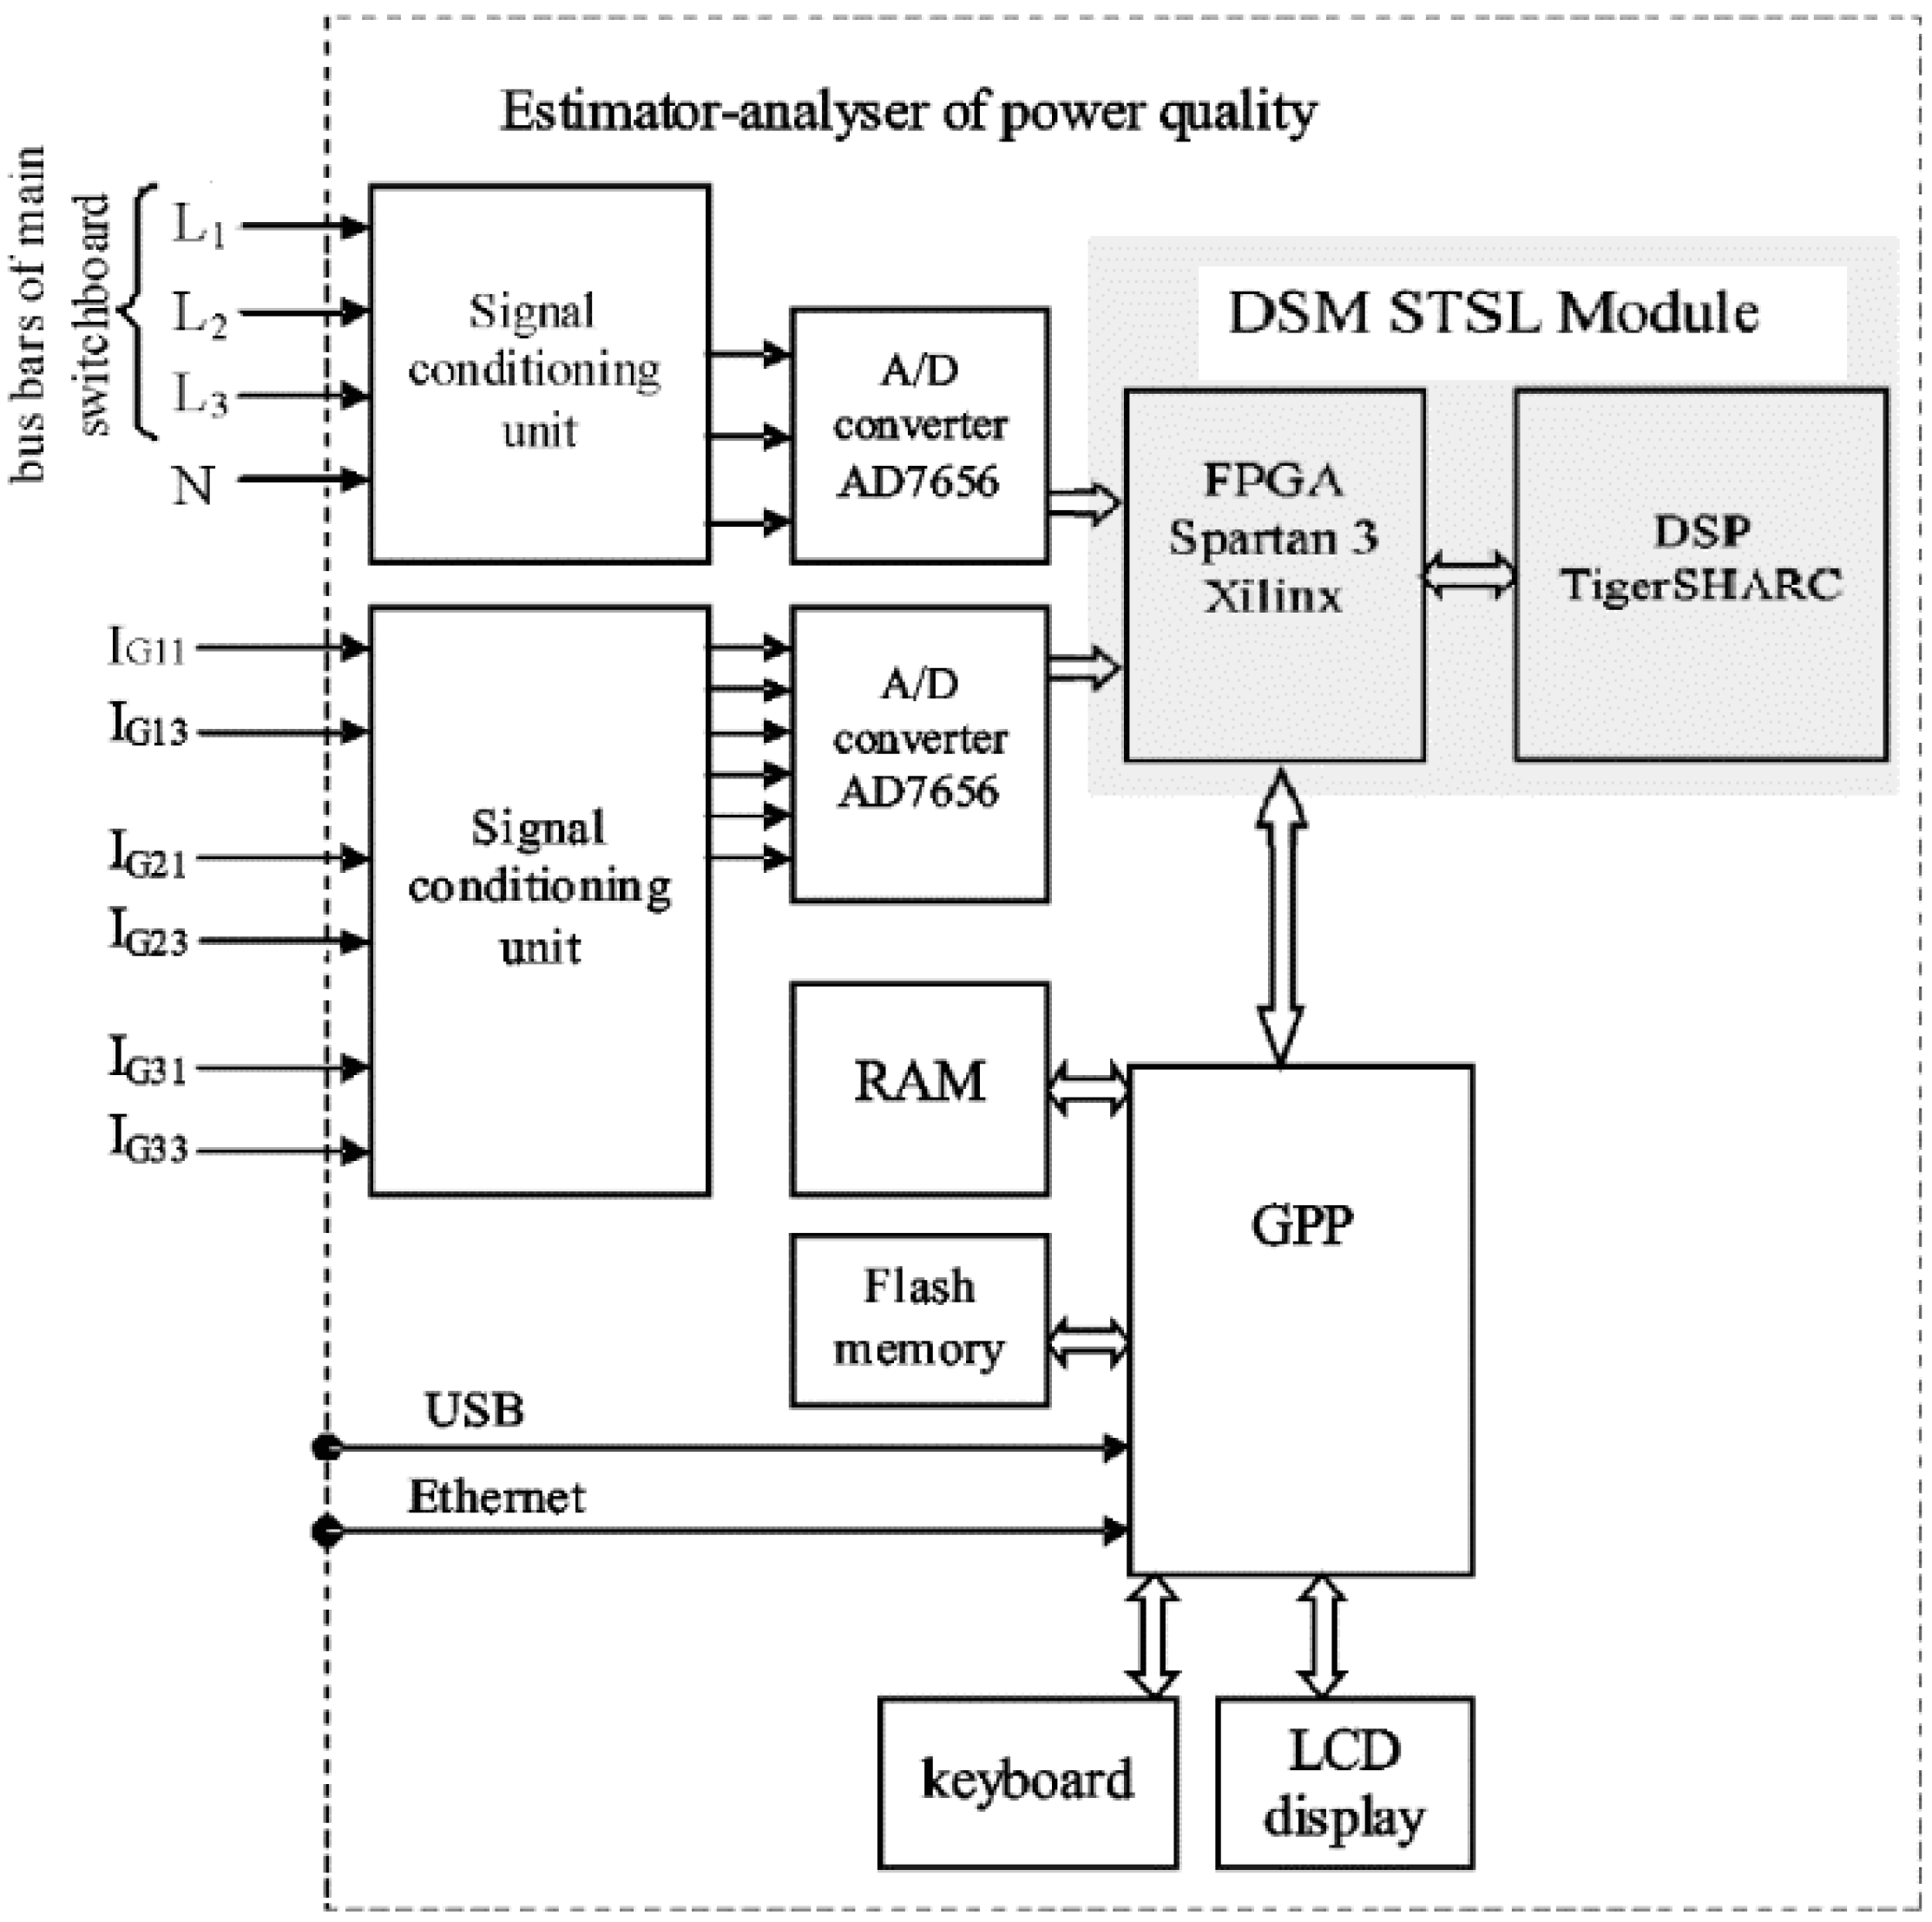
3.4. Instrumentation for Power Quality Assessment on Ships
- operation mode “Analyzer”, when all parameters of electrical power quality were determined and a constant algorithm of signal processing was used,
- operation mode “Estimator”, when those parameters are determined, whose current values exceed the limit threshold values, based on the original concept of multi-stage signal processing and changeable algorithms of signal processing, for decreasing in computational complexity.
3.5. Legal Instruments for Power Quality Monitoring
4. How to Improve Power Quality on Ships?
4.1. Sources and Reasons of Lowered Power Quality on Ships
- carelessness in design and carrying out of the system,
- errors in the system operation (“human error” is a dominant cause of the accidents at sea in accordance with the International Maritime Organization statistics),
- influence of the power electronic devices installed in the considered system,
- switching processes and over voltages provoked by them in distribution switchgears and electrical consumers,
- failures of the important elements of the system (e.g., harmonic filters cooperating with shaft generators or main electric propulsion).
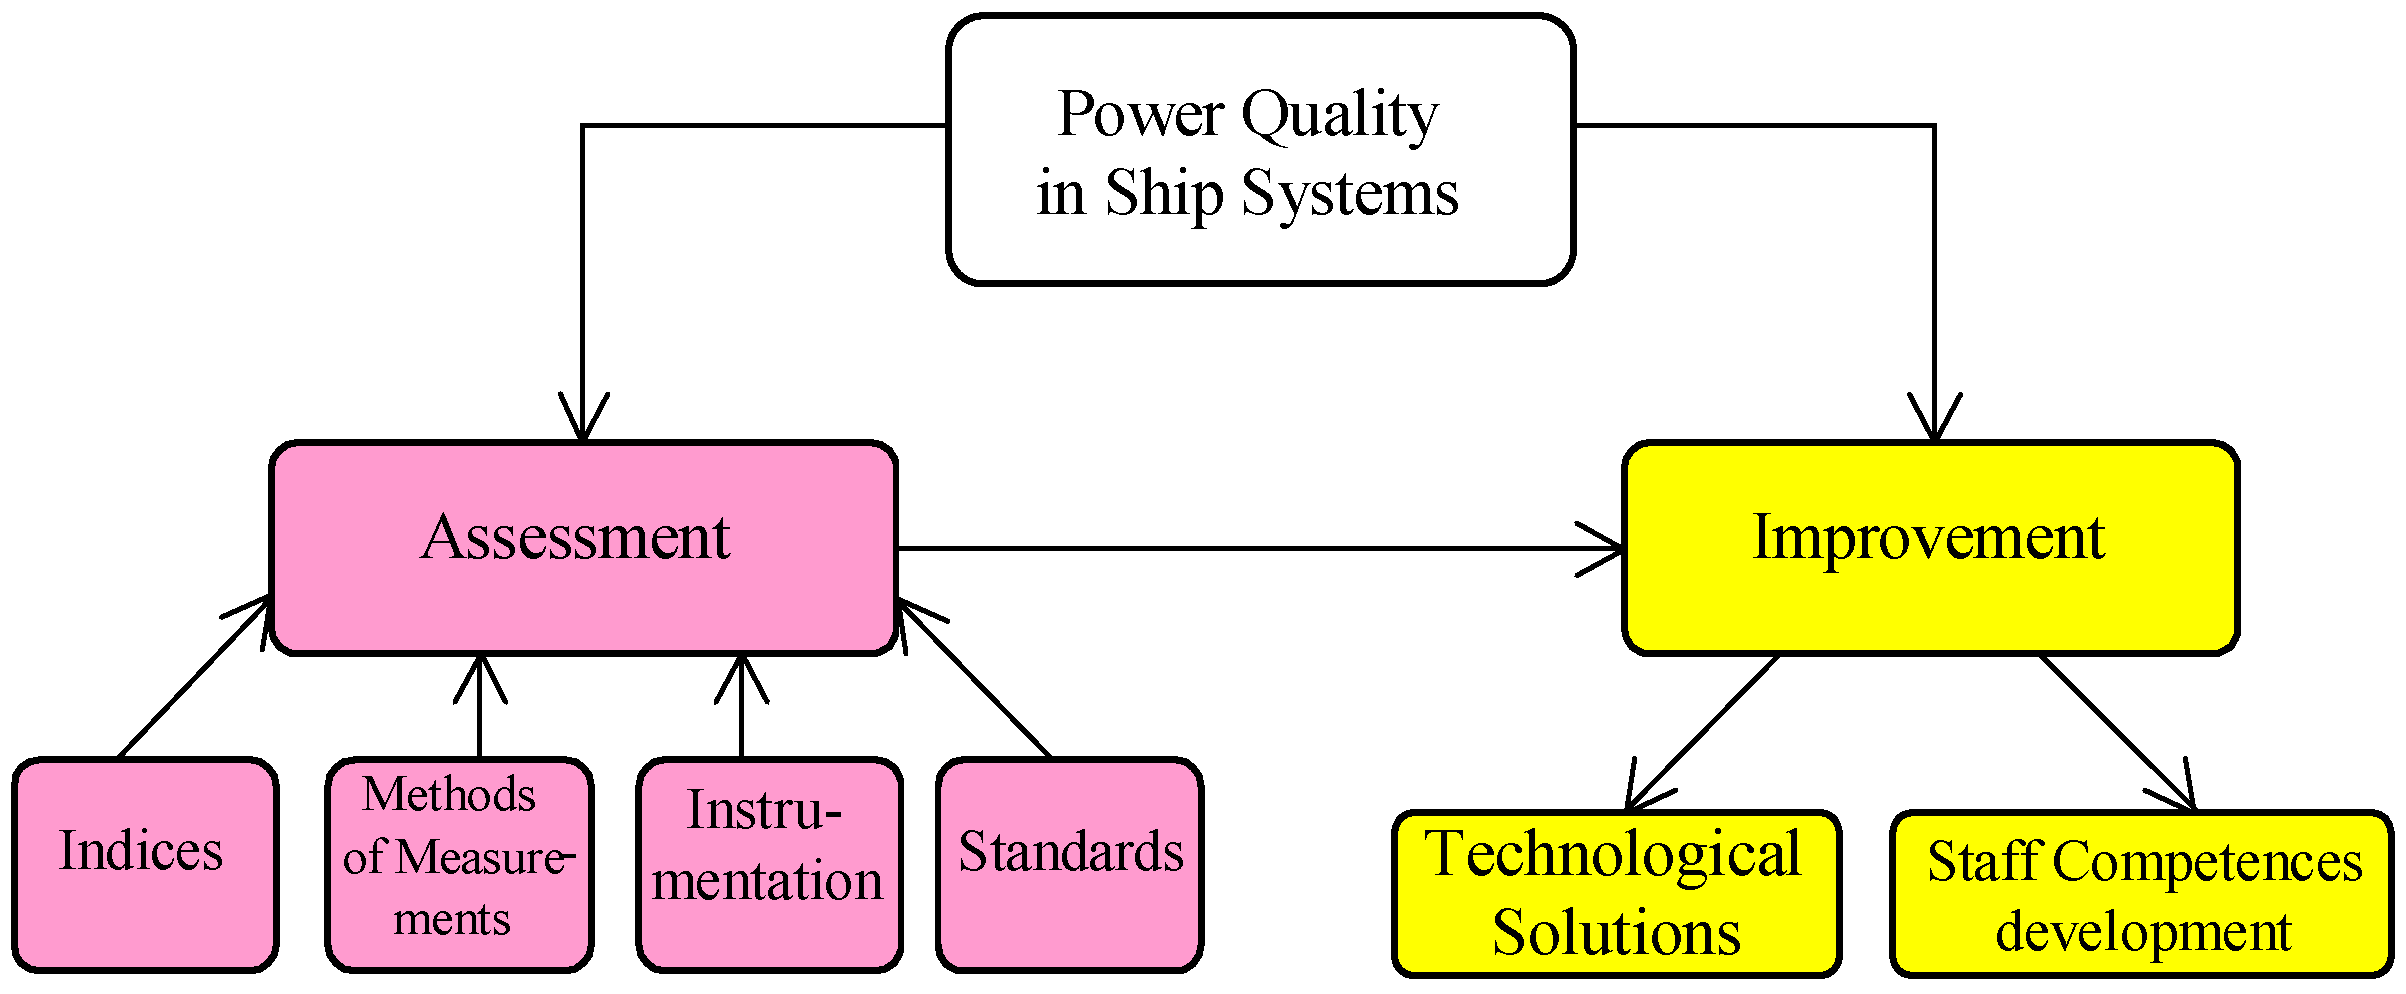
4.2. Conceptual Model for Solving the Central Problem
4.3. Technological Solutions
- passive or active filters,
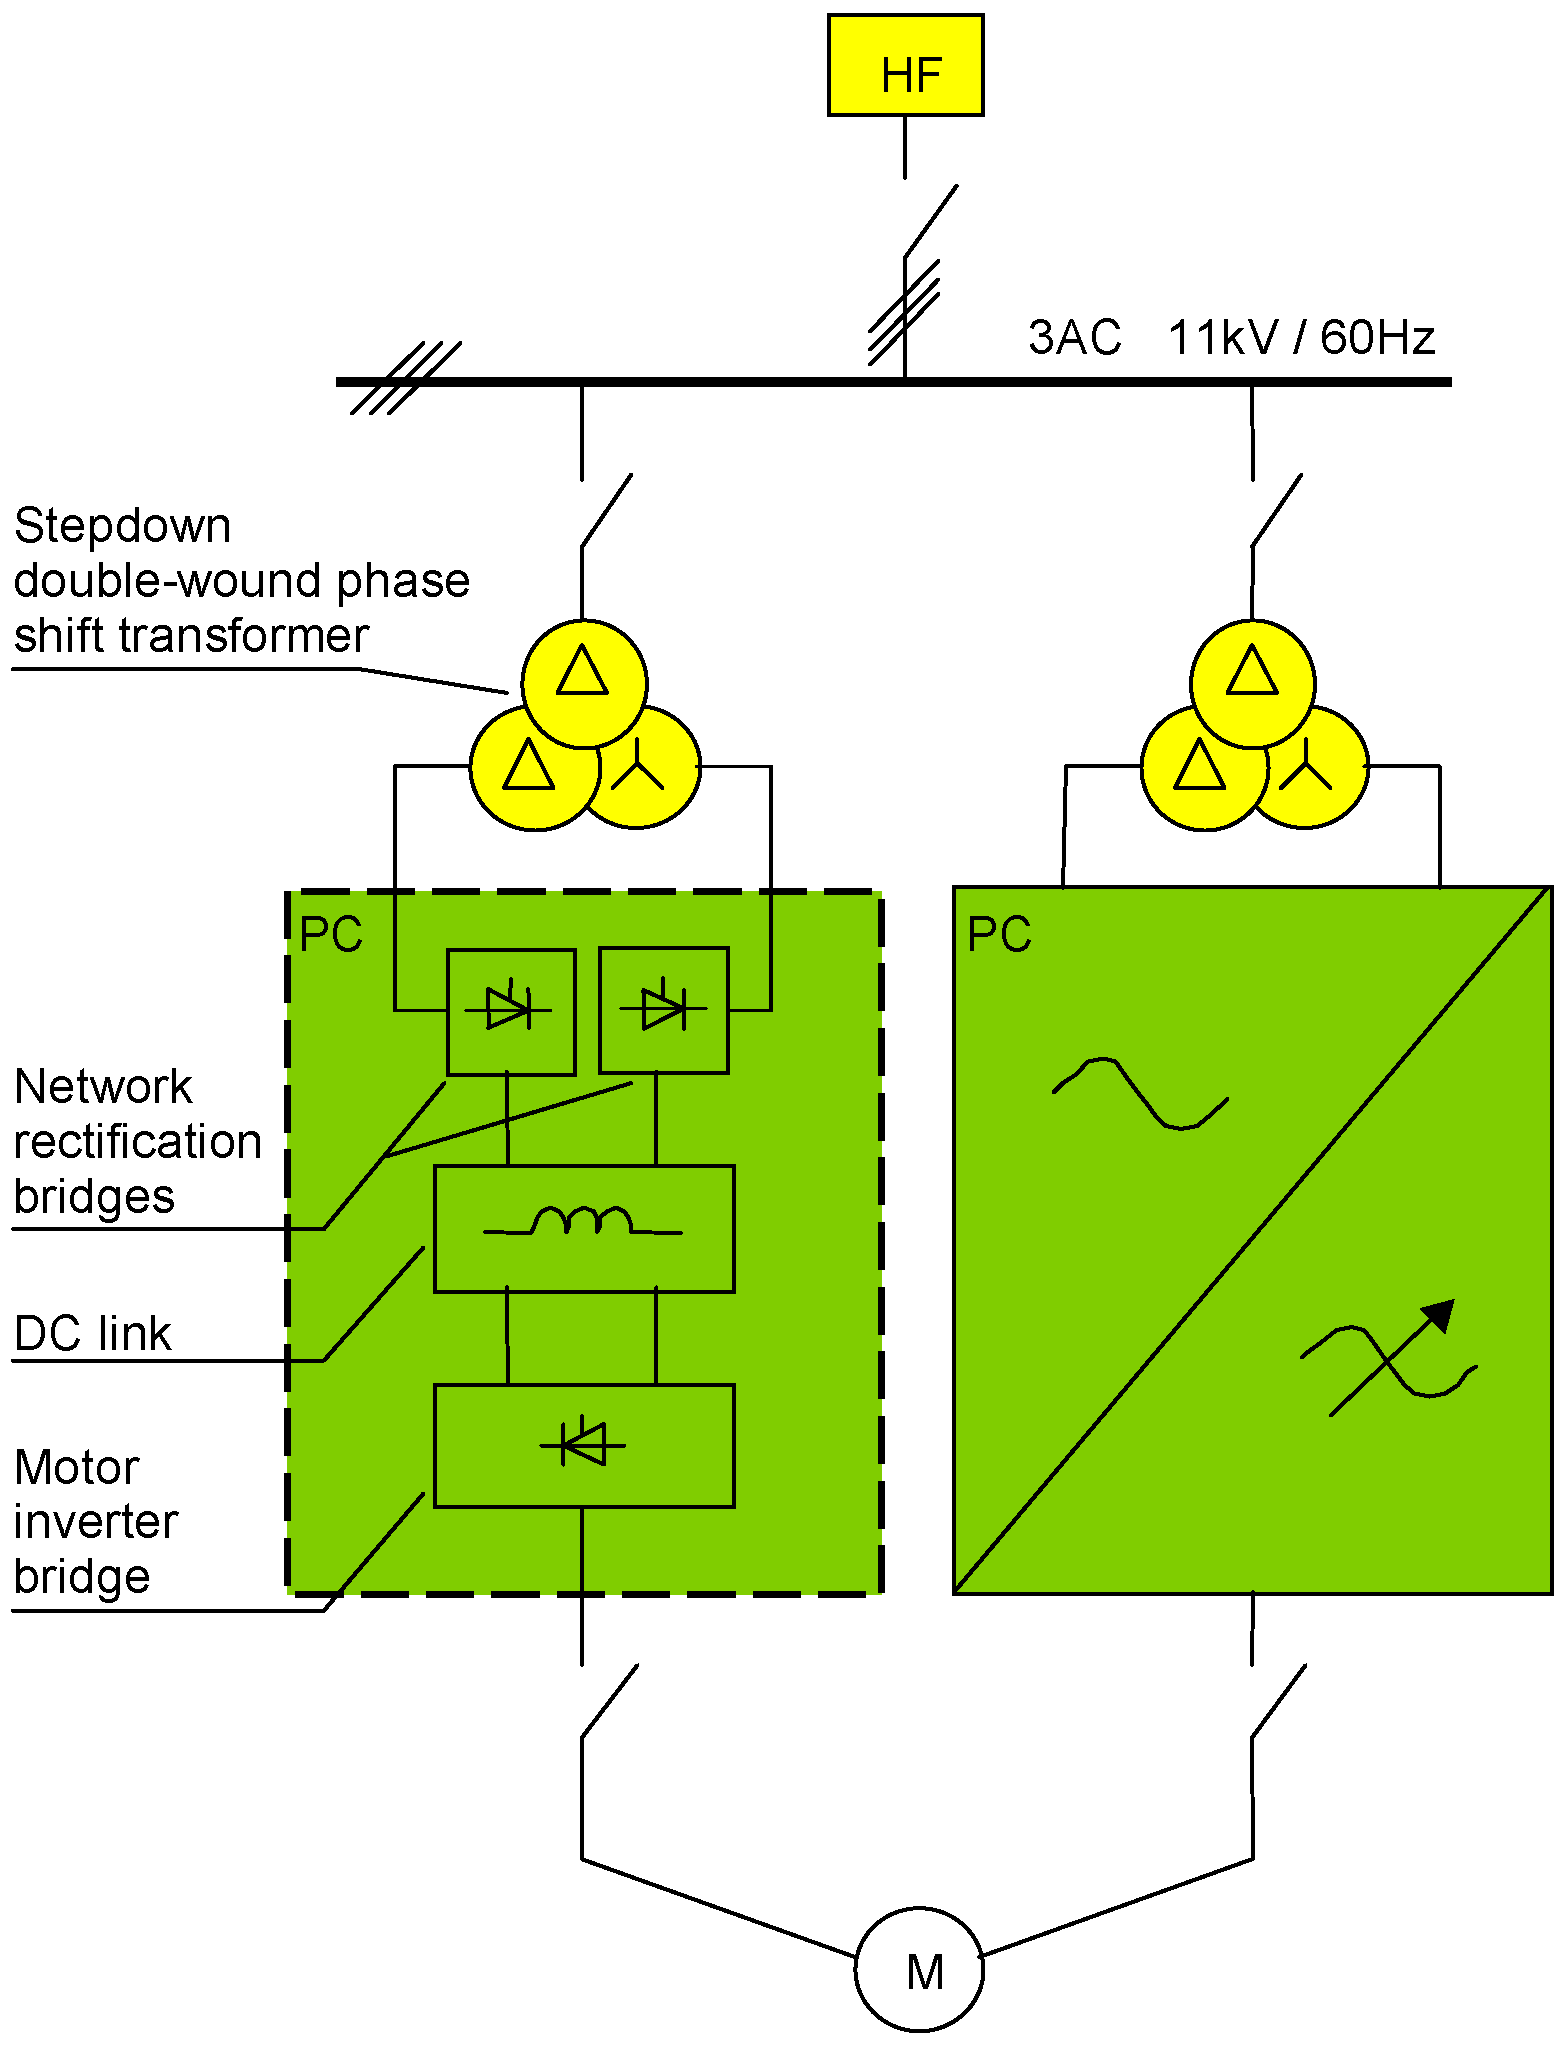
- increasing the number of pulses in power converters, by using multiple phase shifted secondary windings in propulsion motor supply transformers,
- using other specialized constructional and technological solution.
4.4. Staff Competences Development
5. Discussion
5.1. Legal Aspects
- design of unambiguous definitions of measured indices of electric power quality,
- design and implementation of the “Continuous power quality monitoring” procedure, and
- design of procedure standards within “transient disturbances in ship networks”.
5.2. Power Quality Control
5.3. Power Quality and Green Ship Technology
6. Conclusions
- Assessment and improvement of the power quality in ship systems constantly remain vital and topical issues, because of their influence on ship and shipping safety.
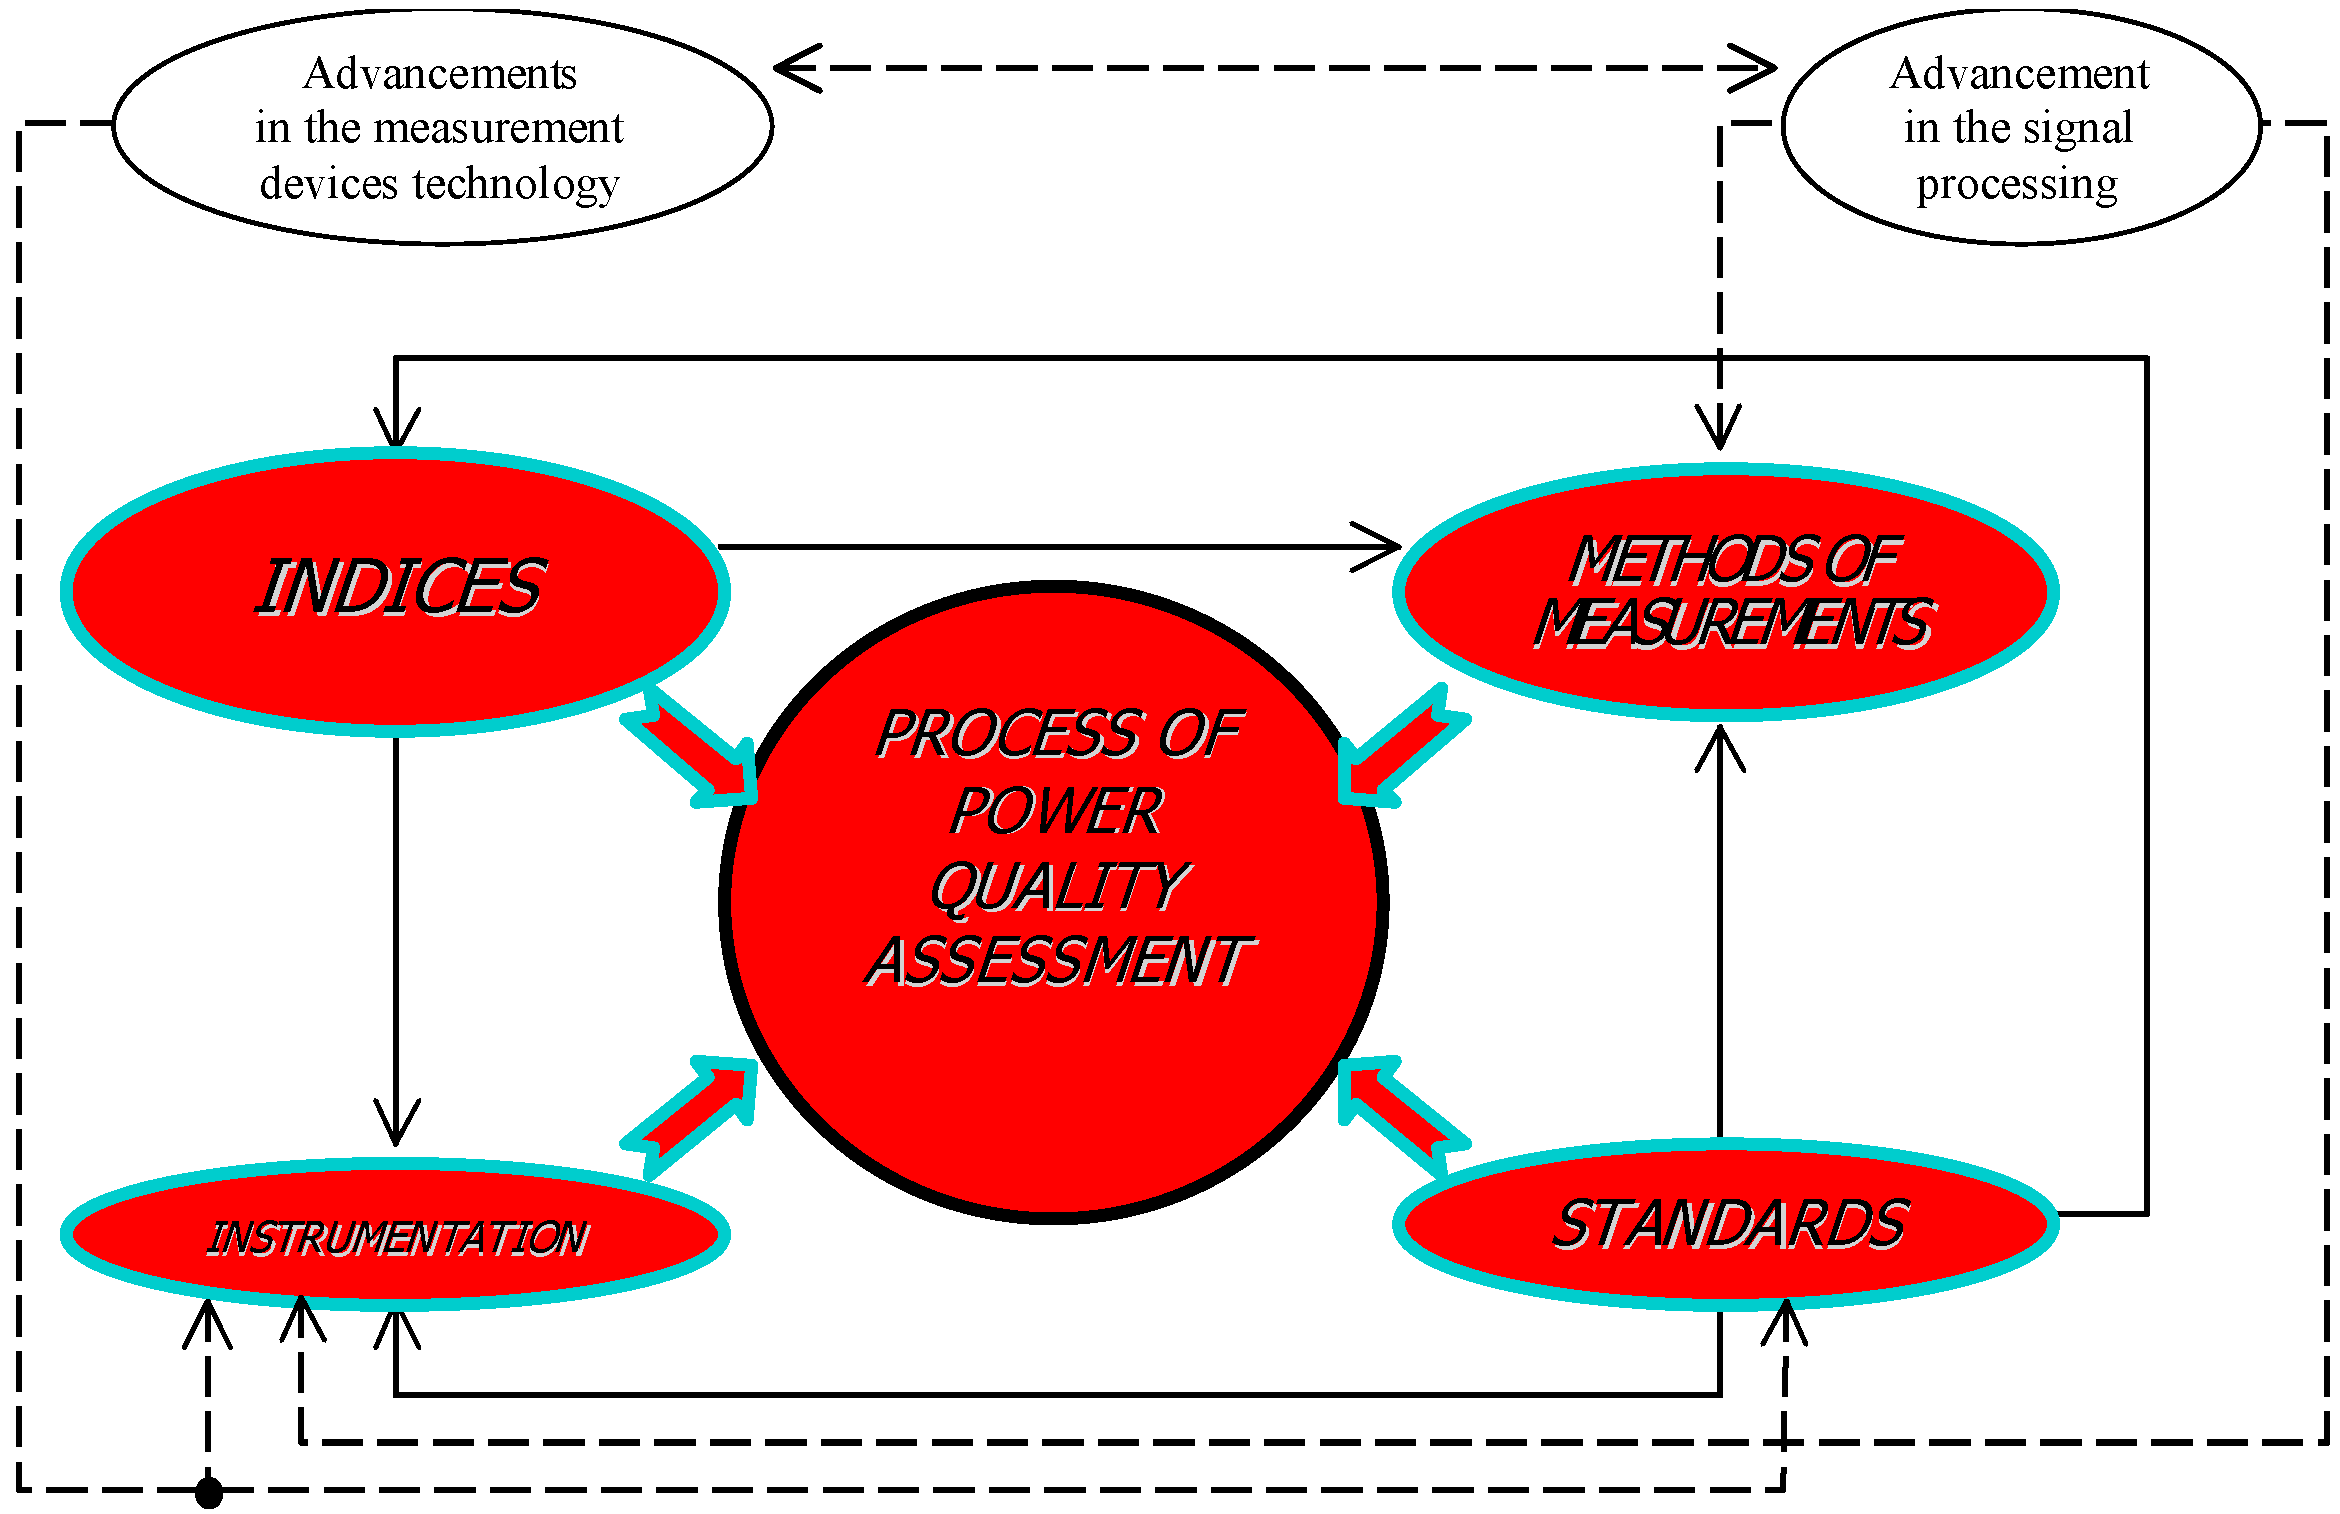
- The presented case-study based analysis of the state of the art in the area of power quality assessment confirmed some relevant existing ambiguities and inaccuracies, illustrated in Case Studies 1 and 2. Moreover, a deep analysis of the main components of the process of power quality assessment in ship systems and interactions, among them those illustrated in Figure 5, leads to the conclusion that it is rather impossible to compensate for appointed lacks and weaknesses “just now” because of the continuously running processes of advancement in the signal process and in the measurement devices technology as well as a mutual interfering of aforementioned components of the power quality assessment. It is would be more reasonable to consider a continuous development of related procedures following adaptively with the progress in the considered area. Nevertheless, some given actions, for example concerning more precise description of power quality definitions or methods of measurements are possible and expected, among others, due to the IACS (International Association of Classification Societies) activity.
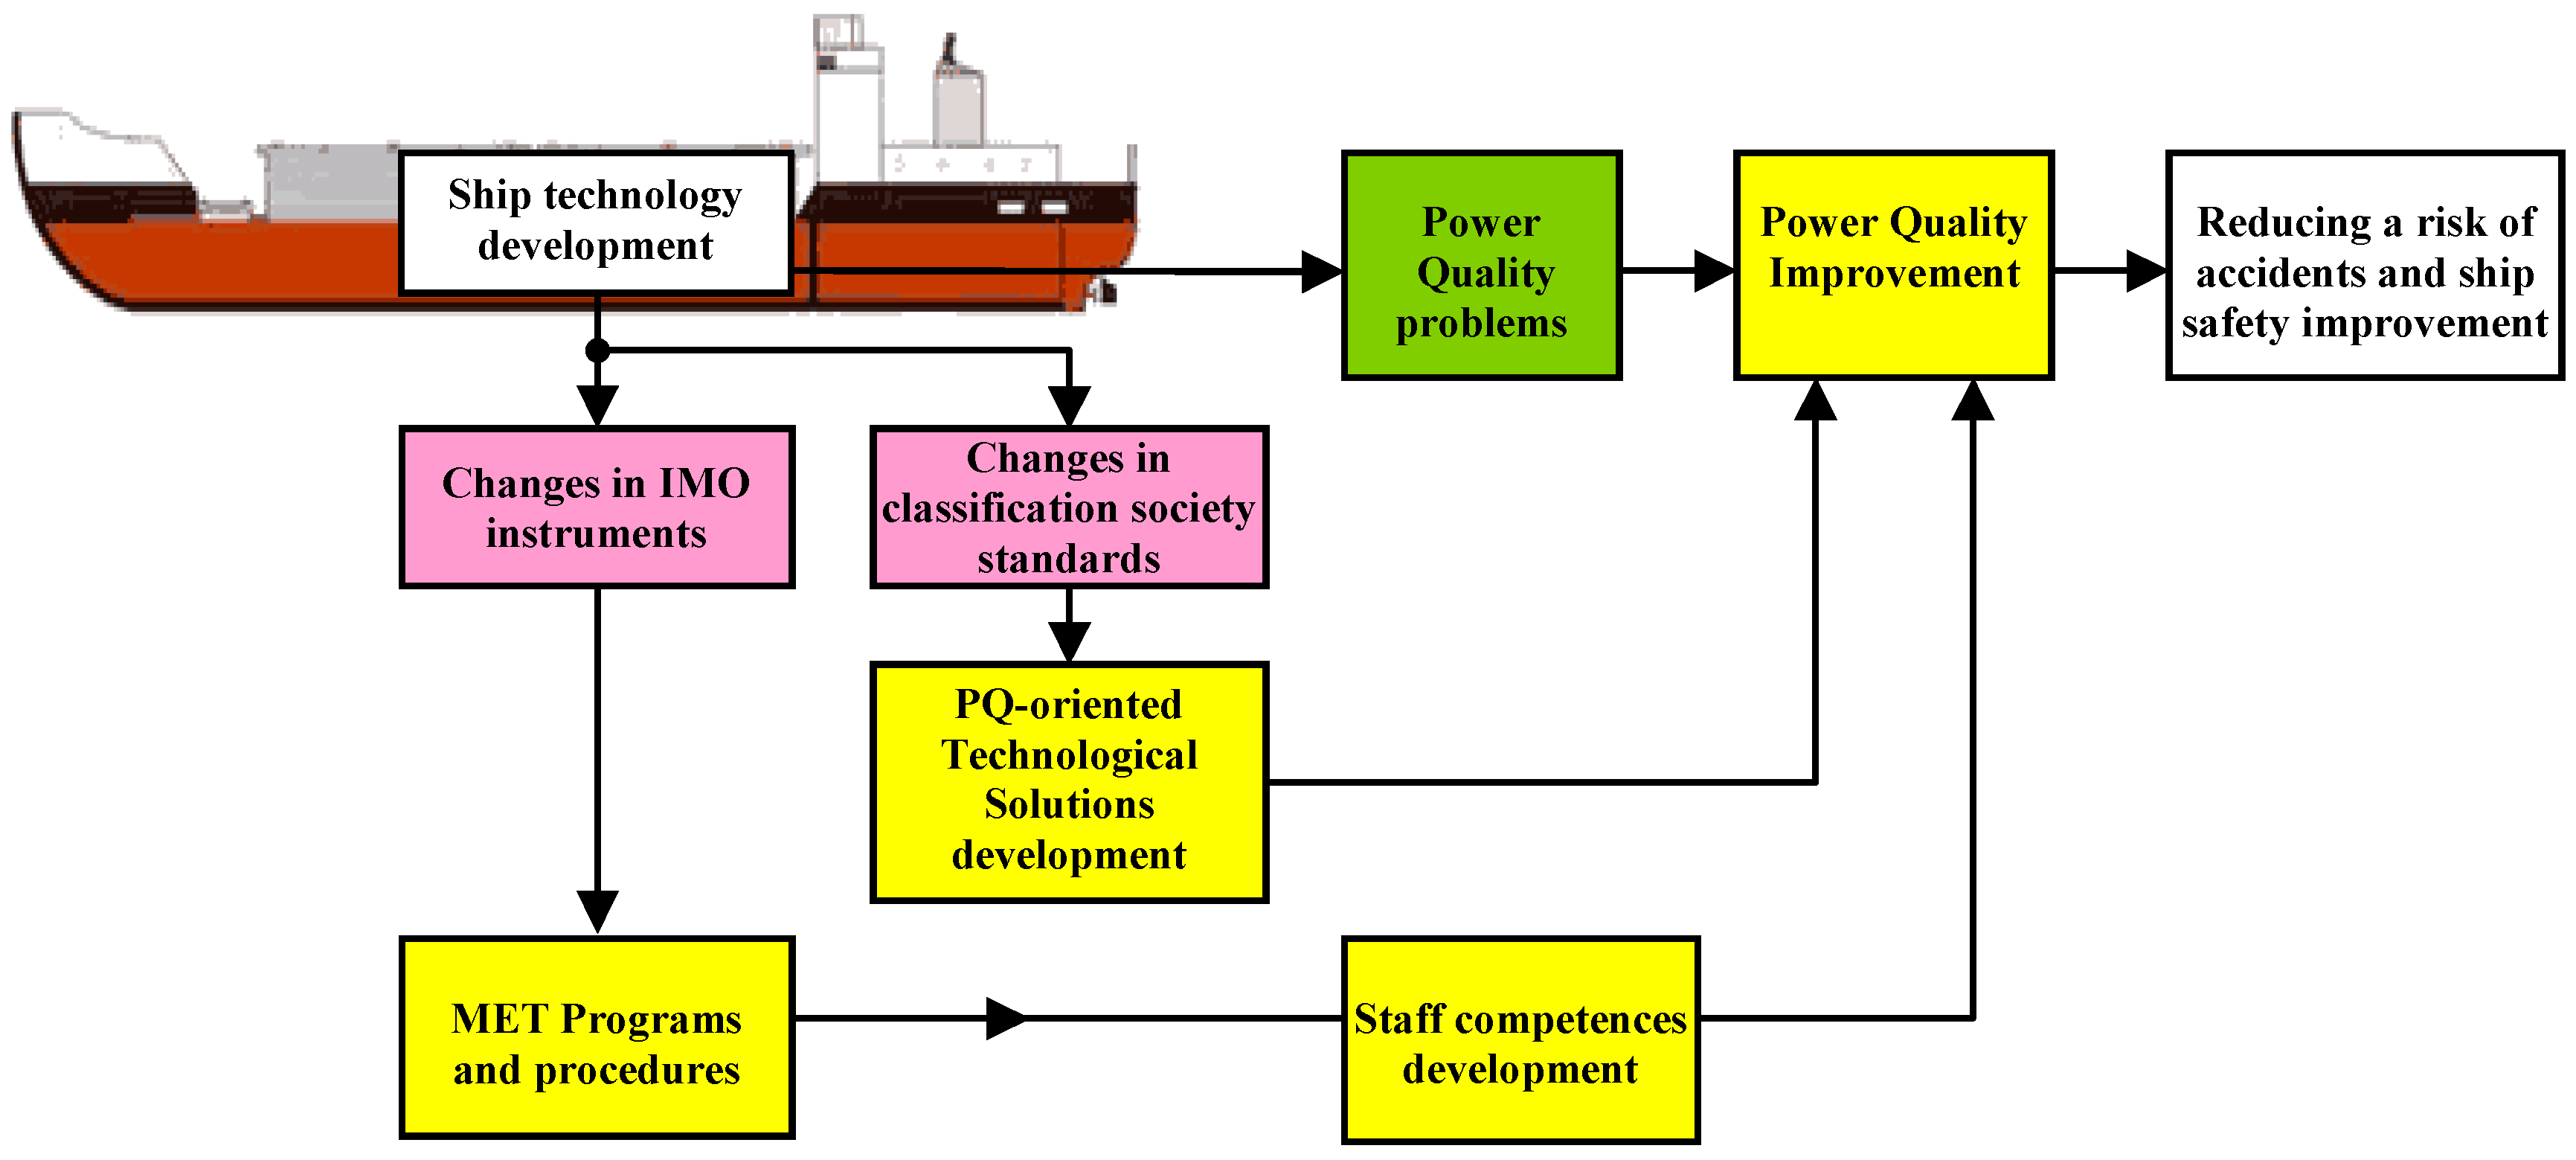
- Improvement of the power quality is a key point of the considered matter, because of its direct influence for reducing a risk of accidents and ship safety improvement, what was illustrated in Figure 11 by means of conceptual model for solving the central problem. It was widely discussed in Section 4 and shown on the basis of Case Studies 3 and 4, that power quality improvement is depending on the two important factors: development of power quality—oriented technological solutions and development of staff competences. A presented analysis showed (Case Study 4) that even in the case of a technologically advanced real object, like RMS Queen Mary 2, and applied multi-step mitigation of power quality disturbances, expressed, among others, in harmonic mitigation solutions, it was impossible to protect the system against previously described technical failure and main consequence, marine casualty. However, in-depth analysis the case under consideration, as well some other cases known from the numerous papers, lead to conclusion that more and more influential factor on appropriate power quality, or widely—ship safety, are the adequate staff competences. Author of the paper is absolutely convinced, that this aspect is all the time underestimated and without staff competency development, even assuming a progress in the domain of technical solutions, the effective solutions for power quality improvement in maritime power systems are not possible.
- Finally, a synergy of the legal aspects improvement, technical solutions oriented to power quality control development and continuous efforts of IMO, shipowners, designers and users of maritime power systems may significantly support the effective operation of ships and reduce a risk of accidents caused by power quality problems onboard of ships.
Conflicts of Interest
References
- Mindykowski, J. Power quality on ships: today and tomorrow’s challenges. In Proceedings of the International Conference and Exposition on Electrical and Power Engineering (EPE), Iasi, Romania, 16–18 October 2014; pp. 1–18.
- Adnanes, A.K. Maritime Electrical Installations and Diesel Electric Propulsion; ABB AS Marine: Oslo, Norway, 2003. [Google Scholar]
- American Bureau of Shipping. ABS Guidance Notes on Control of Harmonics in Electrical Power Systems; American Bureau of Shipping: Huston, TX, USA, 2006.
- Siemens AG. The Guide of Marine Frequency Converters. Marine Equipment. Available online: https://www.siemens.com.tr/i/Assets/Endustri/motorvesurucuteknolojileri/marine/Marine-Frequency-Converters.pdf (accessed on 28 April 2016).
- Wyszkowski, S. Ship Electrical Engineering; Wydawnictwo Morskie: Gdansk, Poland, 1991; Volume I. (In Polish) [Google Scholar]
- Mindykowski, J. Assessment of Electric Power Quality in Ships Fitted with Converter Subsystems; Shipbuilding & Shipping: Gdansk, Poland, 2004. [Google Scholar]
- Tarasiuk, T.; Piłat, A.; Szweda, M. Experimental study on impact of ship electric power plant configuration on power quality in the ship power system. In Proceedings of the Lecture Notes in Engineering and Computer Science, London, UK, 2–4 July 2014; WCE 2014 (World Congress on Engineering); pp. 259–264.
- Górniak, M.; Szweda, M. The analysis of distribution load between generators working in parallel in chosen ship’s systems. Sci. J. Gdyn. Marit. Univ. 2010, 66, 37–48. [Google Scholar]
- Marine Accident Investigation Branch. Report of the Investigation of the Catastrophic Failure of a Capacitor in the Aft Harmonic Filter Room on Board RMS Queen Mary 2 While Approaching Barcelona on 23 September 2010; Marine Accident Investigation Branch: Southampton, UK, December 2011. [Google Scholar]
- Amy, J.V.; Clayton, D.H.; Kotacka, R.O. Shipboard Electric Power Distribution: AC versus DC is not the issue, rather how much of each is the issue. In Proceedings of the All Electric Ship’98, London, UK, 1 September 1998.
- Blokland, A.J. Challenges and limitations of all electric ship designs. In Proceedings of the EPE European Conference on Power Electronics and Applications, Graz, Austria, 27–29 August 2001; pp. 1–8.
- Davey, K.R.; Hebner, R.E. Power Qrid for a Naval Electric Ship—AC versus DC. Available online: https://repositories.lib.utexas.edu/handle/2152/3073 (accessed on 28 April 2016).
- Hansen, J.F.; Lindtjorn, J.O.; Vanska, K. Onboard DC grid for enhanced DP operation in ships. In Proceedings of the MTS Dynamic Positioning Conference, Houston, TX, USA, 11–12 Octrober 2011; pp. 1–8.
- Inst of Elect & Electronic. IEEE 1159–1995, IEEE Recommended Practice for Monitoring Electric Power Quality; Inst of Elect & Electronic: Piscataway, NJ, USA, 1995. [Google Scholar]
- Department of Standards Malaysia. IEC 6100-4-30:2003, Compatibility (EMC), Part 4: Testing and Measurement Techniques—Section 30: Power Quality Measurement Methods; Department of Standards Malaysia: Cyberjaya, Malaysia, 2004. [Google Scholar]
- International Maritime Organization. IMO International Convention on Standards of Training, Certification and Watchkeeping for Seafarers, including Manila Amendments, STCW Convention and STCW Code; International Maritime Organization: London, UK, 2011. [Google Scholar]
- Mindykowski, J. Advances in maritime education and training: The case of competences of electro-technical officers complying with international regulations. J. Marit. Res. 2014, XI, 13–19. [Google Scholar]
- Tarasiuk, T.; Mindykowski, J. Problem of power quality in the wake of ship technology development. Ocean Eng. 2015, 107, 108–117. [Google Scholar]
- Prousalidis, J.; Syvoktakis, E.; Hatzilau, I.K.; Kanellos, F.; Perros, S.; Sofras, E. Electric power supply quality in ship systems: An overview. Int. J. Ocean Syst. Manag. 2008, 1, 68–83. [Google Scholar] [CrossRef]
- IEEE Industry Application Society. IEEE Standard 45-2002, IEEE Recommended Practice for Electrical Installations on Shipboard; Inst of Elect & Electronic: New York, NY, USA, 2002. [Google Scholar]
- International Electrotechnical Commission. IEC Standard 60 092-101-2002, Electrical Installations in Ships. Definitions and General Requirement; International Electrotechnical Commission: London, UK, 2002. [Google Scholar]
- Bollen, M.; Gu, I. Signal Processing of Power Quality Disturbances; Wiley-Interscience: New York, NY, USA, 2006. [Google Scholar]
- Tarasiuk, T.; Mindykowski, J. An extended interpretation of THD concept in the wake of ship power systems research. Measurement 2012, 45, 207–212. [Google Scholar] [CrossRef]
- Evans, I.; Hoevenaars, H. Meeting harmonic limits on marine vessels. In Proceedings of the IEEE Electric Ship Technologies Symposium, ESTS’07, Arlington, VA, USA, 21–23 May 2007; pp. 115–121.
- Tarasiuk, T.; Szweda, M. DSP instrument for transient monitoring. Comput. Stand. Interfaces 2011, 33, 182–190. [Google Scholar] [CrossRef]
- American Bureau of Shipping. Rules for Building and Classing, Steel Vessels; ABS: Houston, TX, USA, 2008. [Google Scholar]
- Polski Rejestr Statków. Technical Requirements for Shipboard Power Electronic Systems; Polish Register of Shipping: Gdansk, Poland, 2006. [Google Scholar]
- IEEE Power and Energy Society. 1459-2010, IEEE Standards. Definitions for the Measurement of Electric Power Quantities under Sinusoidal, Nonsinusoidal, Balanced and Unbalanced Conditions; Inst of Elect & Electronic: New York, NY, USA, 2010. [Google Scholar]
- Tarasiuk, T. Estimation of Power Quality in Ships Electric Power Systems with Use Digital Signal Processors; Res. Gdynia Maritime Univeresity: Gdynia, Poland, 2009; pp. 1–168. (In Polish) [Google Scholar]
- Lloyds Register of Shipping. Rules and Regulations for the Classification of Naval Ships—Electrical Engineering; LRS: London, UK, 2001; Volume 2, Part 10, Charter 1. [Google Scholar]
- International Electrotechnical Commission. IEC 61000-4-7: 2007 General Guide on Harmonics and Interharmonics Measurements for Power Supply Systems and Equipment Connected Thereto; International Electrotechnical Commission: London, UK, 2007. [Google Scholar]
- International Electrotechnical Commission. PN-IEC 60-533: 2002 Electrical and Electronic Installations in Ships—Electromagnetic Compatibility; International Electrotechnical Commission: London, UK, 2002. [Google Scholar]
- Det Norske Veritas. Rules for Classification of Ships; DNV: Oslo, Norway, 2008. [Google Scholar]
- Tarasiuk, T. A few remarks about assessment methods of electric power quality on ships—Present state and further development. Measurement 2009, 42, 1153–1163. [Google Scholar] [CrossRef]
- Mindykowski, J.; Tarasiuk, T. Development of DSP-based instrumentation for power quality monitoring on ships. Measurement 2010, 43, 1012–1020. [Google Scholar] [CrossRef]
- Tarasiuk, T.; Mindykowski, J. How to measure and estimate the power quality parameters in ship systems? In Proceedings of the 23th IEEE Instrumentation and Technology Conference, Sorrento, Italy, 24–27 April 2006; pp. 1608–1613.
- Tarasiuk, T. Comparative study of Various Methods of DFT calculation in the wake of IEC standard 61000-4-7. IEEE Trans. Instrum. Measur. 2009, 58, 3666–3677. [Google Scholar] [CrossRef]
- Aiello, M.; Cataliotti, A.; Cosentino, V.; Nuccio, S. Synchronization techniques for power quality instruments. IEEE Trans. Instrum. Measur. 2007, 56, 1511–1519. [Google Scholar] [CrossRef]
- Sedlacek, M.; Titera, M. Interpolations in frequency and time domains used in FFT spectrum analysis. Measurement 1998, 23, 185–193. [Google Scholar] [CrossRef]
- Borkowski, D.; Bień, A. Improvement of accuracy of power system spectral analysis by coherent resampling. IEEE Trans. Power Deliv. 2009, 24, 1004–1013. [Google Scholar] [CrossRef]
- Tarasiuk, T. Estimator-analyser of power quality: Part I—Methods and algorithms. Measurement 2011, 44, 238–247. [Google Scholar] [CrossRef]
- Tarasiuk, T.; Szweda, M.; Tarasiuk, M. Estimator-analyser of power quality: Part II—Hardware and research results. Measurement 2011, 44, 248–258. [Google Scholar] [CrossRef]
- Suryanarayananan, S.; Riberio, P.; Steurer, M. Probabilistic aspects and flexible thresholds of waveform distortions. In Proceedings of the IEEE Power Systems Conference and Exposition, PSCE’06, Atlanta, GA, USA, 29 October–1 November 2006; pp. 256–256.
- UK Ministry of Defence standards. Quality of electrical power systems in HM Ships. In UK Defence Standard 61-5 Part 4, Issue 4, Low Voltage Electrical Power Supply Systems; UK Ministry of Defence standards: London, UK, 2006. [Google Scholar]
- Gnaciński, P.; Mindykowski, J.; Tarasiuk, T. Effect of power quality on windings temperature of marine induction motors. Part II: Results of investigations and recommendations for related regulations. Energy Convers. Manag. 2009, 50, 2477–2485. [Google Scholar] [CrossRef]
- Gnaciński, P.; Mindykowski, J.; Tarasiuk, T. A new concept of the power quality temperature factor and its experimental verification. IEEE Trans. Instrum. Measur. 2008, 57, 1651–1660. [Google Scholar] [CrossRef]
- Mindykowski, J.; Masnicki, R.; Hallmann, D. The implementation of FPGA for data transmission between ADC and DSP peripherals in the measurement channels for power quality assessment. ACTA IMEKO 2013, 2, 49–55. [Google Scholar]
- Mindykowski, J.; Tarasiuk, T.; Maśnicki, R.; Górniak, M.; Szweda, M. Experimental research results of universal estimator/analyzer of electrical power quality in the version 2.0. Measur. Autom. Monit. 2013, 59, 341–344. (In Polish) [Google Scholar]
- European Committee for Standards—Electrical. EN-50160:2007, Voltage Characteristics of Electricity Supplied by Public Distribution Network; European Committee for Standards—Electrical: Brussels, Belgium, 2007. [Google Scholar]
- North Atlantic Treaty Organization. STANAG 1008:2004, Characteristics of Shipboard Electrical Power Systems in Warships of the North Atlantic Treaty Navies, 9th ed.; North Atlantic Treaty Organization: Washington, DC, USA, 2004. [Google Scholar]
- Marine Engineers Review Office. Editorial: Are engineers getting the electrical training they need? Mar. Eng. Rev. 2006, 3, 34–35. [Google Scholar]
- Mindykowski, J. Towards safety improvement: Implementation and assessment of new standards of competence for Electro-Technical Officers on Ship. Marit. Policy Manag. 2016, submitted. [Google Scholar]
- Evans, I.C. The future is electric. Driving ahead—The progress of electric propulsion. Mot. Ship 2003, 9, 23–28. [Google Scholar]
- International Maritime Organization. International Convention for the Safety of Life at Sea (SOLAS); As Amended; International Maritime Organization: London, UK, 1974. [Google Scholar]
- Evans, I.C. A harmonious response. Mar. Eng. Rev. 2006, 9, 80–83. [Google Scholar]
- Mirus International Inc. Harmonic Treatment for Variable Speed Drives; Information Material on Lineator™: Brampton, ON, Canada, 2005. [Google Scholar]
- Pasi, M.L. Harmonic Mitigating Filter. U.S. Patent No. US6844794B2, 18 January 2005. [Google Scholar]
- Maritime and Coastguard Agency. Draft Marine Guidance Note (MGN): Potencial Hazards of Excessive Harmonic Distortion of Current and Voltage of Onboard Electrical Systems; Maritime and Coastguard Agency: Southampton, UK, 2010. [Google Scholar]
- International Maritime Organization. Model Course: Electro-Technical Officer; Code T708E; International Maritime Organization: London, UK, 2013. [Google Scholar]
- Hong, H.-P. The Development Trend of Green Ship Building Technology, 2nd ed.; Asian Shipbuilding Experts’ Forum: Changwon, Korea, 2008. [Google Scholar]
- European Marine Equipment Council. Green Ship Technology Book, 2nd ed.; European Marine Equipment Council: Brussel, Belgium, 2010. [Google Scholar]
- International Maritime Organization. Resolution MEPC. 213 (63). In Guidelines for the Development of a Ship Energy Efficiency Management Plan (SEEMP); International Maritime Organization: London, UK, 2012. [Google Scholar]
- International Maritime Organization. Resolution MEPC. 215 (63). In Guidelines for Calculation of Reference Lines Use with the Energy Efficiency Design Index (EEDI); International Maritime Organization: London, UK, 2012. [Google Scholar]
 means frequency converter.
means frequency converter.
means frequency converter.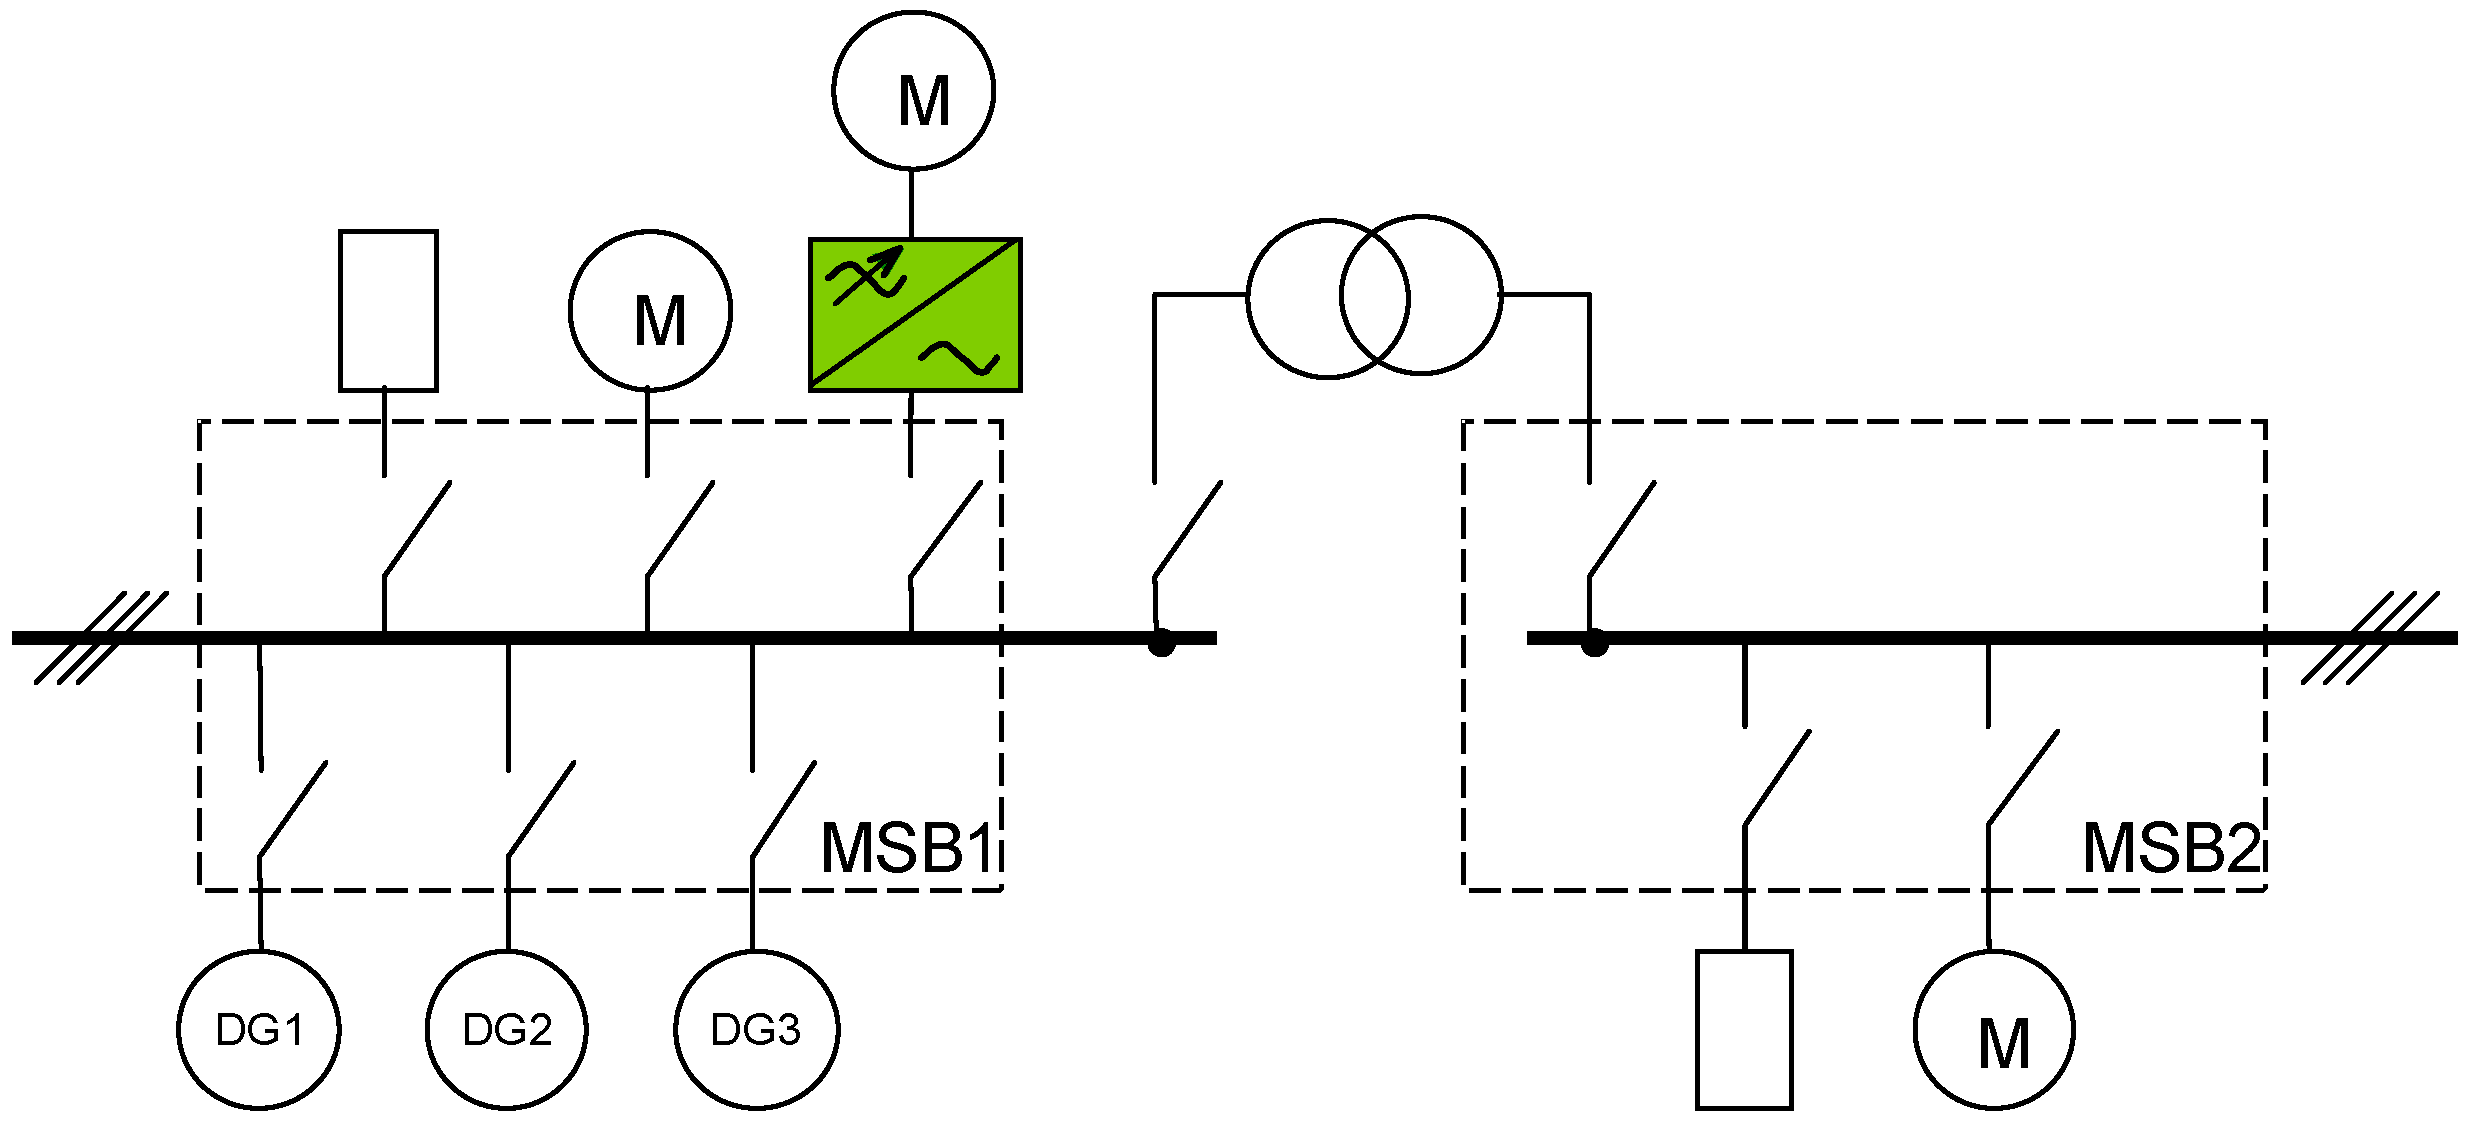 —frequency converter.
—frequency converter.
—frequency converter. —frequency converter.
—frequency converter.
—frequency converter.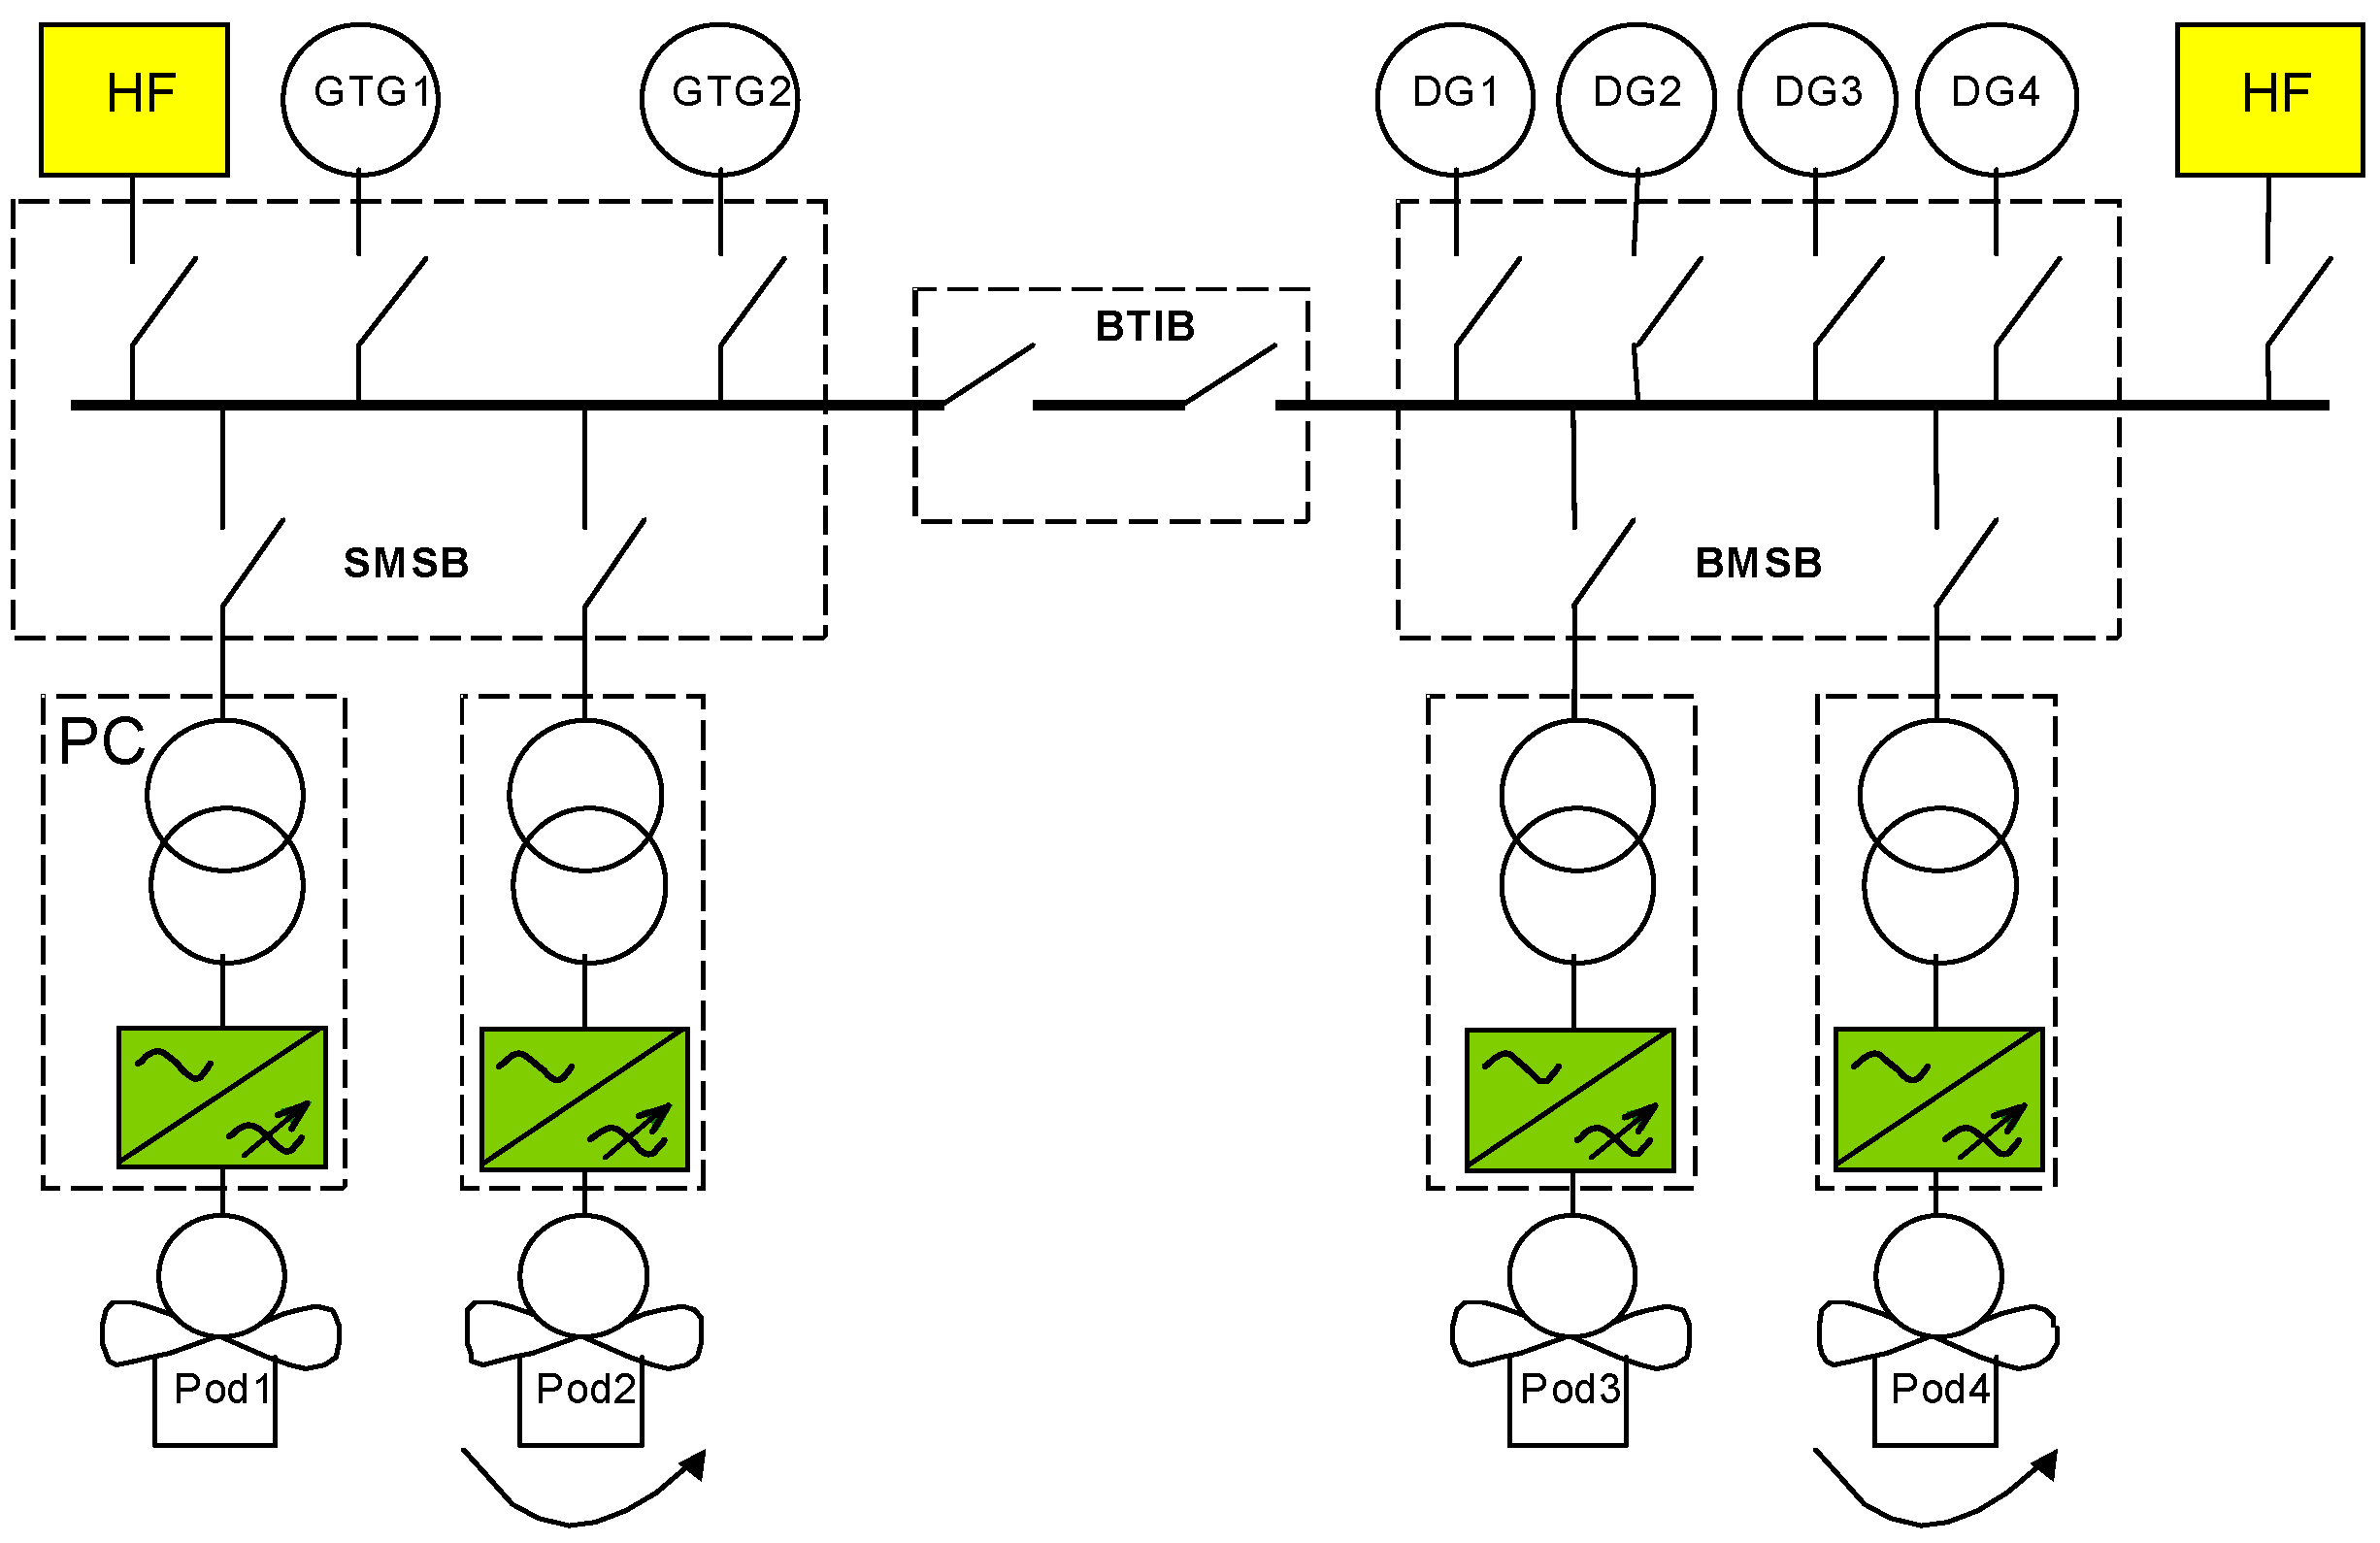


| Parameter | IEEE 45 | PN-IEC610092-101 | ABS | PRS |
|---|---|---|---|---|
| δft | ±3% | ±5% | ±5% | ±5% |
| δftr | – | – | – | – |
| (a) value | ±4% | ±10% | ±10% | ±10% |
| (b) time | 2 s | 5 s | 5 s | 5 s |
| δperf | 0.5% | 0.5% | – | – |
| δfmax | 5.5% | 12.5% | – | – |
| δVt | ±5% | +6%, −10% | +6%, −10% | +6%, −10% |
| δVtr | – | – | – | – |
| (a) value | ±16% | ±20% | ±20% | ±20% |
| (b) time | 2 s | 1.5 s | 1.5 s | 1.5 s |
| δperV | 5% | 2% | – | – |
| δVmax | ±20% | ±20% | – | – |
| uL_t_L | 3% | 7% | – | – |
| u2 | – | 3% | – | 3% |
| THD | 5% | 5% | 5% | 5% *, 10% ** |
| Vh% | 3% | 3% | 3% | 3% *, 6% ** |
| δu | 5% | – | – | – |
| us | 2500 V (Vn = 380–600 V) 1000 V (Vn = 120–240 V) | 5.5 Vn 1.2/50 μs *** | – | – |
| δP | – | – | ±15% | ±15% |
| δQ | – | – | ±10% | ±10% |
| THD50 | THD100 | TWD2.5 kHz | TWD10 kHz | TWD50 kHz |
|---|---|---|---|---|
| 1.51% | 1.61% | 1.62% | 7.83% | 7.9% |
| No. | Symbol of the Standard | Range of the Standard |
|---|---|---|
| 1 | IEEE 1159-1995 | IEEE Recommended Practice for Monitoring Electric Power Quality |
| 2 | IEC 61000-4-15:1997/A1:12003 | Electromagnetic Compatibility (EMC), Part 4: Testing and Measurement Techniques—Section 15: Flickermeter—Functional and design specification |
| 3 | IEC 61000-4-30-2003 | Testing and Measurement Techniques—Power Quality Measurement Methods |
| 4 | IEC 61000-4-7-2007 | General Guide on Harmonics and lnterharmonics Measurement for Power Supply Systems and Equipment Connected Thereto |
| 5 | EN-50160-2007 | Voltage characteristics of electricity supplied by public distribution network |
| 6 | IEEE 1459-2010 | IEEE Standards Definitions for the measurement of electric power quantities under sinusoidal, nonsinusoidal, balanced or unbalanced conditions |
| No. | Symbol of the Standward | Range of the Standard |
|---|---|---|
| 1 | IEEE Std. 45:2002 | IEEE Recommended Practice for Electrical Installations on Shipboard |
| 2 | IEC 60092-101:2002 | Electrical installations in ships. Definitions and general requirements |
| 3 | STANAG 1008:2004 | Characteristics of Shipboard Electrical Power Systems in Warships of the North Atlantic Treaty Navies, NATO, Edition 9, 2004 |
| 4 | American Bureau of Shipping, ABS, 2008 | Rules of building and classing, steel vessels |
| 5 | Rules of international ship classification societies, e.g., PRS/25/P/2006 | Technical Requirements for Shipboard Power Electronic Systems |
| Analyzed Parameters | Number of Working Generators | ||
|---|---|---|---|
| 1 | 2 | 3 | |
| Urms (V) | 385.5 | 384.2 | 383.4 |
| TWD | 7.92 | 4.79 | 3.73 |
| THD | 7.91 | 4.77 | 3.70 |
| TWD2.5–10 kHz | 0.97 | 0.89 | 0.93 |
| SGH5 | 6.00 | 3.72 | 2.92 |
| SGH7 | 0.87 | 1.36 | 1.38 |
| SGH11 | 4.05 | 2.07 | 1.30 |
| SGH13 | 2.62 | 0.89 | 0.53 |
© 2016 by the author; licensee MDPI, Basel, Switzerland. This article is an open access article distributed under the terms and conditions of the Creative Commons Attribution (CC-BY) license (http://creativecommons.org/licenses/by/4.0/).
Share and Cite
Mindykowski, J. Case Study—Based Overview of Some Contemporary Challenges to Power Quality in Ship Systems. Inventions 2016, 1, 12. https://doi.org/10.3390/inventions1020012
Mindykowski J. Case Study—Based Overview of Some Contemporary Challenges to Power Quality in Ship Systems. Inventions. 2016; 1(2):12. https://doi.org/10.3390/inventions1020012
Chicago/Turabian StyleMindykowski, Janusz. 2016. "Case Study—Based Overview of Some Contemporary Challenges to Power Quality in Ship Systems" Inventions 1, no. 2: 12. https://doi.org/10.3390/inventions1020012
APA StyleMindykowski, J. (2016). Case Study—Based Overview of Some Contemporary Challenges to Power Quality in Ship Systems. Inventions, 1(2), 12. https://doi.org/10.3390/inventions1020012