Article

Sexual Roles and Relationship in Everyday Life Infrastructure and Well-Being: A Feminist Economics Perspective from the European Context

by
Gloria Alarcón-García
1,
Edgardo A. Ayala Gaytán
2 and
José Manuel Mayor Balsas
3,*
1
Department of Political Science, Social Anthropology and Public Finance, University of Murcia, 30100 Murcia, Spain
2
School of Economics of the Autonomous University of Nuevo León, Monterrey 64930, Nuevo León, Mexico
3
Department of Sociology, University of Murcia, 30100 Murcia, Spain
*
Author to whom correspondence should be addressed.
Sexes 2025, 6(3), 37; https://doi.org/10.3390/sexes6030037
Submission received: 17 March 2025 / Revised: 27 June 2025 / Accepted: 7 July 2025 / Published: 10 July 2025
(This article belongs to the Section Gender Studies)

Abstract

This article examines the impact of everyday life infrastructure on well-being through the lens of feminist economics, with a specific focus on gender disparities within the European context. Combining the capability approach (CA) and subjective well-being (SWB) theory, this study introduces a gender-sensitive well-being budget indicator, the Well-being and Infrastructure by Gender Index, or just WIGI, to assess the differential impacts of public expenditures on women and men. Drawing on feminist critiques of infrastructure planning, it highlights how gendered patterns of access and use shape experiences of well-being. The literature review synthesizes recent contributions on well-being measurement, gendered capabilities, and the role of public infrastructure in supporting everyday life. The research utilizes the Benefits of Gender Equality through infrastructure Provision (BGGEIP) survey from the European Institute for Gender Equality (EIGE) from 28 EU member states in 2015 to evaluate the contribution of key public services—such as transport, childcare, and healthcare—to individual capabilities and subjective well-being outcomes. The findings underscore the importance of integrating gender-sensitive methodologies into infrastructure planning and public policy to promote social inclusion and equitable well-being outcomes. This article concludes by advocating for feminist economics-informed policies to enhance the responsiveness of public investments to the lived experiences of women and men across Europe.

1. Introduction

The measurement of human and economic development has traditionally been based on income-based indicators, with Gross Domestic Product (GDP) serving as the primary reference. However, it is increasingly recognised that GDP alone is insufficient for capturing the multidimensional nature of well-being and societal progress [1,2,3,4,5]. This approach overlooks unpaid domestic and caregiving labour, access to public services, and broader social and environmental determinants of welfare [6]. Consequently, new methodologies have been developed to assess well-being beyond monetary income, incorporating both objective and subjective measures.
A crucial aspect of these new frameworks is the integration of gender perspectives, acknowledging how structural inequalities influence access to resources, infrastructure, and quality of life.
This article introduces a new methodological model that combines the capability approach (CA) and subjective well-being (SWB) theory to develop a gender well-being budget indicator, the WIGI. This indicator allows for the ranking of public expenditures based on their differential impacts on the well-being of women and men, offering a tool for integrating gender considerations into public policies.
Infrastructure plays a pivotal role in shaping the gendered experiences of well-being. Historically, public infrastructure has been perceived as gender-neutral; however, growing research highlights that access to and use of infrastructure are deeply gendered [7,8]. This study applies the well-being model to infrastructure expenditure, demonstrating its effectiveness in evaluating public investments through a gender-sensitive lens.
This article is structured as follows: the second section reviews the literature on infrastructure for everyday life, drawing from feminist economics and architecture. The third section introduces the theoretical propositions behind the Well-being and Infrastructure by Gender Index (WIGI). The fourth section presents the Benefits of Gender Equality through infrastructure Provision (BGGEIP) survey, the way the survey was designed, its application, and validation for 28 EU member states in 2015. The results are shown in the fifth section of this paper. The final section provides conclusions and policy recommendations.

2. Literature Review and Theoretical Framework

2.1. Conceptualising Well-Being: Theoretical Foundations

Well-being is broadly understood as the extent to which individuals can develop their capabilities and fulfil their aspirations. It can be measured through objective indicators that assess individuals’ material conditions and human rights or through subjective indicators that capture personal perceptions of well-being [5]. Theories of well-being generally fall into two traditions: the capability approach (CA) and subjective well-being (SWB) theory.
The CA, developed by Amartya Sen and expanded by Martha Nussbaum, posits that well-being is contingent on individuals’ capabilities—their ability to lead lives they value. This framework advocates for evaluating development beyond economic metrics, incorporating aspects such as education, health, and social participation [9,10]. In contrast, SWB theory, rooted in Benthamite utilitarianism, assesses well-being based on individuals’ self-reported life satisfaction and emotional states [11,12]. While the CA offers a normative structure for assessing human development, SWB provides empirical insights into how people subjectively experience their well-being.
The integration of these two approaches enables a more comprehensive assessment of well-being, and that is our proposal.
While the capability approach (CA) has been widely adopted by feminist economics as a robust theoretical tool to analyse structural inequalities between women and men [10,13,14], its empirical application remains limited. In particular, well-being measurement frameworks have yet to develop instruments that systematically operationalise capabilities in specific contexts [15,16], which has hindered their potential to inform inclusive public policy. This lack of operationalisation affects the overall approach, but it is particularly relevant when attempting to reveal gendered differences in the experience of well-being.
Conversely, subjective well-being (SWB) theory has been extensively operationalised in recent decades and has produced a substantial body of empirical evidence [12,17], but most of this work adopts a gender-neutral perspective that overlooks the structural determinants shaping women’s and men’s perceptions and lived experiences [18].
This study addresses this double gap. On the one hand, it proposes a concrete way to operationalise the CA, and on the other, it explicitly incorporates a gender perspective into both the model design and the empirical measurement of how public infrastructure affects well-being. This proposal is embodied in a gender-sensitive budget indicator, the WIGI, which links public expenditure design with the effective improvement of well-being from a feminist perspective.
The OECD [5] has emphasised the need for well-being indicators to be integrated into budgetary processes.
The recent literature has expanded on these perspectives, exploring the interplay between capabilities and subjective well-being. Comim [15] argues for potential synergies between CA and SWB, suggesting that integrating both can offer more robust indicators of individual and collective well-being [15]. Graham and Nikolova [18] further develop this idea, linking capabilities with eudaimonic well-being, which emphasises life purpose beyond mere life satisfaction [18].
Furthermore, Hovi and Laamanen [19] highlight the role of adaptation and macroeconomic loss aversion in the relationship between GDP and subjective well-being. Their findings align with the Easterlin paradox, showing that while economic growth has diminishing long-term effects on SWB, economic downturns exert lasting negative impacts [19]. Similarly, Muffels and Headey [20] empirically validate Sen’s capability framework using longitudinal data from Germany and the UK, demonstrating that long-term well-being outcomes are significantly shaped by individual capabilities and choices [20].

2.2. Gender and Well-Being: A Methodological Approach

A gender-sensitive well-being framework must account for structural inequalities that shape men’s and women’s lived experiences. Three key dimensions underpin gendered disparities in well-being: (1) The gendered division of labour, which affects economic independence and time allocation; (2) Unequal access to and control over resources; (3) Restricted political and institutional representation [8]. These disparities highlight the necessity of integrating gender considerations into well-being measurement and policy formulation.
This study merges CA and SWB within a gender-sensitive framework, operationalising a well-being budget indicator that evaluates the distributional effects of public expenditures. The model incorporates seven capabilities essential to well-being: education, employment, caregiving and domestic work, health, social relationships, mobility, and leisure. Survey respondents assess these capabilities using a scale that reflects their perceived importance and accessibility, allowing for a comparative analysis of gendered differences in well-being outcomes.
Public policies must ensure a minimum and equitable level of capability development, as proposed by CA, while also considering gendered experiences of SWB. If gender disparities in well-being indicators persist, budgetary allocations may need to be adjusted to mitigate these inequalities [21]. By integrating gender-sensitive methodologies into well-being assessments, this study contributes to a growing body of literature advocating for feminist perspectives in economic policymaking.

2.3. Gendered Infrastructure and Everyday Life

Infrastructure is traditionally conceptualized as a neutral, universal good; however, feminist research has demonstrated that access to and use of infrastructure are highly gendered [7]. Women and men utilize infrastructure differently because of divergent responsibilities in paid and unpaid labour, caregiving, and mobility patterns [22,23,24,25,26,27,28,29,30,31].
Infrastructure planning that fails to acknowledge these distinctions risks reinforcing gender inequalities.
From the 1970s [32,33,34] until the present, architectural analyses have proven the existence of differences in the way men and women conceive, use, and perceive urban space. Likewise, these analyses also show a spatial and urban dimension in enduring gender inequalities [35]. The differences in use and perception between genders are not only related to cultural and psychological factors [36] but also to women’s double working load [37].
Bofill [38] points out that cities have been planned and built on the assumption that both sexes have some roles given by society. On the other hand, he underlines that the nuclear family is the only domestic structure taken into account when projecting houses, services, and facilities, leaving all new family structures apart.
By examining public policies on infrastructure design and implementation in Western countries, Sánchez De Madariaga [37] considers that the transformation of gender relations and the sexual division of labour have changed the needs for services supporting families, especially with dependents. She also considers urban planning and infrastructure as key elements in achieving sustainability. Quality of life relies upon the level at which infrastructure can meet individual needs [39].
Thus, there are many architectural studies that have addressed urban planning and infrastructure for daily life from a gender perspective [21,35,38,39,40]. These studies indicate that urban planning for everyday life leads to more accessible, comfortable, and safe cities, in addition to eliminating the generalized approach in its planning that both sexes have the roles that society gives them [38,41].
This study examines eleven categories of public infrastructure, including transport, childcare facilities, healthcare services, and public spaces. Empirical evidence suggests that gender-sensitive infrastructure planning enhances social inclusion, economic participation, and overall well-being [5]. For instance, investments in pedestrian pathways, childcare facilities, and public transport significantly benefit women, who are more likely than men to engage in multimodal travel and caregiving-related journeys [13].

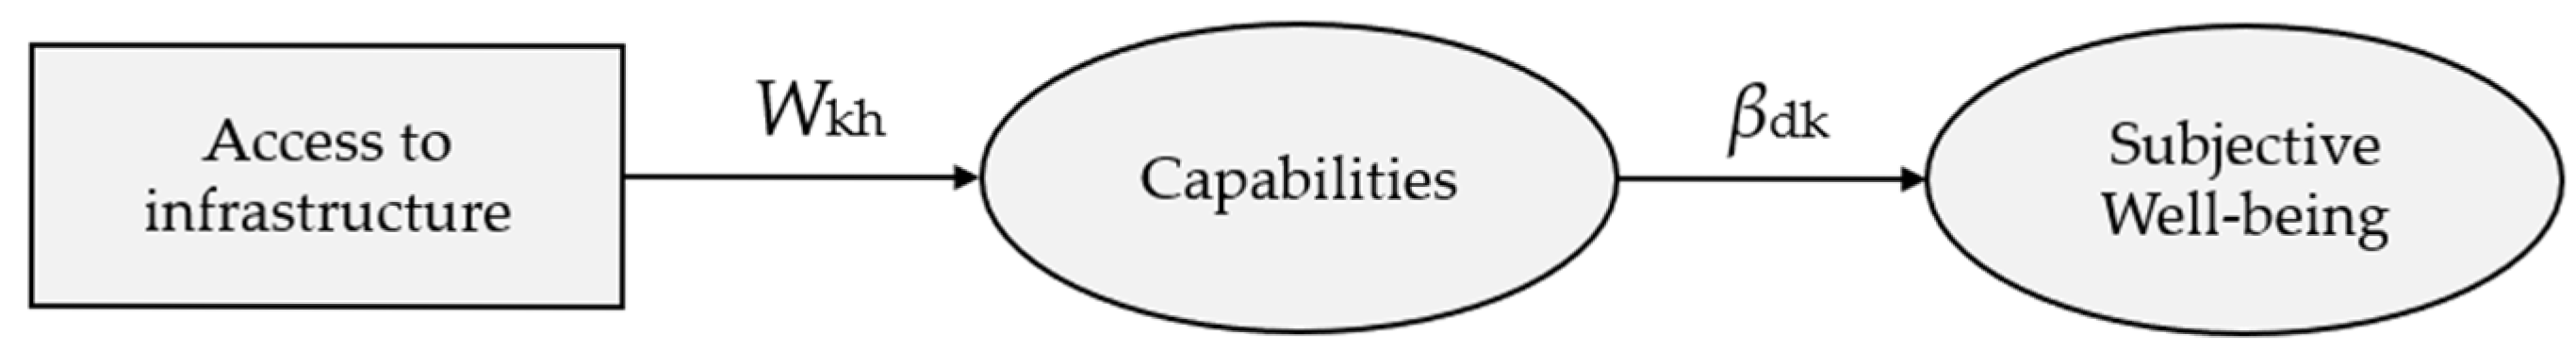
3. Well-Being and Infrastructure by Gender Index (WIGI) Methodology

The methodological proposal in this study is to merge both the capability approach (CA) and subjective well-being (SWB) [42,43,44] approach into one general model to assess the impact of different types of infrastructure on different capabilities and SWB, from a gender perspective. In other words, CA and SWB approaches are not considered as rival theories in this model, but they complement each other, by contributing to the analysis of well-being from a gender perspective and from a gender benefits point of view [42,43,44].
As discussed, the CA [45,46] well-being is associated with the freedom individuals must choose the things they value in life. In this way, well-being is constrained by individuals’ capabilities to reach several needs and goals. For example, a level of health and education is necessary to achieve a comfortable standard of living and/or a good job. In SWB theory, well-being comes from the subjective, usually self-reported feeling of happiness, the balance between positive versus negative emotions, or life satisfaction judgments.
These emerging cases motivate us to propose a very simple model that aims to combine both well-being approaches, with the purpose of applying it to assess the effect of public infrastructure on well-being in Europe from a gender perspective. The key propositions of the model depart from the following two propositions:
Proposition 1.
The higher the access to the different types of infrastructure, the higher the individual subject well-being.
Proposition 2.
The impact of access to infrastructure on subjective well-being is via its impact on the capabilities set.
In the model proposed here, the self-reported variable of access to each type of infrastructure is the key exogenous variable. Access to infrastructure is a good measure of the “quantity” of infrastructure available to citizens, meaning that the infrastructure is available, reachable, and affordable to the general population.
The spirit of the proposition is that access to infrastructure helps individuals achieve more capabilities, which should result in higher levels of SWB, measured through emotional responses or life satisfaction judges. As women usually bear a higher burden on caring for dependents, it is reasonable that proper infrastructure might impact them more compared with men; thus, the sensitivity of SWB to the capability formed by accessing infrastructure should be higher.
Figure 1 shows a graphical prototype of the conceptual model [44]. Exogenous variables are enclosed in squares and endogenous ones in ellipses.
An index of the impact of access to infrastructure on well-being through capabilities can be estimated from this simple model, which is named the Well-being and Infrastructure by Gender Index, or the WIGI index [44]. Its computation requires estimating two different sets of parameters. The first type assesses the impact of increased access to infrastructure on capabilities, which is called weights in this proposal, and they are represented by   w k h in the figure, where k stands for the capability and h for the type of infrastructure. The second type measures the sensitivity of SWB to the improved capability resulting from the higher access to infrastructure, which are referred to as coefficients and denoted as, β d k , where d stands for the life domain in which well-being is reported, such as satisfaction with economic situation or health.
Therefore, infrastructure affects well-being indirectly through the capabilities. In other words, capabilities fully mediate the effect of infrastructure on well-being. The size of the effect is determined by the product of the weights and the coefficients, that is,   w k h β d k . The details of the estimation of both sets of parameters can be found in Alarcón-García and Ayala-Gaytán [44]; here, a short raw description is provided.
To estimate capabilities as a function of access to infrastructure, we need to calculate the weights,   w k h , which are estimated using self-report scores of importance for each infrastructure h to form capability k, for example, rating importance on a scale of 0 to 10 of different types of everyday infrastructure, such as nurseries, health centres, public transport, and others, for achieving education. In this study, the average weights for representative groups depending on socioeconomic variables were used. The sample is split by gender, age, and place of living, such as small versus large cities, because there are changes in the needs, roles, and residence along the life cycle. Specifically, there are 12 groups with all different combinations of male–female, young (18 to 30 years), middle (31 to 55), and senior citizens (more than 55) and small versus large cities, where small refers open countryside, village, and small town options in the survey while large size location includes medium towns, large towns, cities, and city suburbs. Other forms to identify them include “rural” for small towns and “urban” for large ones.
Mathematically, the variable C i k , that is the level of Capability k that individual “I” receives by her access to all h types of everyday life infrastructures is constructed as follows:
C i k = h = 1 11 w i k h A i h
The next step is to relate SWB to CA, which is the second arrow in Figure 1. For this purpose, it is recommended to obtain SWB scores of well-founded scales for individuals for several domains of personal life, such as satisfaction with the standard of living, health conditions, and so on. A multivariate regression model is used to estimate the relationship of SWB dominion d to the k capability, which is more closely related to that dominion. For example, satisfaction with free time is a function of the capability of leisure. Equation (2) presents a representative regression model of this type as follows:
S W B i d = α d + β d k C i k + Z i γ d + ε i d
The parameter of interest is the regression coefficient or loading β d k . Satisfaction with life domains provides estimates of the response of subjective well-being (SWB) to an increase in the associated capability due to improved access to infrastructure. These coefficients measure the strength of the second arrow in the flowchart. The control variables in vector Z that most likely affect SWB might be income, having children and other dependents, education, and others.
The final step performed to arrive at the WIGI index is to multiply the weights by the coefficients. As we discussed above, the weights might be estimated for each individual or for some non-overlapping groups. Using the sub-index “i” to denote individual or group, the raw WIGI index score for any infrastructure h, capability k, and life domain d is obtained by the product of the weight by the regression coefficient as follows:
I i k h d = w i h k β d k
The total effect on subject well-being by an increase in access to infrastructure h by 1 unit is then:
    I i h = d k w i k h β d k
Equation (4) is the WIGI index in its raw form. To facilitate the interpretation, it is suggested to normalize it by the overall WIGI index mean or by using Equation (3) for the raw indexes in every dominion of life satisfaction. The first transformation allows making comparisons between groups and life dominions, the second one helps us to make intra-life dominions comparisons.

4. Data Collection Methodology

4.1. Questionnaire Development

The research on estimating the costs and benefits of gender mainstreaming in public infrastructure expenditure in Europe was carried out by a team from the University of Murcia in collaboration with the European Institute for Gender Equality (EIGE) and its network of partners, EIGEnet. The aim was to design a questionnaire capable of capturing the relationship between public infrastructure and the well-being of the population, with a particular focus on gender differences. To achieve this, a theoretical framework based on the capability approach (CA) and subjective well-being (SWB) was established, allowing for an in-depth analysis of how various public services impact people’s lives.
From the outset, the questionnaire was conceived as a comprehensive and detailed tool. It was structured into multiple sections to address different aspects of the relationship between infrastructure and well-being. The most critical part included methodological questions focusing on measuring individual capabilities—assessing people’s real opportunities to access essential goods and services. Another key section contained questions about the importance, accessibility, and satisfaction with public infrastructure in the European population, enabling the collection of both objective information and subjective perceptions. Additionally, the questionnaire incorporated questions on gender roles, caregiving activities, and time use to evaluate whether there were significant differences between men and women in how they used and perceived public services.
One of the central aspects of the research was selecting the key types of infrastructure for this study. Nine essential types of public services were identified:
  • Nursery schools for children under three years old.
  • Nursery schools for children aged three to mandatory school age.
  • Health services and medical centres.
  • Elderly care centres (nursing homes and day centres).
  • Centres for people with long-term disabilities.
  • Sidewalks and pedestrian paths.
  • Parks and green areas.
  • Public transport (local trips and daily commuting).
  • Cultural centres for activities and workshops
  • Gym and other centres for work out and play.
  • Street lighting in residential areas.
The questionnaire aimed to assess the extent to which this infrastructure contributed to the development of seven fundamental capabilities: education, employment, care and domestic activities, health, social relationships, mobility, and leisure. To ensure that responses were based on real experiences, only those who had interacted with each type of infrastructure in the past ten years could answer. While this approach ensured well-founded responses, it also posed a challenge: some services were evaluated by a small number of respondents, leading to truncated data.
Another fundamental part of the questionnaire focused on subjective well-being. Standardized questions were included to evaluate respondents’ satisfaction with different aspects of their lives, such as health, work–life balance, and personal relationships. This methodological approach linked the capability approach with subjective well-being, allowing researchers to analyze how public infrastructure influenced people’s quality of life. Additionally, the questionnaire explored the impact of infrastructure on caregiving responsibilities and the distribution of time between men and women.
The questionnaire was translated into the languages of all 28 EU member states and stored in a relational database for further analysis using tools such as SPSS® 27.0.0. However, several issues emerged during its development. National coordinators pointed out that the structure of the questions was too complex, making it difficult for interviewers to conduct the survey smoothly. In response, various modifications were made to improve clarity and usability, particularly in how questions were structured and worded.
One of the main changes involved simplifying complex question structures and making them more understandable for respondents. Key terms, such as “dependent person,” were redefined, and introductions to certain sections were rewritten for better accessibility. Additionally, dimensions considered unnecessary or confusing—such as “community” and “well-being”—were removed, and some infrastructure categories were refined for clarity.
Before its final implementation, the questionnaire underwent a pre-test phase in different countries and linguistic contexts. Experienced interviewers conducted pilot interviews to assess response rates, completion times, and potential difficulties in question formulation. Feedback was collected from both interviewers and respondents, enabling the identification of improvement areas and further refinements.
The pre-test results highlighted the need for five key changes to the questionnaire. First, the dimensions of “community” and “well-being” were removed, as they were deemed unnecessary and confusing. Second, certain services were redefined to make them more concrete and comprehensible—for example, “pedestrian zones” became “sidewalks and pedestrian paths,” and “public transport” was specified as “local trips and daily commuting.” Third, the option “Don’t know/Refuse to answer” was introduced in all questions, allowing respondents to express uncertainty without being forced into imprecise answers. Fourth, intermediate values were added to response scales to better capture respondents’ perceptions. Finally, the order of questions in several sections was reorganized to improve the survey’s logic and ease of understanding.
After these modifications, the final questionnaire was structured into five main parts:
  • Part A: Demographic data and sample stratification criteria. A new question on respondents’ residence was introduced, and employment-related questions were simplified.
  • Part B: Evaluation of the importance and quality of public services. Key questions were reorganized for better interview flow.
  • Part C: Relationship between infrastructure and individual capabilities. Domains of evaluation were simplified, and redundant questions were removed.
  • Part D: Evaluation of subjective well-being. Minor adjustments were made to ensure consistency with previous studies.
  • Part E: Questions on gender roles and time distribution. Terminology was revised to maintain methodological consistency.
The project was conducted with the collaboration of more than 23 organizations and consortiums, alongside a multidisciplinary team of economists, lawyers, psychologists, and experts in survey studies and gender analysis.

4.2. The Study Design

To ensure the representativeness and robustness of the results, this study was structured into two well-defined phases. Each had a specific purpose and followed a precise methodological design to capture the reality of infrastructure and its impact on the population of the European Union.

4.2.1. Phase A: Initial Exploration

The first phase of this study aimed to establish a general diagnosis of the impact of infrastructure on the well-being of the European population. To achieve this, a sample of 5378 people from the 28 member states of the European Union was selected, with a margin of error of 1.4%.
Since Europe is a continent with a great diversity of urban models, infrastructure systems, and family structures, countries were grouped into four clusters based on the classification proposed by Iacovou [47]:
  • Nordic Countries: Sweden, Denmark, Finland, and the Netherlands. These countries are known for their high level of gender equality and advanced social welfare policies.
  • Northwestern Europe: Germany, France, the United Kingdom, Austria, Belgium, Luxembourg, and Ireland. While these are strong economies, they still face challenges in integrating gender equity policies into public infrastructure.
  • Southern Europe: Spain, Italy, Portugal, Greece, Cyprus, Malta, and Croatia. In this region, traditional family structures play a key role in daily life organization, influencing accessibility and infrastructure use.
  • Eastern Europe: Poland, Hungary, the Czech Republic, Slovakia, Slovenia, Estonia, Latvia, Lithuania, Romania, and Bulgaria. In these countries, infrastructure development has been influenced by the political and economic transition of recent decades.
Each cluster was designed to enable comparative analysis between countries with similar characteristics, with the expectation of identifying patterns and trends that could be useful for policymaking.
Data collection in this phase followed a precise methodology. The selected survey contractors conducted fieldwork based on the population distribution in each country, ensuring that the sample was representative. A sampling strategy was implemented, where each country had a specific quota within its cluster.
This study used population data provided by EUROSTAT in September 2014, ensuring that the sample accurately reflected the demographic composition of the European Union.
Despite careful planning, methodological difficulties arose during Phase A. One of the main issues was the lack of sufficient data to conduct a solid cluster-level analysis, primarily due to the application of Q8 (Q8. [Ask all for each service] In the last 10 years, have you, or a person who depends on you used public services such as… [By ‘dependent person’, I mean a person that you care for, such as a child or older parent]: 1. Nursery schools for children up to three years old, 2. Nursery schools (3-year-olds to mandatory school age), 3. Health services and medical centres, 4. Centres for older persons (nursing homes, day centres), 5. Centres for people with long-term disabilities, 6. Pavements and footpaths, 7. Parks and green areas, 8. Public transport (local trips, daily commuting), 9. Cultural centres for activities and workshops, 10. Gyms and other centres for work out and play, 11. Street lights in your residential area) filter in the surveys. As a result, researchers decided to discard the cluster-based classification and opted for a country-by-country case study approach.
This first phase laid the groundwork for the second stage of this study, where a more detailed and in-depth analysis of data would be conducted.

4.2.2. Phase B: Confirmation and Deepening

After analyzing the results from Phase A, researchers identified countries with trends or significant patterns that required further study. Phase B was designed to validate the initial findings and obtain greater precision in these data.
To achieve this, the sample size was expanded to 15,917 people, reducing the margin of error to 0.79%. This increase allowed for a more detailed national-level analysis, ensuring better representation of the populations in each country.
Unlike Phase A, this stage did not include all EU member states. Instead, a limited number of countries were selected based on the results of the first phase. The selection of countries was also influenced by the costs of conducting this study, as surveying all EU nations would have been financially demanding.
Survey contractors participating in this phase only had to conduct the number of surveys established for Phase B (400, 625, or 1111, depending on the country). They were not required to replicate the surveys from Phase A.
As in the previous stage, data collection had to be completed within two months, requiring efficient coordination among the various fieldwork teams. To ensure consistency in the implementation of surveys, strict quality criteria were established, including prior methodological validation and standardization of data collection procedures.

4.3. Data Collection

To gather information from the European population, this study used a modern and efficient method: Computer-Assisted Telephone Interviews (CATI). This system allowed researchers to contact thousands of people through random calls and automatically record their responses in a database.
This method provided several advantages:
  • Greater speed and efficiency: Large amounts of data could be collected in a short time.
  • Continuous monitoring: Ensured that interviewers followed the survey questions correctly.
  • Diverse sample representation: By including both landline and mobile phones, respondents from different age groups and geographic areas were reached.
However, the process was not without challenges. The initial expectation was that 70% of contacted individuals would participate, but it soon became evident that this estimate was overly optimistic. The actual response rate varied significantly across countries.
In some countries, the response rate was particularly low. For example, in Romania, only 1.9% of contacted individuals agreed to participate in the survey. Other countries, such as Latvia (5%) and Ireland (3%), also recorded very low response rates.
To address this challenge, stratified random sampling strategies were implemented. The surveyed population was divided into subgroups based on region, gender, and age, ensuring that different sectors of society were properly represented.
The survey design also incorporated both landline and mobile phone data collection, aiming to expand the sample coverage. In countries where most of the population used mobile phones rather than landlines, Random Digit Dialing (RDD) was used to generate random phone numbers and contact potential respondents.
Additionally, a response categorization system was established, recording different types of non-responses, such as:
  • Immediate non-response (hanging up before introduction).
  • Refusal after the start of the survey.
  • Respondent not available at the time of the call.
  • Technical issues with the dialed number.
This approach allowed for detailed control of data and ensured that the sample accurately reflected the demographic composition of the European population.
Throughout this study, rigorous quality control mechanisms were implemented to ensure that data were comparable across countries and methodologically sound.
The key quality control measures included:
  • Prior methodological validation before data collection.
  • Standardization of survey procedures across all participating countries.
  • Implementation of homogeneous sampling criteria to ensure data consistency.
  • Documentation of each study phase in detailed technical reports.
Once all responses were collected and validated, a final dataset was compiled in SPSS format, containing the complete matrix of coded responses. This allowed for a thorough analysis of the results obtained.

4.4. Procedure Fieldwork

ICF International collected the information in Austria, Belgium, Cyprus, Czech Republic, Finland, France, Germany, Greece, Hungary, Ireland, Latvia, Poland, Portugal, Slovakia, Slovenia, Spain, and the United Kingdom; Milieu Ltd. in Bulgaria, Croatia, and Romania; Oxford Research in Denmark and Sweden; Estonian Human Rights Centre in Estonia; Istituto per la Ricerca Sociale (IRS) in Italy; Center for Equality Advancement in Lithuania; Emprousàrl in Luxembourg; Weave Consulting in Malta; OQ Consulting BV in Netherlands.
Every European Union (EU) member state collected data for the survey through the CATI system, and all versions of CATI were effective. The information collected in May and June 2015 allows for the segmentation by the suggested age groups: 18 to 39 years old, 40 to 64, and 65 or over. The population criterion is also met, i.e., at least 25% live in rural areas, with a maximum fluctuation of 10%, and at least 35% of respondents are employed.
The master questionnaire in English was designed to last between 15 and 20 min, which occurred in English-speaking countries, e.g., Ireland (19 min) and the United Kingdom (17 min). Similar to other cross-national surveys, the duration varies depending on the specific nature of each language. To prevent outliers, interviews on both sides, those with durations less than 5 min and greater than 60 min, were excluded from these data.
The survey response rate, understood as the ratio of completed interviews out of the total number of respondents eligible, was on average 19%, but the response rate by country ranged between 6% and 50%.
The response rate by question, that is, the ratio of completed answers in a specific question out of the total interviews, was very high in all questions: 74% of all questions had response rates of 90% or higher, 97% of them had rates above 85%. The lowest response rates occurred in Q19 about the time dedicated to caring for children (62.4%) and Q22a regarding income (65.7%).

4.5. Data Reliability, Validity, and Robustness

Once data quality is guaranteed, other data requirements must also be safeguarded: (a) reliability, (b) validity, and (c) robustness. Reliability is the overall consistency of a measure. Reliability does not ensure validity. However, a lack of reliability limits validity. As for validity, it would prove that the measurements used are well-founded and correspond accurately to the real world, i.e., measuring what they claim to measure. Finally, robustness ensures that a small fraction of data, such as outliers, does not affect the results [48].
Reliability is the overall consistency of a measure. Due to the nature of the questions and the context, the focus has been put on multi-item measures. Only, multi-item measure’s reliability was measured with Cronbach’s Alpha to check the internal consistency. Hence, Cronbach’s Alpha of Q11 (Q11. Could you please tell me on a scale of 1 to 10, where 1 means that you are not satisfied at all and 10 means you are very satisfied, how satisfied you are with…: 1. Your health, 2. The economic situation of your household, 3. FILTER: ONLY ASK Q11.3. If Q5 = 4 or 5: Your job or occupational activity, 4. How much free time you have, 5. Your domestic and care activities, 6. The neighbourhood where you live, 7. Your relationships with people who are close to you, 8. How various public services help your everyday life [42]). Regarding satisfaction with different dominions of life was 0.815, and one of Q12 (Q12. I am going to read four statements. Could you please tell me to what extent you agree or disagree with each statement on a scale of 1 to 10, where 1 means that you do not agree at all and 10 means you completely agree: 1. In most ways, my life is close to my ideal, 2. The conditions of my life are excellent, 3. So far, I have gotten the important things I want in life, 4. If I could live my life over, I would change almost nothing [42]), which contains the item satisfaction with life with a value of 0.848, both high enough to indicate these questions are reliable.
Validity can be split into three different aspects: content validity, criterion validity, and construct validity. Content validity refers to the extent to which a measure represents all facets of a given social construct. It requires the use of recognized subject matter experts to evaluate whether test items assess defined content. Since subject matter experts developed the questionnaire, it is plausible to expect the different concepts measured in the questionnaire to have content validity. Criterion validity is a measure of how well one variable or set of variables predicts an outcome based on information from other variables. Finally, construct validity is “the degree to which a test measures what it claims, or purports, to be measuring.” A single study does not prove construct validity. Rather, it is a continuous process of evaluation, re-evaluation, refinement, and development. Correlations that fit the expected pattern contribute evidence of construct validity. The constructs present significantly differently from zero correlation coefficients in items that we expect to have some relationship, such as between satisfaction and happiness, or different attributes of the infrastructure; hence, we concluded data satisfies construct validity.
Robustness refers to the extent to which a change in the sample entails a large change in the parameters. The database can be analysed to check how the elimination of outliers changes the parameters to evaluate their robustness. Robust statistics can also be used to ensure good performance for data drawn from a wide range of probability distributions.
Outliers were identified at a previous stage. Analyses without the outliers are replicated. Outliers were found only in these variables: Q15, Q17, Q18, Q19, and Q20. In all these cases, when outliers are eliminated, the mean and median values remain almost unchanged. For example, when 32 outliers are eliminated, the mean of Q15 changes from 1.80 to 1.74, while the median does not change. With data from 1845 interviewees, this change in the mean can be considered small. When 391 outliers of Q17 were eliminated, the median remained the same, and the mean changes from 39.21 to 40.17. Still, this change can be considered small. Summing up, the robustness of these data is also ensured.

5. Results and Discussion

In each country, the sample size for the survey was 0.0001% of the population size; thus, the share of each country in the total sample size replicates the real weight based on the population. For this reason, the sample size of each country will act implicitly in the analyses as the weighting factor, and it is not necessary to insert weights in the microdata to make the sample representative of the EU.
Table 1 presents the composition of the sample according to the main socio-demographic variables. Approximately 52% of the sample are women; the distribution of types of locations in which individuals live is more concentrated in large cities, but in general, differences in the frequencies are small. Indeed, 47% of the subjects live in villages or small cities, while 53% live in medium or large cities. On the other hand, 46% of the subjects are employees, while 25% are retired; 48% of the individuals studied primary or secondary studies, while 27% completed bachelor or postgraduate studies. Finally, 37% of the individuals reported no income or a monthly income lower than EUR 600, and only 16% earned EUR 2000 or more monthly.
The mean and standard deviation of the importance, access, and reported quality of the eleven types of infrastructure considered in the survey are shown in Table 2. Health services, parks, and street lights are considered the most important infrastructure, and nursery centres for children are the least important; however, the standard deviation in these facilities is the highest, signaling the likely polarization in the opinions of those who have children and those who do not have them. These data show that nursery centres for children under three, centres for elderly people, and those with long-term disabilities have the lowest average access scores. This indicates deficits in these types of infrastructure. However, all infrastructure scores tend to be lower than those of importance, signaling a likely gap. Finally, among the subjects that use the infrastructure, the average quality scores range between 7 and 8, with nursery centres being the highest.
Well-being measures, as well as infrastructure, are the main constructs that the survey is designed to capture. Table 3 presents the items included to collect data about satisfaction with different dominions of the individuals’ lives, and the items of the satisfaction with life scale. Apparently, subjects rate satisfaction with public services and their economic situation lower than other aspects of their lives, while they are clearly more satisfied with their social relationships. On the other hand, the average of the five items of the satisfaction with life scale is 7, an indication that satisfaction with life is good, but with opportunity areas.
Beyond the descriptive statistics, the BGEIP survey collects all information needed to estimate the WIGI index for the EU-28: scores of access to everyday life infrastructure types, scores of the importance of each one of the infrastructure types to form a given capability, and SWB scales.
Table 4 presents the results expressed on a scale where 100 corresponds to the mean average of the considered infrastructure for the whole sample. As the base of the index is the same for all groups and types of infrastructure, it allows the comparison across groups.
Some patterns arise from comparing the indexes in Table 4, among them:
  • On average, women have larger scores than men, which means that a marginal increase in expenditure on infrastructure benefits women more.
  • Average women’s indicators tend to decrease with age independently of the size of the city. Younger women benefit more from improved infrastructure, which, from a societal point of view, and in terms of the net present value of increasing public services, makes investing in these public services even more difficult to contest.
  • Average men’s indicators decrease with age in small cities but remain stable in large ones.
  • The largest improvement in well-being induced by access to infrastructure occurs in young women living in small cities, followed by young women living in large cities.
  • The indicators are especially high in nurseries (up to 5) among young women in small cities, and in nurseries for children from 3 to 5 among young women in large cities.
  • Medical centres improve the well-being of middle-aged women to a greater extent in small cities, and in senior males in small and large cities.
  • The centres for the elderly present low indices (below 100 means lower than the overall average), with the exception of women aged over 55 years old in small cities.
  • The centres for people with long-term disabilities are more important for the well-being of older women or men.
  • Sidewalks and parks are of average value and uniformly distributed across socioeconomic groups, with a slight advantage for young people and seniors than for middle-aged citizens.
  • Public transport shows high scores for all groups, in a range of 130 to almost 300, showing that this infrastructure is key in terms of the total well-being for all groups.
  • Streetlights are generally more important than pavement and less than public transport. Even though it distributes uniformly, it seems to contribute more to young women and senior males.
Table 5 shows the result of applying the WIGI index to the BGEIP survey on a new scale, from 0 to 100, where 0 corresponds to the minimum value of the index and 100 to the maximum within a socio-demographic group. Table 5 aims to facilitate comparisons of infrastructure across groups, whereas Table 4 allows for inter-group comparisons.
The following conclusions are drawn from the evidence:
  • Except for women in small towns, all other groups rate public transport as the infrastructure that has the greatest potential to increase subjective well-being. The predominant role of public transport is a consequence of the high weights it achieved in almost all capabilities, with the sole exception of health and domestic care. In this sense, public transport is a horizontal means of increasing almost all the capabilities Europeans can enjoy, improving well-being.
  • Women in small towns regard nurseries as the key infrastructure. In large towns, nurseries rate very high, especially among young women.
  • The well-being of elderly men in small and large cities is also highly affected by access to medical centres and facilities.

6. Conclusions

This paper presents the methodological work of the first survey conducted in the 28 EU countries, designed to collect direct information about access, importance, and perceived qualities of everyday infrastructure experienced by European residents and their well-being level. The survey was supported by the European Institute for Gender Equality (EIGE), which is motivated by the idea that everyday life infrastructure is important for well-being and for closing gender gaps and enhancing women’s access to this infrastructure.
The survey is grounded in two well-being theories: the capability approach (CA) and the subjective well-being (SWB) theory. The first one stresses the role of infrastructure in supporting the development of capabilities essential for human dignity and well-being. The SWB theory emphasizes that everyday life infrastructure generates experienced well-being in its users.
The survey directly asks respondents about their self-reported access to and the importance of eleven types of infrastructure, and how they contribute to developing seven essential capabilities in their lives, as well as their satisfaction with their main domains of life. The preliminary results clearly indicate that everyday infrastructure is important for the average EU resident, but it is more important for women than for men.
These data are valuable for developing indicators of infrastructure sensitivity to capability development and, consequently, to well-being. These indicators illuminate public policy by targeting public investment to optimize citizens’ well-being from a gender perspective.
The concept of well-being adopted in this article acknowledges the extensive debate regarding its definition [3,4,6,49,50], a discussion that spans from income-based measures to multidimensional understandings of well-being. This approach is aligned with the ongoing efforts to establish, develop, report, and integrate well-being indicators within the budgetary process [5,51].
Within feminist economics, the capability approach has been strongly endorsed as a key analytical tool for disaggregating well-being at the individual level, thereby challenging the bias present in many conventional welfare metrics that equate household well-being with women’s well-being [10,52,53]. This critique has been essential in exposing intra-household inequalities and advancing evaluative frameworks that recognise well-being as a gender-differentiated experience.
In this study, beyond operationalising the capability approach in relation to public infrastructure, we contribute further to feminist economics by incorporating subjective well-being (SWB) as a complementary analytical dimension. Although well developed in mainstream welfare economics, SWB has rarely been integrated into feminist economic approaches, despite its potential to capture the lived experiences of women and men in relation to public services and everyday life.
Our methodological proposal, based on the Well-being and Infrastructure by Gender Index (WIGI), links the institutional design of public expenditure to gender-differentiated impacts on capabilities and subjective well-being. This expands the empirical toolkit of feminist economics for informing gender-responsive public policy.
This work opens the door to several lines of future research that could enrich both the analysis of well-being and its connection with public infrastructure from a feminist perspective. First, it would be valuable to replicate the proposed model in non-European contexts in order to test its applicability and sensitivity in environments with different institutional, cultural, and public service configurations. Second, future studies could further explore the intersection of gender with other structural dimensions of inequality—such as social class, place of residence, or migration status—by incorporating an intersectional perspective into well-being measurement. Additionally, the model could be expanded by including a greater variety of infrastructure categories as well as new capabilities not considered in this initial proposal, in order to capture more comprehensively the diverse factors that shape everyday well-being. Finally, extending the WIGI index longitudinally would allow researchers to examine how changes in public investment affect capabilities and subjective well-being over time, providing a useful monitoring tool for gender-sensitive public policy.

Author Contributions

Conceptualization, G.A.-G.; methodology, G.A.-G., E.A.A.G. and J.M.M.B.; software, G.A.-G., E.A.A.G. and J.M.M.B.; investigation, G.A.-G., E.A.A.G. and J.M.M.B.; supervision, G.A.-G. and J.M.M.B. All authors have read and agreed to the published version of the manuscript.

Funding

The data used in this work come from a survey which was carried out in the frame of a research project funded by the Institute for Women of the Ministry of Equality of the Government of Spain. Project 154/10 (2013).

Institutional Review Board Statement

The study was conducted in accordance with the Declaration of Helsinki, and approved by the Ethics Committee of European Institute for Gender Equality EIGE/201 5/OPER/14 2015-01-20.

Informed Consent Statement

Verbal informed consent was obtained from the participants. The rationale for utilizing verbal consent that the surveys were conducted by telephone in various European countries.

Data Availability Statement

The data that support the findings of this study are available from the corresponding author upon reasonable request.

Conflicts of Interest

The authors declare no conflict of interest.

References

  1. UNDP. Human Development Report 2009: Overcoming Barriers: Human Mobility and Development; United Nations Development Programme: New York, NY, USA, 2009; Available online: http://hdr.undp.org (accessed on 8 January 2024).
  2. UNDP. Human Development Report 2010: The Real Wealth of Nations: Pathways to Human Development; United Nations Development Programme: New York, NY, USA, 2010; Available online: https://hdr.undp.org/system/files/documents/human-development-report-2010-complete-english.human-development-report-2010-complete-english (accessed on 14 April 2024).
  3. OECD. How’s Life? 2013: Measuring Well-Being; OECD Publishing: Paris, France, 2013. [Google Scholar]
  4. OECD. Measuring Well-Being for Development; Global Forum on Development Discussion Paper for Session 3.1; OECD Publishing: Paris, France, 2013. [Google Scholar]
  5. OECD. Economic Policy Making to Pursue Economic Welfare; OECD Report for the G7 Finance Ministers and Central Bank Governors; OECD Publishing: Paris, France, 2023. [Google Scholar]
  6. Stiglitz, J.; Fitoussi, J.-P.; Durand, M. Beyond GDP: Measuring What Counts for Economic and Social Performance; OECD Publishing: Paris, France, 2018. [Google Scholar] [CrossRef]
  7. Alarcón-García, G.; Arias, C.; Colino, J. Infraestructuras y género (Infrastructure and gender). Rev. Investig. Fem. 2012, 2, 151–174. [Google Scholar]
  8. Alarcón-García, G. Las infraestructuras para la vida cotidiana. Impregnar los presupuestos públicos de la perspectiva de género feminista e interseccional. In Economía, Política y Ciudadanía; Fabra, J., González, A., Muro, I., Eds.; Los Libros de la Catarata: Madrid, Spain, 2023; pp. 211–227. [Google Scholar]
  9. Sen, A. Development as Freedom; Alfred Knopf: New York, NY, USA, 1999. [Google Scholar]
  10. Nussbaum, M.C. Las Mujeres y el Desarrollo Humano: El Enfoque de las Capacidades; Herder: Barcelona, Spain, 2002. [Google Scholar]
  11. Diener, E. ¿Por qué las sociedades necesitan la felicidad y cuentas nacionales de bienestar? In Ranking de Felicidad en México 2012; Manzanilla, F., Ed.; Universidad Popular Autónoma del Estado de Puebla: Puebla, Mexico, 2013. [Google Scholar]
  12. Kahneman, D.; Krueger, A.B. Developments in the measurement of subjective well-being. J. Econ. Perspect. 2006, 20, 3–24. [Google Scholar] [CrossRef]
  13. Addabbo, T. Gender Budgeting in the capability approach: From theory to evidence. In Feminist Economics and Public Policy: Reflections on the Work and Impact of Ailsa McKay; Campbell, J., Gillespie, M., Eds.; Routledge: Abingdon, UK, 2016. [Google Scholar]
  14. Villota, P.; Jubeto, Y.; Ferrari, I. Estrategias Para la Integración de la Perspectiva de Género en los Presupuestos Públicos; Instituto de la Mujer, Ministerio de Igualdad: Madrid, Spain, 2009. [Google Scholar]
  15. Comim, F. Capabilities and happiness: Potential synergies. Rev. Soc. Econ. 2005, 63, 161–176. [Google Scholar] [CrossRef]
  16. Muffels, R.; Headey, B. Capabilities and choices: Do they make Sen’se for understanding objective and subjective well-being? Soc. Indic. Res. 2013, 110, 1159–1185. [Google Scholar] [CrossRef] [PubMed]
  17. Diener, E. Why societies need happiness and national well-being accounts. In Ranking de Felicidad en México 2012; Universidad Popular Autónoma del Estado de Puebla: Puebla, Mexico, 2013. [Google Scholar]
  18. Graham, C.; Nikolova, M. Bentham or Aristotle in the development process? An empirical investigation of capabilities and subjective well-being. World Dev. 2015, 68, 163–179. [Google Scholar] [CrossRef]
  19. Hovi, M.; Laamanen, J.P. Adaptation and loss aversion in the relationship between GDP and subjective well-being. BE J. Econ. Anal. Policy 2021, 21, 863–895. [Google Scholar] [CrossRef]
  20. Muffels, R. Testing Sen’s capability approach to explain objective and subjective wellbeing using German and Australian panel data. In Sen-Sitising Life Course Research: Exploring Amartya Sen’s Capability Concept in Comparative Research on Individual Working Lives; Bartelheimer, P., Buttner, R., Eds.; Net-Doc: Lehi, UT, USA, 2009; pp. 197–221. [Google Scholar]
  21. Carrera, L.; Castellaneta, M. Women and cities. The conquest of urban space. Front. Sociol. 2023, 8, 1125439. [Google Scholar] [CrossRef] [PubMed]
  22. Koskela, H. Fear, Control and Space; Geographies of Gender, Fear of Violence, and Video Surveillance; Helsinging Ylioispiston Maantieteen Laitos: Helsinki, Finland, 1999. [Google Scholar]
  23. Word Bank. Mainstreaming Gender in Road Transport: Operational Guidance for World Bank Staff; The International Bank for Reconstruction and Development/The World Bank: Washington, DC, USA, 2010; Available online: https://policycommons.net/artifacts/1507565/mainstreaming-gender-in-road-transport/2173289/ (accessed on 25 January 2024).
  24. Miralles-Guasch, C.; Domenec, E. Sustainable transport challenges in a suburban university: The case of the Autonomous University of Barcelona. Transp. Policy 2010, 17, 454–463. [Google Scholar] [CrossRef]
  25. Sánchez de Madariaga, I. From Women In Transport To Gender In Transport: Challenging Conceptual Frameworks For Improved Policymaking. J. Int. Aff. 2013, 67, 43–65. [Google Scholar]
  26. Miralles-Guasch, C.; Martínez, M.; Marquet, O. A gender analysis of everyday mobility in urban and rural territories: From challenges to sustainability. Gend. Place Cult. 2016, 23, 398–417. [Google Scholar] [CrossRef]
  27. Alarcón-García, G. The benefits of gender equality by the expenditures on public infrastructures and transport. In Retos en Materia de Igualdad de Género; Dykinson: Madrid, Spain, 2019; pp. 27–48. [Google Scholar] [CrossRef]
  28. Ravagnan, C.; Rossi, F.; Amiriaref, M. Sustainable Mobility and Resilient Urban Spaces in the United Kingdom. Practices and Proposals. Transp. Res. Procedia 2022, 60, 164–171. [Google Scholar] [CrossRef]
  29. Johansson, S.; Haandrikman, K. Gendered fear of crime in the urban context: A comparative multilevel study of women’s and men’s fear of crime. J. Urban Aff. 2023, 45, 1238–1264. [Google Scholar] [CrossRef]
  30. Small, S.F.; van der Meulen, Y.R. The gendered effects of investing in physical and social infrastructure. World Dev. 2023, 171, 106347. [Google Scholar] [CrossRef]
  31. Grande-Ayala, C.E.; Marin, M.A.; Rincón-Garcia, N. Social sustainability in urban mobility: An approach for policies and urban planning from the Global South. J. Infrastruct. Policy Dev. 2024, 8, 5786. [Google Scholar] [CrossRef]
  32. Hayden, D. What would a non-sexist city be like? Speculations on housing, urban design, and human work. Signs J. Women Cult. Soc. 1980, 5, 170–187. [Google Scholar] [CrossRef]
  33. Hayden, D. The Grand Domestic Revolution; MIT Press: Cambridge, MA, USA, 1981. [Google Scholar]
  34. Hayden, D. Redesigning the American Dream: The Future of Housing, Work, and Family Life; WW Norton & Company: New York, NY, USA, 1984. [Google Scholar]
  35. Carpio-Pinedo, J.; De Gregorio, S.; Sánchez De Madariaga, I. Gender mainstreaming in urban planning: The potential of geographic information systems and open data sources. Plan. Theory Pract. 2019, 20, 221–240. [Google Scholar] [CrossRef]
  36. Greed, C. Women and Planning, Creating Gendered Realities; Routledge: London, UK; New York, NY, USA, 1994. [Google Scholar]
  37. Sánchez de Madariaga, I. Urbanismo con Perspectiva de Género, Instituto Andaluz de la Mujer, Junta de Andalucía; Foro Social Europeo: Sevilla, Spain, 2006. [Google Scholar]
  38. Bofill, A. De la Ciudad Actual a la Ciudad Habitable; II Encuentro Mujeres en la Arquitectura; Universidad de Alcalá: Madrid, Spain, 1998. [Google Scholar]
  39. Sánchez de Madariaga, I. Infraestructuras para la vida cotidiana y la calidad de vida. Ciudades 2004, 8, 101–133. [Google Scholar] [CrossRef]
  40. Sánchez de Madariaga, I.; Novella, I. A new generation of gender mainstreaming in spatial and urban planning under the new international framework of policies for sustainable development. In Gendered Approaches to Spatial Development in Europe; Zibell, B., Damyanovic, D., Sturm, U., Eds.; Routledge: Oxon, UK, 2019; pp. 181–203. [Google Scholar] [CrossRef]
  41. Bofill, A. Hacia modelos alternativos de ciudad compatibles con una sociedad inclusiva. In Estudios Urbanos, Género y Feminismos. Teorías y Experiencias; Gutierrez-Valdivia, B., Ciocoletto, A., Eds.; Col·lectiu Punt 6: Barcelona, Spain, 2012. [Google Scholar]
  42. Alarcón-García, G.; Fernández-Sabiote, E. Well-Being and Infrastructure from a Gender Perspective Survey, WIGI Survey; Observatorio Fiscal de la Universidad de Murcia: Murcia, Spain, 2014. [Google Scholar]
  43. Alarcón-García, G. Gender Equality as an Axeis of a New Social and Economic Efficient and Sustainable Model: The Role of Public Policies; Universidad de Murcia: Murcia, Spain, 2015. [Google Scholar]
  44. Alarcón-García, G.; Ayala-Gaytán, E.A. Well-Being and Infrastructure from a Gender Perspective Index (WIGI): Methodology for Constructing the Index; Observatorio Fiscal de la Universidad de Murcia: Murcia, Spain, 2016. [Google Scholar]
  45. Sen, A. Poor relatively speaking. Oxf. Econ. Pap. 1983, 35, 153–169. [Google Scholar] [CrossRef]
  46. Sen, A. Capability and well-being. In The Quality of Life; Nussbaum, M., Sen, A., Eds.; OUP: Oxford, UK, 1993. [Google Scholar]
  47. Iacovou, M.; Skew, A.J. Household Structure in the EU, in Income and Living Conditions in Europe; Eurostat: Luxembourg, 2010. [Google Scholar]
  48. European Institute for Gender Equality. Benefits of Gender Equality Through Infrastructure Provision: An EU-Wide Survey; Publications Office of the European Union: Luxembourg, 2020. [Google Scholar]
  49. UNDP. Human Development Report 1990: Concept and Measurement of Human Development; United Nations Development Programme: New York, NY, USA, 1990; Available online: https://hdr.undp.org/content/human-development-report-1990 (accessed on 2 March 2025).
  50. Stiglitz, J.; Sen, A.; Fitoussi, J.P. Report by the Commission of Measurement of Economic Performance and Social Progress; Commission on the Measurement of Economic Performance and Social Progress: Paris, France, 2009; Available online: https://ec.europa.eu/eurostat/documents/8131721/8131772/Stiglitz-Sen-Fitoussi-Commission-report.pdf (accessed on 22 April 2024).
  51. Alarcón-García, G. Well-being and gender budgeting: The case of public infrastructure. A background, a methodological approach and a budgetary well-being index from a feminist approach. In Gender Responsive Budgeting in South Europe: Spain, France, Italy, Albania, Croatia, N. Macedonia and Serbia; Risteska, M., Ed.; Ed. Palgrave: London, United Kingdom, 2025. [Google Scholar]
  52. Addabbo, T. Unpaid Work and the Economy: A Gender Analysis of the Standards of Living; Ashgate: Aldershot, UK, 2003. [Google Scholar]
  53. Addabbo, T.; Picchio, A. Living and Working Conditions in an Opulent Society: A capability approach in a gender perspective. In Proceedings of the Fifth International Conference on the Capability Approach, Paris, France, 11–14 September 2005. [Google Scholar]
Figure 1. A conceptual model of the effect of access to infrastructure on capabilities and well-being.
Sexes 06 00037 g001
Table 1. Composition of the sample of the Benefits of Gender Equality through Infrastructure Provision (BGEIP) survey.
FrequencyRelative
Frequency
Gender
Woman278351.7
Man260248.3
Where do you live?
The open countryside or a village144626.9
A small town108220.1
A medium to large town125123.2
A city or city suburb159629.6
Employment Status
Student3185.9
Housewife/Stay-at-home husband/partner3426.4
Retired or pensioner135825.2
Self- employed (might have employees)4187.8
Employee (by another person/company)248046.1
Unemployed3777
Other921.7
Education
Primary education or less (ISCED 0 and 1)3346.3
Secondary education (ISCED 2 and 3)221641.6
Short-cycle tertiary education (ISCED 4 and 5)138326
Bachelor’s or equivalent level (ISCED 6)74814
Master’s or Doctoral or equivalent level (ISCED 7 and 8)64512.1
Income
Between 0 and up to 600 EUR44537.1
Between 600 and up to 1.000 EUR22718.9
Between 1.000 and up to 2.000 EUR33127.6
Between 2.000 and up to 3.000 EUR988.2
More than 3.000 EUR988.2
Source: Authors’ estimations with data from the Benefits of Gender Equality through Infrastructure Provision (BGEIP) survey.
Table 2. Descriptive statistics of importance, access, and quality of the infrastructure in the European Union according to the Benefits of Gender Equality through Infrastructure Provision (BGEIP) survey.
ImportanceAccessQuality
MeanStd. DeviationMeanStd. DeviationMeanStd. Deviation
Nursery schools for children up to 3 years old5.743.6825.563.4018.071.826
Nursery schools for 3 year olds to mandatory school age6.333.7176.563.2528.011.792
Health services or medical centres8.771.9067.712.2747.342.057
Centres for the elderly (nursing homes. day centres)7.013.1815.952.9617.212.007
Centres for people with long-term disabilities6.963.2945.022.9847.092.263
Sidewalks and pedestrian paths7.982.237.512.4757.092.058
Parks and green areas8.142.077.642.3647.681.763
Public transport (local trips. daily commuting)7.842.4637.142.6577.092.043
Cultural centres for activities and workshops7.132.3966.32.6297.61.734
Gyms and other centres for workout and play6.762.696.442.767.731.706
Street lights in your residential area8.092.2387.922.3117.861.93
Source: Authors’ estimations with data from the Benefits of Gender Equality through Infrastructure Provision (BGEIP) survey.
Table 3. Descriptive statistics of satisfaction with life’s dominions and satisfaction with life scale in the European Union according to the Benefits of Gender Equality through Infrastructure Provision (BGEIP) survey.
FrequencyMeanStd. Deviation
Satisfaction
Your health53717.571.946
The economic situation of your household53546.82.1
Your job or occupational activity28957.61.903
How much free time you have53546.912.452
Your domestic and care activities52227.152.007
The neighbourhood where you live53647.851.906
Your social relationships with people who are close to you53518.531.577
How various public services help your everyday life52466.792.208
Satisfaction with Life Scale
In most ways my life is close to my ideal53486.662.074
The conditions of my life are excellent53676.732.109
So far I have gotten the important things I want in life53487.152.093
If I could live my life over. I would change almost nothing53086.632.551
Taking everything in your life into consideration, how satisfied you
are with your life in general?
53637.561.697
Source: Authors’ estimations with data from the Benefits of Gender Equality through Infrastructure Provision (BGEIP) survey.
Table 4. Well-being and Infrastructure by Gender Index (WIGI) normalized by the overall mean WIGI score estimated with the Benefits of Gender Equality through Infrastructure Provision (BGEIP) survey.
WomenMen
Small TownLarge TownSmall TownLarge Town
Total18–3031–5555 or More18–3031–5555 or More18–3031–5555 or More18–3031–5555 or More
Nursery Schools up to 3 years109.7408.1107.6105.2238.8144.611.470.475.9109.2189.5138.119.9
Nursery Schools 3–5 years140.3430.9234.3257.8187.3168.9101.544.9108.891.2180.1153.4126.9
Health Services and Medical Centers73.4241.7174.199.7134.363.972.966.149.9160.082.550.9186.8
Centers for Elderly22.056.889.2117.836.158.058.25.49.97.42.066.721.4
Centers for people with long term disabilities79.3301.435.6162.86.756.621.974.875.9210.2135.3186.4113.5
Sidewalks and pedestrians paths99.6200.1130.563.3207.6140.3122.1130.3102.3113.3163.8125.6161.5
Parks and green areas97.9193.7147.067.3167.2142.1150.3121.7112.6132.9144.5112.0163.5
Public Transport163.2249.0165.7137.6294.2201.9160.0159.4128.6173.1211.7204.4250.3
Street Lights114.7175.8146.3157.0211.7137.4147.3117.3110.9175.7147.4114.3189.1
Average100.0250.8136.7129.8164.9123.794.087.886.1130.3139.6128.0137.0
Source: Authors’ estimations with data from the Benefits of Gender Equality through Infrastructure Provision (BGEIP) survey.
Table 5. Well-being and Infrastructure by Gender Index (WIGI) normalized in a 0 to 100 score for each socio-demographic group, estimated with the Benefits of Gender Equality through Infrastructure Provision (BGEIP) survey.
WomenMen
Small TownLarge TownSmall TownLarge Town
Total18–3031–5555 or More18–3031–5555 or More18–3031–5555 or More18–3031–5555 or More
Nursery Schools up to 3 years62.193.936.221.580.760.60.042.255.650.289.456.80.0
Nursery Schools 3–5 years83.8100.0100.0100.062.877.360.625.783.341.384.966.846.4
Health Services and Medical Centers36.449.469.718.744.45.041.439.433.775.238.40.072.4
Centers for Elderly0.00.026.928.010.21.031.40.00.00.00.010.30.6
Centers for people with long term disabilities40.665.40.051.10.00.07.045.155.6100.063.688.340.6
Sidewalks and pedestrians paths54.938.347.70.069.957.774.581.177.952.277.248.761.5
Parks and green areas53.736.656.12.055.858.993.575.586.561.967.939.862.3
Public Transport100.051.465.538.2100.0100.0100.0100.0100.081.7100.0100.0100.0
Street Lights65.631.855.748.171.355.691.472.785.183.069.341.373.4
Average55.251.950.934.255.046.255.553.564.260.665.650.250.8
Source: Authors’ estimations with data from the Benefits of Gender Equality through Infrastructure Provision (BGEIP) survey.
Disclaimer/Publisher’s Note: The statements, opinions and data contained in all publications are solely those of the individual author(s) and contributor(s) and not of MDPI and/or the editor(s). MDPI and/or the editor(s) disclaim responsibility for any injury to people or property resulting from any ideas, methods, instructions or products referred to in the content.

