Article

Effects of Polymerization Initiators on Plastic Scintillator Light Output

1
Department of Physics, Boğaziçi University, İstanbul 34342, Turkey
2
Center for Life Sciences and Technologies, Boğaziçi University, İstanbul 34342, Turkey
*
Author to whom correspondence should be addressed.
Instruments 2025, 9(3), 19; https://doi.org/10.3390/instruments9030019
Submission received: 26 May 2025 / Revised: 9 July 2025 / Accepted: 19 August 2025 / Published: 22 August 2025

Abstract

Polymerization initiators are commonly used to lower the processing temperatures and accelerate the synthesis of plastic scintillators. However, these additives can reduce light output. Since plastic scintillator tiles, fibers, and bars are used in countless radiation detection instruments, from PET scanners to LHC calorimeters, any loss in light output immediately degrades the timing and energy resolution of the whole system. Understanding how the initiators alter scintillation performance is therefore important. In this study, five different plastic scintillator samples were produced with varying concentrations of two initiators, 2,2-Azobis(2-methylpropionitrile) (AIBN) and benzoyl peroxide (BPO), along with a reference sample containing no initiators. The relative light yield (RLY) was measured using four different gamma sources. Analyzing the Compton edges revealed that higher initiator concentrations consistently decrease the light output. This study shows that keeping the initiator concentration at 0.2% limits the reduction to 8%, whereas 0.5–1% loadings can lower the yield by 20–35%, providing realistic bounds on initiator levels for future plastic scintillator productions.

1. Introduction

Ionizing radiation is the energy emitted from a radioactive source as charged particles (e.g., beta and alpha particles) or indirectly induced ionization by neutral particles (e.g., neutrons, gamma rays, and X-rays). Sensitive detection of ionizing radiation is essential across various fields, from medical imaging [1,2] (such as PET scans and X-ray imaging) to nuclear reactor monitoring [3].
Ionizing radiation detection is also the backbone of modern high- and low-energy physics experiments. In high-energy experiments, enormous numbers of photons, electrons, and hadrons are produced with high energies; therefore it is important to distinguish among them [4,5]. In low-energy experiments, such as direct dark matter detection [6,7], low-energy photon detection [8], and rare event experiments [9], it is important to suppress the background noise in order to detect weak signals.
Ionizing radiation can be detected with gas-filled ionization devices, semiconductor sensors, and scintillators. A scintillator first converts the ionizing event into visible or near-visible photons, which are then recorded by a photodetector. Although semiconductor sensors generally offer a better energy resolution than scintillator systems [10], cooling requirements and the high material cost make them impractical to use in large sizes.
Scintillating detector systems can be made in almost any size, from millimeter-thick fibers [11] to a total area of hundreds of square meters, as in the plastic tile calorimeter in the CMS experiment at CERN [12]. The most commonly used photodetectors for scintillators, such as photomultiplier tubes (PMTs), avalanche photodiodes (APDs), and silicon photomultipliers (SiPMs), all rely on the photoelectric effect to generate charge. Due to their photocathode or semiconductor band-gap, these devices are most efficient in the visible and ultraviolet (UV) regions of the electromagnetic spectrum [13,14,15].
Scintillating detector systems can employ inorganic crystals [16], organic single crystals [17], noble gas or liquid media [18], and plastic scintillators [19] as the light-emitting material. Among these choices, plastic scintillators are commonly preferred in radiation detection as they are easy to machine into almost any shape, mechanically durable, tolerant of high counting rates, and cost-effective. However, plastic scintillators also have certain limitations. For instance, they exhibit a moderate light yield (LY) compared to inorganic scintillators and organic crystals [20,21,22]. Additionally, because of their low effective atomic number, plastic scintillators typically do not exhibit a photopeak, unless sensitized with high-Z additives [22], which limits their suitability for applications requiring high energy resolution.
In order to enhance the performance of the produced plastic scintillator samples, it is critical to optimize the synthesis procedure. A widely accepted synthesis approach is thermal polymerization, which requires heating the monomer mixture until it converts to a polymer. In order to regulate the polymerization procedure, various chemicals are employed as initiators [23]. A polymerization initiator generates radicals when exposed to heat, which links monomers to form polymers. Polymerization initiators lower the processing temperature, enhance reaction consistency, and shorten the process time. However, initiators may diminish the performance of the final product; therefore determining their optimal amounts is critical.
A polymer matrix is the main ingredient of a plastic scintillator, with a weight percentage of more than 95% [24]. Most commercial products use either polystyrene (PS) or polyvinyltoluene (PVT) as the matrix, because both polymers dissolve standard fluorescent dopants efficiently, offer comparable light output, machine easily, and are cost-effective. A common production route is thermal bulk polymerization, in which the monomer solution is held at 120–180 °C for several days. Clark et al. [25] report that when the reaction mixture exceeds 140 °C it undergoes rapid exothermic polymerization, causing about 15% volume shrinkage. If the evolved gas cannot escape in time, the contraction leaves internal voids or bubbles that degrade optical clarity. Such shrinkage also causes challenges for large volume or mass production. In order to start polymerization at lower temperatures, enhance reaction consistency, and shorten the process time, various radical initiators can be employed as polymerization initiators [23].
The two polymerization initiators most frequently reported [26,27,28,29,30] in plastic scintillator synthesis, 2,2-Azobis(2-methylpropionitrile) (AIBN, CAS No: 78-67-1) and benzoyl peroxide (BPO, CAS No: 94-36-0), were selected for this study. PS was used as the polymer matrix because of its wide availability and compatibility with the chosen initiators [31,32]. In the literature, the concentrations of initiator loadings vary in the range 0.01–1.0 wt% [29,30,33,34,35], without a suggested concentration. To resolve any influence on LY, three representative concentrations, 0.2, 0.5, and 1.0 wt%, were examined. The results reveal a clear decrease in light output with increasing initiator content across different gamma energies. Since the lowest concentration tested (0.2%) reduces LY by only 4–8%, a level acceptable for most detector specifications, exploring still lower loadings would offer limited additional benefit.

2. Materials and Methods

2.1. Synthesis of the Plastic Scintillator Samples

Plastic scintillator samples are produced by thermal polymerization. Thermal polymerization of a selected monomer requires addition of the specific ingredients: a primary fluor for scintillation and a secondary fluor to shift the wavelength to a desired interval [24]. PS is chosen as the polymer base. The primary fluor is 2,5-Diphenyloxazole (CAS No: 92-71-7), also known as PPO (1.5 wt.%), while the wavelength shifter is 1,4-bis(5-phenyl-2-oxazolyl)benzene (CAS No: 1806-34-4), commonly known as POPOP (0.08 wt.%).
Initially, the monomer is cleaned with activated alumina sorbent to remove inhibitors and moisture. The additives are subsequently added to the purified monomer and mixed thoroughly with a magnetic stirrer to ensure even dissolution. High-purity argon gas is then introduced into the solution for two minutes to eliminate oxygen.
Glass tubes with a diameter of 25 mm are chosen for their high thermal resistance. The mixture is poured into these tubes, and the chosen initiator is subsequently added. Sealed tubes are kept under an argon atmosphere at 100–120 °C for 10 days. The final products are gradually cooled over a 5-day period to ensure uniform polymerization.
Finally, the bulk scintillators are shaped into cylindrical tubes with a diameter of 25 mm and a length of 15 mm. The shaping process is carried out in several steps: the samples are polished with sandpapers ranging from 400 to 4000 grit using a high-speed rotating polishing machine (ATM Saphir 150 M1, produced by QATM, Mammelzen, Germany). Finally, the samples are wrapped with Teflon tape and black tape to maximize reflection.
Five plastic scintillator samples are produced with different molar percentages of polymerization initiators along with a reference sample. Two different polymerization initiators are used, AIBN and BPO. Three different molar percentages are examined for AIBN (0.2%, 0.5% and 1.0%) and two for BPO (0.2% and 0.5%). Figure 1 shows the synthesized plastic scintillator samples labeled as Blank, AIBN 0.2%, AIBN 0.5%, AIBN 1.0%, BPO 0.2%, and BPO 0.5%. The labels indicate the type and molar percentage of the initiator used in each sample.

2.2. Light Yield Measurement of the Plastic Scintillator Samples

Scintillators absorb ionizing radiation and emit visible light. One of the most important characteristics of plastic scintillators is the LY, defined as the number of emitted photons per unit of absorbed energy. A higher LY results in improved resolution and enables the detection of lower energies.
In this study, to examine the effects of polymerization initiators on LY, the relative light yield (RLY) of five samples is measured with respect to the reference sample. The standard method employs radioactive sources with known energy spectra to ensure consistency and reliability. As organic scintillators do not show photopeaks due to low Z content, the Compton edge of the energy spectrum is used to determine RLY.
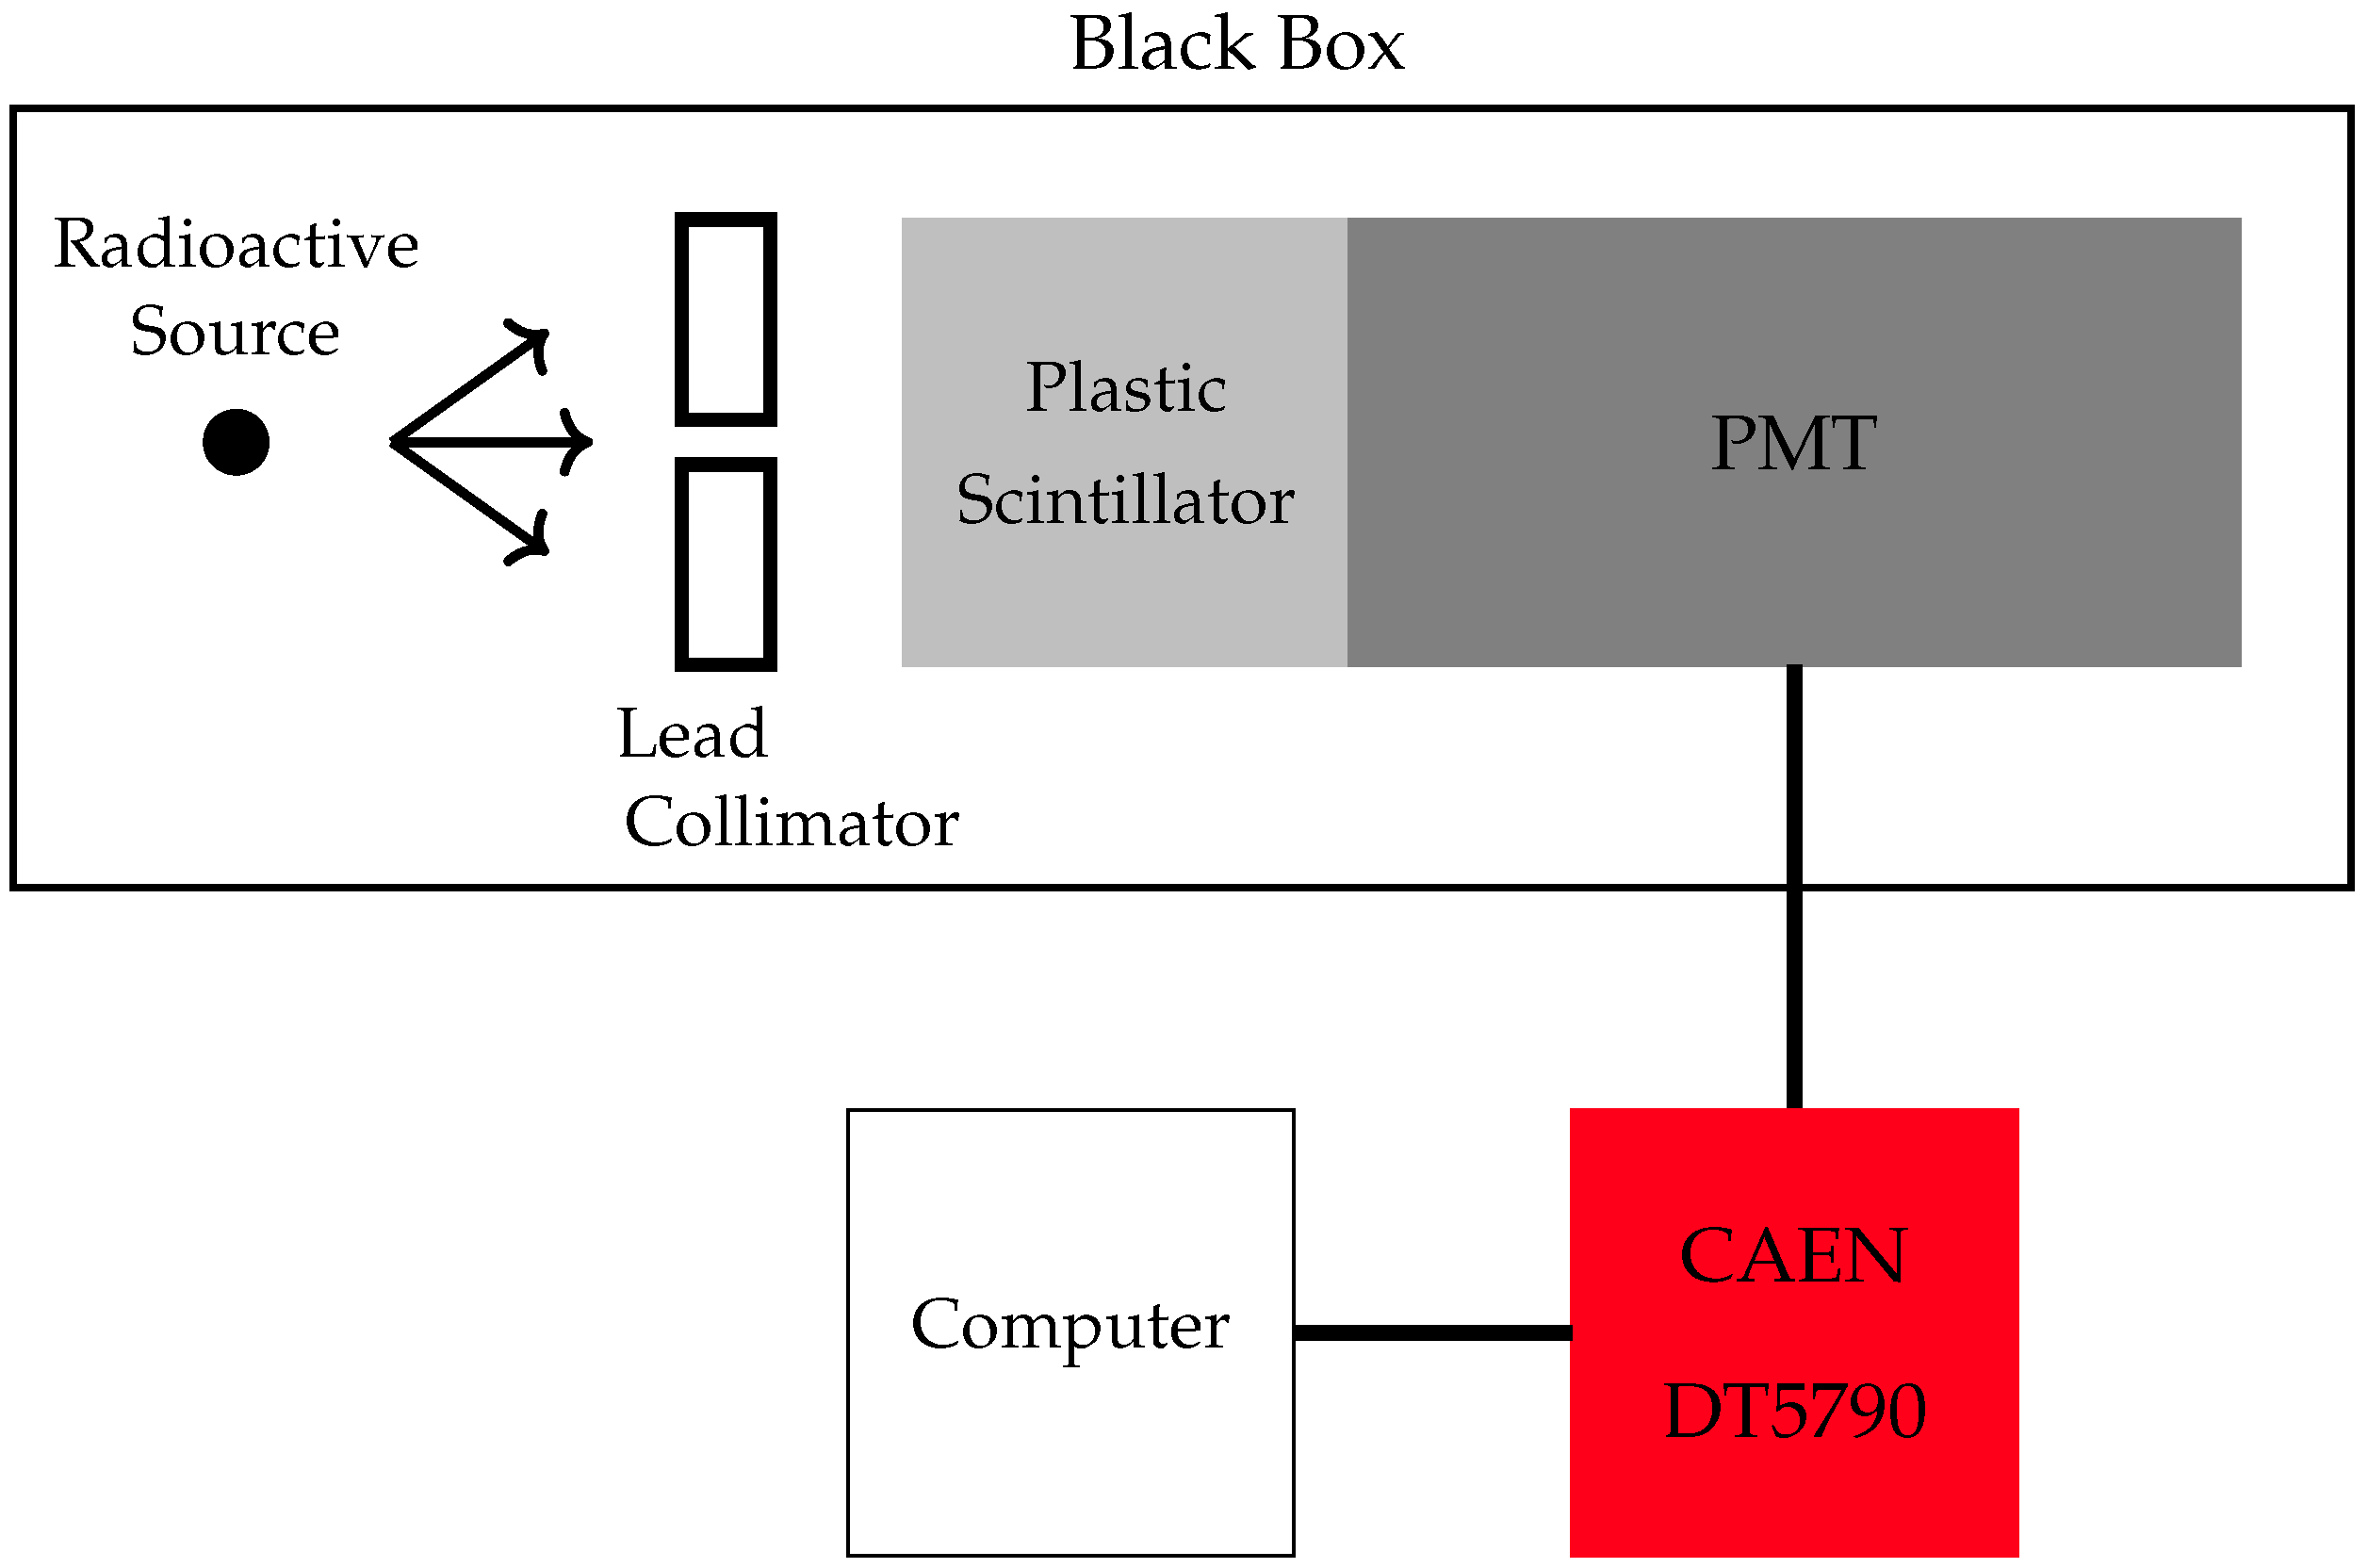
Figure 2 shows the schematic diagram of the experimental setup. The samples are coupled to a Hamamatsu R7525HA-2 PMT (produced by Hamamatsu Photonics, Hamamatsu City, Japan) using Eljen EJ-550 optical silicon grease (produced by Eljen Technology, Sweetwater, TX, USA) [36] and wrapped in aluminum to enhance reflection. The optical silicon grease has a refractive index of 1.46 and a transmission of about 99% for a thickness of 0.1 mm at wavelengths of 430 nm and above. The PMT–plastic scintillator system is placed in a wooden box with a wall thickness of 2 cm. The PMT is connected to a CAEN DT5790 [37] digital acquisition system, which is operated at 1300 V. Each scintillator sample is measured under identical digitizer settings until 1.5 × 10 5 valid events are recorded. The CAEN DT5790 operates at a 250 MS/s sample rate with 12-bit resolution settings.
The four different gamma sources used in this study are presented in Table 1. 22Na exhibits two different gamma lines of energies 511 keV and 1275 keV, with corresponding Compton edge energies of 341 keV and 1062 keV. 137Cs produces a gamma ray of 662 keV energy with a Compton energy of 478 keV. 54Mn emits a gamma ray of energy 835 keV, with a corresponding 640 keV of Compton edge energy. 60Co produces two gamma rays with energies 1173 and 1333 keV. Since the energy values differ only by 155 keV, they cannot be resolved by our detector. The measured spectrum therefore represents the sum of the responses to both gamma lines. The effective Compton edge energy of 60Co is obtained, intensity-weighted, as 1041 keV (gamma ray energies were taken from the NNDC NuDat 3 database [38], and the corresponding Compton edge energies were calculated).
The energy distributions around the Compton edge are fitted with Gaussian functions. In the literature, the suggested position of the Compton edge energy varies between different percentages of the Gaussian peak [39,40]. A previous study [19] evaluated Compton edge values at 50%, 60%, 70%, 80%, and 90% of the Gaussian peak, and the 80% measurement most accurately reflected the average values. In this study, RLY is measured at 80% of the peak value. The fit ranges of the Gaussian function are chosen so that the peak value of the measurement stays within the range and a ± 5 unit shift in both ends results in only a 0.6% difference in the mean RLY values. A detailed description of the Gaussian fit process is presented in Appendix A. The RLY of the prepared plastic scintillator samples is calculated by the described method with the following formula,
R L Y s a m p l e = R L Y B l a n k × C E s a m p l e C E B l a n k
where C E s a m p l e and C E B l a n k are calculated Compton edge values at 80% of the Gaussian peak, R L Y B l a n k is taken as 100, and the RLY of the prepared plastic scintillator samples is calculated based on it.

3. Results

Figure 3 shows the energy distributions and Gaussian fits. The navy blue graph is for the source 22 N a . 22 N a decays by emitting two different gamma rays; therefore it exhibits two different Compton edges. The first one is at 341 keV and the second is at 1062 keV. The green graph is for 137 C s with a Compton edge at 478 keV. The purple graph is 54 M n with a Compton edge at 640 keV. The black graph is for 60 C o with a Compton edge at 1041 keV. Comparisons among Blank, AIBN 0.2%, AIBN 0.5%, and AIBN 1.0% and among Blank, BPO 0.2%, and BPO 0.5% show that as the initiator content increases, the energy graphs exhibit narrower peaks, implying lower energy resolution and low light output.
The obtained RLY values for each energy value are listed in Table 2. AIBN 0.2% exhibits an RLY of 96.1% at the 341 keV Compton edge of 22Na, 96.2% at the 478 keV Compton edge of 137Cs, 96.8% at the 640 keV Compton edge of 54Mn, 96.2% at the 1041 keV Compton edge of 60Co, and 95.8% at the 1062 keV Compton edge of 22Na. Across these energy values, the RLY remains steady, with only a 1.0% variation.
AIBN 0.5% has a minimum RLY of 77.5% at 341 keV and a maximum RLY of 78.5% at 1062 keV, while AIBN 1.0% shows a minimum RLY of 65.2% at 478 keV and a maximum RLY of 66.3% at 1062 keV. BPO 0.2% has a minimum RLY of 92.2% at 478 keV and a maximum RLY of 92.9% at 1062 keV, whereas BPO 0.5% exhibits a minimum RLY of 66.5% at 341 keV and a maximum RLY of 67.6% at 640 keV. The largest difference in RLY for a sample is 1.1%. Overall, the light outputs of the scintillators remain consistent across different energy values, and for each Compton edge, the RLY decreases as the initiator concentration increases.
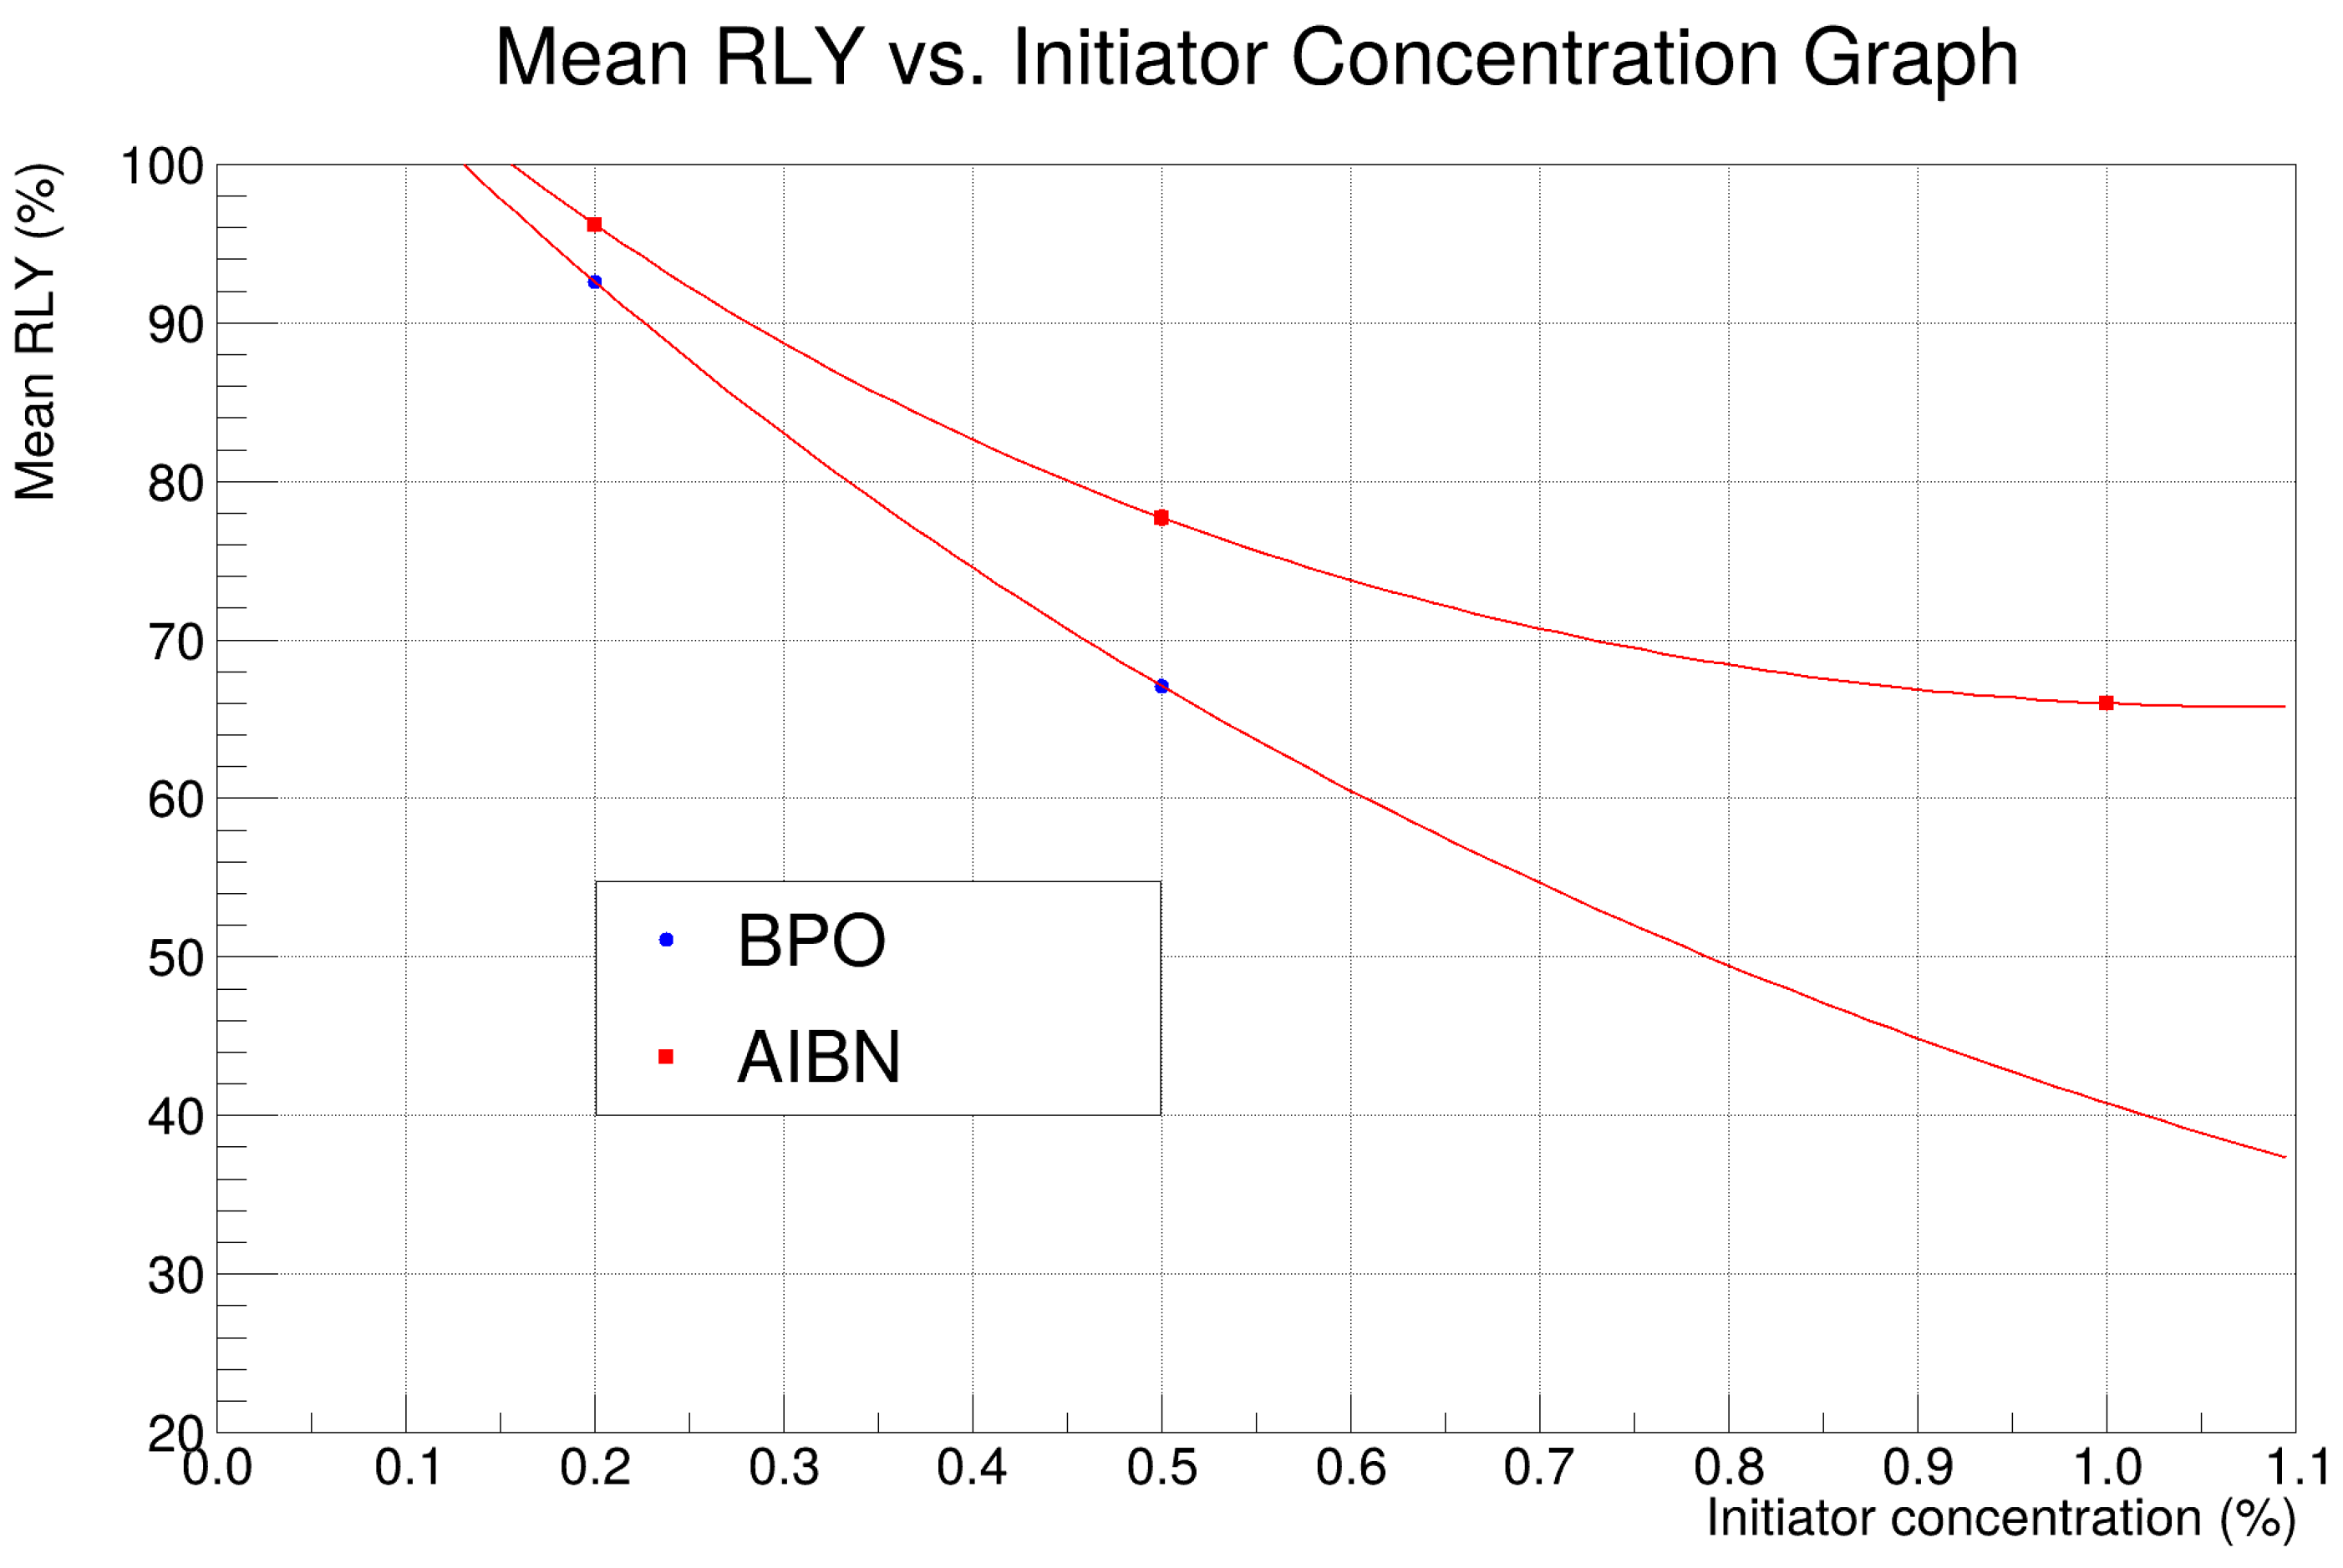
Table 3 presents the average RLY values of different energies for each scintillator, along with RMS errors; a detailed explanation of error propagation is given in Appendix B. AIBN 0.2% exhibits an average RLY of (96.2 ± 0.3)%, AIBN 0.5% exhibits an average RLY of (77.7 ± 0.5)%, and AIBN 1.0% exhibits an average RLY of (66.0 ± 0.4)%. While the decrease in light output for AIBN 0.2% is relatively small (3.8%), AIBN 0.5% shows a decrease of 22.3%, and AIBN 1.0% exhibits a decrease of 34.0%. Losing one third of the attainable light would cause a notable decrease in resolution. BPO 0.2% exhibits an average RLY of (92.6 ± 0.2)% and BPO 0.5% exhibits an average RLY of (67.1 ± 0.4)%. In this case, the use of 0.2% initiator results in a 7.4% decrease in light output, which is greater than the loss observed for AIBN at 0.2%. At 0.5%, the loss in light output is 32.9%, comparable to the loss observed in the 1.0% case of AIBN. Figure 4 illustrates the results in Table 3 and depicts the trend of decrease in mean RLY with increasing initiator concentration.
In Figure 5, each sample is plotted with a different marker shape, illustrating the near-linear relationship between Compton edge energy and measured light output. Notably, the Blank Scintillator (black circles) maintains the highest response at each energy, indicating superior LY relative to doped samples. These findings confirm that, while the detector response remains linear with energy, chemical doping can measurably diminish scintillation performance.

4. Discussion

How different polymerization initiators and concentrations affect the LY of plastic scintillators was systematically examined. By measuring the Compton edges at 80% of each Gaussian peak from several radioactive sources, the consistent reduction in light output due to doping with AIBN or BPO was confirmed. An initiator concentration of approximately 0.2% restricts the decrease in light output to around 8%. However, higher loadings, specifically between 0.5 and 1%, can lead to significant reductions in the range of 20–35%. Despite light output reductions, the detectors maintained a linear response with energy, indicating that polymerization initiator doping does not compromise the basic detection principle.
Polymerization initiators can thus be effectively employed in plastic scintillator production, provided their concentrations remain within acceptable bounds for detector systems in diverse applications, including medical imaging, nuclear reactor monitoring, high-energy physics experiments, and security checkpoint devices. Maintaining initiator concentrations around 0.2% ensures optimal optical performance while benefiting from improved manufacturing efficiency.

Author Contributions

Conceptualization, B.A.; methodology, B.A.; software, B.A. and M.K. and B.A.; validation, B.A.; formal analysis, M.K.; investigation, M.K.; resources, B.A.; data curation, M.K.; writing—original draft preparation, M.K.; writing—review and editing, M.K. and B.A.; visualization, M.K.; supervision, B.A.; project administration, B.A.; funding acquisition, B.A. All authors have read and agreed to the published version of the manuscript.

Funding

This study was supported by a grant from the Directorate of Presidential Strategy and Budget of Türkiye (Grant No.: 2009K120520) and Scientific and Technological Research Council of Turkey (Grant No.: 122F271).

Data Availability Statement

The data presented in this study are available on request from the corresponding author.

Acknowledgments

The authors thank Sertaç Öztürk (İstinye University) for his tremendous support in providing supplies and for welcoming them into his laboratory.

Conflicts of Interest

The authors declare no conflicts of interest.

Abbreviations

The following abbreviations are used in this manuscript:
AIBN2,2-Azobis(2-methylpropionitrile)
BPOBenzoyl peroxide
PSPolystyrene
PVTPolyvinyltoluene
PMTPhotomultiplier Tube
RMSRoot Mean Square
RLYRelative Light Yield
LYLight Yield
PPO2,5-Diphenyloxazole
POPOP1,4-bis(5-phenyl-2-oxazolyl)benzene

Appendix A. Compton Edge Gaussian Fit

The Compton edge in a gamma-ray spectrum refers to the region where photons transfer the maximum possible energy through a Compton scattering event within the detector. As this feature does not appear as a sharp peak but rather a gradual drop, the Compton edge value corresponds to the point where the count rate falls to a certain fraction of the Gaussian peak value [39,40].
When a Gaussian fit is applied to an energy spectrum, the following are considered:
  • The peak value of the Compton edge part of the spectrum remains inside the chosen fit ranges.
  • The fit ranges are chosen such that the χ 2 / n d f value is minimized and a ± 5 shift results only in a maximum of 0.6 % mean RLY change.
  • Once the peak point of the fit is determined, the data point corresponding to 80 % of the peak value is located. Therefore our results are based on raw data, not the fit values.
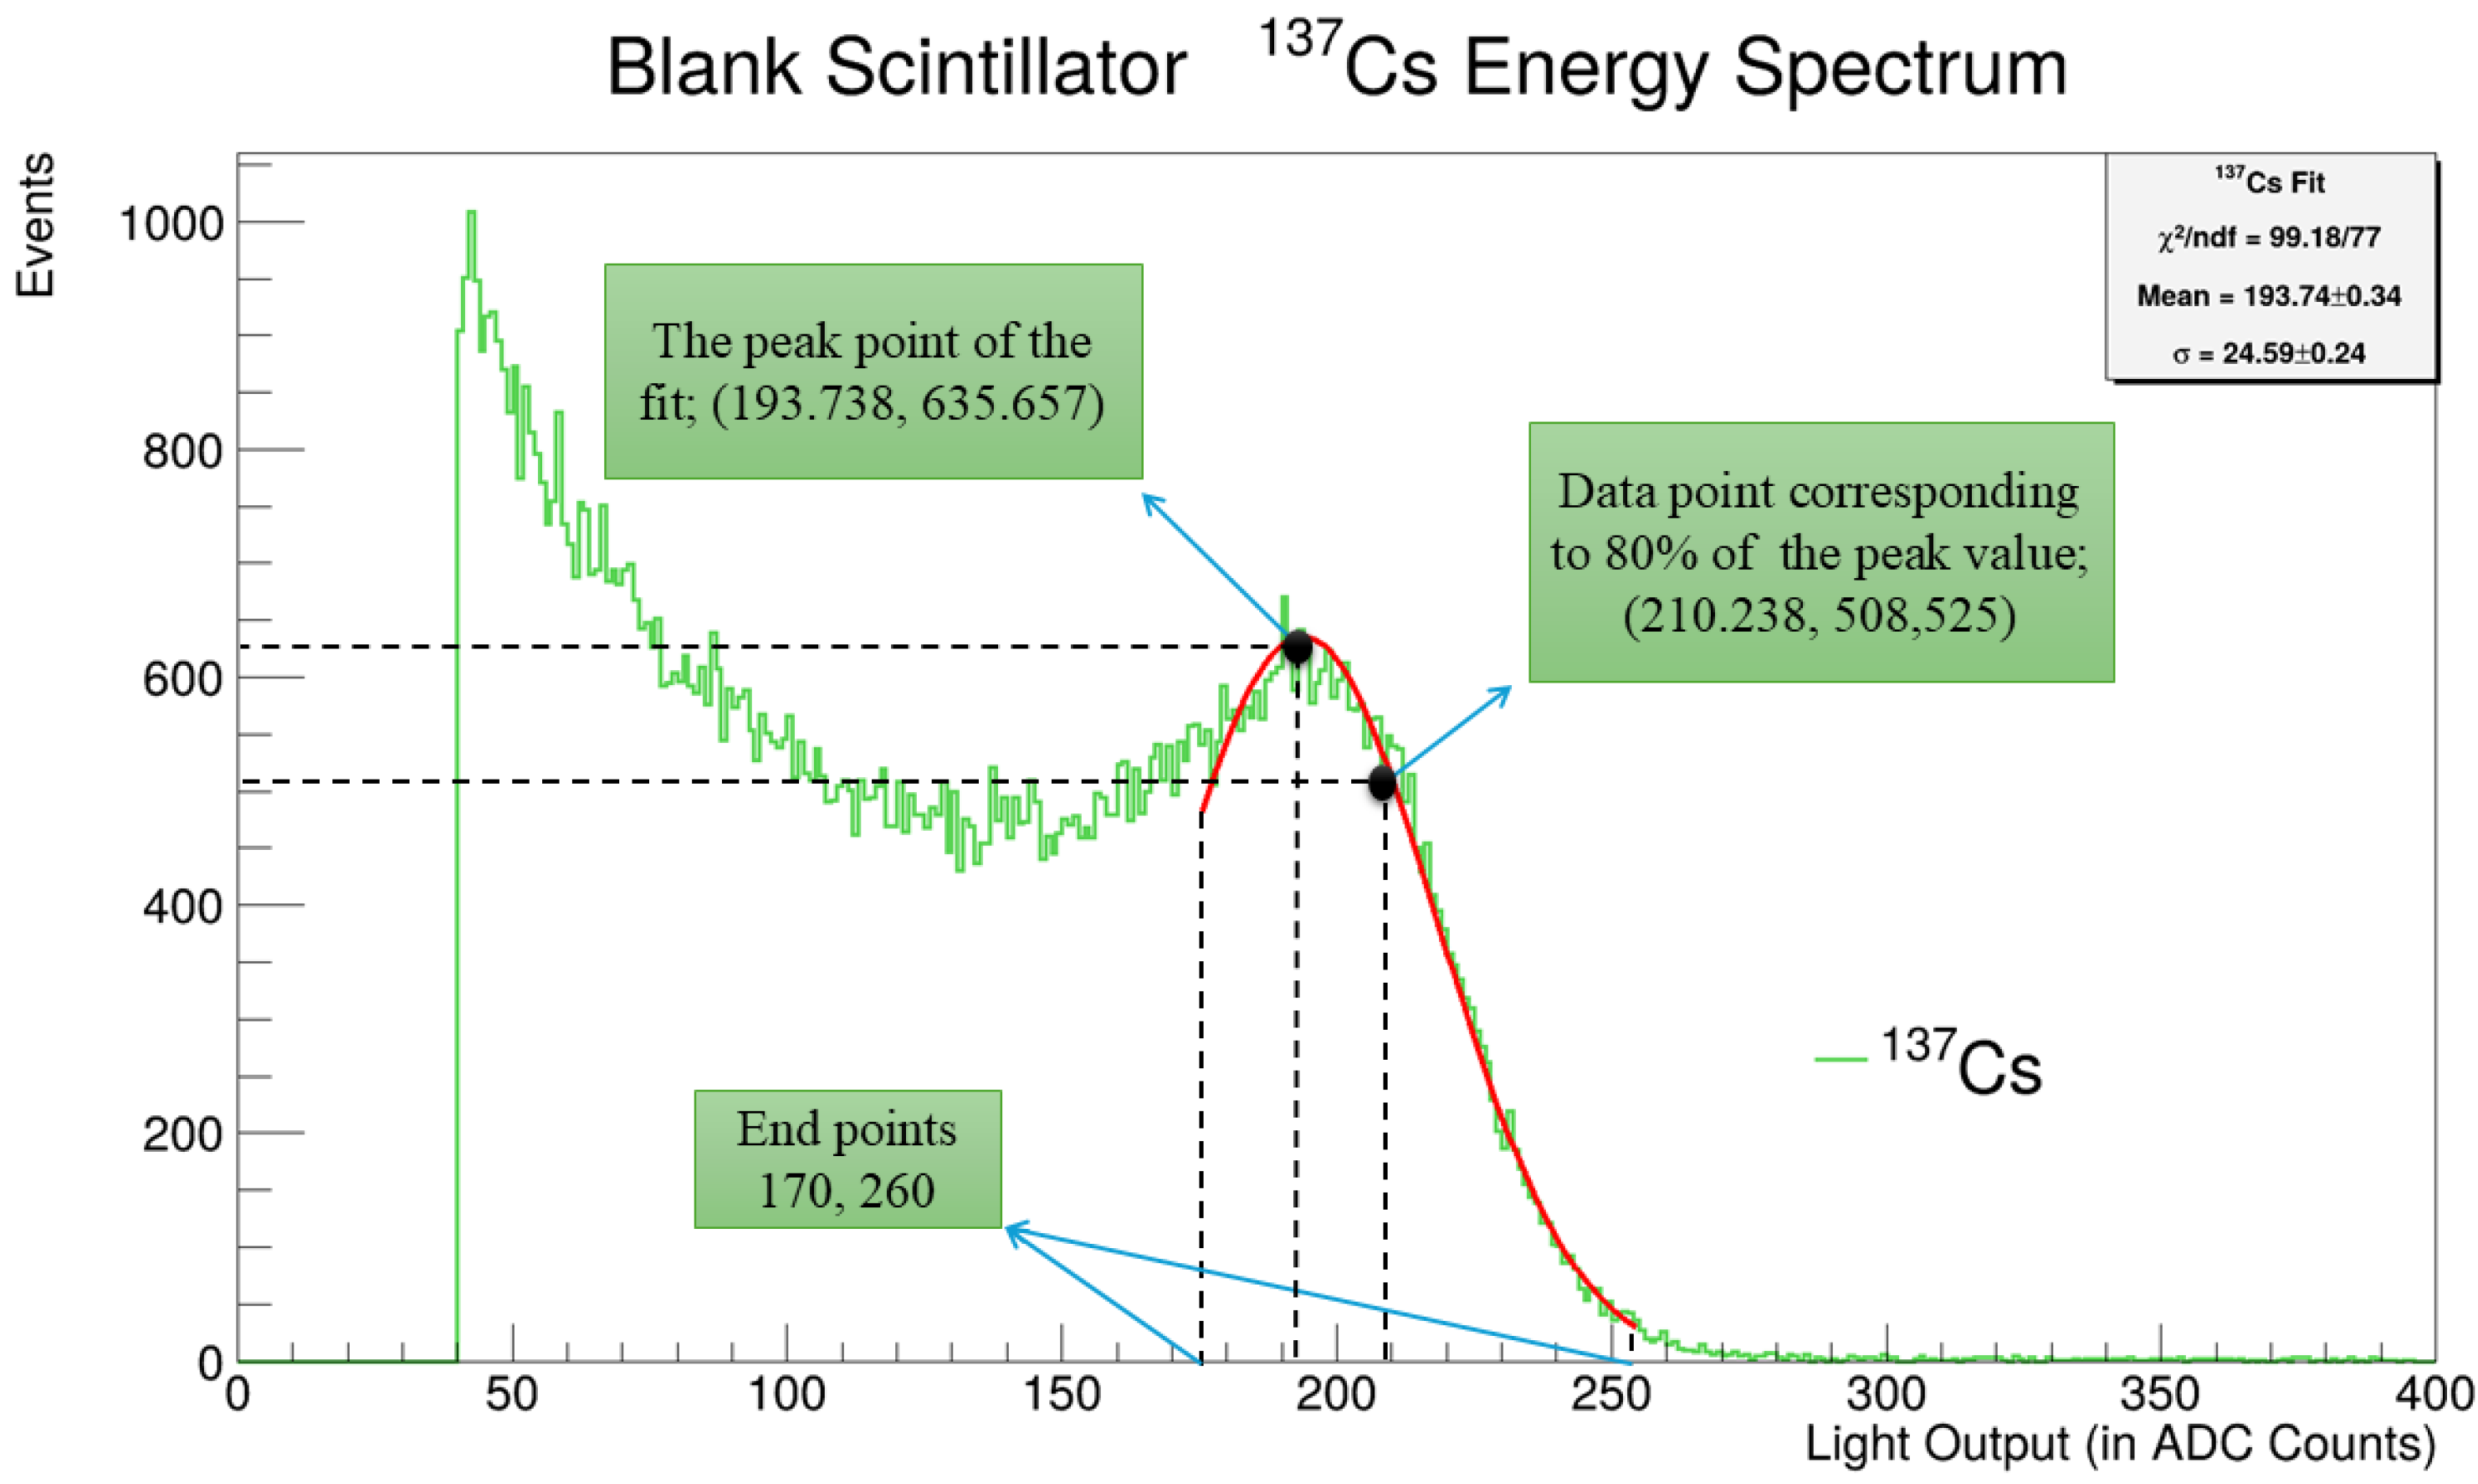
Figure A1. Blank Scintillator, red line indicates the Gaussian fit to Cs-137 Compton edge.
Instruments 09 00019 g0a1

Appendix B. Error Propagation

Table 2 presents RLY values with uncertainties regarding the fitting procedure. As mentioned in Appendix A, the fit values ranges are chosen to minimize the χ 2 / n d f value to obtain the best fit possible. However, considering any slight misallocation of the Compton edge values, the left end points of the samples are shifted by ± 5 units and the uncertainties in RLY are calculated.
Let us denote the relevant Compton edge positions, in ADC Counts, as C E 0 , C E 5 , C E + 5 for the original fit position, left end points shifted by 5 , and left end points shifted by + 5 , respectively. The maximum deviation as a result of these shifts is
σ C E = m a x ( | C E 0 C E 5 | , | C E 0 C E + 5 | ) .
Following Equation (1), the uncertainty in RLY is calculated as
σ R L Y = R L Y s a m p l e × σ C E C E 0 .
The root mean square (RMS) deviation measures the spread of a data set around its average value. It is calculated by taking the differences between each data point and the mean, squaring these differences to avoid cancellation, averaging the squared differences, and finally taking the square root of this average. The mean RLY from measurements at five different energy values for each scintillator were computed. Then, the RMS deviation to quantify the consistency of RLY across these energies was calculated.
The total uncertainties presented in Table 3 are obtained by the root sum of squares of the average RLY and RMS errors,
σ T o t a l = σ R M S 2 + σ a v e r a g e 2 ,
where σ a v e r a g e is calculated by the root sum of squares of σ R L Y values divided by the number of Compton edge values N, in this case N = 5 ,
σ a v e r a g e = σ R L Y 2 N .

References

  1. Beaulieu, L.; Beddar, S. Review of plastic and liquid scintillation dosimetry for photon, electron, and proton therapy. Phys. Med. Biol. 2016, 61, R305. [Google Scholar] [CrossRef] [PubMed]
  2. Beddar, A. Plastic scintillation dosimetry and its application to radiotherapy. Radiat. Meas. 2006, 41, S124–S133. [Google Scholar] [CrossRef]
  3. Ozturk, S. Nuclear reactor monitoring with gadolinium-loaded plastic scintillator modules. Nucl. Instrum. Methods Phys. Res. Sect. A Accel. Spectrometers Detect. Assoc. Equip. 2020, 955, 163314. [Google Scholar] [CrossRef]
  4. Aad, G.; Abajyan, T.; Abbott, B.; Abdallah, J.; Khalek, S.A.; Abdelalim, A.A.; Aben, R.; Abi, B.; Abolins, M.; AbouZeid, O.; et al. Observation of a new particle in the search for the Standard Model Higgs boson with the ATLAS detector at the LHC. Phys. Lett. B 2012, 716, 1–29. [Google Scholar] [CrossRef]
  5. Arnison, G.; Astbury, A.; Aubert, B.; Bacci, C.; Bauer, G.; Bézaguet, A.; Böck, R.; Bowcock, T.; Calvetti, M.; Carroll, T.; et al. Experimental observation of isolated large transverse energy electrons with associated missing energy at s=540 GeV. Phys. Lett. B 1983, 122, 103–116. [Google Scholar] [CrossRef]
  6. Armengaud, E.; Augier, C.; Benoît, A.; Benoît, A.; Bergé, L.; Bergmann, T.; Blümer, J.; Broniatowski, A.; Brudanin, V.; Censier, B.; et al. Background studies for the EDELWEISS dark matter experiment. Astropart. Phys. 2013, 47, 1–9. [Google Scholar] [CrossRef]
  7. Mei, D.M.; Hime, A. Muon-induced background study for underground laboratories. Phys. Rev. D 2006, 73, 053004. [Google Scholar] [CrossRef]
  8. Williamson, J.F.; Dempsey, J.F.; Kirov, A.S.; Monroe, J.I.; Binns, W.R.; Hedtjärn, H. Plastic scintillator response to low-energy photons. Phys. Med. Biol. 1999, 44, 857. [Google Scholar] [CrossRef]
  9. Lee, H.; So, J.; Kang, C.; Kim, G.; Kim, S.; Lee, J.; Lee, M.; Yoon, W.; Kim, Y. Development of a scintillation light detector for a cryogenic rare-event-search experiment. Nucl. Instrum. Methods Phys. Res. Sect. A Accel. Spectrometers Detect. Assoc. Equip. 2015, 784, 508–512. [Google Scholar] [CrossRef]
  10. Qadr, H.M. Comparison of energy resolution and efficiency of NaI (TI) and HPGe detector using gamma-ray spectroscopy. J. Phys. Chem. Funct. Mater. 2020, 3, 24–27. [Google Scholar]
  11. Lo Presti, D.; Russo, G.V.; Leonora, E.; Aiello, S.; Randazzo, N.; Sipala, V.; Longhitano, F. Characterization Technique of Sub-Millimeter Scintillating Fibers. In Proceedings of the 2011 IEEE Nuclear Science Symposium and Medical Imaging Conference (NSS/MIC), Valencia, Spain, 23–29 October 2011; pp. 2104–2108. [Google Scholar] [CrossRef]
  12. CMS Collaboration. The CMS Hadron Calorimeter Project: Technical Design Report; CERN: Geneva, Switzerland, 1997. [Google Scholar]
  13. Si APDs|Hamamatsu Photonics—hamamatsu.com. Available online: https://www.hamamatsu.com/us/en/product/optical-sensors/apd/si-apd.html (accessed on 30 May 2025).
  14. Head-on Type|Hamamatsu Photonics—hamamatsu.com. Available online: https://www.hamamatsu.com/eu/en/product/optical-sensors/pmt/pmt_tube-alone/head-on-type.html (accessed on 30 May 2025).
  15. Mirzoyan, R.; Laatiaoui, M.; Teshima, M. Very high quantum efficiency PMTs with bialkali photo-cathode. Nucl. Instrum. Methods Phys. Res. Sect. A Accel. Spectrometers Detect. Assoc. Equip. 2006, 567, 230–232. [Google Scholar] [CrossRef]
  16. Gektin, A.; Korzhik, M. Inorganic Scintillators for Detector Systems; Springer: Berlin/Heidelberg, Germany, 2017. [Google Scholar]
  17. Zaitseva, N.; Glenn, A.; Carman, L.; Paul Martinez, H.; Hatarik, R.; Klapper, H.; Payne, S. Scintillation properties of solution-grown trans-stilbene single crystals. Nucl. Instrum. Methods Phys. Res. Sect. A Accel. Spectrometers Detect. Assoc. Equip. 2015, 789, 8–15. [Google Scholar] [CrossRef]
  18. Jana, A.; Cho, S.; Patil, S.A.; Meena, A.; Jo, Y.; Sree, V.G.; Park, Y.; Kim, H.; Im, H.; Taylor, R.A. Perovskite: Scintillators, direct detectors, and X-ray imagers. Mater. Today 2022, 55, 110–136. [Google Scholar] [CrossRef]
  19. Akgün, B.; Öztürk, S.; Nurdan, K.; Özcan, V.E.; Ünel, N.G.; Kolbaşı, A.; Elibollar, E.; Ünal, A.; Kandemir, M.; Şahin, Y.; et al. Characterization of plastic scintillator samples produced by a university-SME Collaboration. Phys. Scr. 2024, 99, 055302. [Google Scholar] [CrossRef]
  20. Brown, J.; Laplace, T.; Goldblum, B.; Manfredi, J.; Johnson, T.; Moretti, F.; Venkatraman, A. Absolute light yield of the EJ-204 plastic scintillator. Nucl. Instrum. Methods Phys. Res. Sect. A Accel. Spectrometers Detect. Assoc. Equip. 2023, 1054, 168397. [Google Scholar] [CrossRef]
  21. Holl, I.; Lorenz, E.; Mageras, G. A measurement of the light yield of common inorganic scintillators. IEEE Trans. Nucl. Sci. 1988, 35, 105–109. [Google Scholar] [CrossRef]
  22. Hajagos, T.J.; Liu, C.; Cherepy, N.J.; Pei, Q. High-Z sensitized plastic scintillators: A review. Adv. Mater. 2018, 30, 1706956. [Google Scholar] [CrossRef]
  23. Odian, G. Principles of Polymerization; John Wiley & Sons: Hoboken, NJ, USA, 2004. [Google Scholar]
  24. Plastic Scintillators, 2021st ed.; Hamel, M., Ed.; Topics in Applied Physics; Springer Nature: Cham, Switzerland, 2021. [Google Scholar]
  25. Clark, G.W.; Scherb, F.; Smith, W.B. Preparation of Large Plastic Scintillators. Rev. Sci. Instrum. 1957, 28, 433–437. [Google Scholar] [CrossRef]
  26. Tam, A.K.; Boyraz, O.; Unangst, J.; Nazareta, P.; Schreuder, M.; Nilsson, M. Quantum-dot doped polymeric scintillation material for radiation detection. Radiat. Meas. 2018, 111, 27–34. [Google Scholar] [CrossRef]
  27. Sahi, S.; Chen, W.; Jiang, K. Luminescence enhancement of PPO/PVT scintillators by CeF3 nanoparticles. J. Lumin. 2015, 159, 105–109. [Google Scholar] [CrossRef]
  28. Gosau, J.M.; Harrah, L.A.; Hoyt, A.E. Polysilylene copolymers for ultrafast scintillator applications. 2. Thin film formulations. Radiat. Phys. Chem. 2001, 62, 127–132. [Google Scholar] [CrossRef]
  29. Debnath, C.; Kar, S.; Agrawal, A.K.; Shukla, M.; Verma, S. Development of Trans-Stilbene/PMMA Polymer Composites and Their Optical Characterization for Scintillation-Based Imaging and Detector Applications. IEEE Trans. Nucl. Sci. 2024, 71, 2432–2441. [Google Scholar] [CrossRef]
  30. Serraïma-López, D.; Guillén, M.; Bagán, H.; Tarancón, A. Scintillation and structural properties of copolymers and mixtures of styrene, 9-vinylcarbazole and 4-vinylbenzyl chloride based plastic scintillators. Appl. Radiat. Isot. 2024, 211, 111409. [Google Scholar] [CrossRef] [PubMed]
  31. Almog, Y.; Levy, M. Effect of inititiator on the molecular weight distribution in dispersion polymerization of styrene. J. Polym. Sci. Polym. Chem. Ed. 1980, 18, 1–11. [Google Scholar] [CrossRef]
  32. Meltzer, T.H.; Tobolsky, A.V. Kinetics of Polymerization of Styrene Initiated by the System Benzoyl-Peroxide-Dimethylaniline. J. Am. Chem. Soc. 1954, 76, 5178–5180. [Google Scholar] [CrossRef]
  33. Mahl, A.; Lim, A.; Latta, J.; Yemam, H.A.; Greife, U.; Sellinger, A. Methacrylate based cross-linkers for improved thermomechanical properties and retention of radiation detection response in plastic scintillators. Nucl. Instrum. Methods Phys. Res. Sect. A Accel. Spectrometers Detect. Assoc. Equip. 2018, 884, 113–118. [Google Scholar] [CrossRef]
  34. Bedrik, A.I.; Velmozhnaya, E.S.; Zhmurin, P.N.; Lebedev, V.N.; Titskaya, V.D. Properties of polystyrene-based scintillator with gadolinium phenylbutanate. Inorg. Mater. Appl. Res. 2014, 5, 399–402. [Google Scholar] [CrossRef]
  35. Li, W.; Tao, M.; Li, Y.; Shi, J.; Wu, H.; Wang, J.; Wang, Z.; Ren, G.; Wu, Y. NaI:Tl,6Li-PVT composite scintillator toward neutron and gamma discrimination. Radiat. Meas. 2022, 159, 106882. [Google Scholar] [CrossRef]
  36. User, S. EJ-550, EJ-552-Silicone Grease-Eljen Technology—eljentechnology.com. 2025. Available online: https://eljentechnology.com/products/accessories/ej-550-ej-552 (accessed on 28 February 2025).
  37. DT5790—caen.it. 2025. Available online: https://www.caen.it/products/dt5790/ (accessed on 14 March 2025).
  38. National Nuclear Data Center. NuDat 3 Database. 2025. Available online: https://www.nndc.bnl.gov/nudat3/ (accessed on 4 May 2025).
  39. Safari, M.J.; Davani, F.A.; Afarideh, H. Differentiation method for localization of Compton edge in organic scintillation detectors. arXiv 2016, arXiv:1610.09185. [Google Scholar] [CrossRef]
  40. Frangville, C.; Grabowski, A.; Dumazert, J.; Montbarbon, E.; Lynde, C.; Coulon, R.; Venerosy, A.; Bertrand, G.H.; Hamel, M. Nanoparticles-loaded plastic scintillators for fast/thermal neutrons/gamma discrimination: Simulation and results. Nucl. Instrum. Methods Phys. Res. Sect. A Accel. Spectrometers Detect. Assoc. Equip. 2019, 942, 162370. [Google Scholar] [CrossRef]
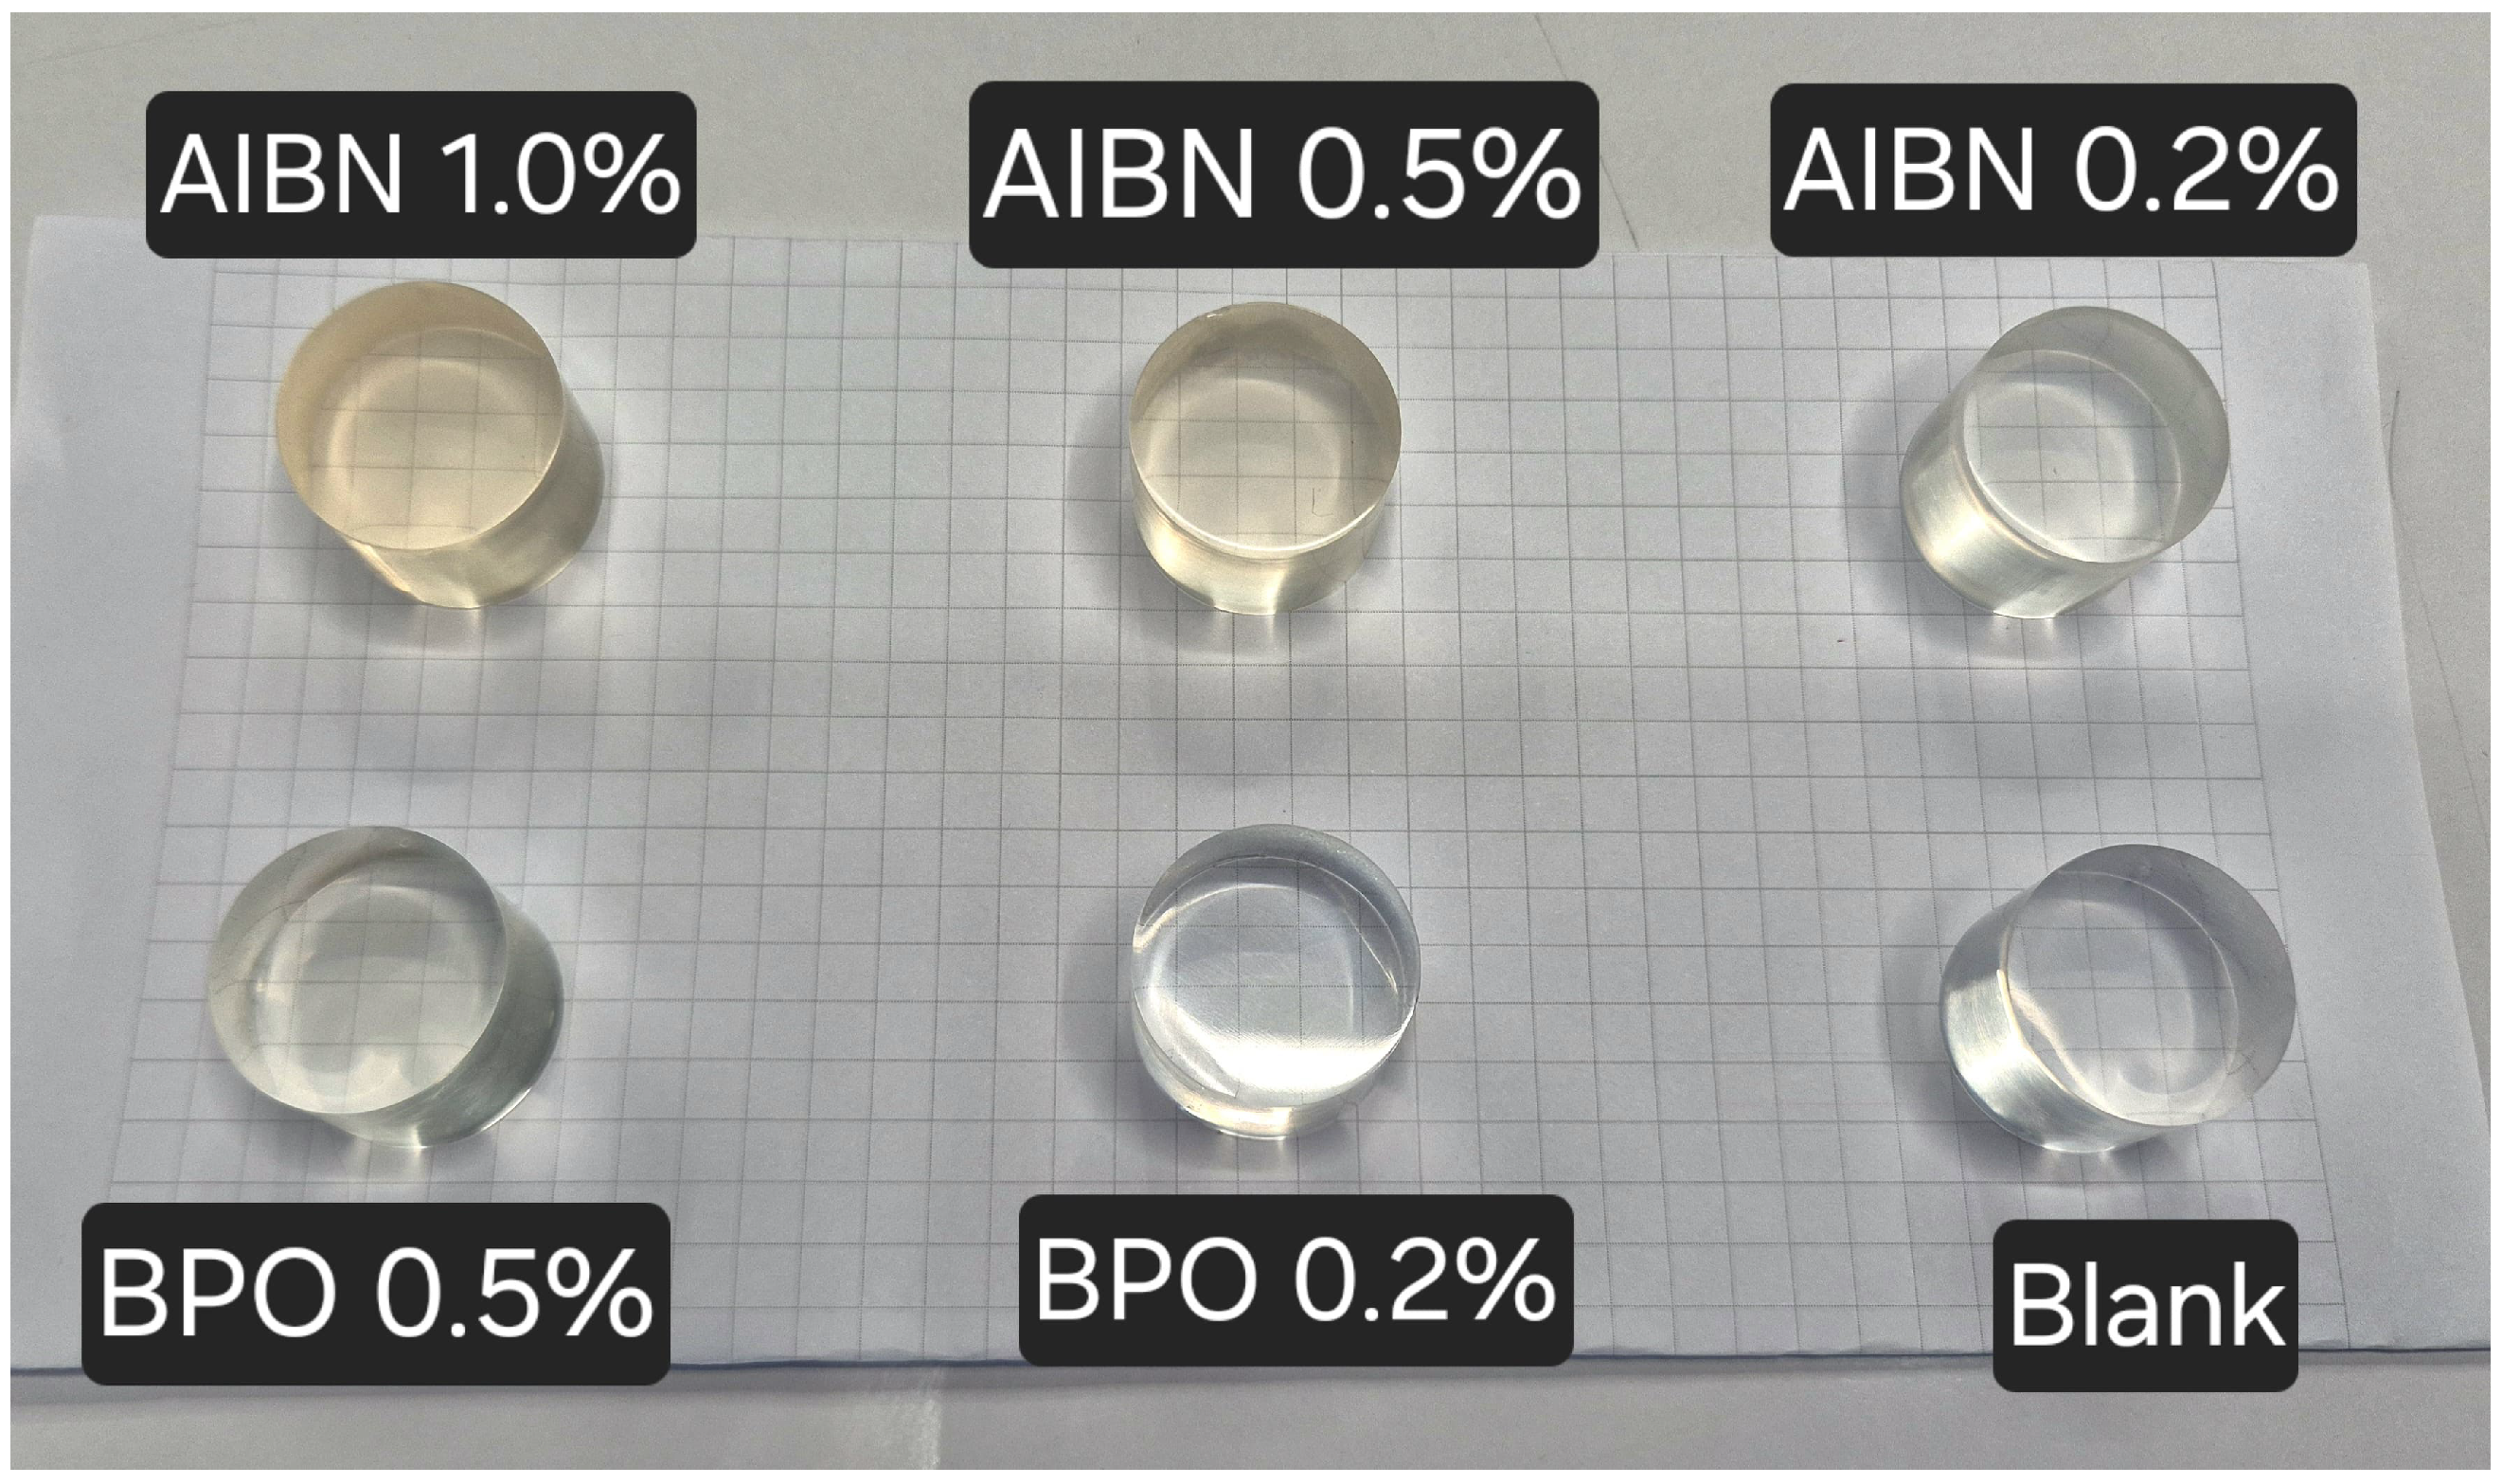
Figure 1. The synthesized plastic scintillator samples.
Instruments 09 00019 g001
Figure 2. Schematic diagram of the experimental setup.
Instruments 09 00019 g002
Figure 3. Energy distributions of the prepared samples with applied Gaussian fits (red lines): (a) Blank, (b) AIBN 0.2%, (c) AIBN 0.5%, (d) AIBN 1.0%, (e) BPO 0.2%, and (f) BPO 0.5%.
Instruments 09 00019 g003
Figure 4. Illustration of the results in Table 3.
Instruments 09 00019 g004
Figure 5. Response of the scintillator samples. Red lines indicate the linear fits for each sample.
Instruments 09 00019 g005
Table 1. Radioactive sources used in this study with the gamma and Compton edge energy values.
Radioactive SourceGamma Ray Energy (keV)The Compton Edge Energy (keV)
22 N a 511 and 1275341 and 1062
137 C s 662478
54 M n 835640
60 C o 1174 and 13331041
Table 2. Point-by-point RLY values, in %, at each Compton edge energy. All values are with respect to the Blank Scintillator.
Scintillator22Na @ 341 keV [%]137Cs @ 478 keV [%]54Mn @ 640 keV [%]60Co @ 1041 keV [%]22Na @ 1062 keV [%]
Blank100.0 ± 0.0100.0 ± 0.0100.0 ± 0.0100.0 ± 0.0100.0 ± 0.0
AIBN 0.2%96.1 ± 0.596.2 ± 0.696.8 ± 0.496.2 ± 0.295.8 ± 0.1
AIBN 0.5%77.5 ± 0.476.9 ± 0.578.0 ± 0.377.5 ± 0.378.5 ± 0.2
AIBN 1.0%65.9 ± 0.565.2 ± 0.366.2 ± 0.366.2 ± 0.366.3 ± 0.3
BPO 0.2%92.4 ± 0.692.2 ± 0.392.7 ± 0.392.7 ± 0.192.9 ± 0.2
BPO 0.5%66.5 ± 0.366.6 ± 0.567.6 ± 0.367.3 ± 0.267.5 ± 0.4
Table 3. Average RLY with errors, all measured relative to Blank Scintillator.
ScintillatorMean RLY [%]RLY Error [%]
Blank100.000.0
AIBN 0.2%96.20.4
AIBN 0.5%77.70.5
AIBN 1.0%66.00.4
BPO 0.2%92.60.3
BPO 0.5%67.10.5
Disclaimer/Publisher’s Note: The statements, opinions and data contained in all publications are solely those of the individual author(s) and contributor(s) and not of MDPI and/or the editor(s). MDPI and/or the editor(s) disclaim responsibility for any injury to people or property resulting from any ideas, methods, instructions or products referred to in the content.