Review

Faraday Cups: Principles, Designs, and Applications Across Scientific Disciplines—A Review

by
Bharat Singh Rawat
1,2,†,
Narender Kumar
1,2,*,†,
Debdeep Ghosal
1,2,†,
Daliya Aflyatunova
1,2,†,
Benjamin Rienäcker
1,† and
Carsten. P. Welsch
1,2,†
1
Department of Physics, University of Liverpool, Liverpool L69 7ZE, UK
2
Cockcroft Institute, Sci-Tech Daresbury, Daresbury, Warrington WA4 4AD, UK
*
Author to whom correspondence should be addressed.
These authors contributed equally to this work.
Instruments 2025, 9(3), 20; https://doi.org/10.3390/instruments9030020
Submission received: 30 June 2025 / Revised: 19 August 2025 / Accepted: 20 August 2025 / Published: 28 August 2025

Abstract

Beam diagnostics are essential tools for monitoring the performance of charged particle beams and the safe operation of particle accelerators. The performance of an accelerator is determined by evaluating the properties of beam particles, such as energy, charge, spatial, and temporal density distributions, which require very specific instruments. Faraday Cups (FCs) have emerged as important beam diagnostic devices because of their ability to accurately measure the beam charge and, in some cases, the charge distribution, which can be subsequently used to reconstruct transverse beam profiles. This paper aims to provide a detailed review of FCs, their principles, and their design challenges. FCs have applications in various scientific disciplines that include the measurement of beam current/intensity in particle accelerators, in addition to those for mass spectrometry, beam profiles/total beam currents for broad ion beams, thermonuclear fusion, and antimatter experiments. This review also covers and discusses the versatility of FCs in various scientific disciplines, along with showcasing the technological advancements that include improved collector materials, novel designs, enhanced measurement techniques, and developments in electronics and data acquisition (D.A.Q). A summary of the challenges faced while working with the FCs, such as sensitivity, calibration, and potential errors, is included in this review.

1. Introduction

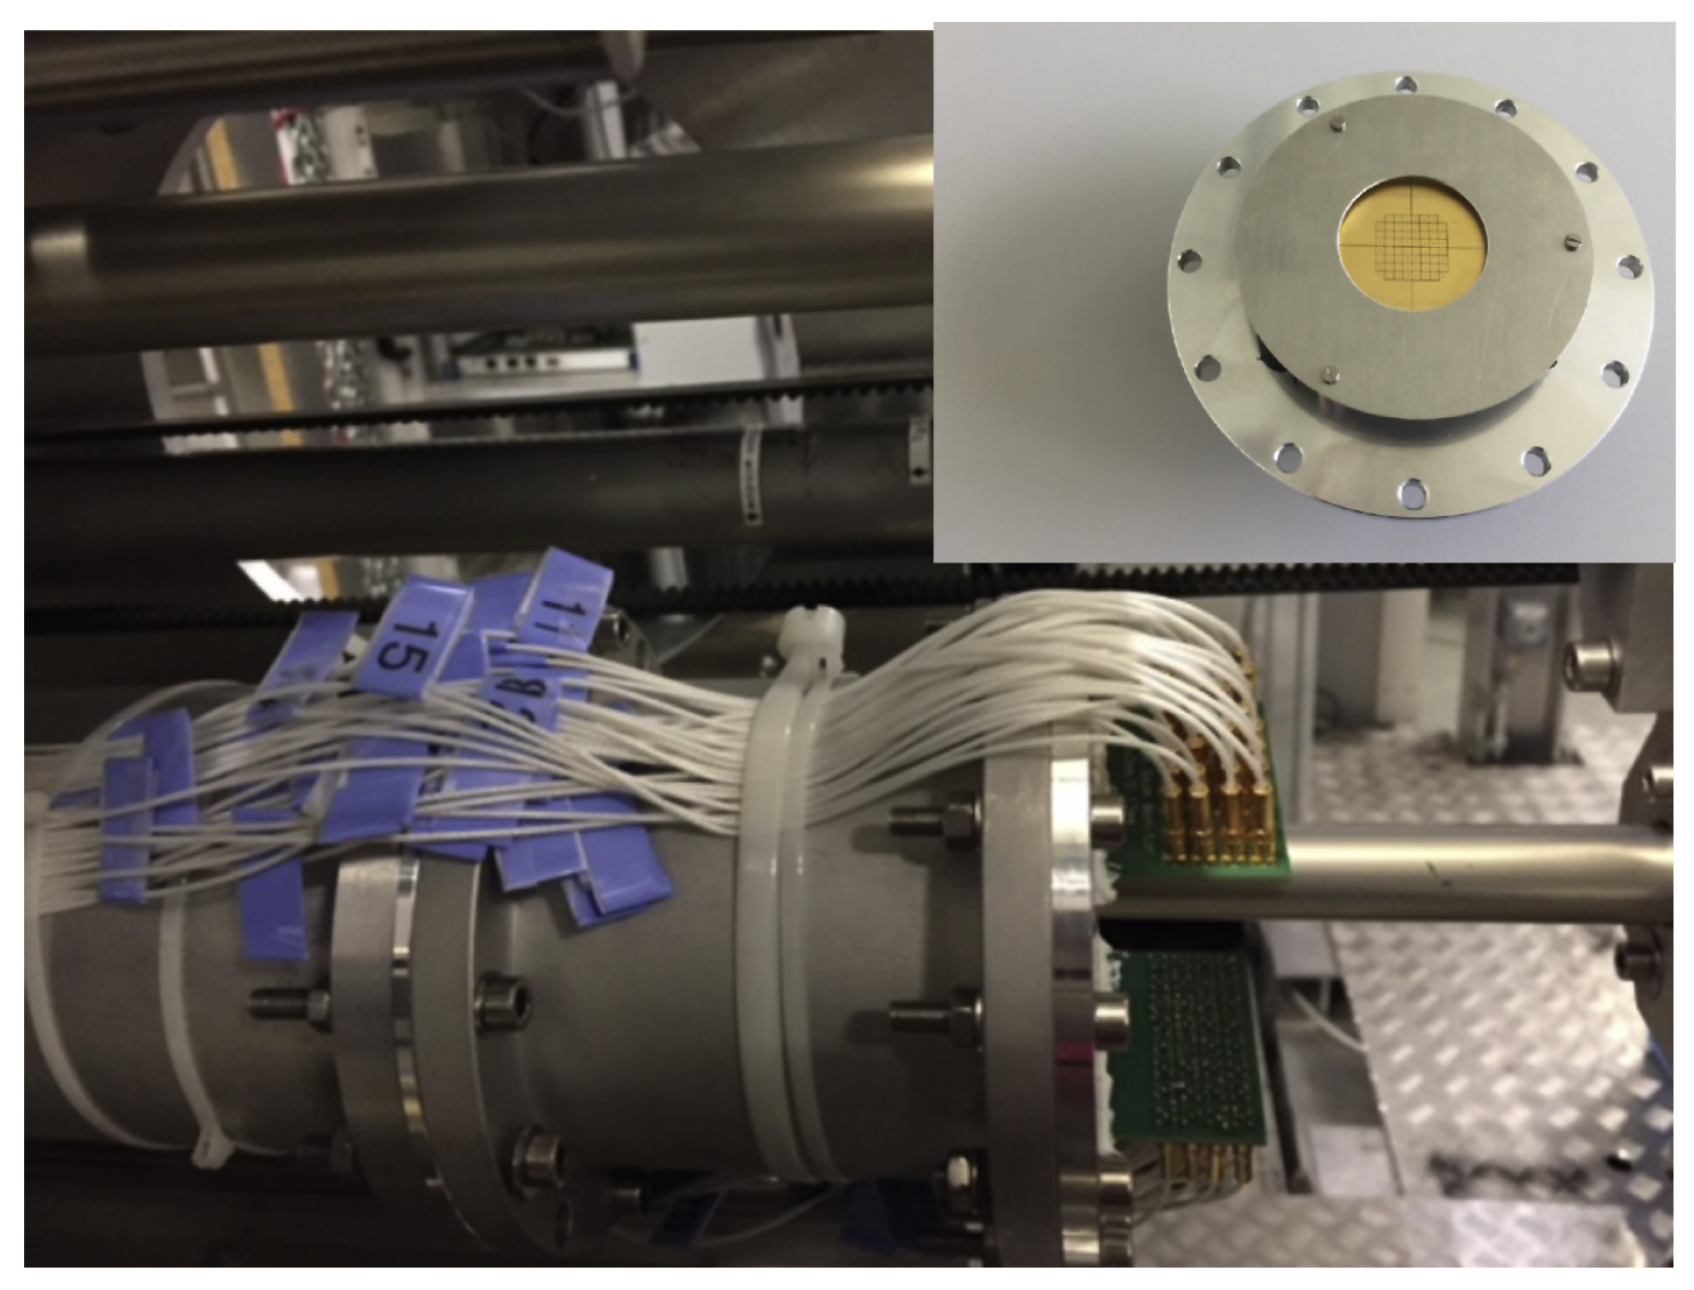
Faraday Cups (FCs) are essential beam diagnostic tools for measuring the beam current and intensity of a charged particle beam. Their earliest appearance in the literature dates to the early 1900s, where they were used in electrometer tubes to measure sub nA currents [1,2]. Since then, FCs have found applications in various fields: as a beam current measuring diagnostic, as shown in Figure 1; in particle accelerators [3,4,5,6,7,8,9,10,11], where they measure the particle flux/current of accelerating beams; in medical applications [12,13,14,15,16] for monitoring the dose delivered to a patient; in mass spectrometry [17,18,19,20] to serve as a collector of particles with different masses which are filtered by magnetic field; for antimatter beams to estimate the number of antimatter particles in different trap configurations [21]; in electric propulsion [22,23,24,25,26], where a single or an array of FCs can be used to measure the ion beam profile of a beam extracted from the thruster plasma chamber; in fusion applications [27,28,29,30] to estimate the flux of neutral beams [31]; finally, in material science applications [32,33,34] to estimate beam fluence on a target surface. The popularity of FCs as beam diagnostic tools for measuring the beam intensity/current compared to other devices is mainly due to their simplistic working principles. However, the design of each FC is highly specific to its intended application, requiring careful consideration of different parameters. These include material selection, amount of current/power to be measured, FC dimensions (aspect ratio), techniques to suppress secondary electron emission, backscattering of incident particles, cooling requirements, acquisition time, operation inside or outside the vacuum chamber, and many more.
This paper is structured in different sections, where Section 2 describes the operating principle of FCs, and in Section 3, an extensive examination of different considerations of the FC design is presented. Section 4 explores the signal processing and data acquisition techniques associated with applications of FCs. Section 5, Section 6, Section 7 and Section 8 explore different FC designs for areas such as antimatter research, mass spectrometry, electric propulsion, and thermonuclear fusion. Section 9 describes applications in high-energy and particle physics, followed by Section 10, which discusses the application of FCs in medical accelerators. Section 11 provides a brief comparison of FCs with other beam diagnostic tools. Finally, Section 12 summarizes the review and offers concluding remarks on future prospects and challenges related to FC designs.

2. Operating Principle

Faraday Cups consist of an electrically isolated conductive plate/cup which is used to measure the influx of charged particles, either emitted from a source (e.g., electrons emitted and accelerated from a filament) or present in the operating environment (e.g., plasma ions formed in the vacuum chamber of an ion thruster plume). When a charged particle hits the FC surface, the current/charge is detected using a current/charge measuring device such as an ammeter, which is typically referenced to the ground. For a single charge D.C. (direct current) particle beam, the total number of charged particles hitting the cup can be determined using Equation (1).
N = I t e
where N is the total number of charged particles collected in time t, I is the measured current, and e is the elementary charge.
Usually, in most applications, the energy of the incoming particles is high enough, compared to the work function of the FC material, to cause the emission of secondary electrons from its surface. Secondary electrons are emitted in both forward and backward directions with respect to the primary beam, but losses are mainly associated with those emitted backward because they can escape the surface. In contrast, forward-emitted secondary electrons generally stay within the FC, assuming that the incoming beam is completely absorbed. The escaping backward-emitted secondary electrons cause a change in the surface charge and therefore lead to an error in the estimate of the deposited charge. To suppress emitted electrons, suppressor electrodes with a negative bias are placed in front of the FC. The geometry of the FC system and the number of electrodes and their applied potential depend on the particular design and constraints.
Secondary electrons escaping due to the impact of negatively charged particle beams lead to underestimated beam currents, whereas those escaping from the impact of positively charged particle beams cause overestimation in the measured current. In Figure 2a, the schematic depicts a positively charged ion beam (red trajectories) with a +5e charge moving toward the FC when no potential is applied to the suppressor electrode. If a charge of −3e is lost from the FC surface in the form of secondary electrons (blue trajectories) due to the interaction between the ion beam and the FC material, the net charge left on the FC surface is +8e, resulting in an overestimation error. Figure 2b illustrates an FC modeled in CST studio, with a suppressor electrode (circular ring) near its entrance. The dimensions of the FC and the suppressor electrode are chosen quite arbitrarily, as the schematic is intended solely for explanatory purposes. Biasing the suppressor electrode negatively with respect to the FC creates an electric field that repels the backward-emitted secondary electrons back to the FC surface and prevents the escape of charge. However, the potential along the axis of a circular electrode gradually decreases toward its central axis; hence, the potential applied to the electrode needs to be slightly greater than the maximum energy of the electron that needs to be suppressed.
Secondary electrons with higher energies can more easily escape through the electrostatic barrier. The value of the axial potential depends on the dimensions and shape of the electrode, which will be discussed later in this paper with different examples. Another important factor driving the design of the FC is the total incident power of the incoming particle beam, and the exposure time. Depending on the dissipated power, cooling of the FC may be necessary; however, the only methods of cooling available in a good vacuum environment are radiative and contact cooling. The temperature of the FC can be efficiently maintained by contact cooling using a liquid coolant for high power beams. The dominant measurement errors in FC, apart from the secondary electron emissions, include [35]:
  • Leakage currents from the suppressor electrode: If the isolation between the FC and the suppressor electrode is poor, it may create a conducting path [36]. This can be improved by using high purity insulating bushes and isolators (such as Alumina, Teflon, Polyetheretherketone (PEEK), Garolite (G-10), etc.).
  • Leakage currents from coolant: Even when using low-conductivity deionized water, tiny leakage currents can occur [37]. Using amplifiers with gains much larger than 1 can reduce this kind of error to values below 1% for a 100 M Ω resistor in the feedback circuit [38].
  • Charged particles from residual gas: This is typical for broad beam ion sources operating at higher background pressures [24]. Here, the chances of trapped gas remnants inside the FC cavity are quite high. The incoming particle can ionize the gas within the FC cavity and lead to a falsification of the measured signal due to the collection of these low-energy ions. A good background vacuum can minimize this effect; however, some errors due to background ionization may prevail in the measurements. The geometric design of the FC should be optimized to reduce the ionization and trapping of the residual gas inside its cavity.
  • Thermal emission of electrons from the heated surface: In very rare cases (for, e.g., high power beams [37] or lasers [39]), the temperature of the FC material can exceed the limit for thermionic emission of the electrons, which can be avoided using a coolant to maintain the surface temperatures below the thermionic limits.
Table 1 shows some commonly used materials for FCs with their properties, illustrating their advantages and disadvantages, respectively.

3. FC Design Considerations

3.1. Sputtering of the FC Material
The FC is a destructive device, it measures the beam current by intercepting and completely absorbing incoming beam particles. In some cases, if the beam is of very high energy (above a threshold ϵ t h r = 20–50 V ) [40], some material from the FC surface is also removed (ejected) by the sputtering process [41]. Over time, this sputtering effect causes FC degradation, alters surface properties, and affects measurement accuracy. The sputtering depends on the energy and angle of the incident particles as well as on the target material. Thus, the designer must choose the appropriate material depending on the intended beam intensity and type. The sputtered material can get deposited on electrically insulating surfaces, potentially causing current leaks (due to the deterioration of the insulating material by sputtering or high temperatures) and errors in beam current measurements. In such cases, ceramic insulators can be shielded to avoid leakage currents.
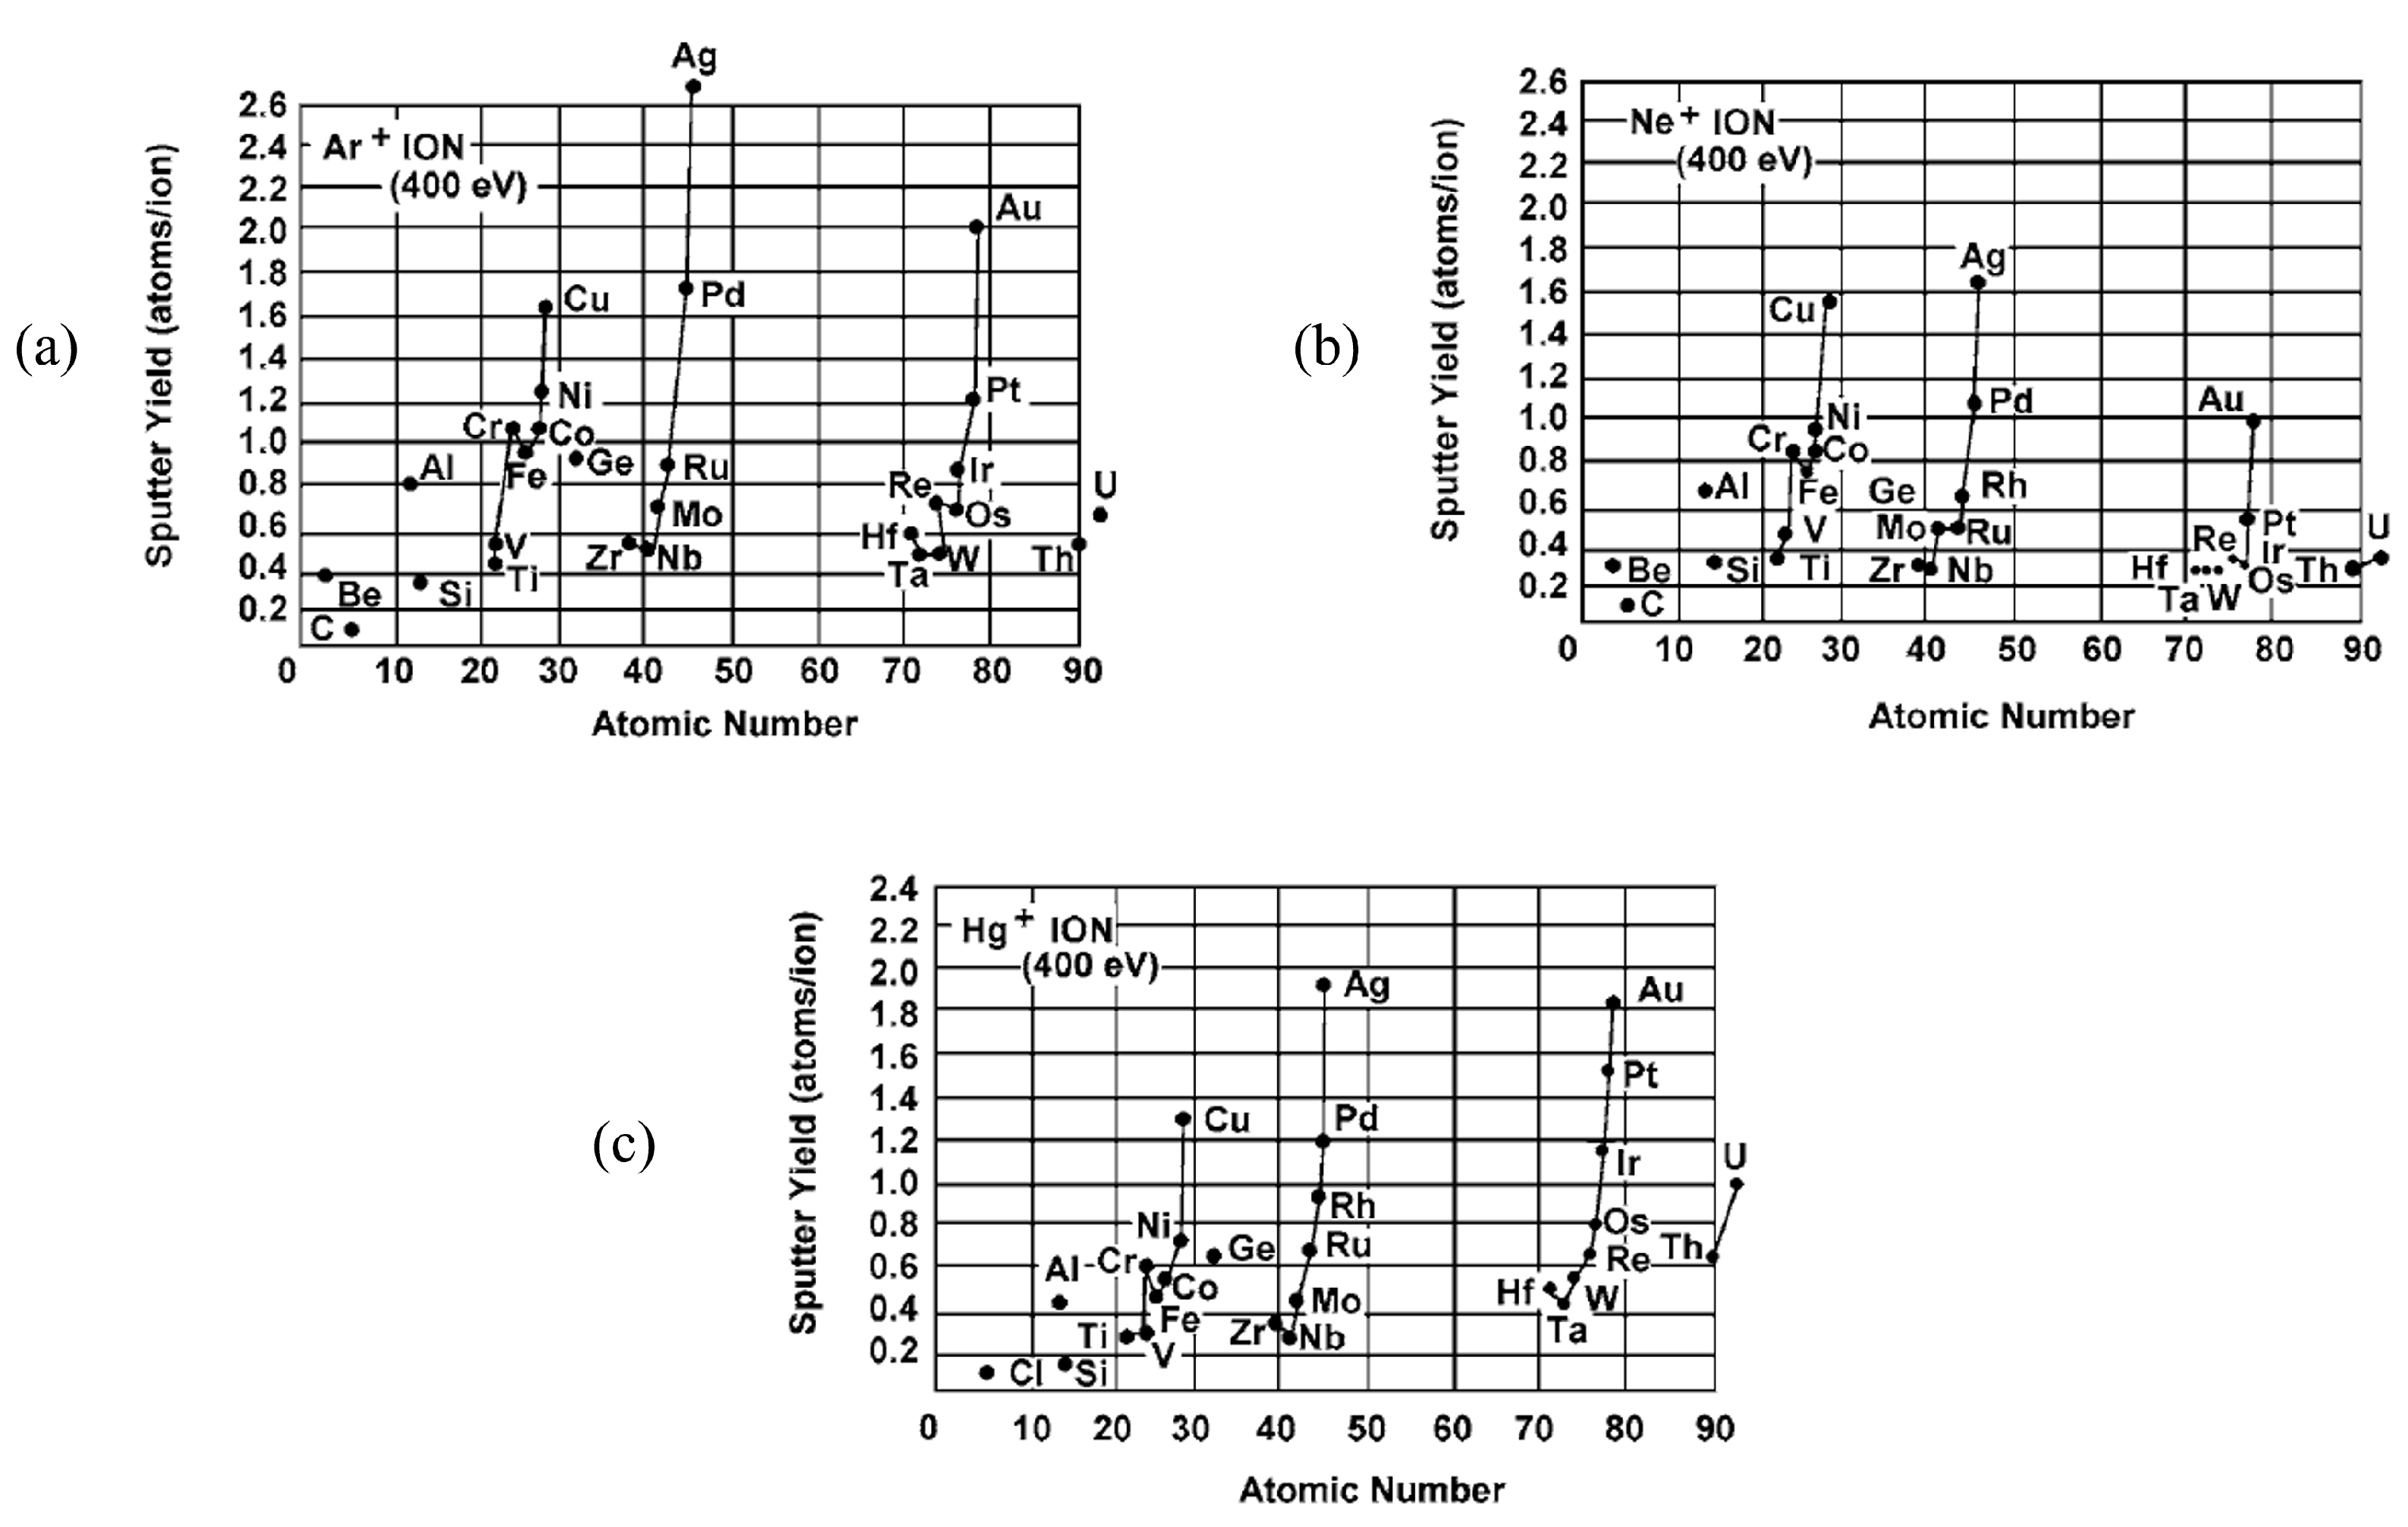
The amount of material removed depends on various parameters, for example, on the material of the FC, as shown in Figure 3. It shows the sputtering yield (atoms per incident ion) of different target materials for A r + , N e + , and H g + with 400 eV beam energy. Sputtered atoms will have a certain distribution over angles and energy; this information can help to design FCs with minimal sputtering effect. The material removal rate (in micrometers per hour), R s , for an N A incident ion can be estimated using Equation (2) [42]:
R s μ m h = 3.6 × 10 1 N A A i q ρ F
where A is the atomic weight, ρ is the density (g/cm3) of the bombarded material, q is the charge of the ions, i / F is the beam current density (mA/cm2), and F is the fluence (particles/cm2).
Figure 3. Sputter yield vs. atomic number for impinging (a) A r + , (b) N e + , and (c) H g + ions at 400 eV [43].
Instruments 09 00020 g003
In the literature, various studies have presented sputtering rates for different materials, which can serve as a useful reference when selecting a suitable material for FCs [44,45,46,47,48,49,50,51,52]. Materials such as tungsten or molybdenum are commonly used because of their minimal sputtering. Sputtering yield, γ s p u t , depends on the energy of the beam. It is equal to zero, where the energy of the incident ions, ϵ i , is below the energy threshold, ϵ t h r (see Figure 4).
This dependence can be well described by the following Equation (3) [40]:
γ s p u t ( ϵ i ) 0.06 ϵ t Z t ¯ ϵ i ϵ t h r
where ϵ t is the surface binding energy, and Z t ¯ is given by
Z t ¯ = 2 Z t ( Z i / Z t ) 2 / 3 + ( Z t / Z i ) 2 / 3
where Z t is the atomic number of the target ion, and Z i is the atomic number of the incident ion.
Figure 4. Schematic of the variation of the sputtering rate (yield), defined as S = Atoms removed Incident ions , with the incident ion energy [43].
Instruments 09 00020 g004
This approximation is true when the atomic masses of the incident and target atoms are large and fairly similar: 0.2 Z t / Z i 5 with Z t , Z i 1 . Additionally, the sputtering yield γ s p u t can be described in terms of the energy loss of the beam as well as the angle ψ (see Figure 5), which is measured between the incident beam direction and the surface normal. It is also influenced by the surface binding energy of the target material, U s as shown in Equation (5) [53]:
γ s p u t ( ψ ) = 0.1 ( d E d x ) n U s c o s ( ψ )
where d E d x n is the nuclear stopping power.
Figure 5. Sputtering yield measurements for diamond as a function of sputtering angle for 500, 750, and 1000 eV Ar ions [54].
Instruments 09 00020 g005

3.2. Secondary Electron Emission

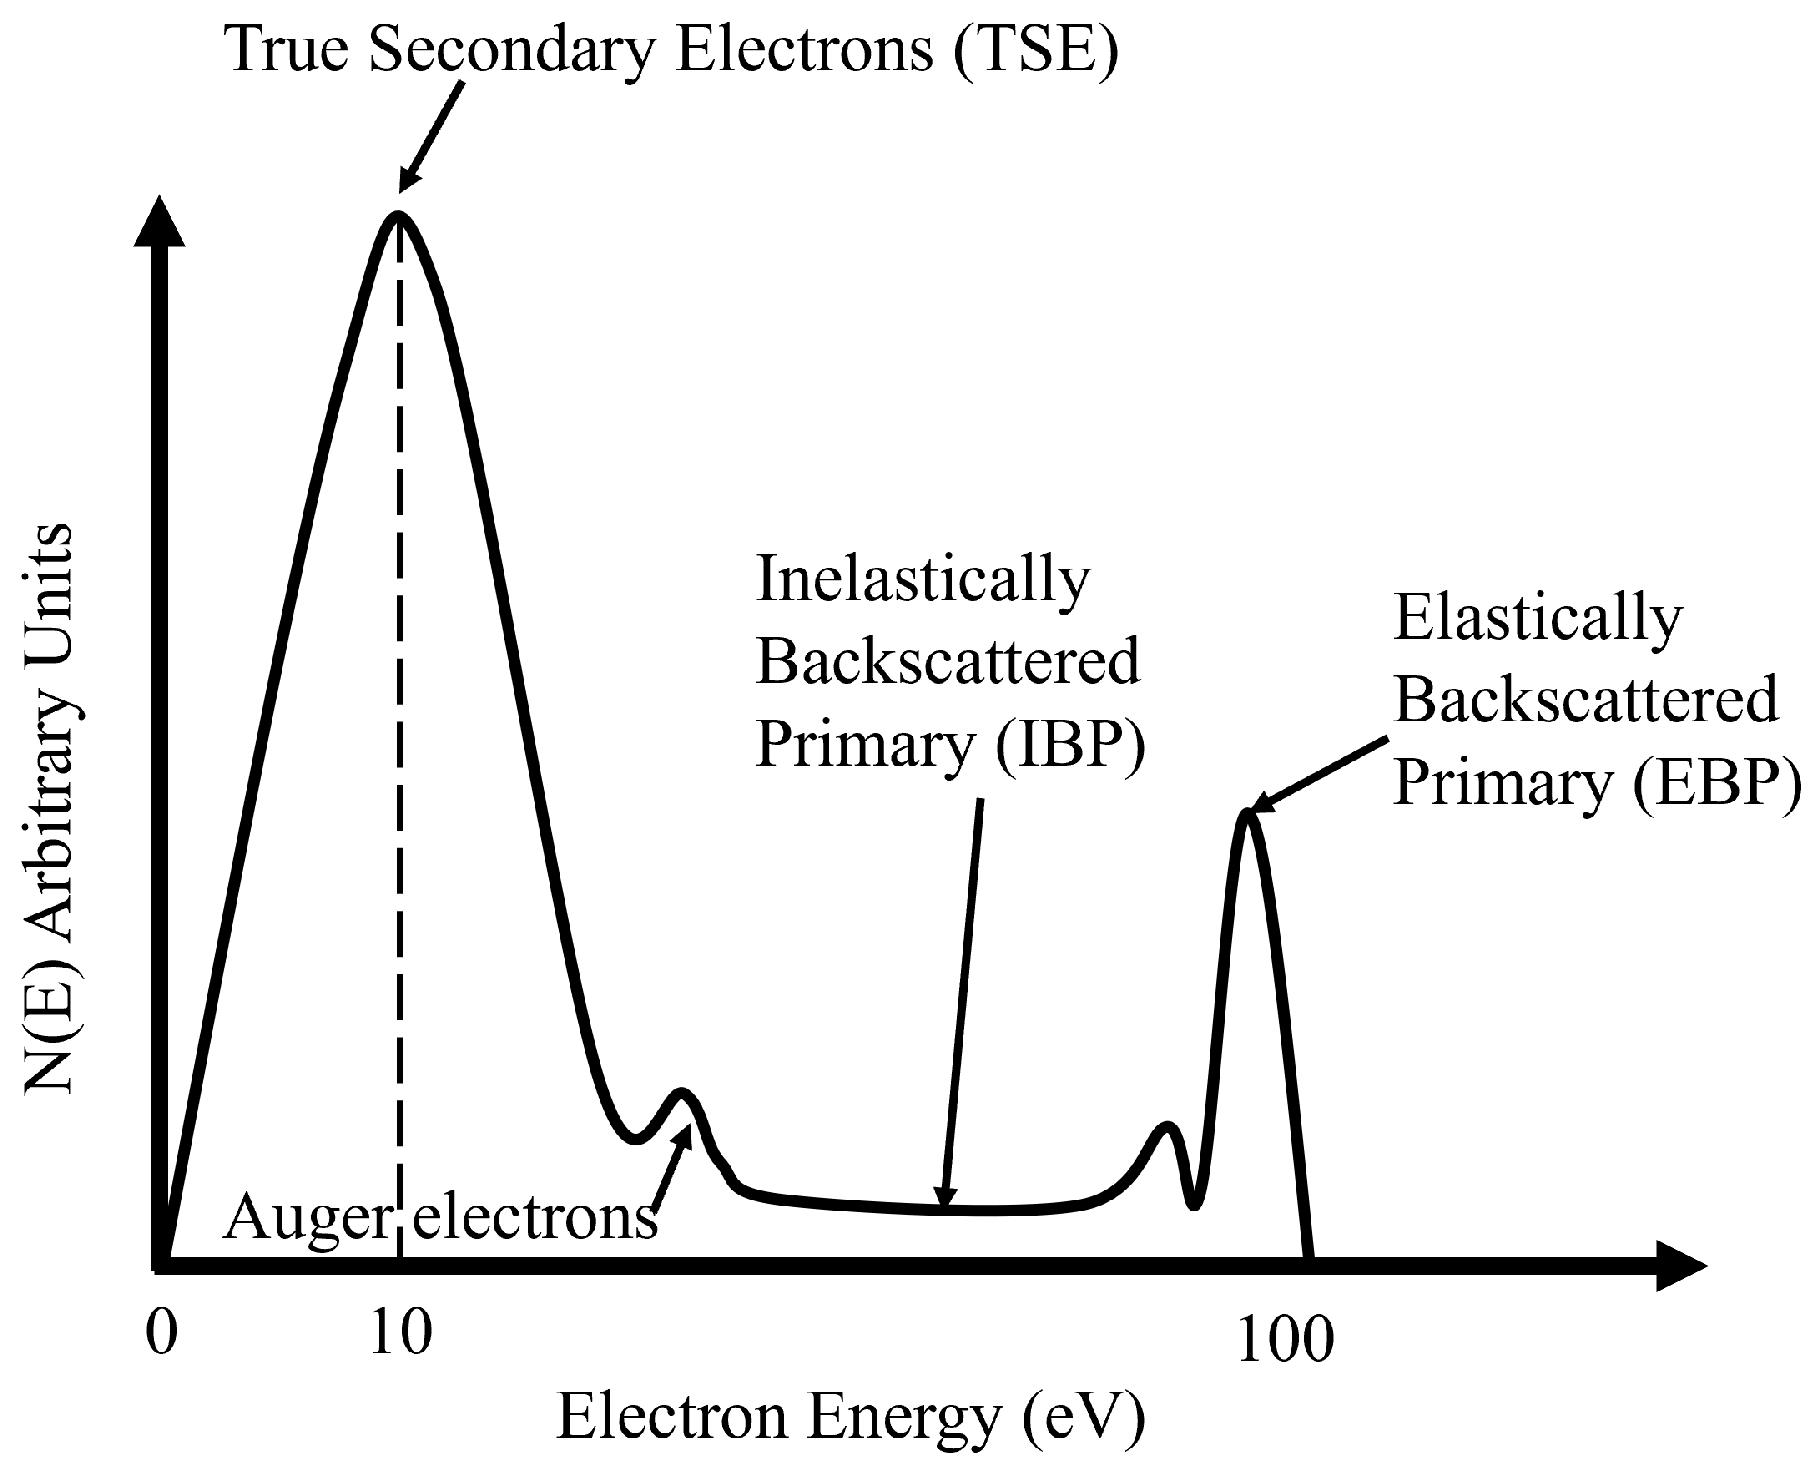
The emission of secondary electrons due to incoming particle impingement is one of the bigger issues in FC design. The phenomenon of secondary electron emission by electron impingement was first reported by German physicists L. Austin and H. Starke [55]. Later, physicist P. Lenard classified secondary electron radiation as the electrons excited by the primary electrons and ejected from the material, commonly called true secondary electrons (TSEs) [56,57]. Moreover, the primary electrons scattered from the material are further classified into Inelastically Backscattered Primary (IBP) and Elastically Scattered Primary (ESP). Usually, the electrons are ejected from the target material.
As shown in the schematic in Figure 6, the incoming particle beam interacts with the ions and electrons in the material lattice, depositing its energy and dislocating some ions and electrons in the process. The electrons that gain enough energy from this interaction are ejected either in the forward or in the backward direction. The probability of backward emission is higher since the incoming particle loses its energy as it travels further in the material (Bragg peak). This process releases not only electrons but also sputters material, as discussed in the previous section; in some cases, the incoming particles are backscattered. A schematic of the typical energy distribution of secondary electrons emitted from the target material is shown in Figure 7 and discussed in [58].
Figure 7. Typical energy distribution of secondary electron energy distribution in arbitrary units by electron bombardment (not to scale) [58].
Instruments 09 00020 g007
It is very challenging to accurately model secondary electron emission because of different parameters contributing to the formation and emission process, such as the thickness of the material, the energy of the colliding particle, the atomic number of the material, and the surface texture. Equation (6) gives the maximum energy of secondary electrons emitted from FC due to Coulomb collisions with a singly charged ion beam. It also indicates that the energy distribution of these secondary electrons generally follows a cosine distribution [6].
E e = 4 m e m p ( m p + m e ) 2 E p cos 2 θ
where
  • E e is the maximum energy of the ejected secondary electrons from the material.
  • E p is the maximum energy of the incident particle beam.
  • m e is the electron mass in amu.
  • θ is the emission angle of the electron with respect to the surface normal.
  • m p is the mass of the incident ion particle.
For a more precise prediction of the energy distribution of these electrons in arbitrary geometries, simulation codes based on Monte Carlo (MC) or Particle In Cell (PIC) techniques can be used [59,60]. Table 2 shows a summary of the different secondary emission models developed by researchers over the years. Huerta et al. [61] employed MC methods to model ion-induced secondary electron yield (SEY), incorporating surface morphology effects and the electron emission following a Poisson distribution. Vaughan [62] derived an analytical SEY expression for electron tube simulations, valid up to 3 V max (Table 2). The SEY, δ , depends on δ max and the normalized impact voltage v = ( V i V 0 ) / ( V max V 0 ) , with V 0 as the threshold voltage and k as a function of v. The Furman model [63] provides a phenomenological fit for SEY and energy spectra in metals, distinguishing between backscattered, re-diffused, and true secondary electrons. Svensson et al. [64] extensively studied the angular dependence of ion-induced SEY on polycrystalline copper.
More recently, Habl et al. [65] examined iodine-induced SEY, relevant for space propulsion, through an experimental study. Fernandez-Coppe et al. [66] advanced the ion-induced electron emission modeling using modern electronic and nuclear-stopping databases, ion-stopping range calculations, and a Monte Carlo approach for electron transport. Their model, applied to Ar, Kr, and Xe on W and Fe, highlights the limitations in analytical models like those presented by Beuhler and Friedman [67,68], whose SEY formulation neglects recoil contributions from electronic stopping. Schou [69] introduced a correction for plasmon losses and recoil contributions, yielding a closed-form SEY expression incorporating nuclear stopping power, material-dependent parameters, and energy transfer efficiency. The Fernandez-Coppe model overcomes the semi analytical approaches by providing a discrete kinetic simulation for metallic surfaces. However, it assumes ideal, non-degradable surfaces and lacks crystallographic considerations. Despite these limitations, it offers better accuracy for high-energy SEY predictions, validated against W and Fe benchmarks.
Commercial tools like CST Studio, SIMION, and COMSOL can be used to model the secondary electron emission process [70,71,72] and design an FC according to a user’s requirements. By providing secondary electron emission yield data from the literature, the user can utilize the software to perform particle trajectory tracing and predict the spatial and energy distributions of the resulting secondary electrons. This approach provides a more accurate and detailed analysis of the behavior of secondary electrons for the given design and geometry. For example, CST Studio includes two secondary electron emission models for analysis, which are the Furman emission model and the Vaughn Emission Model. Another reference for the ion-induced secondary electron yield is the data compiled by Hasselkamp and Sternglass [73,74]. Sternglass modeled the secondary electron emission process due to ion impingement in two independent parts: firstly, the formation of the secondary electrons; secondly, the escape of secondary electrons. In their model, it is assumed that the energy lost by the primary ion as a result of excitation and ionization processes is utilized in the formation of the secondary electrons and these secondary electrons in turn lose their energy in different collision processes. Only a small fraction of the secondaries formed can reach the surface of the solid with sufficient energy to escape.
Table 2. Summary of secondary electron emission models. Detailed definition of the parameters in the equations can be found in the cited references.
Author/ModelFormula/Key IdeaKey Takeaway
Huerta et al. (2019) [61] P n = γ n e γ n ! Monte Carlo approach for ion-induced SEY considering surface morphology; Poisson-distributed emission.
Vaughan (1989) [62] δ δ m a x = ( v e 1 v ) k Empirical SEY model for electron tubes, valid up to 3 V m a x .
Furman (2002) [63]Empirical fits for Cu and stainless steelCategorizes secondary electrons into backscattered, re-diffused, and true electrons.
Svensson et al. (1981) [64]Experimental studyStudied angular dependence of SEY for noble gases on polycrystalline Cu.
Habl et al. (2021) [65]Experimental studyInvestigated SEY from iodine bombardment for space propulsion applications.
Fernandez-Coppe et al. (2024) [66]Monte Carlo-based simulationTracks ion and recoil trajectories using stopping power databases; applied to Ar, Kr, and Xe on W and Fe.
Beuhler & Friedman (1977, 1986) [67] γ = P E 0 0 exp x cos θ λ d E d x e d x Models ion-induced SEY but does not account for plasmons or recoil energy losses.
Schou (1980) [69] γ = Λ β 0 d E d x e + β r η t ( μ E ) μ E d E d x n | x = 0 Improves the B & F model by incorporating recoil energy losses, but relies on empirical constants.
Figure 8a shows the ion-induced secondary electron yield for an Ar+ beam on a copper target from different references. The conditions of the target are different for each experimental condition, but it can be generalized that for a beam energy range of 100 eV–1 MeV, the secondary electron yield for the Cu surface ranges between 0.01 and 10. A similar comparative plot can be used to predict the error resulting from the secondary electron expected from a particular material and beam energy.
There are different strategies for reducing the effect of secondary electrons in FC measurements. One way is to perform secondary electron electrostatic suppression with a suppressor electrode, usually in the shape of a circular ring. To effectively suppress secondary electron loss, it is crucial to carefully select the suppression voltage. In the case of a circular electrode, the weakest potential lies along its axis, requiring a voltage higher than the maximum energy of the secondary electron for proper suppression. A reliable calibration method for accurate FC measurements involves monitoring the measured current, as the suppressor electrode voltage is varied. Initially, the measured current tends to be high (for positively charged particle beams), but with an increase in the suppressor voltage (more negative), the current gradually decreases and saturates, indicating the suppression of the secondary electrons. Figure 8b shows a plot depicting the calibration data of the REX-ISOLDE (Isotope Separator On Line Device ) FC. The agreement between particle tracking simulations and actual measurements demonstrates a good level of accuracy in the design and modeling of FCs [75].
However, circular electrodes/FCs are not the only choice; Thomas et al. [76] conducted a comparative study between traditional cylindrically symmetric and beveled FC geometries (details can be found in the later Section 3.4). The design utilizing a beveled inner cup avoided using an axial potential energy barrier to redirect secondary electrons back to their origin surface. Instead, it redirected them to a different surface that was electrically connected to the original target surface via a transverse electric field. Rawat [77] investigated the effect of inter-electrode spacing and suppressor electrode thickness for a single- and double-suppressor electrode configuration on the filtering of primary electrons emitted from the neutralizer, respectively, in a multi-cusp ion source.
Figure 8. (a) Comparison of secondary electron emission yield for A r + impingement on Cu surfaces obtained from [78,79,80,81,82,83,84]. (b) Plot showing ratio of measured current (FC) to the actual beam current as a function of suppressor electrode voltage [75] (Reproduced with permission).
Instruments 09 00020 g008
The other approach is to suppress secondary electrons by having a transverse magnetic field to the beam axis using permanent/electro magnets. Pruitt [85] developed an FC with a solenoidal magnetic field to trap electrons with energies <1 keV along with the use of two permanent bar magnets. The magnetic field required to suppress the secondary electrons of a given energy depends on the bending radius of the electron. The bending radius, R e , of an electron with energy, E, is given by Equation (7) [38].
R e = 2 m e E e B
where m e is the electron mass, E is the energy of the electron in eV, e is electronic charge constant, and B is the magnetic field in Tesla.
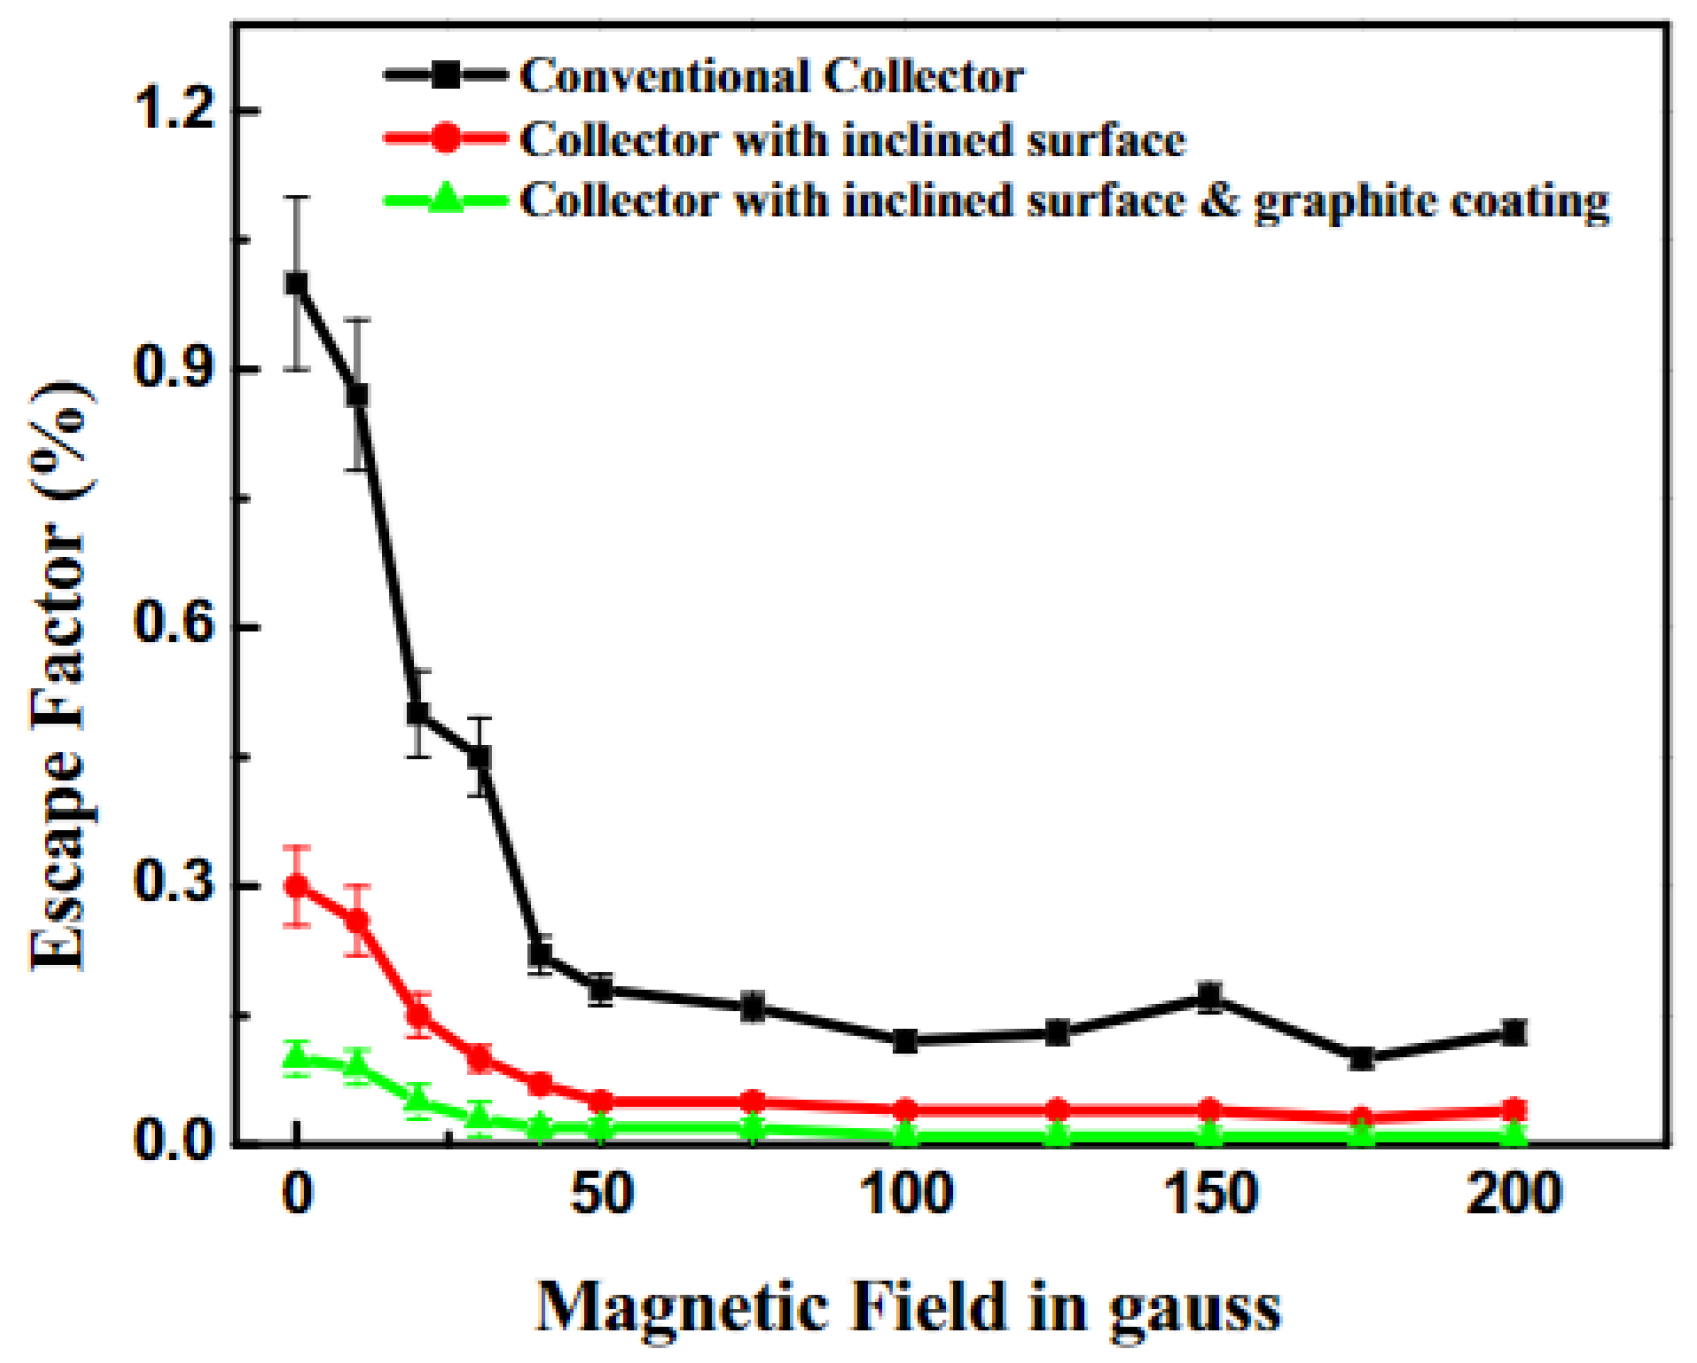
Bhatia et al. [86] designed an FC to for a mass spectrometer, with a magnetic field suppressor and a graphite collector. The advantage of using a magnetic field suppressor instead of an electric field is that it also suppresses low energy ions formed by the impact of the primary ion beam on the collector material or by the ionization of the residual gas within the cup cavity. They showed that the escape probability of the secondary electrons can be reduced by a factor of 3 by using a 45 degree inclination to the end surface of the collector and further by a factor of 3 by using a graphite coating as shown in Figure 9. Similarly, the effect of the magnetic field on secondary electrons in an FC was studied by several groups [87,88,89,90,91,92].
Figure 9. Effect of transverse magnetic field on the electron escape probability with different collector designs [86].
Instruments 09 00020 g009

3.3. Backscattering of Particles

Another possibility of incorrect measurements in the FC arises due to the backscattering of incident particles. Cohen et al. [93] have performed comprehensive work on the backscattering of electrons from different target materials with variable thicknesses and energies. When a highly energetic electron passes near the nucleus of an atom, it is deflected by Coulomb forces. The cross-section of the interaction of an electron of rest mass energy m 0 c 2 beyond the angle θ by a nucleus of charge Z is given by the Rutherford scattering Equation (8) [93].
σ s = π Z e m 0 c 2 2 1 E 1 E cot 2 θ 2
where σ s is the scattering cross-section of the electron, E is the energy of the incoming particle, and e is the electronic charge.
The backscattered ions from different materials with a given thickness can be obtained using tools like TRIM (Transport of Ions in Matter) [94,95]. At high ion beam energies, the scattering cross-section scales as 1 / E 2 but this dependence is very weak at low energies. A review of low-energy ion scattering (LEIS) techniques and spectroscopy is given by Brongersma [96].
A typical output of the TRIM simulation for backscattering contains kinetic information such as backscattering energy ( E b s ) and directional cosines of the trajectory of the backscattered ion, from which the azimuthal ( ϕ b s ) and elevation ( θ b s ) angles can be computed which could be represented via 3D distribution. An example of such simulation output from a proton beam incident on a copper target as an estimated probability density of a 2D “ θ b s E b s ” distribution is shown in Figure 10a. For the purpose of visual interpretation, in order to show percentage distribution over the plotted grid, probability density has been normalized by the sum over all grid points in the plot. The most probable ( θ b s , E b s ) is highlighted by a yellow dot. The most probable pair ( ϕ b s , E b s ) can also be inferred from the “ ϕ b s E b s ” distribution. These values have been estimated for various incident angles, A n g l e i n p u t , and energies, E i n p u t , which are shown in Figure 11a,b,d,e, respectively. These plots demonstrates the most probable E b s is proportional to the incident energy and inversely proportional to the incident angle. The azimuthal angle, ϕ b s , strongly depends on the input angle, but not on incident energy; meanwhile, the elevation angle, θ b s , does not show definitive dependence on input parameters. The peak on Figure 10a has some spread which means there is some variation in the output angles and energy. It can be estimated using trace of covariance matrix normalized by uniform distribution which indicates uncertainty of the most probable pair: ( θ b s , E b s ) or ( θ b s , E b s ). This uncertainty varies depending on incident parameters which can be seen in Figure 11c,f.
The probability of backscattering also varies depending on the incident energy and angles (see Figure 10b). One of the ways in how the charge loss due to backscattering from the FC can be mitigated is by having a conical collection angle of the FC. In a conical geometry, the sloped inner walls cause incident particles to strike the surface at an angle, and any that are backscattered have a higher likelihood of colliding again with the cup’s interior compared to those in a cylindrical design. Figure 10b shows that the backscattering probability increases with the incidence angle of the incoming beam. This trend is logical: as the beam’s angle of incidence becomes more oblique, it interacts more closely with the surface, thereby increasing the likelihood of backscattering. In contrast, at normal incidence, the beam penetrates deeper into the material, reducing its probability of backscattering.

3.4. Stopping Distance and Different FC Designs
Designing an FC also requires careful consideration of ion penetration depth (in the case of an ion beam) within the collector material, which is dependent on various properties such as beam energy, type of material, incidence angle, and surface condition. The stopping of high-energy non-relativistic ions can be analytically estimated using Bethe’s formula of stopping power [97], which describes the mean energy loss per unit distance traveled by an energetic charged particle in a medium given, which is described by Equation (9).
d E d x = 4 π n z 2 m e c 2 β 2 e 2 4 π ϵ 0 2 ln 2 m e c 2 β 2 I ( 1 β 2 ) β 2
where c is the speed of light, ϵ 0 is the permittivity of the free space, e and m e are the electron charge and mass, respectively, z is the charge (in multiples of electron charge). The term n denotes the electron density in the material, I is the mean excitation energy of the material, β = v/c, and d E / d x is the energy lost by the charged particle per unit of distance traveled in the medium.
Tools such as SRIM/TRIM can be used to determine the depth in which ions can penetrate inside various materials [94]. A typical 500 keV proton beam distribution in a copper target, as estimated with TRIM, is shown in Figure 12. TRIM uses the Bethe–Bloch formulas with applied corrections to estimate the stopping distance of the particle inside the material. This capability is valuable in ascertaining an FC’s optimal thickness when dealing with high-energy beams. In addition, these tools provide insights into the amount of energy deposited over a specific distance within the material. This methodology can be extended to analyze diverse materials, enabling a comparative assessment to select the most suitable material for FC.
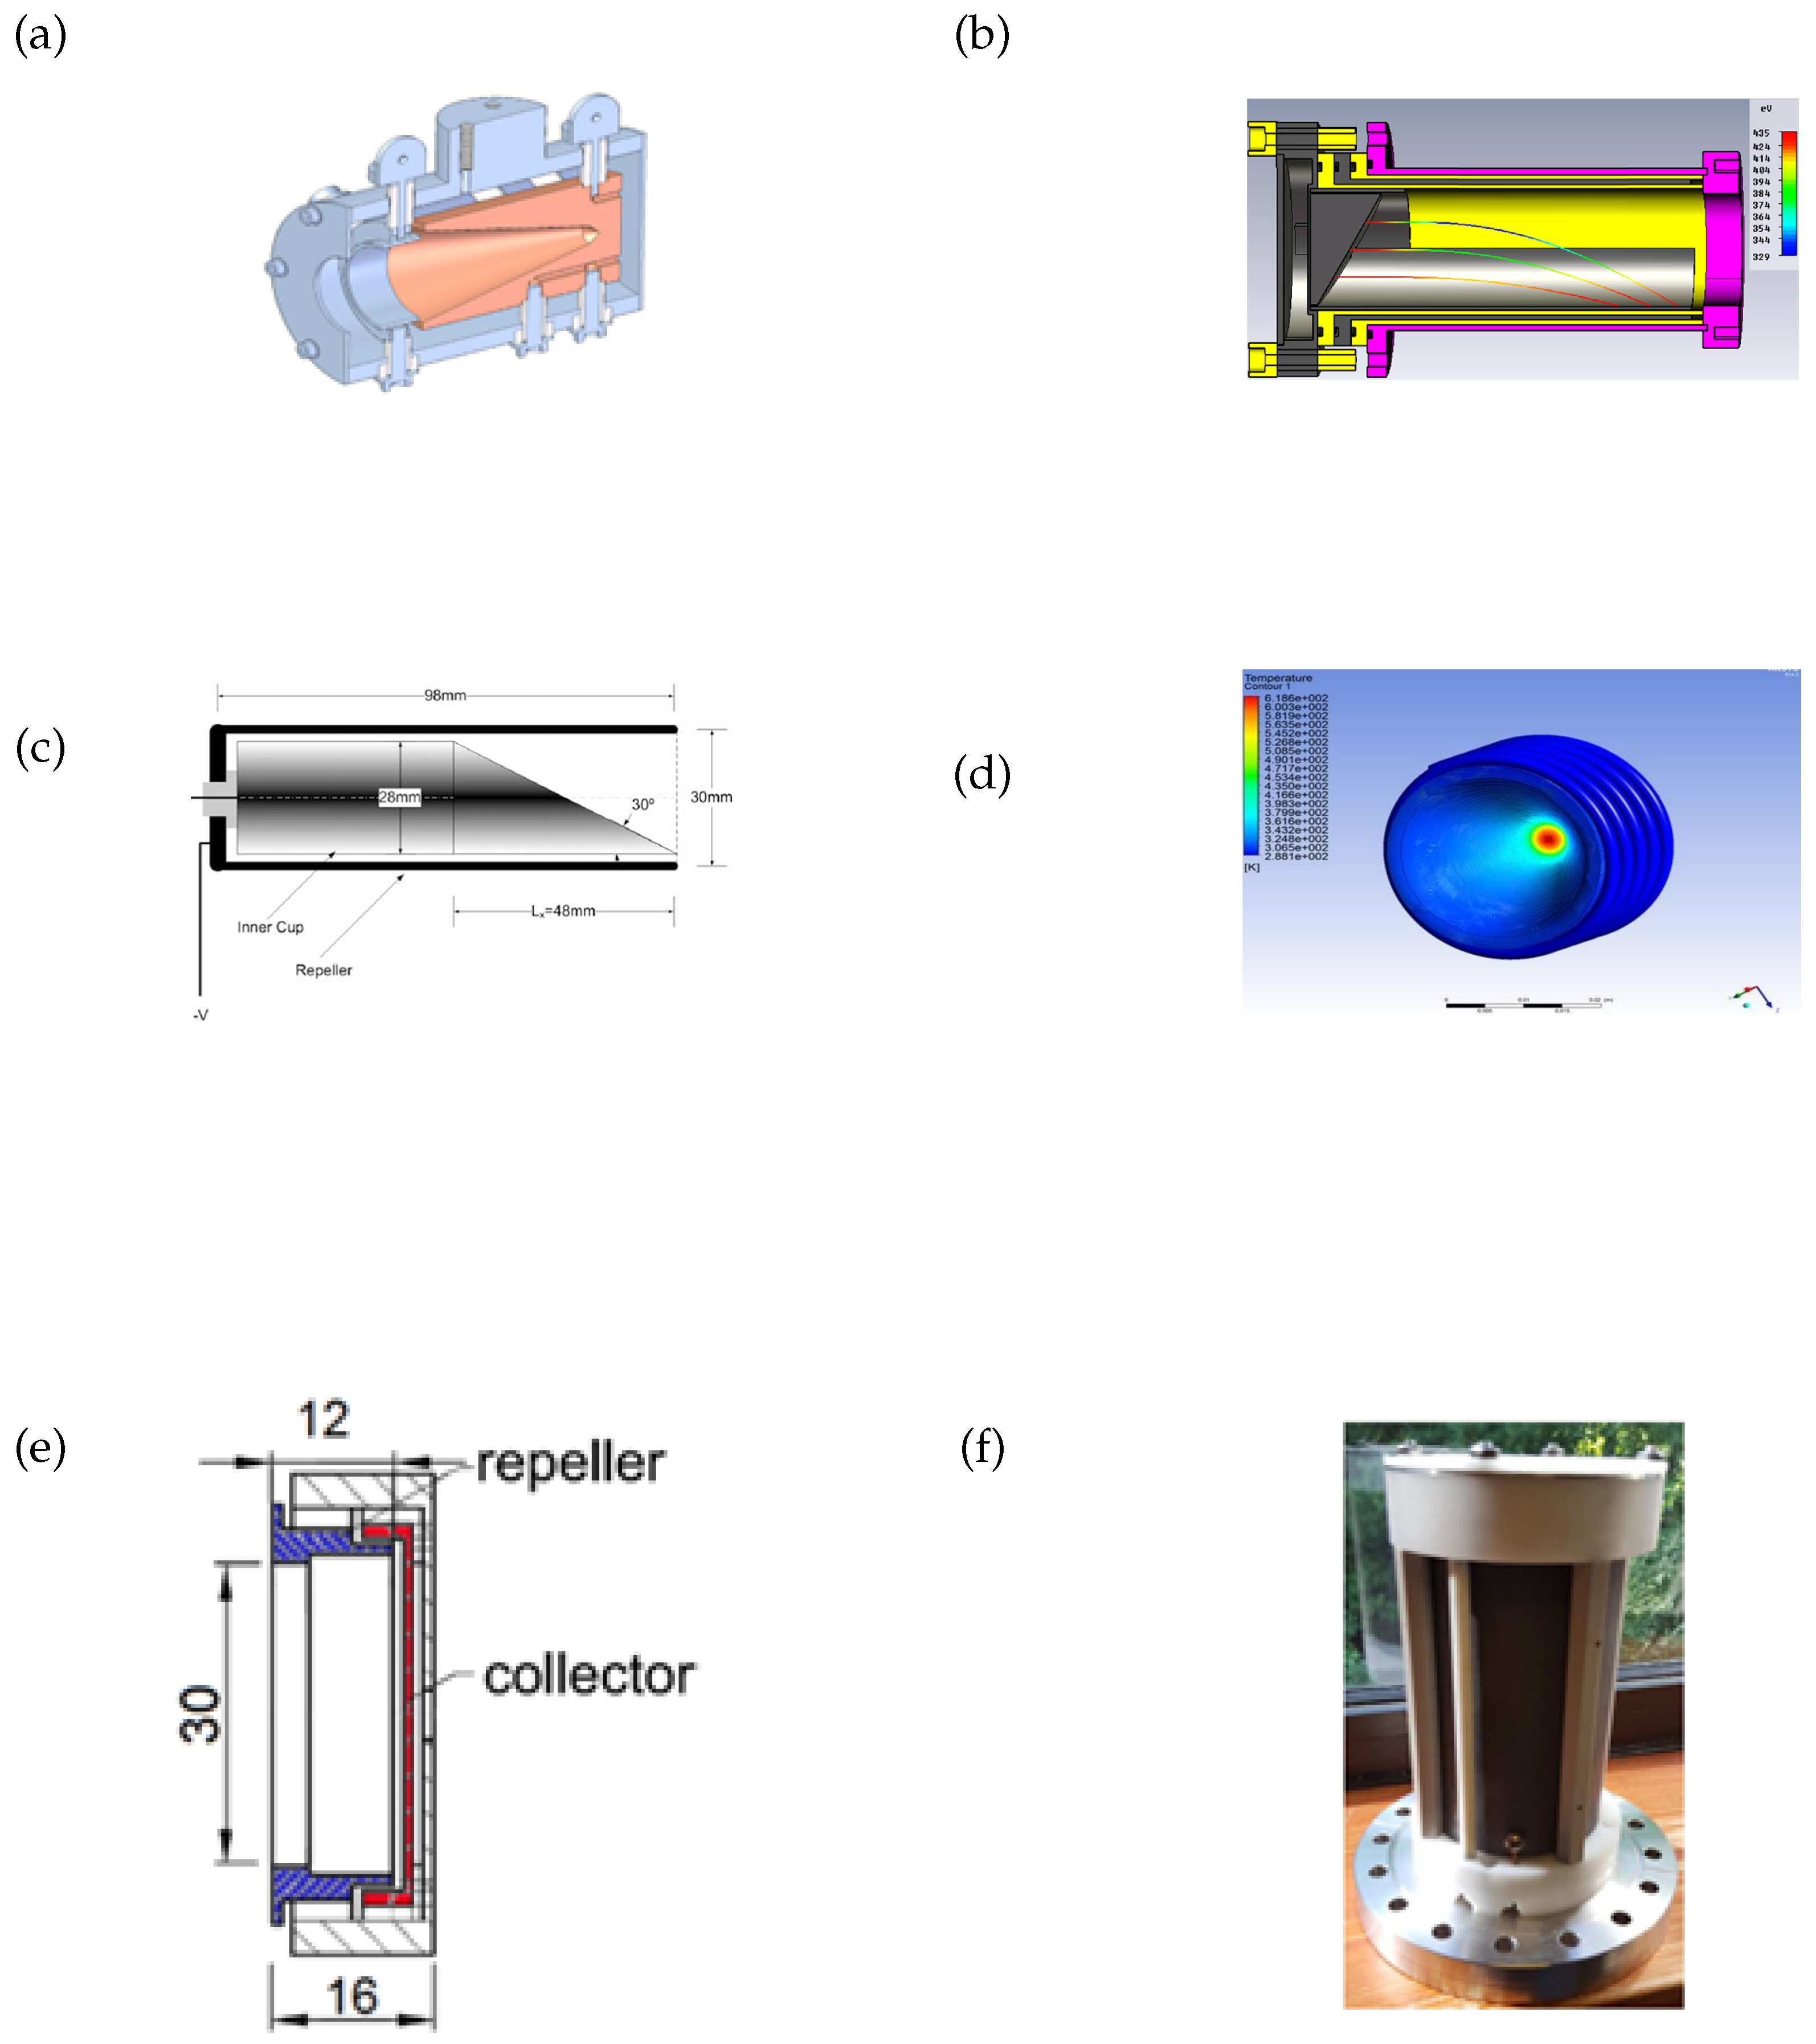
The energy of the detected particle beam also plays an important role in the overall design of an FC. For particle accelerators, the beam energies may range from eV to TeV depending on the intended application, which may require thicker/bulkier FCs with external cooling systems. For applications such as thermonuclear fusion and electric propulsion, the beams are in the range of tens of keV and may be pulsed, which may or may not require cooling systems. In particle accelerators, depending on the type of beam to be detected (DC/pulsed), the FC design is constrained. For example, Harasimowicz et al. [5] designed and optimized an FC for measuring the beam current from the 1 µA to fA range for low-intensity beams at the Ultra-low-energy Storage Ring (USR) and the Facility for Low-energy Antiproton and Ion Research (FLAIR) shown in Figure 13a. They chose a conical FC design in order to optimize the secondary electron collection efficiency as well as to expose a large area to the incident beam so that the heat load was lowered without requiring any external cooling. Although it could not be used for absolute intensity measurement with antiproton beams, it was an important tool for the initial commissioning phase.
Figure 13. (a) Conical FC for 300 keV antiproton beam at USR by Harasimowicz et al. [5] with initial tests performed with electron and proton beams. (b) Beveled FC for the ES-200 accelerator for 200 keV proton beam by Ebrahimibasabi et al. [98]. (c) FC with beveled suppressor electrode by Naieni et al. for 20 keV proton beams [99]. (d) Water-cooled FC for 300 keV deuteron beam at Institute for Plasma Research by Rawat et al. [6]. (e) Prototype FC by A. Sosa et al. for ISOLDE facility [100]. (f) Assembly of the graphite FC by R. Johnston et al. [101] (all figures reproduced with permission).
Instruments 09 00020 g013
Ebrahimibasabi et al. [98] conducted a comparative study of various FC shapes using CST tracking simulations to determine the optimal design for maximizing secondary electron collection efficiency, similar to one performed by several other researchers [76,102]. They developed a conical FC to detect a 200 keV proton beam at Shahid Beheshti University, as shown in Figure 13b. Similarly, Naeni et al. [99] concluded that, for all extension lengths, the semi-cylindrical shape has a better performance than the beveled-shaped FC, as shown in Figure 13c. Moreover, the semi-cylindrical geometry has a higher on-axis electric field compared to the traditional cylindrical FC. Rawat et al. [6,103] designed an FC for a 300 keV, 10 kW deuteron beam with a provision for water cooling for an accelerator-based neutron source. It included estimating the suppressor electrode voltage required to minimize secondary electron losses and CFD (Computational Fluid Dynamics) analysis to estimate the flow rate for water cooling, as shown in Figure 13d. Numerical optimization studies for different FC designs were carried out by A. Sosa et al. [100] (Figure 13e) for a short FC using numerical simulations for the ISOLDE facility at CERN (Conseil Européen pour la Recherche Nucléaire), which was used for pilot ion beams with mass–charge ratio A/q < 4.5 with a beam current of up to 1000 pA. The loss probability of the secondary electrons in different FC prototypes was calculated by sweeping the electron energies from 0 to 500 eV and the repeller electrode voltage from 0 to −500 V for different electron emission angles (0°, 45°, and 90°).
R. Johnston et al. [101] discussed the design, construction, installation, and testing of an FC to measure the current of a 3 MeV and 1 μ A electron beam for a Moller scattering measurement at MIT (Massachusetts Institute of Technology) High Voltage research laboratory, as shown in Figure 13f. It used a graphite cup for current collection and a thin suppressor electrode with a bias voltage of −500 V to stop the secondary electrons from escaping the FC. As an alternative to the Allison-type scanner [104,105,106], due to its long data acquisition time, Dong-Hwan Kim et al. [107] developed a Multi-Pinhole Faraday Cup (MPFC) for the KOMAC low-energy beam transport system for proton beams. The system consisted of two parallel plate electrodes consisting of tantalum and fifty pin-type FCs made up of gold-plated copper. A similar design to detect beam uniformity was developed for a 400 keV electron irradiation accelerator at Huazhon University of Science and Technology by C. Zuo et al. [108]. It used a linear array of 10 FCs made up of copper. The paper also describes the finite element analysis for the cooling channels to minimize the temperature rise on the FC and the repeller electrode, as shown in Figure 14.
Figure 14. (a) Temperature distribution in the repeller (metallic electron-suppressor lid) and (b) the Faraday Cup with water-cooling [108] (reproduced with permission).
Instruments 09 00020 g014
The Segmented Faraday Cup (SFC) is another typical design. Rosing et al. developed a 48-channel copper SFC [109] to measure the emittance of an incoming particle beam. Similarly, Knolle et al. [110] designed a 37-segment SFC to measure the 2D current distribution of 25 keV ion beams with beam currents of up to 10 mA. An empirical study of the multidimensional Child–Langmuir law using round apertures was conducted by Kosonen et al. [111], where they used an SFC to estimate the divergence of the beam extracted from a filament-driven multi-cusp argon ion source. In a different application, to measure the electron current density of a transient hollow cathode discharge, Huo [112] et al. designed a variable-beam entrance FC to measure pulsed electron beams on the time scale of 10 9 s and current densities up to 10 3 A/cm2.

3.5. Shielding

In designing FCs for high-energy electrons, one also must consider a few more effects that do not occur with particles with higher mass. For example, when an electron is accelerated in the Coulomb field of the nucleus, it generates Bremsstrahlung radiation. This requires extra measures to protect the electronics and other components from radiation. If the Bremsstrahlung energy is higher than twice the rest energy of the electron, it leads to the creation of electron–positron pairs. Preventing these particles from escaping the FC surface is essential for accurately measuring the beam current. The critical energy, where the effect of energy loss by ionization/excitation and radiative loss by pair production is equal, is given by the formula in Equation (10) [38]:
E c = 800 Z [ M e V ]
Equation (10) implies that low-Z materials are a good choice for a high-energy electron beam. However, the charge loss due to the pair production should be prevented by placing an absorber material behind the low-Z material. A typical calculation of absorber thickness is very well described in the book by Strehl [38]. T. F. Godlove et al. [113] developed shielded and unshielded FCs for electron energies ranging between 10 and 60 MeV, as shown in Table 3, which was further utilized to calibrate the secondary electron emission produced by electrons/positrons incident on a 0.4 mm Be target. Hence, while designing an FC, both electromagnetic and radioactive shielding are necessary to protect the equipment and ensure accuracy in sensitive measurements.
Table 3. Summary of various designs of FCs for different particle beams.
Sr. No.EnergyMaterialCurrent/ChargeParticleReference
1200 keVOFHC Cu3.2 pC p ¯ /p/eHarasimowicz et al. [5]
2200 keVCu500 μ Ap+Ebrahimibasabi et al. [98]
320 keVp+Naieni et al. [99]
4300 keVOFHC Cu30 mAD+Rawat et al. [6]
510 MeV/uSS1 pA–1 nAIons ( m / Q < 4.5 )Sosa et al. [100]
610–60 MeVCu/Ta∼150 mAe/e+Godlove et al. [113]
725 keVCupAp+Thomas et al. [76]
  • Electromagnetic shielding 
Electromagnetic shielding is essential in protecting sensitive measurement electronics from external electromagnetic interference (EMI), which can distort the signals being measured by the FC. The principles and design considerations include the following:
  • Faraday cage effect: Conductive enclosures redirect external electric fields around the shielded area, primarily mitigating the electric field components [114].
  • Magnetic field attenuation: For effective EM shielding, magnetic field attenuation is crucial. This requires the following aspects: high-permeability materials (e.g., mu-metal) [115] for low-frequency magnetic fields; eddy current induction in conductive materials for high-frequency magnetic fields [116].
  • Grounding: A proper grounding technique is essential in ensuring that the shield effectively dissipates unwanted electromagnetic fields.
  • Materials selection:
    For electric fields, highly conductive materials like copper or aluminum are required;
    For magnetic fields, high-permeability alloys (e.g., mu-metal, nickel–iron alloys) are effective at low frequencies, while composite or layered shields can be used for broadband shielding, offering attenuation over both low and high-frequency ranges.
  • Thickness and skin depth: The thickness of the shielding must consider the skin depth of EM waves at different frequencies.
  • Radioactive shielding 
Radioactive shielding may also be necessary to protect both equipment and personnel from harmful radiation produced by high-energy particle beams and secondary particles such as bremsstrahlung radiation. These are especially important in facilities like particle accelerators, fusion reactors, and medical therapy units.
Principles and design considerations for radioactive shielding:
  • Materials selection: The choice of materials for FC construction must balance several factors like electrical properties, radiation resistance, secondary emission, and heat dissipation.
    For FCs used in high-radiation environments, copper alloys or aluminum may be preferred for their conductivity and radiation resistance; tungsten or molybdenum could be better choices for parts exposed to very high energy beams due to their high melting points and density; ceramic insulators like alumina might be employed for their radiation hardness.
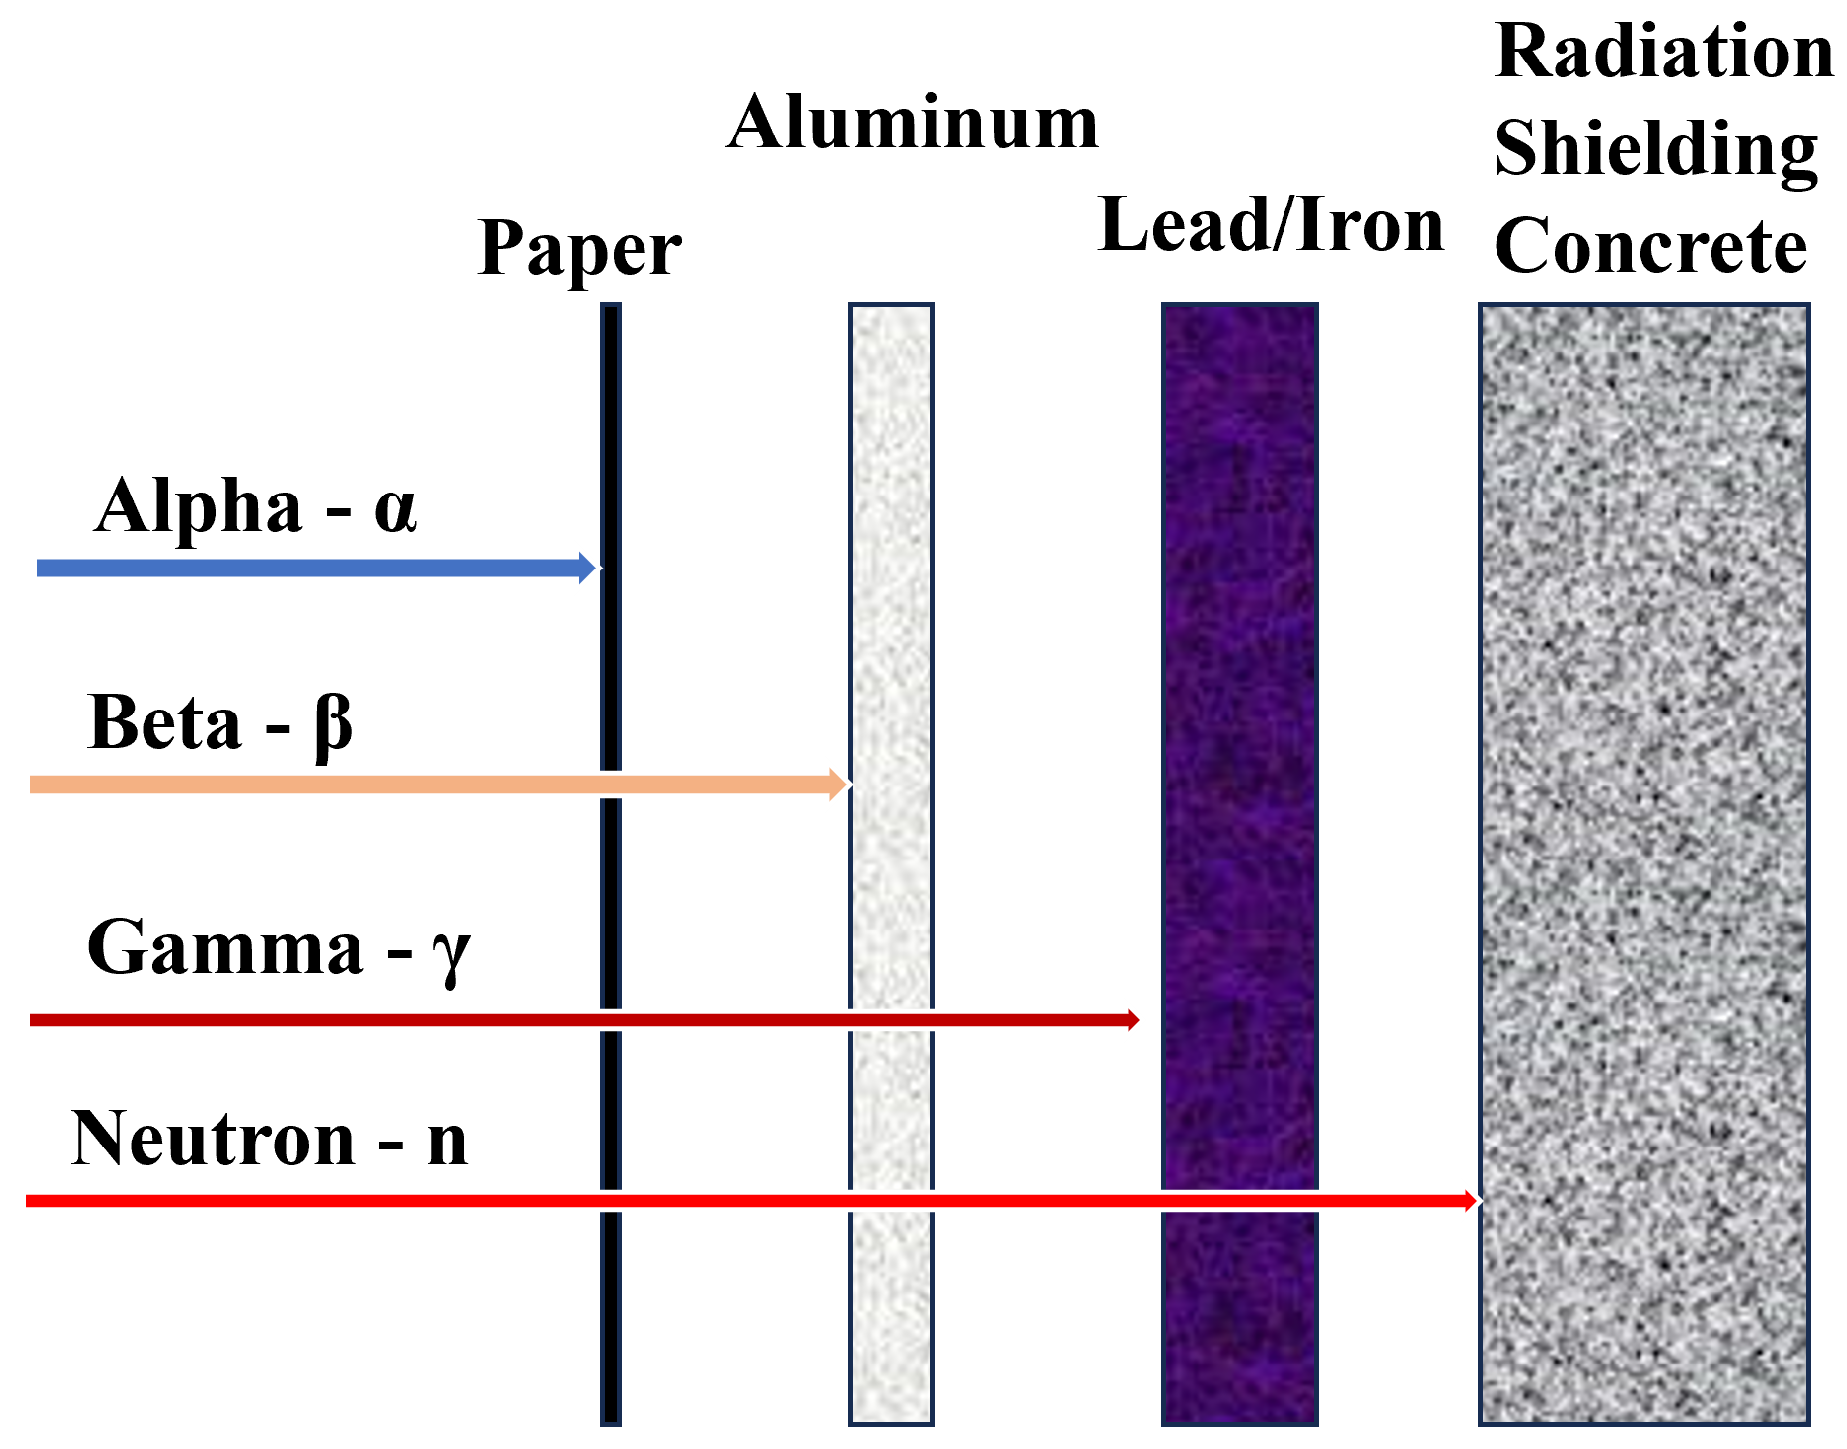
    To protect the sensitive electronics of the FC, additional shielding materials such as lead or tungsten are commonly incorporated to attenuate X-rays and gamma rays. In neutron-rich environments, materials like borated polyethylene, water, or concrete are preferred due to their cost-effectiveness and strong neutron-absorption properties [117], as illustrated schematically in Figure 15. It shows a core–shell particle structure, where a neutron-absorbing gadolinium oxide ( G d 2 O 3 ) core is encapsulated by a tungsten (W) shell. The tungsten shell acts as a primary barrier for gamma radiation, while the Gd2O3 core captures incident neutrons, often emitting secondary gamma rays in the process. This configuration exemplifies a “double shielding” system, with enhanced protection against both gamma rays and neutrons.
  • Shield thickness: This is generally calculated based on the type and energy of the radiation. Monte Carlo simulations can help optimize the thickness and configuration of the shielding.
  • Layering: As shown in Figure 16, using multiple layers of different materials to absorb different types of radiation (for example, lead for gamma rays, borated polyethylene for neutrons).
Figure 15. Schematic diagram of (a) G d 2 O 3 @ W (an alloy) core–shell structure: the solid orange circle represents the G d 2 O 3 (gadolinium oxide) core, which functions as a strong neutron absorber, which is encapsulated by a tungsten (W) shell, shown in blue, that provides efficient attenuation of gamma radiation. The combination of these two materials in a core–shell geometry, a “double shielding” that offers dual protection against both neutrons and γ -rays. (b) These core–shell particles are embedded within a 6063 aluminum matrix, forming a composite material [118].
Instruments 09 00020 g015
Figure 16. Schematic showing the relative transmission ability of different radiations [118] through different materials.
Instruments 09 00020 g016

4. Signal Processing and Data Acquisition

4.1. Signal Processing

Signal processing in FC measurements involves a series of carefully coordinated analog and digital hardware components. The process begins with the conversion of currents generated by the incident beam into measurable voltages, followed by amplification, noise reduction, filtering, and, if needed, the integration of the signal. Each of those stages requires careful circuit design and component selection, so that high sensitivity and accuracy can be maintained. Modern systems often incorporate real-time digital processing, both for improved noise suppression and for rapid feedback in accelerator environments. The following sub-subsections demonstrate each step in the signal processing chain, from current-to-voltage conversion to advanced noise reduction and data digitization techniques.

4.1.1. Current–Voltage Conversion

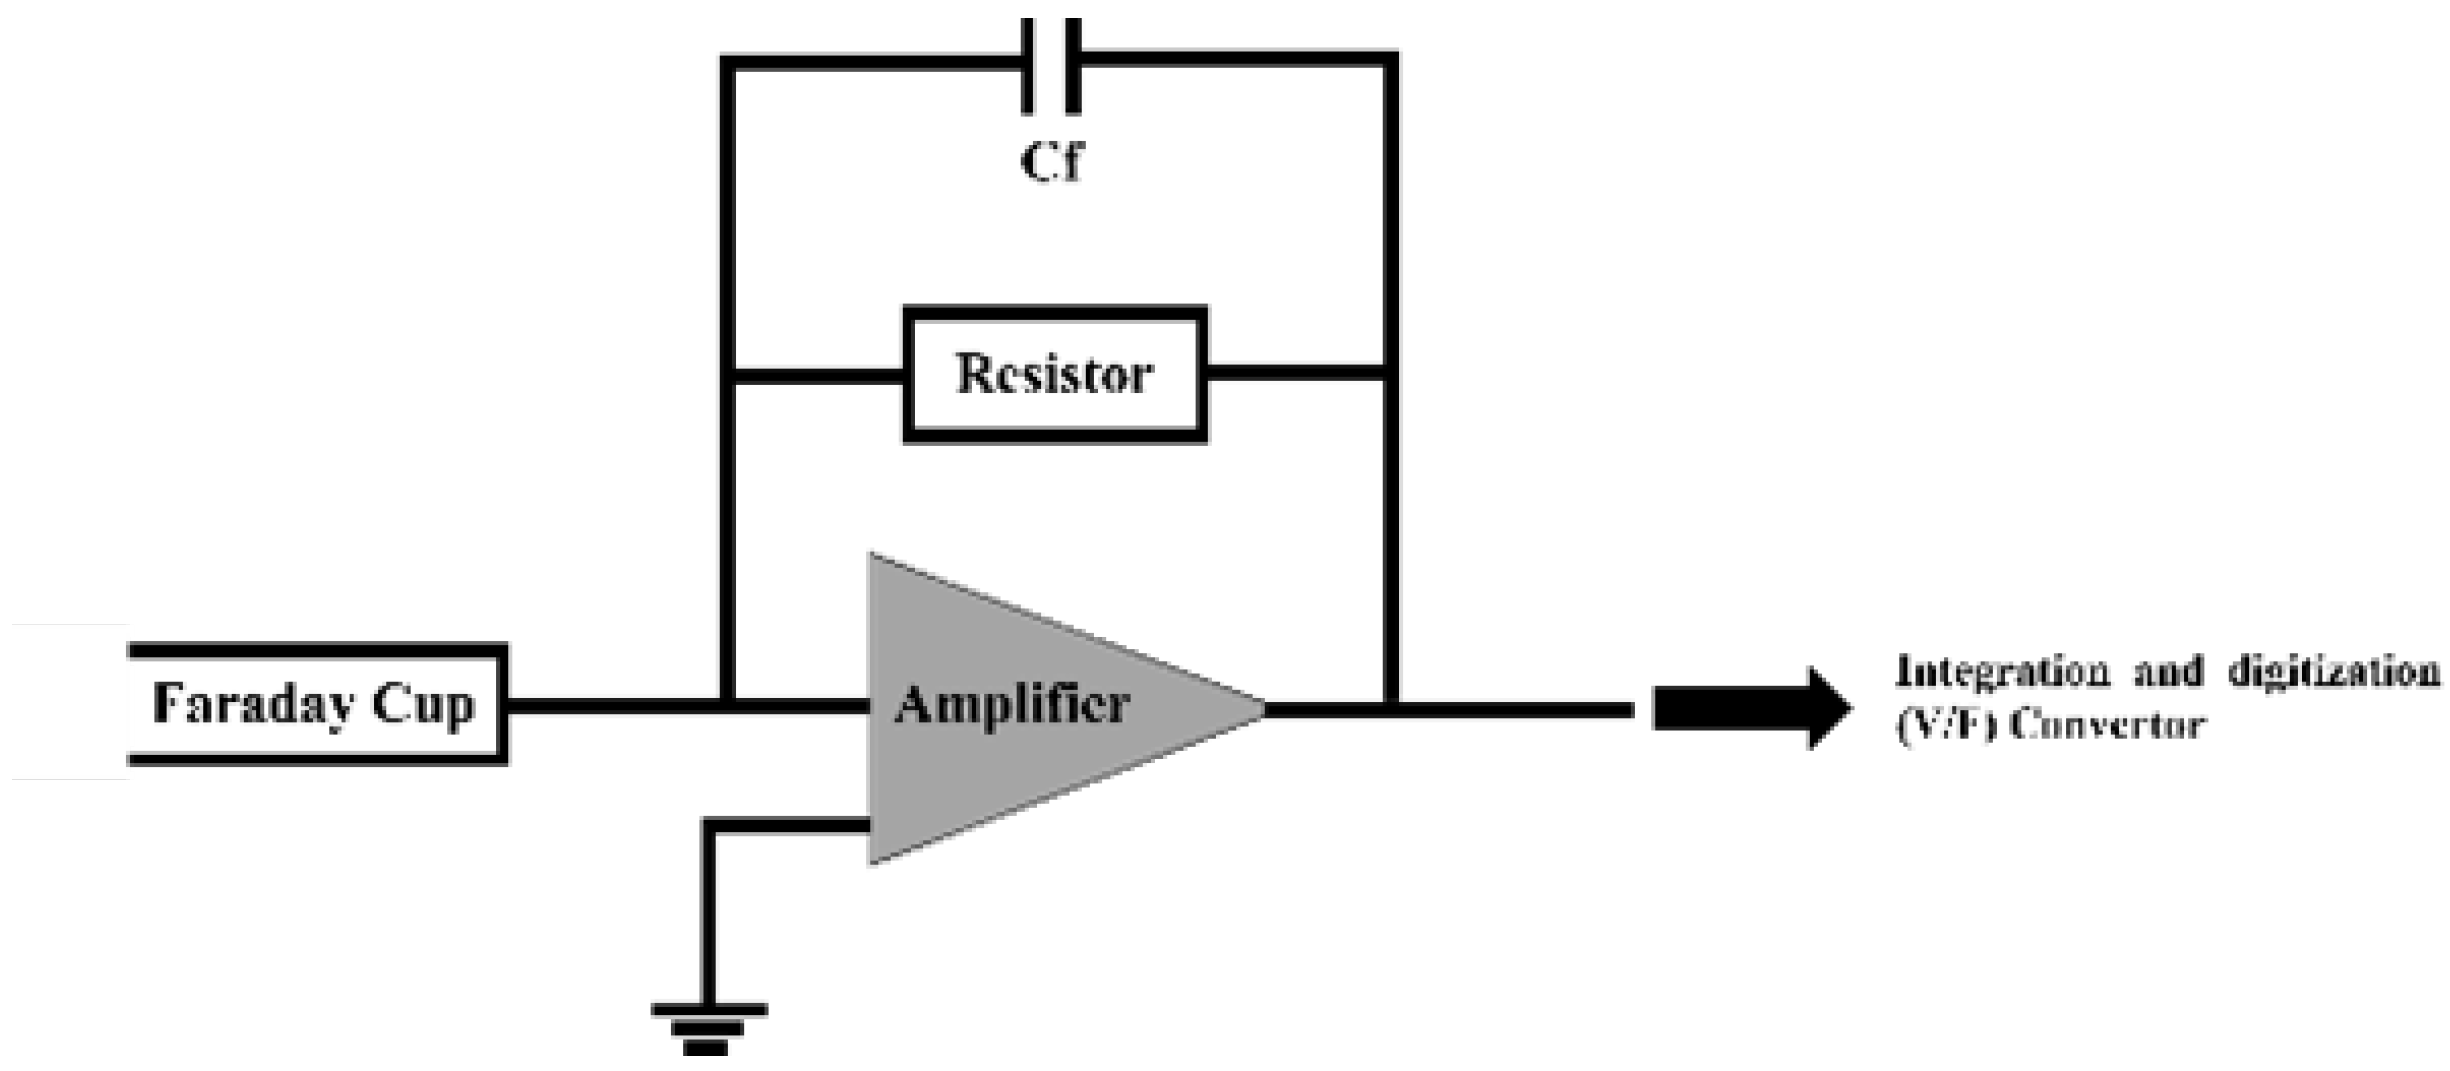
The current signal from an FC is typically in the range from femtoamperes [119,120] to microamperes ( μ A), depending on the beam intensity and type. For low-intensity beams, particularly in nuclear and particle physics experiments, the measured currents can be as low as tens of femtoamperes ( 10 15 A); here, the conversion is performed using a low-noise transimpedance amplifier (TIA), often built around precision operational amplifiers such as the Texas Instruments OPA129, LMC6001, and the Femto DLPCA-200. They are known for ultra-low-bias currents and high-input impedance, suitable for femtoampere-level measurements [121,122,123,124]. The basic circuit for current-to-voltage conversion involves connecting the FC output to the inverting input of the op-amp, with a feedback resistor connected between the inverting input and the output of the op-amp, while the non-inverting input is typically grounded. The output voltage is related to the measured current by Equation (11).
V o u t = I i n × R f
where V o u t is the output voltage, I i n is the input current from the FC and R f is the feedback resistor [5].
The amplifier is connected to a high-value resistor, typically in the range of 10 11 to 10 13 Ω , known as a Resistor Transimpedance Amplifier (RTIA), as shown in the schematic in Figure 17. The TIA circuit is housed in a shielded enclosure to minimize electromagnetic interference (EMI) [5]. Shielded triaxial cables and connectors (e.g., BNC, SMA) are used to connect the FC to the amplifier. For measuring small currents, the predominant error contributing to measurement precision is the inherent electrical noise of the resistor, often referred to as Johnson–Nyquist (JN) noise. This noise, originating from black body radiation within the conductor, is described in Equation (12):
Δ V = 4 k B T R t m
where Δ V is the 1-SD (Standard Deviation) noise in volts, k B is the Boltzmann constant, R is the resistance in ohms, T is the temperature of the conductor in Kelvin, and t m is the integration time in seconds. Thus, if the resistance increases by a factor of 10, then the noise level will only increase by a factor of 10 .

4.1.2. Noise Reduction

  • Radiation Shielding 
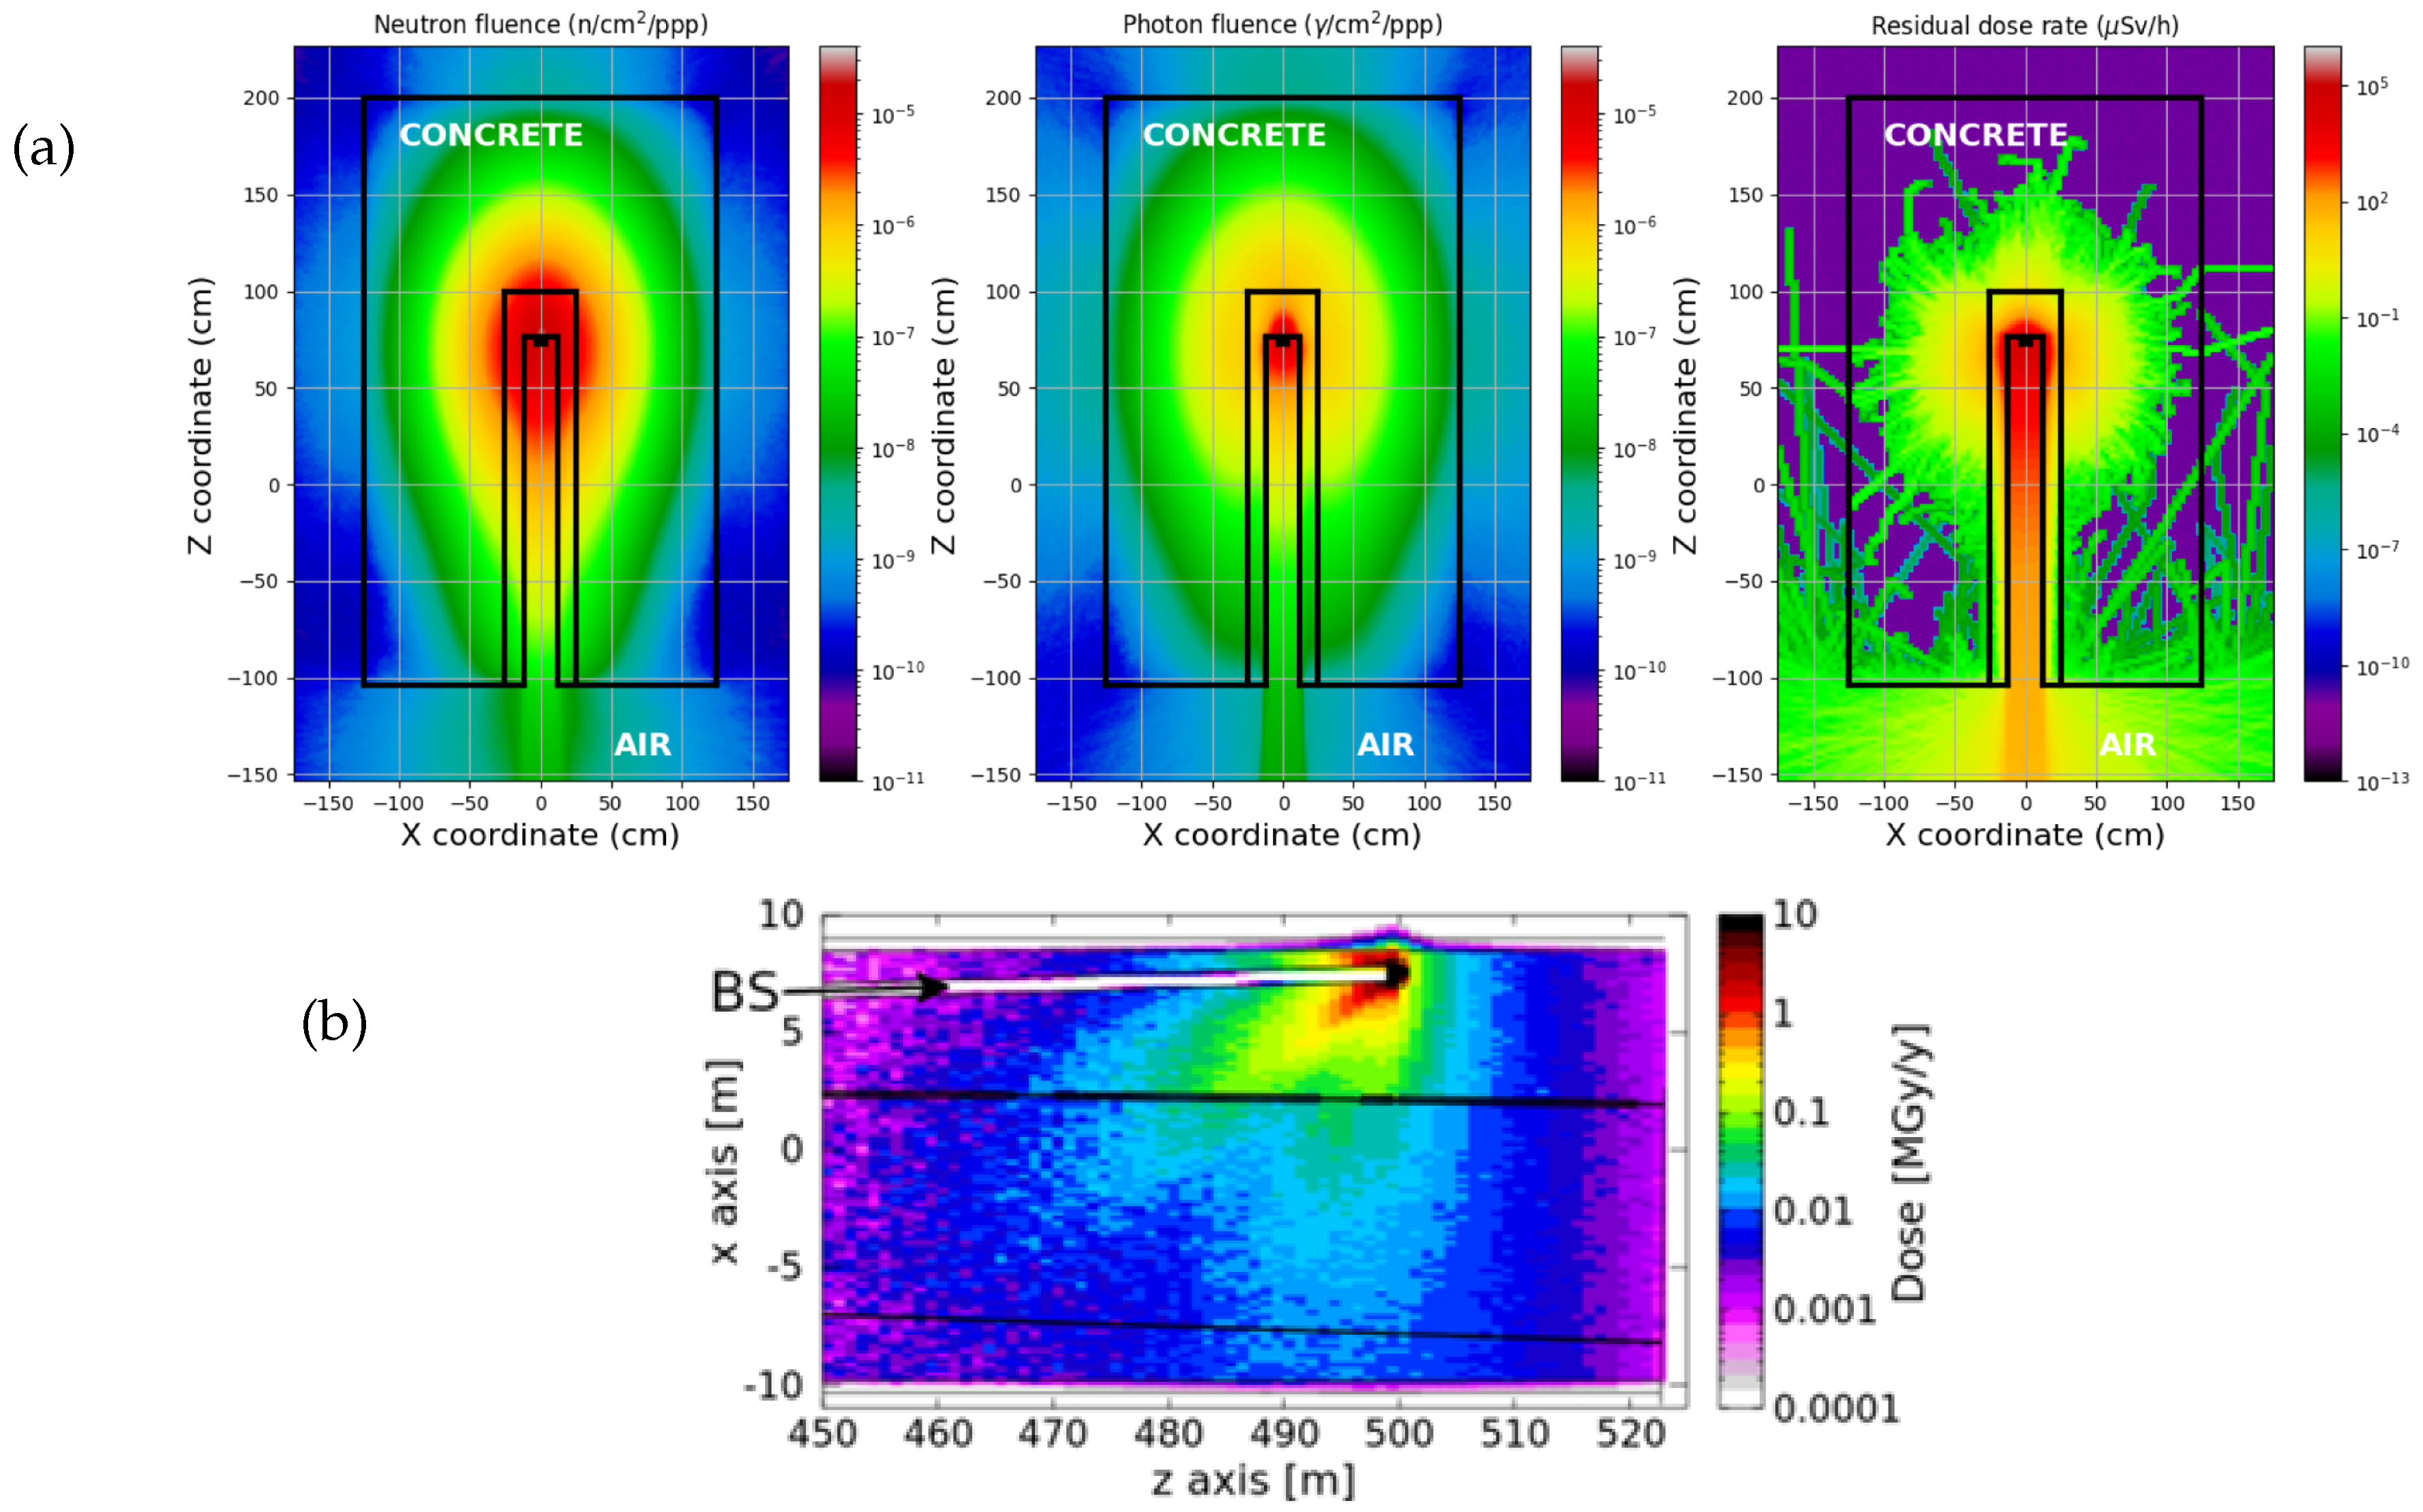
For a certain combination of beam energy and collector material, it is also very necessary to consider the radiation activation of the FC. Codes like MCNP [125] and FLUKA [126] can be used to estimate the activation levels and dose rate for different types of FC material, as shown in Figure 18a,b [127,128]. Figure 18a illustrates the neutron fluence, photon fluence, and residual dose rate for a 75 MeV proton beam where the FC is shielded by concrete and Figure 18b shows the dose caused by bresstrahlung radiation for the planned FCC-ee collider for a liquid lead dump. Moreover, enclosing the FC and signal cables in a conductive shield (e.g., shielded coaxial cables such as RG-223 or triaxial cables) helps protect against leakage and external Electro Magnetic Interference (EMI) [129,130].
Figure 18. (a) Calculated neutron, photon fluence, and residual dose rate for the DTL4 FC shielding for a 75 MeV proton beam by E. M. Donegani et al. [127] (reproduced with permission). (b) Annual dose caused by bremsstrahlung radiation simulated for the planned FCC-ee collider in FLUKA for a liquid lead dump by A. Frasca et al. [128].
Instruments 09 00020 g018
  • Filtering 
Filtering is used to remove unwanted noise and frequency components from a signal. Common filtering techniques are implemented directly after the TIA, e.g., low-pass (RC or active Bessel/Butterworth filters), high-pass, and band-pass filters, depending on the frequency characteristics of the noise and the desired signal. The required bandwidth is typically determined according to the Nyquist criterion [131], as illustrated in Figure 19, where the actual signal (colored waveforms) was filtered using a low-pass Bessel filter.
Common filtering techniques are implemented immediately after the TIA, such as low-pass (RC or active Bessel/Butterworth), high-pass, and band-pass filters, depending on the frequency characteristics of both the noise and the desired signal. The required bandwidth is typically determined according to the Nyquist criterion [131]. The entire analog front end is powered by low-noise linear supplies or batteries to avoid introducing unwanted switching noise.
Figure 19. Typical waveforms from dust impacts onto tungsten (W) foil for 100 V (a) and + 25 V (b) grid bias voltages. The black lines show the filtered signal. The parameters of dust particles are given inside the panels [132] (reproduced with permission).
Instruments 09 00020 g019

4.1.3. Integration and Digitization

For a DC beam, the amplified signal from the FC is often integrated over time to provide a charge measurement, which corresponds to the number of particles incident on the cup. This crucial step can be performed using analog integrators or digital methods.
  • Analog Integration 
Analog integrators use operational amplifiers with capacitive feedback to perform real-time integration of input current as shown in Figure 20. These are implemented using low-drift integrator circuits, such as analog devices AD8628 or Burr-Brown OPA627 in capacitive feedback configurations [121]. The output voltage of an analog integrator is proportional to the total charge collected:
V o u t = 1 R C f 0 t I i n ( t ) d t
where V o u t is the output voltage, R is the input resistor, C f is the feedback capacitor, and I i n ( t ) is the input current as a function of time. Analog integrators offer fast response times and can handle high-frequency signals, but they may suffer from drift and offset issues over long integration periods. They are also capable of amplifying low-frequency noises, which can degrade signal quality. To mitigate issues like these, engineers often employ techniques [133] such as the following:
  • Offset nulling: Using potentiometers or digital correction to counteract the initial offset.
  • Chopper stabilization: Modulating the input signal to reduce the impact of op-amp offset voltage [134].
  • Auto zeroing: Periodically resetting the integrator’s output to zero.
  • Digital integration: For applications requiring high accuracy and long integration times, digital signal processors (DSPs) can be used to perform the integration digitally.
  • Digital Integration 
Digital integration involves sampling the amplified signal at regular intervals and numerically integrating the samples. This method offers greater flexibility and can be implemented using the following:
  • High resolution analog to digital conversion (ADC), such as AD7606, ADS1256, typically with 16 to 24 bit resolution. Their purpose is to convert the amplified and filtered analog signal into a digital form for processing and analysis. The design considerations are high-resolution, with fast sampling rates to accurately capture the signal dynamics.
  • Microcontrollers or FPGAs to perform the integration.
  • Software algorithms for post processing.
Commercial DAQ modules from National Instruments or CAEN, or custom FPGA-based boards (e.g., Xilinx, Altera) are commonly used for high-speed, high-precision data capture [135,136,137]. The digital integration can be represented by Equation (14):
Q = i = 1 n I i Δ t
where Q is the total charge, I i is the current in each sample, Δ t is the time interval between the samples, and n is the number of samples.
Digital integration gives leverage for more sophisticated data analysis, including background subtraction and noise filtering. There are a few considerations that need to be taken into account for integration:
  • Integration time: The choice of integration time depends on the beam characteristics and the required measurement precision. Longer integration times can improve the signal-to-noise ratio but may limit the temporal resolution of the measurement.
  • Reset mechanism: For continuous measurements, a reset mechanism is necessary to prevent integrator saturation. This can be achieved through periodic discharge of the integrating capacitor in analog systems or by resetting the accumulator in digital systems [138].
  • Baseline correction: To handle DC offsets and low-frequency noise, baseline correction techniques may be employed, such as chopper stabilized integrators or digital baseline subtraction algorithms [139].
  • Calibration: Regular calibration of the integration system is a key factor in ensuring accurate charge measurements. This can be performed using known current sources or calibrated pulse generators.
By implementing these integration techniques and considerations, FC measurements can provide accurate and precise charge measurements across a wide range of beam intensities and time scales.

4.1.4. Dynamic Signal Analysis

Dynamic signal analysis (DSA) is vital for accurately capturing and interpreting the time varying signals produced by pulsed beams. It involves the use of specialized techniques to analyze the characteristics of signals that change over time, such as those from pulsed or modulated beams in particle accelerators. This subsection covers the principles and techniques involved in the analysis of these dynamic signals.
DSA lies on an important principle of sampling rate, also known as the Nyquist criterion, which states that, if the sampling rate must be at least twice the highest frequency component of the signal, then a repetitive waveform can be correctly reconstructed. In the context of DSA for FCs, the digitization process starts with the ADC. The continuous analog signal from the FC is sampled at discrete time intervals by the ADC, which is governed by the Nyquist criterion.
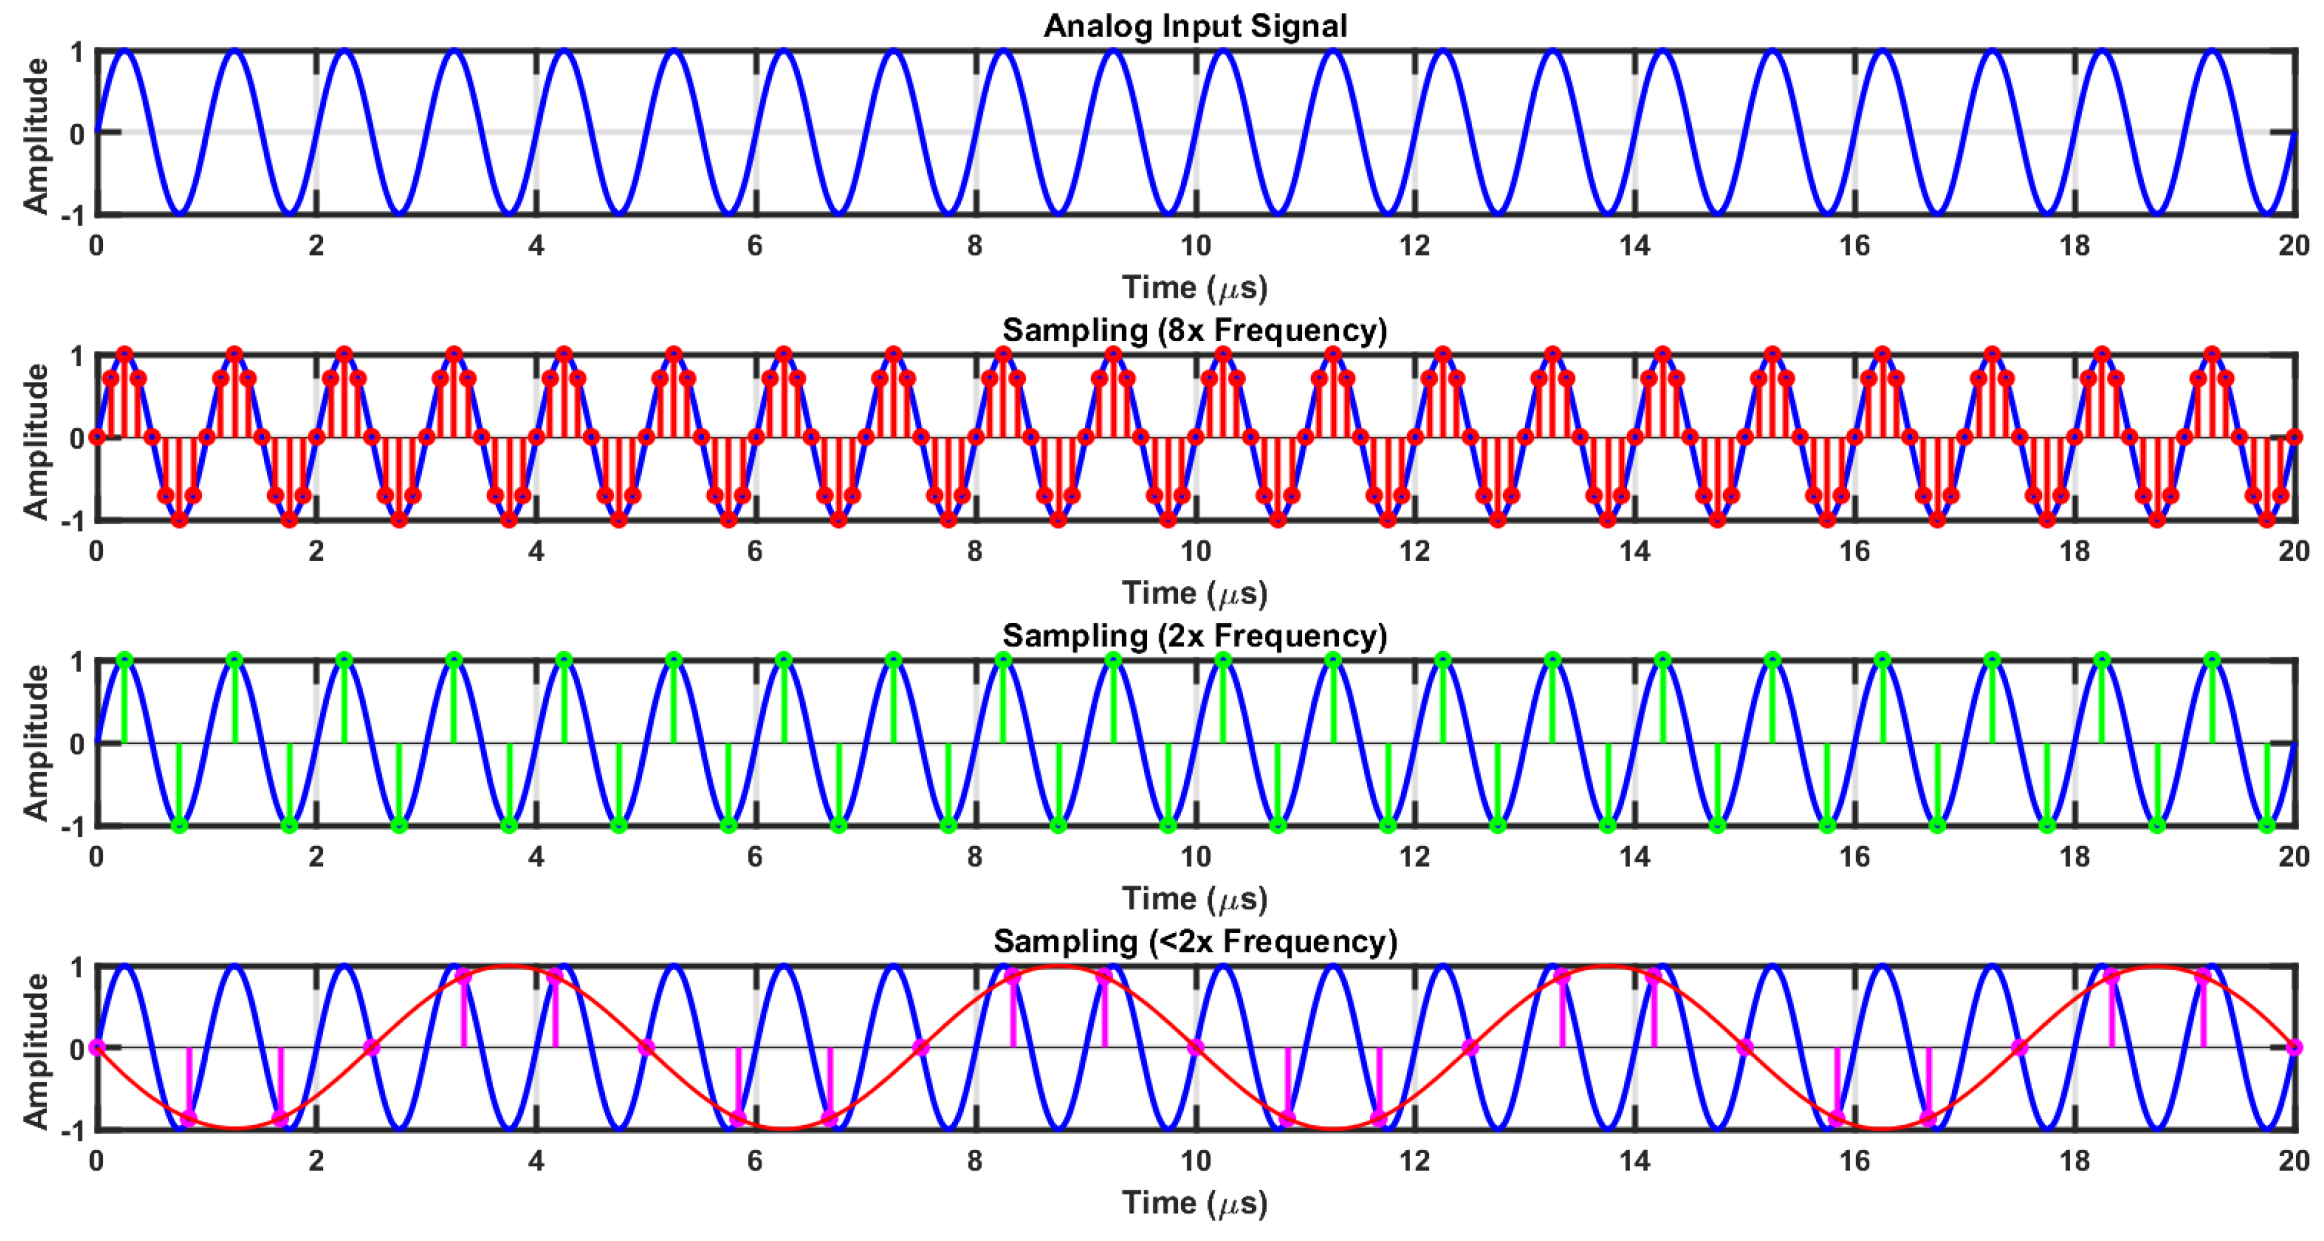
Figure 21 illustrates the impact of different sampling rates on the conversion of an analog input signal to a digital signal. The colored lines connecting the sampled points in each subplot illustrate how a basic interpolation might reconstruct the signal from the samples. The first subplot shows the input signal to be sampled for a time period of 20 μ s. In the second subplot, the signal is sampled at f s = 8 f , where f is the signal frequency. This oversampling condition provides a dense set of sample points that accurately reconstruct the original waveform without any visible distortion or aliasing. In the third subplot, the signal is sampled at f s = 2 f , which corresponds to the Nyquist rate. In this case, the sample points still allow perfect reconstruction, in theory; however, the effective representation is less intuitive, as only two samples per cycle are available, and the apparent waveform seems to oscillate more slowly. Finally, the fourth subplot demonstrates sampling below the Nyquist rate, with f s = 1.2 f < 2 f . Here, aliasing occurs, producing an apparent low-frequency waveform (red curve) that fits the sampled points, even though the actual analog input remains at 1 MHz . This lower frequency pattern is the aliasing wave, which can mislead a discrete-time system into interpreting a high-frequency signal as a slower one. These three cases demonstrate the importance of the Nyquist criterion in preventing aliasing and ensuring accurate signal reconstruction.
Figure 21. Sampling rate of analog–digital converter [140].
Instruments 09 00020 g021
In the digitization process, quantization introduces a small error, known as quantization noise, resulting from the difference between the actual analog value and the nearest quantized level. The resolution of the ADC, determined by the number of bits, dictates the precision of the digitized signal, with higher resolutions reducing the impact of quantization noise [141]. Practical considerations in dynamic signal analysis include proper triggering mechanisms, which are essential in accurately capturing the relevant portion of the pulsed signal. Without this, the critical parts of the signal might be misaligned, leading to inaccurate analysis [142]. Additionally, high-speed data acquisition generates substantial volumes of data, which demands efficient storage solutions and real-time processing capabilities to handle and analyze the data effectively. Furthermore, error analysis is also crucial, involving the evaluation of the impacts of sampling rate, bandwidth, and quantization on the overall measurement accuracy. Regular calibration of the ADC and the entire signal processing chain ensures consistent and reliable performance. All of these considerations ensure that the digitization process is well optimized for precise and accurate signal analysis, contributing significantly to the effectiveness of FCs in experiments.

4.2. Data Acquisition

4.2.1. Data Acquisition System (DAQ)

DAQ systems are employed to collect and store digitized signals from the FC for analysis. Modern DAQs typically include high-speed ADCs, Field-Programmable Gate Arrays (FPGAs) for signal processing [143,144], data storage units, and software interfaces for real-time monitoring and control. These systems enable precise measurement of beam currents, often with nanosecond-scale time resolution [145], and can handle data rates up to several gigabytes per second.

4.2.2. Real-Time Processing

Real-time data processing is essential for applications that require immediate feedback, for example, adjusting the magnetic field, beam tuning, and stabilization in accelerators. Advanced algorithms implemented on FPGA platforms [143] (such as the Xilinx Zynq-7000 SoC [146] or Altera Cyclone V boards) or GPUs can perform tasks such as signal averaging, peak detection, noise reduction, and trend analysis in real time [147].

4.2.3. Synchronization

For complex experiments involving multiple detectors or synchronized measurements, precise timing and synchronization are crucial, which can be achieved using programmable delays, distributed timing systems like GPS (Global Positioning System)-based clocks, or CERN White Rabbit timing modules [148], which are solutions to synchronize multiple DAQ channels with sub-nanosecond accuracy [149].

4.2.4. Data Analysis

Post-acquisition data analysis involves processing the collected data to extract meaningful information, such as beam intensity, profile, and stability. Advanced analysis techniques can include statistical methods, Fourier analysis, visualization techniques, and machine learning algorithms in ROOT, developed by R. Brun and F. Rademakers [150].

4.2.5. DAQ System Design

To ensure accurate and reliable measurements, the design of the DAQ system for FCs involves signal conditioning as the first step, where the signal is prepared for digitization by amplifying, filtering, and isolating it. This step confirms that the signal is within the appropriate range for the ADC and free from noise and interference [5]. The next step is to configure the ADC, which involves choosing the appropriate sampling rate and resolution depending on the expected signal characteristics. The sampling rate must be high enough to capture the relevant details of the signal (the Nyquist criterion), while the resolution should be good enough to provide the desired level of precision.
Digitized data are typically acquired using modular systems, such as National Instruments PXI (PCI eXtensions) or CAEN VME (Virtual Machine Environment) digitizers, which integrate analog front ends, timing synchronization, and high-throughput data buses (Table 4). Once the signal is digitized, it needs to be stored and analyzed. This involves using software tools to store the digitized data (e.g., RAID (Redundant Array of Independent Disks) arrays) for further analysis [25]. Real-time processing and visualization are implemented using the EPICS (Experimental Physics and Industrial Control System) [151], LabVIEW (LABoratory Virtual Instrument Engineering Workbench), or FPGA firmware, while analysis is performed in platforms like ROOT, MATLAB (MATrix LABoratory), or Python.
Therefore, signal processing and data acquisition are two integral parts of the effective use of FCs in particle beam diagnostics. Table 4 summarizes representative hardware components that are commonly employed in FC signal processing and DAQ systems, highlighting typical models and specifications used in experimental practice. By employing sophisticated amplification, filtering, integration, and digitization techniques, followed by advanced data acquisition systems, high accuracy and reliability in their measurements is usually achieved.

5. Fast Faraday Cup

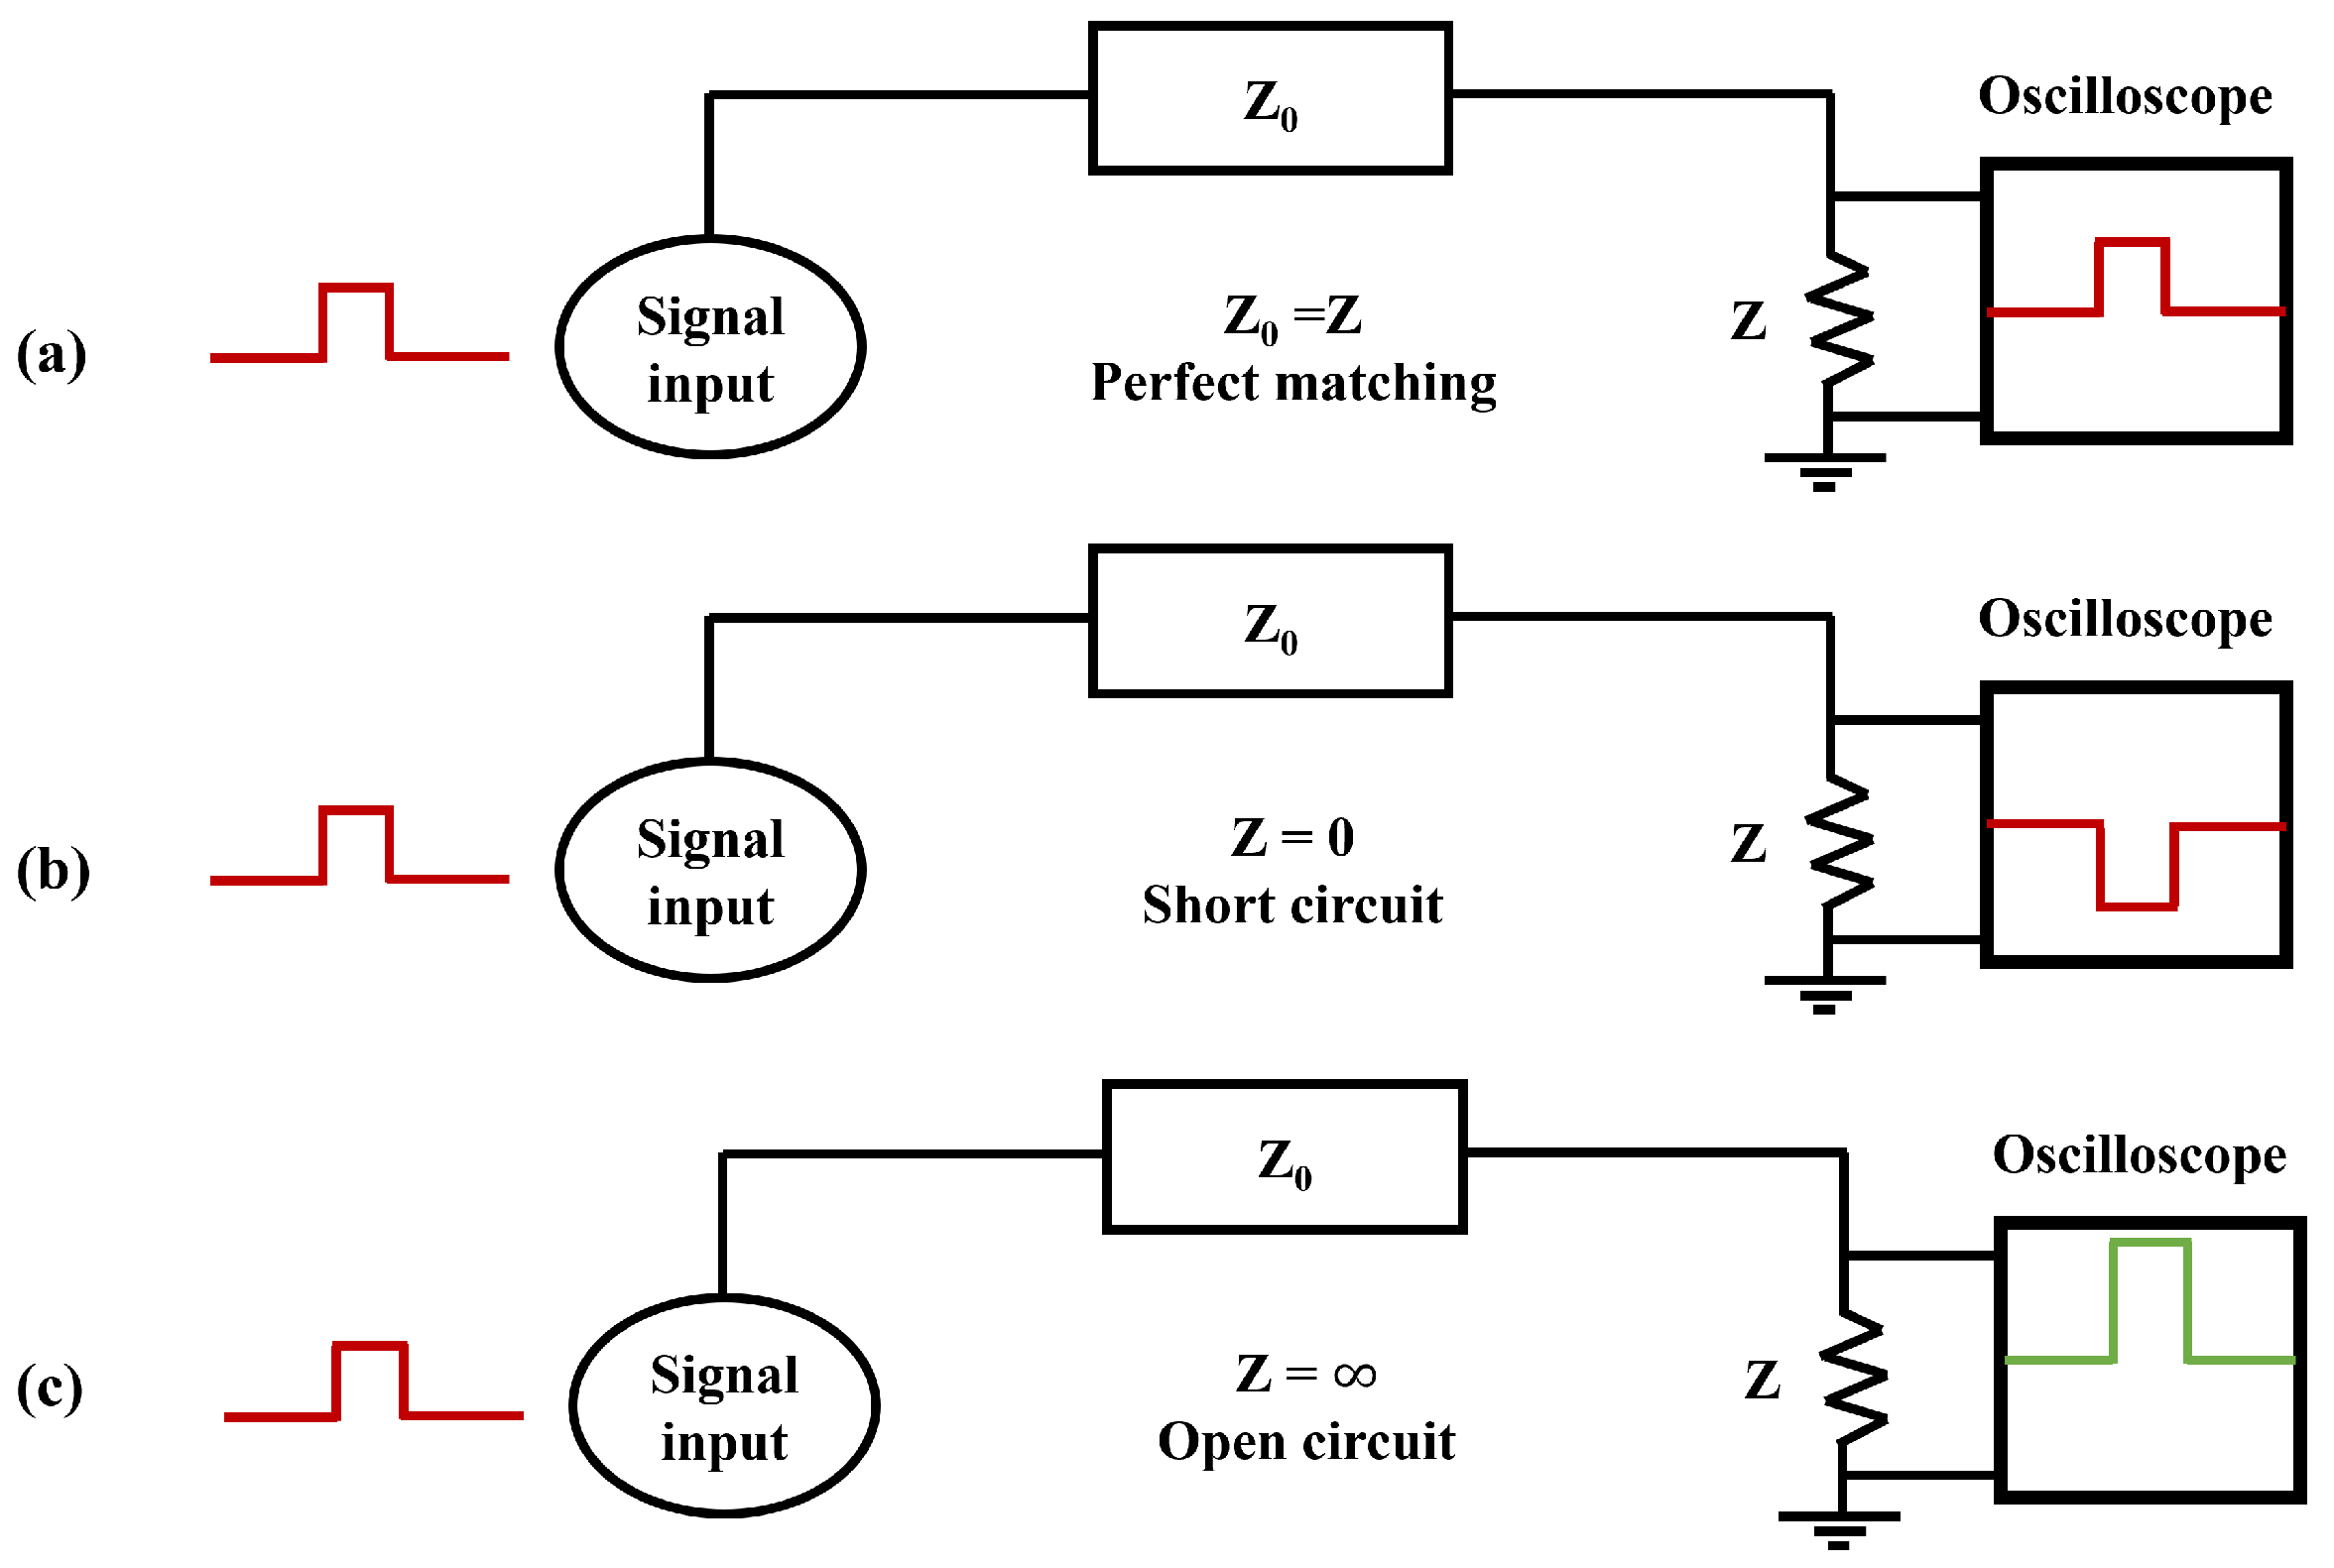
Fast Faraday Cups (FFCs) are modified forms of standard FCs, tailored specifically for detecting rapidly varying charge distributions over time [152]. To estimate fast-pulsed signals, the bandwidth of the FC must be matched with the transmission line and to the load, usually a low-impedance amplifier. A factor defining the quality of matching is the voltage reflection coefficient, ( ρ v ) , given by Equation (15) [38].
ρ v = Z Z 0 Z + Z 0
where Z 0 is the impedance of the transmission line and Z is the load impedance.
  • Z = Z 0 : perfect matching, no reflections. Z = 0 , ρ v = 1 : short circuit, the reflected signal has the same amplitude but opposite sign. Z = , ρ v = 1 : open circuit, the reflected signal has the same amplitude and sign.
These conditions are schematically represented in Figure 22 along with the signal waveforms. Moreover, apart from the impedance mismatch, it should be noted that the broadening of fast signals can occur due to the emission of secondary electrons [38,153] and they can be emitted with different energies and start times. Furthermore, depending on the charge of the incident ions, the signal amplitude can be enhanced or attenuated depending on secondary electron emission.
There are two other aspects that must be considered when evaluating the measured signal. The first is the broadening of the fast signals due to the emission of secondary electrons; the second is that, depending on the charge state of incident ions, the signal amplitude may be enhanced or attenuated by the secondary electron emission.
For particles moving with v < < c towards the FC, we also must consider advanced electrical field bunches, which cause errors in the measured signal due to a displaced current induced in the FC material. This effect of the advanced electric field cannot be shielded by the electric field in front of the FC. However, it can be compensated for using a shielding grid before the stopper surface so that it repels the secondary electrons back to the cup, as well as canceling the advanced electric field.
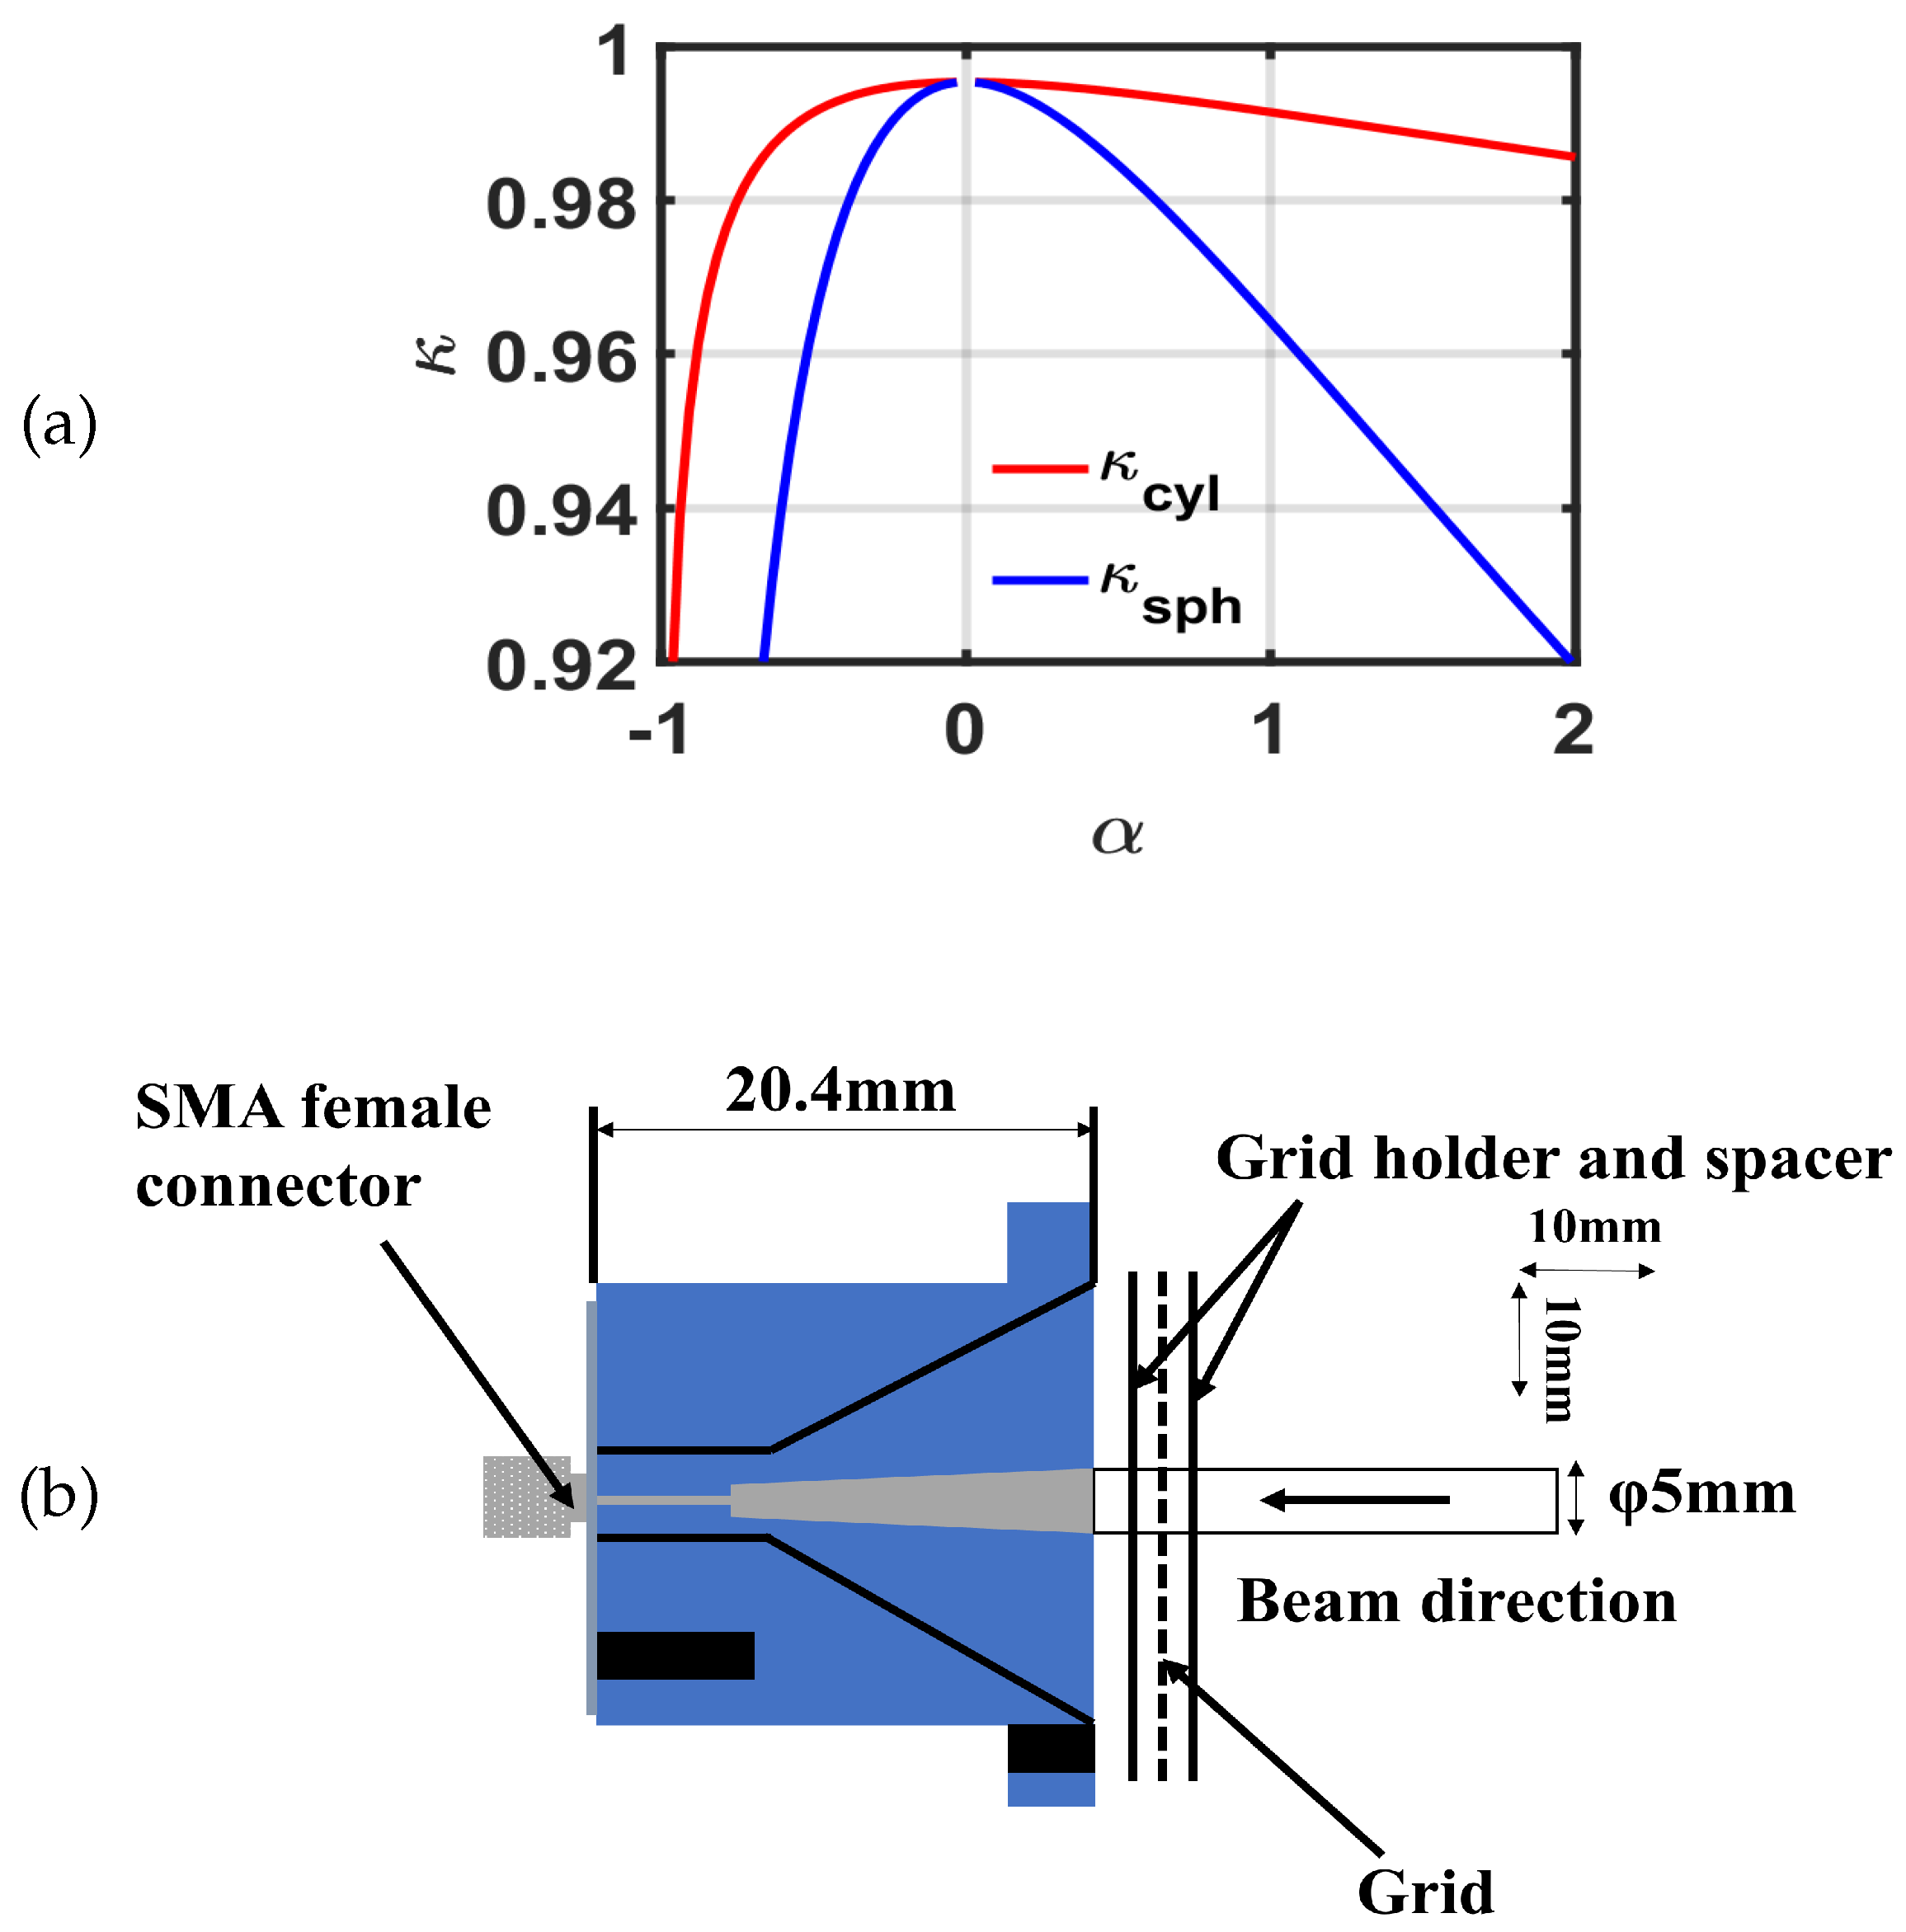
Shemyakin [154] gave a simplistic model for estimating the elongation factor κ for planar and cylindrical electrodes in a 1D geometry. For planar electrodes where the transverse dimensions of the FFC electrodes are much larger than the inter-electrode gap, d, the value of κ is constant and is around 0.29. In cases of cylindrical geometry, the expression is given by Equation (16). The schematics of each of these cases are shown in Figure 23a–d.
κ cyl = 2 L 2 α + α L 2 α L 2
where α = d / R c , d is the aperture diameter, R c is the collector radius, and L = ln ( 1 + α ) . Note that, in the limit α 0 and d R c , one gets the value of κ cyl = 0.29 , similar to that of the planar case. For the spherical case, the coefficient is given by Equation (17).
κ sph = 1 + α α 2 1 ( 1 + α ) 2 α 2 L 2
The typical values of the geometric coefficient for the cylindrical (red) and spherical cases (blue) are plotted so they are normalized (Figure 24a) to the value for the planar case (0.29), as a function of the gap-to-collector ratio α . For example, for a 3 MeV proton beam, having a typical bunch length of 0.5 ns and an FFC having a gap d = 3 mm, R c = 3 mm, α = 1 , the bunch length in case of cylindrical geometry is given by σ FFC = κ cyl τ = 0.991483 × 0.5 ns = 0.4957 ns , where the coefficient corresponding to α = 1 is determined from Figure 24a. Several papers on the FFC design are available in references [4,8,155,156]. The FFC design by Bellato et al. for the ALPI post-accelerator is shown in Figure 24b.

6. Conventional FCs in Antimatter Research

Antimatter research is another area where FCs have been used regularly; however, their measurement accuracy is very limited in various experiments [157,158,159,160,161]. For example, this was the case in ALPHA (Antihydrogen Laser Physics Apparatus), which used an FC to measure the number of positrons left in the trap after cooling in the Surko style buffer gas trap [162,163]. The FC used in ALPHA consists of aluminum foils, which also act as the final degraders for antiprotons, and it is sensitive only to bunches of more than a hundred particles. Detecting antiprotons (charged antimatter particles) using a conventional FC design is challenging; this is mainly because, during an antiproton annihilation event, a range of daughter nuclei and fragments can be produced. Lighter fragments, in particular, are emitted with very high kinetic energies, typically in the MeV to GeV range [5,164]. Due to their high energy, these particles are difficult to confine using electrostatic or magnetostatic suppression techniques. Additionally, neutral particles such as neutrons and photons, which are not influenced by electromagnetic fields, can escape the detection region, resulting in further charge loss from the FC surface.
A typical energy spectrum of charged particles formed after the annihilation of a 300 keV antiproton beam on an aluminum target is shown in Figure 25. A way to calibrate FCs for antiprotons is to use MC simulations and account for the charge lost due to the annihilation/fragmentation processes, generating a calibration curve to correct the measured current. However, in antimatter experiments, FCs are more commonly used to count electrons and positrons [165].
The BASE (Baryon Antibaryon Symmetry Experiment) apparatus at CERN uses four FCs consisting of segmented plates as a degrader to characterize the incoming antiproton beam [166]. ATRAP (Antihydrogen Trap) [167] used a FC to count the positrons inside their experiment. Furthermore, other experiments like AE g ¯ IS (Antimatter Experiment: Gravity, Interferometry, and Spectroscopy) have reported using FCs for measuring the charge of a positron beam, which is usually cross-checked with scintillation detectors [119,163,168,169,170,171]. In AE g ¯ IS, the typically metalized front face of a Micro Channel Plate (MCP, F2224 Hamamatsu) is connected through a precisely known 100 k Ω resistor to the ground. Any deposited charge on that MCP changes the potential against ground, and a current equal to the deposited charge over time is drawn to equilibrate the MCP front face. The standard FC measurement technique is utilized for the measurement of the current, as detailed in the previous section.
A systematic uncertainty was identified by Fitzakerley [21], which provided a process of calibrating the FC for positron counting. Therein, a systematic difference between positrons and electrons was exposed. Upon striking the FC, electrons deliver their negative charge. If they possess enough energy, they can eject extra electrons from the surface, producing secondary electrons. For an MCP, this would be the desired mechanism to image the particle beam profile. These secondary electrons leave the surface, and the net deposited charge may be zero or even positive. Hence, a common mitigation technique is to bias the surface. Since the secondary electrons are only of a few tens of eV, a small positive bias re-attracts them and prevents the escape of any charge. Altogether, for electrons, the effective deposited charge ranges between 0 and n elementary charges (e) depending on the implantation energy and whether a bias is applied or not. Positrons deposit a single positive elementary charge, which remains there even if the positron annihilates with an electron; it is as though one electron had disappeared to begin with. However, if the kinetic energy of the positron is large enough, it also releases secondary electrons. Again, this can be prevented with a positive bias potential on the surface, as shown in Figure 26. However, in this case, at voltages >60 V, the positron beam energy was matched and positrons were repelled before reaching the FC.
As an example, at AE g ¯ IS, the MCP front face cannot be biased; hence, one suffers from the uncertainty that each impinging positron can produce 1 to n positive elementary charges. Since the positron beam energy is rather large, and thus the positron implantation is deeper, the efficiency in producing secondaries is limited and could be estimated using positron implantation models [172,173]. An additional uncertainty using the MCP as FC arises due to the microchannels leading through the detector. The fate of secondary electrons is therefore influenced by the strong bias voltage across the stages of the MCP, which very efficiently attracts and multiplies these electrons non-linearly.
The development of FCs for the accurate detection of antimatter beams remains challenging, primarily due to the escape of high-energy secondary particles produced by the annihilation of antimatter particles upon interaction with the nuclei of the FC material. These escaping particles lead to significant charge losses. At present, the most viable approach to mitigate this issue is to calibrate the FC response using Monte Carlo simulations, which allow for an estimation of the expected charge loss and correction factor for the measured signal.

7. FCs for Mass Spectrometry

Mass spectrometers are devices that are used to measure the mass–charge ratio of ions for various applications. It typically involves plotting ion signals as a function of the mass–charge ratio, which aids in determining isotopic signatures, and the mass of particles or molecules. J.J Thomson invented the world’s first mass spectrometer, calling it the “parabola spectrograph” in 1912 [174]. Modern mass spectrometry was pioneered by Arthur Jeffrey Dempster in 1918 [175] and F. W. Aston [176] in 1919. Sector mass spectrometers, known as Calutrons, were invented by Ernest O. Lawrence [177] to separate uranium isotopes during the Manhattan project and for uranium enrichment at the Oak Ridge, Tennessee Y-12 plant.
The important components of a mass spectrometer consist of an ion source, a mass analyzer, and a detector, as shown in Figure 27. Various techniques are utilized depending on the sample to be analyzed and on its phase (solid, liquid, and gas). An extraction system removes ions from the sample which is later passed through a mass analyzer (bending magnet) into a detector (FC). In the mass analyzer, the Lorentz force governs the separation of particles due to the presence of electric and magnetic fields inside the vacuum. The Lorentz force is given by Equation (18):
F = q ( E + v × B )
where E is the local electric field vector, v is the velocity vector of the particle, and B is the magnetic field vector. Furthermore, when a particle is extracted from the ion source, it is accelerated towards the mass analyzer, so at non-relativistic velocities it experiences a force given by Equation (19):
F = m a
Equating the above two equations, we get Equation (20):
m a = q ( E + v × B )
Equation (20) can be used to describe the motion of a particle in the electric and magnetic field for a given m / q ratio. Miniature FCA detectors based on printed circuit board technology have been developed for position sensitive ion detectors [179]. Similarly, K. H. Gilchrist [180] reported on the development of a micro FCA on a PCB (printed circuit board). The detector consisted of a linear array of FCs created with a novel fabrication process that allowed a much shorter cup spacing (of 5 μ m) than previously achieved. J. M. Schneider et al. [181] conducted important studies on the effect of FC deterioration used in thermal ionization mass spectrometry with Sr and Cr isotope analyses. The systematic studies were conducted over a period of 56 months and showed that the accuracy of the FC deteriorated over prolonged periods. A. Scheidemann et al. [17] developed an FC detector array, which allowed them to achieve a sensitivity of 0.8 pA at a 10:1 S/N ratio. The development of robust mass spectrometers equipped with multichannel detection capabilities is well suited for handling small sample volumes and enables high throughput testing. Enhanced mass resolution, reduced size, and lower costs can be achieved by utilizing smaller flight chamber (FC) dimensions, offering a universally applicable solution for diverse chemical analysis challenges.

8. FCs for Broad Ion Beams

8.1. Electric Propulsion

For small-sized beams, like in particle accelerators, a single FC can be utilized to capture all the particles and estimate its total current/charge. However, if the beam size is too large, such as in electric thrusters or Neutral Beam Injector (N.B.I) applications, a Faraday Cup Array seems to be a more viable option for monitoring the beam properties [182]. For broad beams, especially in gridded ion sources/Hall thrusters, the plume expands under its own space charge inside the vacuum chamber and usually follows a Gaussian profile [183]. However, standalone FCs are also used to characterize particle beams in ground tests and in space as particle detectors and energy analyzers.
Comprehensive work was performed on the development of the FC detectors in the 1960s by H. H. Hilton at the Space physics laboratory to study low-energy charged particles in the range of 1–10 keV, which were later put in orbit in 1968 [184]. This was mainly developed in a multi-grid configuration, so that it works as an energy analyzer for different-charged particles in the magnetosphere, as depicted in the schematic shown in Figure 28a. Figure 28b shows the number of typical energies of electrons/protons detected by the in-orbit FC from the missions between 1964 and 1969. Rawat et al. [24] developed an FCA to measure beam profiles for a ring cusp ion source. It had eleven channels with conical FC collectors made from copper to measure the ion beam current density profiles. The profiles were later used to estimate the total beam current by integrating the measured one-dimensional profiles, assuming a 2 π symmetry. If the beam profile is assumed to follow a Gaussian distribution, then the total integrated beam current by the FCA is given by Equation (21):
I = 0 2 π r J 0 e r 2 / 2 σ 2 d r
where J 0 is the maximum current density, r is the radial location from the center, and σ is the 1/e width of the Gaussian distribution function. Integrating Equation (21) within the limits of 0 to , we get an expression for the total integrated current measured by the FCA:
I = J 0 π σ 2
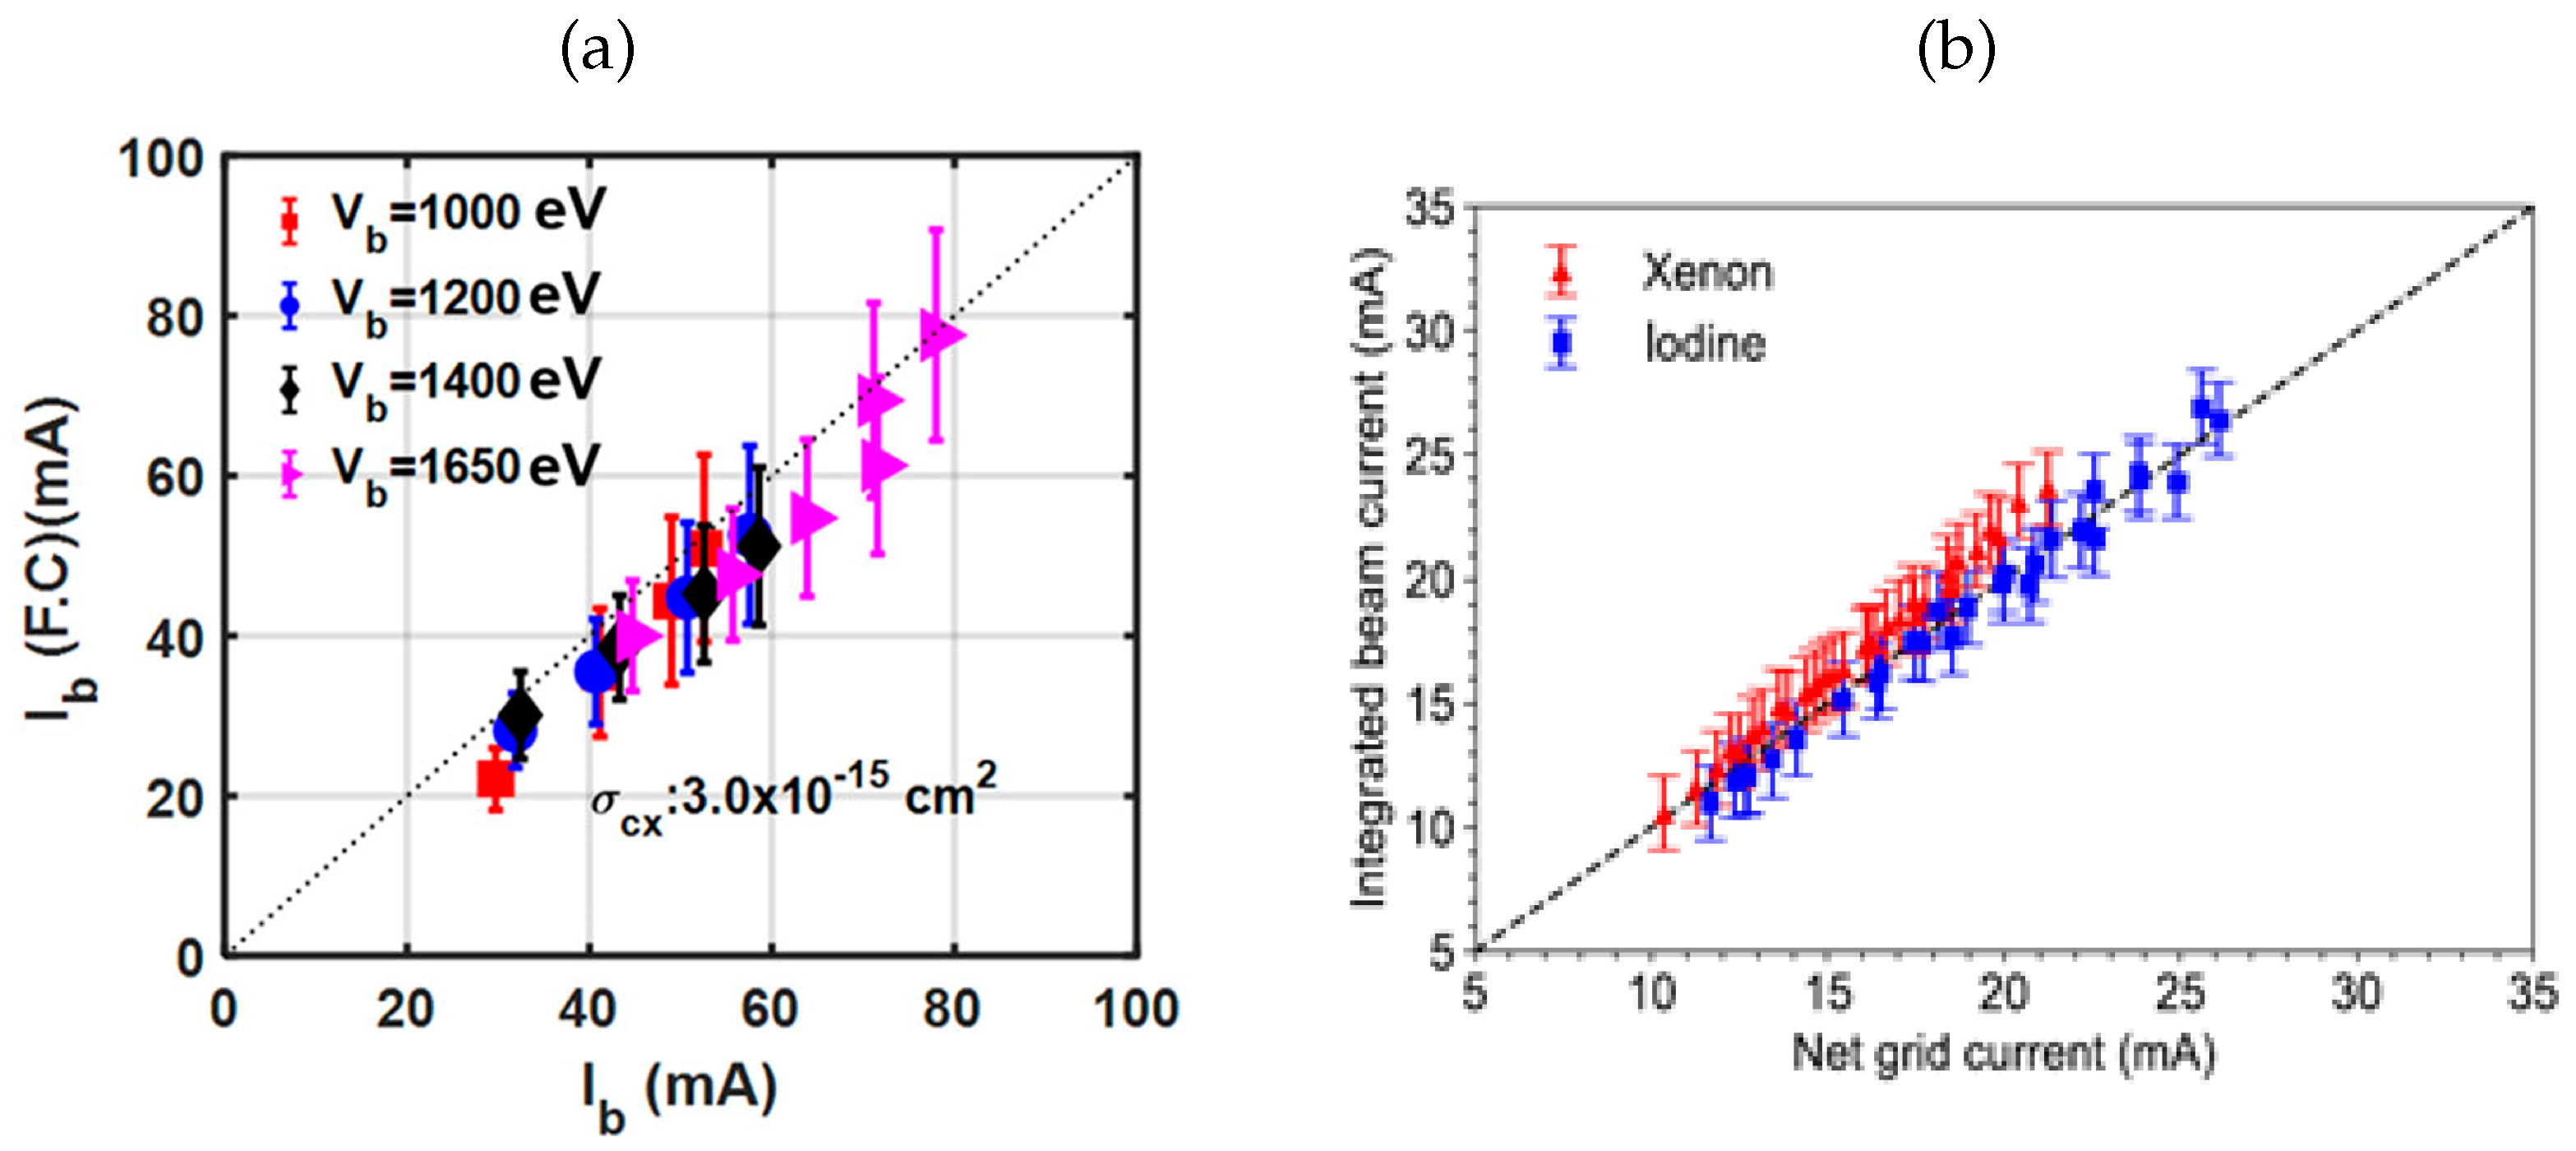
The assumption of 2 π symmetry works well for beams extracted from point or circular sources. Figure 29a shows the calibration results from [24], demonstrating a good agreement between the beam current measured by the FCA and the electrically measured current using a current transformer. The current on the x axis I b is the current measured in the external circuit using the current transformer, whereas the current shown on the y axis, I b ( F . C ) , is the integrated beam current obtained from the measured current density profiles using the FCA. The legend represents the beam extraction energy V b in units of eV. Habl et al. [185] developed an automated FCA system to map the two dimensional ion beam profile using a semicircular probe array for a miniature ion thruster based on the xenon and iodine propellant shown in Figure 30a. They also derived a formula to estimate the number of probes required to measure the ion beam profile with some divergence. The number of probes, N p ( θ ) , can be calculated using Equation (23):
N p ( θ ) = k 2 erf θ 2 β
where k is a constant, erf is the error function, β is an angle proportional to the divergence of the beam, and θ is the angular position of each probe. In the case of Habl et al., the integration was performed in both directions of the current density field. The total integrated current ( I b ) in this case is given by Equation (24):
I b = R 2 π 2 π 2 π 2 π 2 J i ( φ , θ ) cos ( θ ) d φ d θ
where R is the radius of the instrument and J i ( φ , θ ) is the ion current density measured at a given angular position. Again, a good agreement was found between the electrically measured beam current and the current estimated from the profiles measured using the FCA, as shown in Figure 29b. Hugonnaud et al. [22] carried out optimization studies for designing an FCA for characterizing a field emission thruster shown in Figure 30b. Different collimator materials, aperture diameters, and polarization voltages were studied to determine the optimal design. Other important FC designs for electric propulsion/thruster applications can be found in several references [186,187,188,189,190,191,192,193,194,195].
The estimation of ion beam current due to fast ions becomes extremely challenging in ion/hall thrusters due to the charge exchange process that occurs when the fast ion beam interacts with neutral gas particles in the background. Hofer et al. [196] compared the effectiveness of using a nude and a collimated FC in measuring the current density of a Hall thruster shown in Figure 31a. For nude FCs, it is difficult to estimate the correct collection area due to sheath formation on the FC surface by plasma interaction. Thus, the measured current is usually underestimated due to the increased collection area and it becomes important to use the correct sheath expansion theory [197,198,199] to estimate the accurate beam current. Despite the inconclusive results, the study provided a good direction toward the testing and modeling of such FCs for measuring current densities.
Rawat et al. [200] developed an FCA for measuring current density profiles in a ring cusp ion source by filtering the charge exchange ions using a three-electrode design. The Ground Grid (G.G) is kept at the ground potential, whereas the second Suppressor Grid 2 (S.G2) and the first Suppressor Grid 1 (S.G1) are at a negative potential to filter primary electrons and suppress secondary electrons, respectively. The FC is biased positively such that it creates a retarding field for the slow moving charge exchange ion, as shown in Figure 31b. Kucerovsky et al. [201] described a rigorous analytical model for a dynamic FC. They were able to determine the charge distribution and give useful approximations in determining the dynamic response of the cup with experimental verification of their model. Brown et al. [25] conducted a comprehensive work on the recommended practices that should be followed while using FC for the characterization of electric propulsion devices. They tested the effect of background neutrals in both near-field and far-field plume measurements with multiple thrusters tested at different facilities. One of the key recommendations from the paper is that the plume measurement at each distance should also be conducted at the minimum of the four background pressures to enable the extrapolation to space like conditions in ground testing, and one of the four background pressures should be the lowest achievable facility pressure during the thruster operation.

8.2. Thermonuclear Fusion Reactors

In thermonuclear-fusion-related applications, the confinement of α particles formed during the deuteron–tritium reaction is very crucial in maintaining a self-sustaining burning plasma. The fast ions are generated in the core of the plasma and, due to various instabilities, they escape from the core and carry the largest fraction of the energy, thereby reducing the plasma lifetime and performance. If the flux of these escaping α particles is high enough, they can damage the reactor’s first wall, which is a crucial component of a fusion reactor. To study the loss of these fast α particles, FCs are used [155,202,203,204] as a diagnostic in different fusion reactors. Some other important work for designing FCs for neutral beam/thermonuclear fusion applications and fast ion loss detectors can be found in several references [8,28,30,155,205,206].
In devices like TOKAMAKs [207,208,209,210], it is challenging to guide a charged ion beam directly into the plasma core due to the strong confining magnetic fields, which significantly alter the trajectory of charged particles. To address this issue, Neutral Beam Injectors (NBIs) are employed [211,212,213]. These devices utilize charge exchange reactions to convert high-energy ions generated in an ion source into a beam of neutral atoms. Being unaffected by magnetic fields, the neutral atom beam can penetrate deep into the plasma core, where they dump their energy to the plasma core, thereby increasing its temperature. However, once the ions are neutralized, measuring the beam current becomes difficult using conventional FC designs, since these rely on charge collection for current detection. Okamoto et al. [31] developed a technique of measuring the neutral beam flux by controlling the secondary electrons using a biased grid in front of the FC. As shown in Figure 32, when Grid 1 is biased to a sufficient negative voltage, the secondary electrons are completely suppressed, and the total collector current ( I c ) is given by Equation (25).
I c = e S γ i
where S and γ i are the collecting area and the beam ion flux, respectively. Whereas if Grid 1 is biased to a positive potential, all secondary electrons are emitted from the collector surface, and the collector current ( I c + ) is given by Equation (26):
I c + = e S ( γ i + η γ i + η γ 0 )
where η and γ 0 are the secondary electron emission coefficients and neutral flux, respectively. Thus, using the above two equations, the FC helps determine the value of the neutral flux γ 0 by measuring the ion current while biasing the grid in two ways, and knowing the secondary electron emission coefficient.

9. FCs for Nuclear, Particle and High-Energy Physics

9.1. FCs in Nuclear and Particle Physics

Precise measurements of beam currents are essential for experiments involving particle interactions, decay processes, and nuclear reactions; hence, there is no doubt how crucial FCs are in the case of nuclear and particle physics. This section tries to summarize how FCs are used in these areas, their significance, and specific applications.

9.1.1. Use and Significance

  • Beam intensity measurement 
Accurate measurement of beam intensity is essential for quantifying the number of particles interacting in an experiment. FCs provide reliable current measurements that correspond to the particle flux [214]. Figure 33a explains the pulse beam current measurement circuit of the setup [215] to measure beam current. A typical plot of this measurement at INFN (Istituto Nazionale di Fisica Nucleare)–LNS (Laboratori Nazionali del Sud) is shown in Figure 33b.
  • Calibration of detectors 
FCs serve as an important device to calibrate other particle detectors by providing a known reference current, ensuring the accuracy and consistency of measurements in different experiments [84]. Factors like direct-charge measurements, high accuracy, wider dynamic range of beam intensities, simple operating principles, and stability make them ideal candidates for calibration standards. For example, Figure 34 shows an experimental setup at the 9 MeV tandem facility of IFIN-HH (Horia Hulubei National Institute for Research and Development in Physics and Nuclear Engineering), Bucharest, where an FC was placed after the target very closely to collect the protons that passed through it, while measuring the proton beam intensity and helping in attaining an absolute determination of the γ production cross-sections.
  • Beam profiling 
By measuring the beam current at different positions, FCs help in profiling the beam, which is critical for optimizing experimental setups and understanding beam dynamics [217,218]. This involves beam shape characterization, intensity distribution, and beam alignment. The cell irradiation setup for radiobiological experiments at ELBE (Electron Linac for Beams with High Brilliance), shown in Figure 35, had the FC and the phosphorescence screen, which were moved into the beam before, during, and after cell irradiation to control the electron beam parameters online.

9.1.2. Applications in Nuclear Physics

  • Nuclear reaction studies 
In nuclear reaction experiments, FCs are crucial for providing precise measurements of the incident beam intensity, a crucial parameter for determining reaction yields and extracting absolute cross-sections; while FCs do not directly measure unknown reaction rates or cross-sections, their accurate measurement of beam current allows researchers to normalize results reliably, facilitating comparisons between different experiments and theoretical models. Thus, FCs helps both in the experiments and the post-analysis normalization of results, making them an important diagnostic tool in nuclear physics.
In experiments involving the synthesis of superheavy elements, where precise beam current measurements are necessary to determine the production rates of new elements [220], FCs contribute to the initial beam current information. However, the actual production rates of new elements are typically determined through more specialized detection methods, such as alpha decay spectroscopy or time-of-flight mass spectrometry. FCs provide complementary data that, when combined with other detection techniques, aid in the overall analysis and interpretation of the experimental results. Moreover, FCs are also used to monitor beam intensity in facilities that produce medical and industrial isotopes, ensuring the consistency and quality of isotope production [221].

9.1.3. Applications in Particle Physics

  • Particle accelerator experiments 
In modern particle accelerator facilities, FCs play a pivotal role in beam diagnostics. They are strategically positioned for measuring beam intensity at multiple points: before and after interaction regions, as well as at intermediate locations along the beamlines. For example, the use of FCs in experiments at the Large Hadron Collider (L.H.C) is common to monitor proton beam currents [222]. These measurements are essential for several reasons as follows:
  • Quantifying beam losses:
    By comparing intensity measurements at different points, it can be accurately determined where and to what extent beam particles are lost [223].
  • Calculating interaction efficiencies:
    Intensity measurements prior to and following interaction regions allow for precise calculations of interaction cross-sections, efficiencies, etc. [224].
  • Monitoring beam quality:
    Intermediate measurements along the beamlines of the facilities provide insight into the change in intensity [225,226], which could help identify issues such as misalignment. However, as FCs are destructive devices in nature (the beam is absorbed when measured), their use is typically limited to intermittent or dedicated periods, for example, during machine setup, calibration, or to cross check non-destructive diagnostics along the beamline.
  • Optimizing accelerator performance:
    The data collected from FCs contribute to the general optimization of accelerator parameters during the initial stages of accelerator tuning, ensuring optimal beam delivery and experimental conditions [9,227]. In these cases, temporarily stopping the beam with an FC is acceptable to ensure a reliable setup and calibration of the system. Once optimal conditions are achieved, routine optimization and feedback rely mainly on non destructive diagnostics, with FCs serving as a reference or calibration points.
  • Decay rate measurements 
While FCs do not measure decay events themselves, they are essential for characterizing the initial particle beam in decay rate experiments. Accurate knowledge of quantifying the initial number of particles in a beam, as measured by FCs, is quite important, as this information establishes a baseline for further calculation of decay probabilities, understanding fundamental particle properties [228] and normalizing measurements in the detectors downstream of the beamline. Applications include estimating particle lifetimes, analyzing decay modes, validating theoretical models, and supporting rare decay searches. For high-precision decay studies, FCs often work in conjunction with more sensitive detectors, such as scintillators, semiconductor detectors, or time-projection chambers. These complementary setups allow FCs to provide reliable beam intensity measurements, which are crucial for cross-section normalization and event rate predictions [229]. For example, the NA61/SHINE experiment at CERN employs FCs to monitor proton beam currents, providing foundational data for subsequent particle production and decay studies [230]. Despite their limitations in sensitivity compared to specialized particle detectors, FCs remain essential for establishing baseline parameters and ensuring experimental reproducibility.

9.2. FCs in High-Energy Physics

In the high-energy physics (HEP) sector, FCs have been proven to be essential for monitoring and controlling high-intensity beams that are used in collider experiments and other high-energy facilities. This section discusses the applications and significance of FCs in HEP, along with examples.

9.2.1. Use and Significance

  • Beam diagnostics in particle accelerators 
In the low energy sections of linear accelerators, FCs provide continuous and precise beam current measurements during machine commissioning and tuning. On the other hand, at high-energy accelerators such as the LHC, specially designed FCs are used in the injection chain for beam diagnostics [201]. By monitoring beam intensity at various points along the accelerator, FCs contribute to the overall machine protection system. Unexpected beam losses detected by FCs can trigger safety interlocks [231].
  • Radiation protection 
By measuring the current of the beam and ensuring that it stays within safe limits, FCs contribute to radiation protection in high-energy facilities, protecting both equipment and personnel. As advanced applications, beam loss monitoring, dose rate estimation, operational optimization, and regulatory compliance are few that can be added. Figure 36 shows an FC setup, where the beam intensity profile is captured and plotted, providing valuable information on beam structure and radiation damage studies.
  • Calibration of beamline instruments 
FCs are used to calibrate other beamline instruments, such as wire scanners and beam position monitors, ensuring accurate beam diagnostics. This calibration process is crucial for maintaining the precision and reliability of measurements in particle accelerators [233].
  • Secondary particle detection 
In high-energy experiments, FCs can be adapted to detect secondary particles. They can be used to measure the flux of secondary particles (as well as interaction cross-section or yields) produced in beam dumps or targets, providing valuable information about beam–material interactions, for example, material responses to high-energy beams, radiation damage, or shielding effectiveness. FCs are also used to characterize low temperature beam plasma; Figure 37 provides a visual representation of how ions, sputtered atoms, and secondary electrons interact with the different parts of the FC when a plasma beam is incident upon it.

9.2.2. Challenges in High-Energy Applications

Designing FCs for high-energy beams presents unique challenges related to thermal load, material degradation, measurement precision, etc. At high beam energies, FCs need to tolerate significant heating due to beam impact, necessitating robust cooling methods and careful choice of construction materials. Additionally, the generation of secondary particles and electromagnetic radiation (e.g., bremsstrahlung) can complicate charge measurement by introducing background noise and requiring enhanced shielding.
  • Bremsstrahlung radiation:
    For high-energy electron beams, bremsstrahlung radiation becomes significant. This requires additional shielding and considerations in the cup design [234].
  • Pair production:
    At energies above the pair production threshold, electron–positron pairs can be created. The cup design must account for this to prevent charge loss [38].
  • Material selection:
    For high-energy applications, materials with high melting points and low atomic numbers are preferred to minimize secondary particle production and heat load [235].
  • Data acquisition:
    Handling high data rates and ensuring accurate real-time processing are critical in experiments involving high-energy beams. To overcome these challenges, innovative FC designs have been developed. Segmented FCs (these allow for spatial resolution of the beam profile while measuring current) [110], cooled FCs (for high-power beams, water or cryogenic cooling systems are integrated into the cup design to manage heat loads), and choosing materials with high thermal conductivity, such as copper or tungsten, can help in efficient heat dissipation.

9.2.3. Applications in Collider Experiments

The high-intensity, tightly focused beams in collider experiments demand precise monitoring for both machine protection and luminosity optimization. FCs serve as essential diagnostics, providing real-time feedback on beam currents, detecting subtle losses, and contributing to the overall stability of collider operations.
  • Proton–Proton colliders 
In proton–proton colliders such as the LHC, FCs are integrated into the beam instrumentation system to measure beam currents with high precision. For example, the LHC uses a Fast Beam Current Transformer (F.B.C.T) system [236], which incorporates FC principles, to measure bunch by bunch intensities with a resolution of ∼1% for nominal bunch intensities of 10 11 protons. This system can detect beam losses [222] as small as 1% of the total beam intensity, crucial for machine protection and luminosity optimization.
  • Electron–Positron colliders 
In electron–positron colliders like the KEK (Kō Enerugī kasokuki Kenkyū kikō), FCs are employed in conjunction with other beam diagnostic tools to achieve unprecedented luminosity. At Super KEKB, FCs are used in the injection system to measure and optimize the intensity of the injected beams [237]. Multilayer and multi-pinhole [238] FC systems have also been developed for beam profile measurements, allowing for fine-tuning of injection efficiency and beam quality.

9.2.4. Applications in Fixed-Target Experiments

  • High-Intensity Beamlines 
In fixed-target experiments, FCs measure the beam current before and after the target; this is vital to determine the number of particles that interact with the target material, i.e., the interaction rates. A good example of this is the use of FCs in the NA61/SHINE (SPS Heavy Ion and Neutrino Experiment) at CERN to measure the intensity of the primary proton beam [230].
  • Neutrino experiments 
FCs are also used in experiments like the HOLMES (HOlmium MEasurement of Electron capture for Neutrino mass Search) neutrino mass experiment, the Neutrinos at the Main Injector (NuMI) facility at Fermilab, etc., for monitoring proton beams that are producing neutrino beams. As shown in Figure 38, the HOLMES Transition Edge Sensors (TESs) detector fabrication has an FC as one of its five different modules for sample and continuous beam current measurement. The NuMI beamline directs a high-intensity proton beam at a graphite target, producing Pions ( π + , π , π 0 ) and Kaons ( K + , K , K 0 ), which eventually decay into neutrinos. The FC measures the proton beam current before it hits the target material, which ensures precise control over the number of protons delivered to the target [229].
In summary, FCs are crucial components in HEP experiments, providing essential data on beam currents and contributing to the safety and calibration of beamline instruments. Their role in both collider and fixed-target experiments shows their importance in achieving accurate and reliable experimental results.

10. FCs for Medical Accelerators

In medical accelerators, the dose is a critical parameter that can be determined by combining two beam parameters: the beam energy and the charge distribution. An example of such an FC is shown in Figure 39. To determine the beam charge distribution, an FC designed for the specific beam parameters is required. In medical accelerators, ionization chambers are the most used dosimetry devices [240]. However, large corrections need to be applied to properly determine the dose in ionization chambers at extremely high dose rates per pulse because of the ion recombination effects. FCs are known for their dose independent response and were implemented in clinical proton facilities for absolute dosimetry, even before the use of ionization chambers was definitively established. The working principle for FCs used in medical accelerators is the same as that of any other FC. However, in medical accelerators, the particle beam travels outside the vacuum chamber to target the dose to the tumor.
The ionization of the air present in the path of the beam could affect the FC measurements. To maintain vacuum conditions around the FC, the FC must be placed inside a vacuum enclosure with an entrance window for the particle beam. The entrance windows are usually made up of thin foil which provides enough strength to maintain the desired vacuum level while causing minimum perturbation to the beam properties [15]. Various research groups have used different materials with specific thicknesses as entrance windows, such as 50 µm thick kapton foil [15], 0.5 mm thick steel [242], and 0.076 mm thick aluminum foil [243]. To determine the charge of the beam with acceptable uncertainty, the contribution coming from the undesired secondary electrons needs to be minimized. In these FCs, the secondary electron contribution comes not only from the material of the FC where the beam is dumped, but also from the interaction of the beam with the entrance window, which was placed to maintain the vacuum inside the cup. Magnetic and electric fields can be used as suppressors, as discussed in Section 2.
One of the most important requirements for medical accelerators is to measure the charge distribution at the location or Water-Equivalent Thickness (W.E.T) of the tumor. A type of FC used in medical accelerators is commonly known as the Poor Man’s Faraday Cup (P.M.F.C), which is a block wrapped in an insulator and a shield. This device provides sufficiently accurate beam current measurements for non clinical measurements within 1–5% accuracy of a traditional FC [244]. Ehwald et al. [245] performed a detailed Monte Carlo simulation using TOPAS [246] (Tool for Particle Simulation) to quantify the contributions of charged particles for a proton beam energy ranging between 70 and 228 MeV, as shown in Figure 40.
Cambria et al. [247] compared the performance of two different FC namely, TERA-FC and Nice-FC along with an ionization chamber for proton beam dosimetry calibration. The results showed that the FCs agree within 1.3–3.6%, whereas the difference between FC and the ionization chambers varied between 6 and 8.2%. In medical accelerators, Multi-Layer Faraday Cups (M.L.F.C) are also used to perform a quick and precise daily range and total charge verification of proton beams [248,249]. In the MLFC design, the thickness of the copper plates was measured in terms of WET which increases with an increase in beam energy. The maximum range deviation was within 2 mm [248] or 0.4   g   cm−2 [249] for proton beam with energy ranging from 70 to 250 MeV. Moreover, a very accurate dosimetry is a crucial aspect in achieving Ultra-High Dose Rate (U.H.D.R) (>100 Gy/s). Shoenauen et al. [250] also developed an FC for dosimetry application for a 4 MeV UHDR proton beam.

11. Alternative Diagnostics

There are several alternatives to FCs for measuring beam current or intensity in various applications, each with its advantages and disadvantages. Some of the commonly used and commercially available beam diagnostic alternatives are highlighted in a comparison Table 5. Comparison of FC measurements with other diagnostics can be found in references [156,214,242,247,251,252,253,254,255,256,257].

12. Conclusions

Over many decades of scientific research, FCs have proven to be invaluable tools across various disciplines for quantifying the properties of charged particle beams. Despite facing several challenges, such as antimatter detection, very high energy beam interactions, secondary electron emission, material limitations, radiation damage, measurement accuracy, and low beam currents, they have been used as a primary diagnostic tool for assessing the beam properties.
To address some of the above mentioned issues, researchers are exploring innovative solutions, such as the following:
  • Advanced materials [270]: Development of nanostructured or composite materials that can withstand higher temperatures while reducing secondary electron emission.
  • Improved cooling systems [6,271]: Integration of more efficient cooling mechanisms to handle high-energy beams
  • Miniaturization [185,272]: Creation of compact and portable FCs for greater flexibility in experimental setups.
  • Automation and Remote Operation [120,273,274,275,276]: Using Artificial Intelligence and remote control technologies for complex experimental scenarios.
The future of FC technology lies in addressing the ongoing challenges of extremely high energy (multi TeV) beam applications and adapting to the growing complexity and demand of experimental physics. Research into new materials, integrated cooling solutions, and advanced signal processing techniques with real-time beam diagnostics will likely continue to enhance the performance and accuracy of FCs. Characterizing charged antimatter particle beams using FCs remains a significant challenge, making innovative approaches essential for achieving higher measurement precision. Furthermore, the development of portable, miniaturized, and automated FC systems offers exciting possibilities for future experiments, particularly in space exploration and compact particle accelerators.
Through the range of case studies and examples presented in this article, we have shown that FCs will continue to play a crucial role in beam diagnostics, as technological advancements continue to extend their applicability to complex, high-precision experiments. As research pushes the boundaries on different frontiers of science, the design of FCs will continue to evolve, offering reliable and accurate measurements of charged particle beams. Their use in both fundamental research and applied technologies shows their importance across various disciplines. We hope that this article provides students, researchers, and engineers with a clear understanding of the current capabilities and future potential of FCs.

Author Contributions

Conceptualization, B.S.R.; methodology, B.S.R.; software, B.S.R. and D.A.; validation, B.S.R., N.K., D.G., D.A. and C.P.W.; formal analysis, B.S.R., N.K., D.G., D.A., B.R. and C.P.W.; investigation, B.S.R., N.K., D.G., D.A., B.R. and C.P.W.; resources, B.S.R., N.K., D.G., D.A., B.R. and C.P.W.; data curation, B.S.R., N.K., D.G., D.A., B.R. and C.P.W.; writing—original draft preparation, B.S.R., N.K., D.G., D.A., B.R. and C.P.W.; writing—B.S.R., N.K., D.G., D.A., B.R. and C.P.W.; visualization, B.S.R., N.K., D.G., D.A., B.R. and C.P.W.; supervision, N.K. and C.P.W.; project administration, N.K. and C.P.W.; funding acquisition, C.P.W. All authors have read and agreed to the published version of the manuscript.

Funding

This work was supported by EPRSC under grant agreement-EP/XO14851/1, the AWAKE-UK phase II project funded by STFC under grant No. ST/X005208/1 and the STFC Cockcroft Institute core grant No. ST/V001612/1.

Data Availability Statement

The data that support the findings of this study are available from the corresponding author upon reasonable request. References for all the other datasets are given in the text.

Conflicts of Interest

The authors have no conflicts of interest to disclose.

Abbreviations

AbbreviationDefinition
ADCanalog-to-digital converter
AE g ¯ ISAntimatter Experiment: Gravity, Interferometry and Spectroscopy
AIArtificial Intelligence
ALPHAAntihydrogen Laser Physics Apparatus
ALPIAcceleratore Lineare Per Ioni
ATRAPAntihydrogen Trap
BASEBaryon Antibaryon Antisymmetry Experiment
CERNConseil Européen pour la Recherche Nucléaire
CFDComputational Fluid Dynamics
CMOSComplementary Metal Oxide Semiconductor
DAQdata acquisition system
DCdirect current
DSAdynamic signal analysis
ELBEElectron Linac for Beams with High Brilliance and Low Emittance
EMIElectro Magnetic Interference
EPICSExperimental Physics and Industrial Control System
ESPElastically Backscattered Primary
FBCTFast Beam Current Transformer
FCCFuture Circular Collider
FCFaraday Cup
FCAFaraday Cup Array
FFCFast Faraday Cup
FLUKAFLUktuierende KAskade
FPGAField-Programmable Gate Array
GGGround Grid
GPSGlobal Positioning System
GPUGraphics Processing Unit
HEPhigh-energy physics
HOLMESHOlmium MEasurement of Electron capture for Neutrino mass Search
IFIN-HHHoria Hulubei National Institute for Research and Development
in Physics and Nuclear Engineering
INFNIstituto Nazionale di Fisica Nucleare
ISOLDEIsotope Separator On Line Device
ISEInelastically Backscattered Electron
JNJohnson–Nyquist
KEKKō Enerugī kasokuki Kenkyū kikō
KOMACKorea Multi-purpose Accelerator Complex
LabVIEWLABoratory Virtual Instrument Engineering Workbench
LEISlow-energy ion scattering
LHCLarge Hadron Collider
LINAClinear accelerator
LNSLaboratori Nazionali del Sud
MATLABMATrix LABoratory
MCMonte Carlo
MCNPMonte Carlo N Particle Transport
MCPMicro Channel Plate
MLFCMulti-Layer Faraday Cup
MITMassachusetts Institute of Technology
MPFCMulti-Pinhole Faraday Cup
NBINeutral Beam Injector
NuMINeutrinos at Main Injector
PCBprinted circuit board
PCIPeripheral Component Interconnect
PICParticle In Cell
PMFCPoor Man’s Faraday Cup
PXIPCI eXtension
RAIDRedundant Array of Independent Disks
RFradio frequency
RTIAResistor Transimpedance Amplifier
SARSuccessive Approximation Register
SDStandard Deviation
SEYsecondary electron yield
SGSuppressor Grid
SHINESPS Heavy Ion and Neutrino Experiment
SPSSuper Proton Synchrotron
SRIMStopping Range of Ions in Matter
TESTransition Edge Sensor
TOKAMAKToroidal Chamber with Magnetic Coils (transliteration from russian)
TOPASTool for Particle Simulation
TRIMTRansport of Ions in Matter
TSEtrue secondary electron
UHDRUltra-High Dose Rate
VMEVirtual Machine Environment

References

  1. Brown, L.; Beynon, J.H. Ion-Trap Methods. 2024. Available online: https://www.britannica.com/science/mass-spectrometry/Ion-trap-methods#ref619943 (accessed on 22 August 2025).
  2. Jean, P. New experiments on the kathode rays. Nature 1896, 53, 298–299. [Google Scholar] [CrossRef]
  3. Cockcroft, J.D.; Walton, E.T.S. Experiments with high velocity positive ions.―(I) Further developments in the method of obtaining high velocity positive ions. Proc. R. Soc. Lond. Ser. A Contain. Pap. A Math. Phys. Character 1932, 136, 619–630. [Google Scholar] [CrossRef]
  4. Bellato, M.; Dainelli, A.; Poggi, M. Design and tests for the fast Faraday cup of the ALPI post-accelerator. Nucl. Instrum. Methods Phys. Res. Sect. A Accel. Spectrometers Detect. Assoc. Equip. 1996, 382, 118–120. [Google Scholar] [CrossRef]
  5. Harasimowicz, J.; Welsch, C.P. Development of Instrumentation for Low Energy Beams. Ph.D. Thesis, University of Liverpool, Liverpool, UK, 2013. Available online: https://www.liverpool.ac.uk/media/livacuk/quasargroup/files/downloads/JanuszHarasimowicz_Thesis.pdf (accessed on 22 August 2025).
  6. Rawat, B.S.; Vala, S.; Abhangi, M.; Kumar, R.; Chauhan, S. Design and Simulation of 10kW Faraday cup for Ion beam current measurement. In Proceedings of the International Conference on Nuclear Engineering, American Society of Mechanical Engineers. Shanghai, China, 2–6 July 2017; Volume 57878, p. V009T15A051. [Google Scholar] [CrossRef]
  7. Cantero, E.; Lanaia, D.; Fraser, M.; Sosa, A.; Bravin, E.; Voulot, D.; Andreazza, A.W. Performance Tests of a short Faraday Cup designed for HIE-ISOLDE. In Proceedings of the IPAC2013, Shanghai, China, 12–17 May 2013; Available online: https://accelconf.web.cern.ch/ipac2013/papers/mopme072.pdf (accessed on 22 August 2025).
  8. Lazerson, S.A.; Ellis, R.; Freeman, C.; Ilagan, J.; Wang, T.; Shao, L.; Allen, N.; Gates, D.; Neilson, H. Development of a Faraday cup fast ion loss detector for keV beam ions. Rev. Sci. Instrum. 2019, 90, 093504. [Google Scholar] [CrossRef] [PubMed]
  9. Winterhalter, C.; Togno, M.; Nesteruk, K.P.; Emert, F.; Psoroulas, S.; Vidal, M.; Meer, D.; Weber, D.C.; Lomax, A.; Safai, S. Faraday cup for commissioning and quality assurance for proton pencil beam scanning beams at conventional and ultra-high dose rates. Phys. Med. Biol. 2021, 66, 124001. [Google Scholar] [CrossRef]
  10. Raza, U.; Akbar, S.; Yaqub, K.; Zeeshan, S.; Khan, M.A.; Farooqi, I.; Javeed, S.; Ahmed, M. Faraday Cup for high current and duty cycle electron LINACs. Vacuum 2020, 175, 109242. [Google Scholar] [CrossRef]
  11. Brown, K.L.; Tautfest, G.W. Faraday-Cup Monitors for High-Energy Electron Beams. Rev. Sci. Instrum. 1956, 27, 696–702. [Google Scholar] [CrossRef]
  12. Yuksel, A.N.; Turemen, G.; Bulut, S.; Serin, N.O.; Yavas, O. Design of beam instrumentation for in-vacuum materials irradiation and testing in a 30 MeV medical cyclotron. Nucl. Instrum. Methods Phys. Res. Sect. A Accel. Spectrometers Detect. Assoc. Equip. 2020, 977, 164290. [Google Scholar] [CrossRef]
  13. Kunert, C.; Bundesmann, J.; Damerow, T.; Denker, A.; Weber, A. A Multi-Leaf Faraday Cup especially for proton therapy of ocular tumors. In Proceedings of the 5th International Particle Accelerator Conference (IPAC’14), Dresden, Germany, 15–20 June 2014; pp. 2149–2152. Available online: https://accelconf.web.cern.ch/cyclotrons2013/papers/th2pb04.pdf (accessed on 22 August 2025).
  14. Husain, A.; Ryser, J.; Pakela, J.; Huang, M.; Shoniyozov, K.; Stappen, F.V.; Koumenis, C.; Dong, L.; Fan, Y.; Diffenderfer, E.; et al. An efficient dosimetry method with a Faraday cup for small animal, small-field proton irradiation under conventional and ultra-high dose rates. arXiv 2022, arXiv:2209.07354. [Google Scholar]
  15. Scuderi, V.; Amato, A.; Amico, A.G.; Borghesi, M.; Cirrone, G.A.P.; Cuttone, G.; Fajstavr, A.; Giuffrida, L.; Grepl, F.; Korn, G.; et al. Diagnostics and dosimetry solutions for multidisciplinary applications at the ELIMAIA beamline. Appl. Sci. 2018, 8, 1415. [Google Scholar] [CrossRef]
  16. Akio, M.; Eizo, N. Calibration of Faraday cup efficiency in a multicollector mass spectrometer. Chem. Geol. Isot. Geosci. Sect. 1991, 94, 105–110. [Google Scholar] [CrossRef]
  17. Scheidemann, A.A.; Darling, R.B.; Schumacher, F.J.; Isakharov, A. Faraday cup detector array with electronic multiplexing for multichannel mass spectrometry. J. Vac. Sci. Technol. A Vacuum Surfaces Film. 2002, 20, 597–604. [Google Scholar] [CrossRef]
  18. Imrie, D.C.; Pentney, J.M.; Cottrell, J.S. A Faraday cup detector for high-mass ions in matrix-assisted laser desorption/ionization time-of-flight mass spectrometry. Rapid Commun. Mass Spectrom. 1995, 9, 1293–1296. [Google Scholar] [CrossRef]
  19. Grigoryan, R.; Costas-Rodríguez, M.; Santens, P.; Vanhaecke, F. Multicollector Inductively Coupled Plasma–Mass Spectrometry with 1013 Ω Faraday Cup Amplifiers for Ultrasensitive Mg Isotopic Analysis of Cerebrospinal Fluid Microsamples. Anal. Chem. 2020, 92, 15975–15981. [Google Scholar] [CrossRef]
  20. Bernasconi, S.M.; Hu, B.; Wacker, U.; Fiebig, J.; Breitenbach, S.F.; Rutz, T. Background effects on Faraday collectors in gas-source mass spectrometry and implications for clumped isotope measurements. Rapid Commun. Mass Spectrom. 2013, 27, 603–612. [Google Scholar] [CrossRef]
  21. Fitzakerley, D.W. Antihydrogen Via Two-Stage Charge Exchange. Master’s Thesis, York University, Toronto, ON, Canada, 2015. Available online: https://yorkspace.library.yorku.ca/bitstream/10315/32118/2/Fitzakerley_Daniel_W_2015_PhD.pdf (accessed on 22 August 2025).
  22. Hugonnaud, V.; Mazouffre, S.; Krejci, D. Faraday cup sizing for electric propulsion ion beam study: Case of a field-emission-electric propulsion thruster. Rev. Sci. Instrum. 2021, 92, 084502. [Google Scholar] [CrossRef]
  23. Hugonnaud, V.; Mazouffre, S. Optimization of a Faraday cup collimator for electric propulsion device beam study: Case of a Hall thruster. Appl. Sci. 2021, 11, 2419. [Google Scholar] [CrossRef]
  24. Rawat, B.S.; Sharma, S.K.; Choksi, B.; Prahlad, V.; Baruah, U.K. Measurement system for ion beam profiles using fixed parallel wires and Faraday cup array. Aip Adv. 2022, 12, 125103. [Google Scholar] [CrossRef]
  25. Brown, D.L.; Walker, M.L.; Szabo, J.; Huang, W.; Foster, J.E. Recommended practice for use of Faraday probes in electric propulsion testing. J. Propuls. Power 2017, 33, 582–613. [Google Scholar] [CrossRef]
  26. Trottenberg, T.; Bansemer, F.; Böttcher, S.; Feili, D.; Henkel, H.; Hesse, M.; Kersten, H.; Krüger, T.; Laube, J.; Lazurenko, A.; et al. An in-flight plasma diagnostic package for spacecraft with electric propulsion. EPJ Tech. Instrum. 2021, 8, 16. [Google Scholar] [CrossRef]
  27. Réfy, D.I.; Zoletnik, S.; Dunai, D.; Anda, G.; Lampert, M.; Hegedűs, S.; Nagy, D.; Palánkai, M.; Kádi, J.; Leskó, B.; et al. Micro-Faraday cup matrix detector for ion beam measurements in fusion plasmas. Rev. Sci. Instrum. 2019, 90, 033501. [Google Scholar] [CrossRef]
  28. Ogawa, K.; Bozhenkov, S.A.; Äkäslompolo, S.; Killer, C.; Grulke, O.; Nicolai, D.; Satheeswaran, G.; Isobe, M.; Osakabe, M.; Yokoyama, M.; et al. Energy-and-pitch-angle-resolved escaping beam ion measurements by Faraday-cup-based fast-ion loss detector in Wendelstein 7-X. J. Instrum. 2019, 14, C09021. [Google Scholar] [CrossRef]
  29. Darrow, D.S.; Bäumel, S.; Cecil, F.E.; Kiptily, V.; Ellis, R.; Pedrick, L.; Werner, A. Design and construction of a fast ion loss Faraday cup array diagnostic for Joint European Torus. Rev. Sci. Instrum. 2004, 75, 3566–3568. [Google Scholar] [CrossRef]
  30. Bonofiglo, P.J.; Kiptily, V.; Horton, A.; Beaumont, P.; Ellis, R.; Cecil, F.E.; Podesta, M.; Contributors JET. Improvements to the Faraday cup fast ion loss detector and magnetohydrodynamic induced fast ion loss measurements in Joint European Torus plasmas. Rev. Sci. Instrum. 2020, 91, 093502. [Google Scholar] [CrossRef]
  31. Atsushi, O.; Isono, T.; Nishiuchi, T.; Takahashi, H.; Kitajima, S.; Sasao, M. Charge-Exchanged Beam Measurement by Using a Grid-Biased Faraday Cup. Plasma Fusion Res. 2010, 5, S2088. [Google Scholar] [CrossRef]
  32. McKenna, C.M. Faraday cup designs for ion implantation. In Springer Series in Electrophysics; Springer: Berlin, Germany, 1982; pp. 73–103. [Google Scholar] [CrossRef]
  33. Brogden, V.; Johnson, C.; Rue, C.; Graham, J.; Langworthy, K.; Golledge, S.; McMorran, B. Material Sputtering with a Multi-Ion Species Plasma Focused Ion Beam. Adv. Mater. Sci. Eng. 2021, 2021, 8842777. [Google Scholar] [CrossRef]
  34. Catapang, A.V.; Herndez, I.J.; Vasquez, M.R.; Wada, M. Performance of a reactive magnetron sputtering ion source using water vapor plasma. J. Phys. Conf. Ser. 2022, 2244, 012099. [Google Scholar] [CrossRef]
  35. Hellborg, R. Electrostatic Accelerators; Springer: Berlin, Germany, 2005. [Google Scholar] [CrossRef]
  36. Liu, J.; Yu, D.; Ruan, F.; Xue, Y.; Wang, W. Note: A real-time beam current density meter. Rev. Sci. Instrum. 2013, 84, 036107. [Google Scholar] [CrossRef]
  37. Shaw, J.; Averill, R.; Kowalski, S.; Sarkar, S.; Sibley, C.; Sobczynski, S.; Turchinetz, W. A high power Faraday cup to measure extracted beam current from the Bates South Hall Ring. In Proceedings of the 1997 Particle Accelerator Conference (Cat. No. 97CH36167), Vancouver, BC, Canada, 16 May 1997; Volume 2, pp. 2274–2275. [Google Scholar] [CrossRef]
  38. Strehl, P. Beam Instrumentation and Diagnostics; Springer: Berlin/Heidelberg, Germany, 2006; Volume 120. [Google Scholar] [CrossRef]
  39. Nassisi, V.; Delle Side, D.; Velardi, L.; Buccolieri, G.; De Benedittis, A.; Paladini, F. A study of the secondary electrons yield produced by laser induced ions on Faraday cups as a function of beam angle. J. Phys. Conf. Ser. 2014, 508, 012021. [Google Scholar] [CrossRef]
  40. Lieberman, M.A.; Lichtenberg, A.J. Principles of Plasma Discharges and Materials Processing; John Wiley and Sons Ltd.: Hoboken, NJ, USA, 2005. [Google Scholar] [CrossRef]
  41. Carter, G.; Colligon, J.S. Ion Bombardment of Solids; Heinemann Educational: London, UK, 1968. Available online: https://search.catalog.loc.gov/instances/cb86489c-4293-555b-bad7-a8e140d3101f?option=lccn&query=75380561 (accessed on 22 August 2025).
  42. Wolf, B. Handbook of Ion Sources; CRC Press: Boca Raton, FL, USA, 1995; Available online: https://books.google.com/books?hl=en&lr=&id=qoQHMSBNFsAC&oi=fnd&pg=PA2&dq=Handbook+of+ion+sources&ots=5lZvm1Da1A&sig=kd2xjjX9ZcCga__He5j7_cHlC8M (accessed on 22 August 2025).
  43. Wasa, K. Sputtering Phenomena. In Handbook of Sputtering Technology (Second Edition); William Andrew Publishing: Oxford, UK, 2012; pp. 41–75. [Google Scholar] [CrossRef]
  44. Lewis, M.A.; Glocker, D.A.; Jorne, J. Measurements of secondary electron emission in reactive sputtering of aluminum and titanium nitride. J. Vac. Sci. Technol. A Vacuum Surfaces Film. 1989, 7, 1019–1024. [Google Scholar] [CrossRef]
  45. Ikuse, K.; Yoshimura, S.; Hine, K.; Kiuchi, M.; Hamaguchi, S. Sputtering yields of Au by low-energy noble gas ion bombardment. J. Phys. D Appl. Phys. 2009, 42, 135203. [Google Scholar] [CrossRef]
  46. McHugh, J.A. Ion beam sputtering-the effect of incident ion energy on atomic mixing in subsurface layers. Radiat. Eff. 1974, 21, 209–215. [Google Scholar] [CrossRef]
  47. Sasaki, T.; Yoshida, N.; Takahashi, M.; Tomita, M. The optimization of incident angles of low-energy oxygen ion beams for increasing sputtering rate on silicon samples. Appl. Surf. Sci. 2008, 255, 1357–1359. [Google Scholar] [CrossRef]
  48. Kitani, H.; Toyoda, N.; Matsuo, J.; Yamada, I. Incident angle dependence of the sputtering effect of Ar-cluster-ion bombardment. Nucl. Instrum. Methods Phys. Res. Sect. B Beam Interact. Mater. Atoms 1997, 121, 489–492. [Google Scholar] [CrossRef]
  49. Glöersen, P.G. Ion—beam etching. J. Vac. Sci. Technol. 1975, 12, 28–35. [Google Scholar] [CrossRef]
  50. Sano, N.; Bellew, A.; Blenkinsopp, P. Comparing sputter rates, depth resolution, and ion yields for different gas cluster ion beams (GCIB): A practical guide to choosing the best GCIB for every application. J. Vac. Sci. Technol. A 2023, 41, 053204. [Google Scholar] [CrossRef]
  51. Sigmund, P. Theory of sputtering. I. Sputtering yield of amorphous and polycrystalline targets. Phys. Rev. 1969, 184, 383. [Google Scholar] [CrossRef]
  52. Seah, M.P. An accurate semi-empirical equation for sputtering yields, II: For neon, argon and xenon ions. Nucl. Instrum. Methods Phys. Res. Sect. B Beam Interact. Mater. Atoms 2005, 229, 348–358. [Google Scholar] [CrossRef]
  53. Jeynes, C.; Barradas, P.N. Pitfalls in ion beam analysis. In Handbook of Modern Ion Beam Materials Analysis; Number 15; Materials Research Society: Warrendale, PA, USA, 2009; pp. 347–383. Available online: https://openresearch.surrey.ac.uk/esploro/outputs/bookChapter/Pitfalls-in-Ion-Beam-Analysis/99514015402346 (accessed on 22 August 2025).
  54. Whetten, T.J.; Armstead, A.A.; Grzybowski, T.A.; Ruoff, A.L. Etching of diamond with argon and oxygen ion beams. J. Vac. Sci. Technol. A 1984, 2, 477–480. [Google Scholar] [CrossRef]
  55. Austin, L.; Starke, H. Ueber die Reflexion der Kathodenstrahlen und eine damit verbundene neue Erscheinung secundärer Emission. Ann. Der Phys. 1902, 314, 271–292. [Google Scholar] [CrossRef]
  56. Bruining, H. Physics and Applications of Electron Secondary Emission; Mc Graw Hill: Columbus, OH, USA, 1954; Available online: https://www.sciencedirect.com/book/9780080090146/physics-and-applications-of-secondary-electron-emission (accessed on 22 August 2025).
  57. Lenard, P. Zur Entwicklung der Kenntnis von den Geschwindigkeitsverlusten der Kathodenstrahlen in der Materie. Annalen der Physik 1926, 385, 1–16. [Google Scholar] [CrossRef]
  58. Ritter, M. A Landmark-Based Method for the Geometrical 3D Calibration of Scanning Microscopes. Ph.D. Thesis, Technische Universitat Berlin, Berlin, Germany, 2007. [Google Scholar] [CrossRef]
  59. Swanson, C.; Kaganovich, I.D. Modeling of reduced secondary electron emission yield from a foam or fuzz surface. J. Appl. Phys. 2018, 123, 023302. [Google Scholar] [CrossRef]
  60. Main, D.; Jenkins, T.G.; Theis, J.G.; Werner, G.R.; Cary, J.R.; Lanham, E.; Veitzer, S.A.; Kruger, S.E. Modeling the Role of Secondary Electron Emission in Direct Current Magnetron Sputtering using Explicit Energy-Conserving Particle-in-Cell Methods. arXiv 2025, arXiv:2507.10727. [Google Scholar]
  61. Huerta, C.E.; Wirz, R.E. Ion-induced electron emission reduction via complex surface trapping. Aip Adv. 2019, 9, 125009. [Google Scholar] [CrossRef]
  62. Vaughan, J.; Rodney, M. A new formula for secondary emission yield. IEEE Trans. Electron Devices 1989, 36, 1963–1967. [Google Scholar] [CrossRef]
  63. Furman, M.A.; Pivi, M.T.F. Probabilistic model for the simulation of secondary electron emission. Phys. Rev. Spec. Top. Beams 2002, 5, 124404. [Google Scholar] [CrossRef]
  64. Svensson, B.; Holmén, G.; Burén, A. Angular dependence of the ion-induced secondary-electron yield from solids. Phys. Rev. B 1981, 24, 3749. [Google Scholar] [CrossRef]
  65. Habl, L.; Rafalskyi, D.; Lafleur, T. Secondary electron emission due to multi-species iodine ion bombardment of different target materials. J. Appl. Phys. 2021, 129, 153302. [Google Scholar] [CrossRef]
  66. Fernandez-Coppel, J.; Wirz, R.; Marian, J. Fully discrete model of kinetic ion-induced electron emission from metal surfaces. J. Appl. Phys. 2024, 135, 083301. [Google Scholar] [CrossRef]
  67. Beuhler, R.J.; Friedman, L. Low noise, high voltage secondary emission ion detector for polyatomic ions. Int. J. Mass Spectrom. Ion Phys. 1977, 23, 81–97. [Google Scholar] [CrossRef]
  68. Beuhler, R.; Friedman, L. Larger cluster ion impact phenomena. Chem. Rev. 1986, 86, 521–537. [Google Scholar] [CrossRef]
  69. Schou, J. Transport theory for kinetic emission of secondary electrons from solids. Phys. Rev. B 1980, 22, 2141–2174. [Google Scholar] [CrossRef]
  70. Dassault Systèmes. CST Studio Suite. Available online: https://www.3ds.com/products-services/simulia/products/cst-studio-suite/solvers (accessed on 22 August 2025).
  71. Dahl, D.A. SIMION for the personal computer in reflection. Int. J. Mass Spectrom. 2000, 200, 3–25. [Google Scholar] [CrossRef]
  72. COMSOL Multiphysics. Available online: https://www.comsol.com/ (accessed on 22 August 2025).
  73. Hasselkamp, D.; Rothard, H.; Groeneveld, K.O.; Kemmler, J.; Varga, P.; Winter, H. Particle Induced Electron Emission II; Springer: Berlin/Heidelberg, Germany, 2006; Volume 123. [Google Scholar] [CrossRef]
  74. Sternglass, E.J. Theory of secondary electron emission by high-speed ions. Phys. Rev. 1957, 108, 1. [Google Scholar] [CrossRef]
  75. Cantero, E.D.; Sosa, A.; Andreazza, W.; Bravin, E.; Lanaia, D.; Voulot, D.; Welsch, C.P. Design of a compact Faraday cup for low energy, low intensity ion beams. Nucl. Instrum. Methods Phys. Res. Sect. A Accel. Spectrometers Detect. Assoc. Equip. 2016, 807, 86–93. [Google Scholar] [CrossRef]
  76. Thomas, J.D.; Hodges, G.S.; Seely, D.G.; Moroz, N.A.; Kvale, T.J. Performance enhancement study of an electrostatic Faraday cup detector. Nucl. Instrum. Methods Phys. Res. Sect. A Accel. Spectrometers Detect. Assoc. Equip. 2005, 536, 11–21. [Google Scholar] [CrossRef]
  77. Rawat, B.S. Studies on Extraction of an Ion Beam and Its Transport from a Multi-Cusp Gridded Ion Source. Ph.D. Thesis, Homi Bhabha National Institute/Institute for Plasma Research, Mumbai, India, 2024. [Google Scholar] [CrossRef]
  78. Zalm, P.C.; Beckers, L.J. Ion-induced secondary electron emission from copper and zinc. Surf. Sci. 1985, 152, 135–141. [Google Scholar] [CrossRef]
  79. Baragiola, R.A.; Alonso, E.V.; Ferron, J.; Oliva-Florio, A. Ion-induced electron emission from clean metals. Surf. Sci. 1979, 90, 240–255. [Google Scholar] [CrossRef]
  80. Carlston, C.E.; Magnuson, G.D.; Mahadevan, P.; Harrison, D.E., Jr. Electron ejection from single crystals due to 1-to 10-keV noble-gas ion bombardment. Phys. Rev. 1965, 139, A729. [Google Scholar] [CrossRef]
  81. Bogaerts, A.; Gijbels, R. The ion-and atom-induced secondary electron emission yield: Numerical study for the effect of clean and dirty cathode surfaces. Plasma Sources Sci. Technol. 2002, 11, 27. [Google Scholar] [CrossRef]
  82. Holmén, G.; Svensson, B.; Burén, A. Ion induced electron emission from polycrystalline copper. Nucl. Instrum. Methods Phys. Res. 1981, 185, 523–532. [Google Scholar] [CrossRef]
  83. Zhang, H.B.; Hu, X.C.; Wang, R.; Cao, M.; Zhang, N.; Cui, W.Z. Note: Measuring effects of Ar-ion cleaning on the secondary electron yield of copper due to electron impact. Rev. Sci. Instrum. 2012, 83, 066105. [Google Scholar] [CrossRef]
  84. Phelps, A.V.; Petrovic, Z.L. Cold-cathode discharges and breakdown in argon: Surface and gas phase production of secondary electrons. Plasma Sources Sci. Technol. 1999, 8, R21. [Google Scholar] [CrossRef]
  85. Pruitt, J.S. Secondary electron trajectories in a Faraday cup magnetic field. Nucl. Instrum. Methods 1966, 39, 329–334. [Google Scholar] [CrossRef]
  86. Bhatia, R.K.; Yadav, V.K.; Kumar, Y.; Gonde, B.R.; Ravisankar, E.; Saha, T.K.; Nataraju, V.; Gupta, S.K. Improved Faraday collector for magnetic sector mass spectrometers. Int. J. Mass Spectrom. 2015, 393, 58–62. [Google Scholar] [CrossRef]
  87. Tan, I.H.; Ueda, M.; Dallaqua, R.S.; Rossi, J.O. Magnetic field effects on secondary electrons emitted during ion implantation in vacuum arc plasmas. Nucl. Instrum. Methods Phys. Res. Sect. B Beam Interact. Mater. Atoms 2006, 242, 332–334. [Google Scholar] [CrossRef]
  88. Friedrich, M. Equipment for Beam Diagnostics. In Electrostatic Accelerators. Particle Acceleration and Detection; Hellborg, R., Ed.; Springer: Berlin/Heidelberg, Germany, 2005; p. 317. [Google Scholar] [CrossRef]
  89. Mack, M.E.; Holsinger, R.F. Zero Deflection Magnetically-Suppressed Faraday for Ion Implanters. 1998. Available online: https://patents.google.com/patent/US5757018A/en (accessed on 22 August 2025).
  90. Nam, K.Y.; Kim, K.R.; Park, B.S.; Lee, W.R. A development of Faraday cup for the application to the SNU tandem accelerator beam line. In Proceedings of the 2003 Spring Meeting of the KNS, Gyeongju, Republic of Korea, 29–30 May 2003; Available online: https://www.kns.org/files/pre_paper/21/481%EB%82%A8%EA%B8%B0%EC%9A%A9.pdf (accessed on 22 August 2025).
  91. von Jagwitz-Biegnitz, H.; Faircloth, D.; Holmes, A.J.; Selway, R.G.; Beasley, P.; Heid, O. 2D wire grid integrated with Faraday Cup for low energy H-Beam analysis at SIEMENS Novel electrostatic accelerator. In Proceedings of the IBIC, Oxford, UK, 16–19 September 2013; Available online: https://accelconf.web.cern.ch/IBIC2013/papers/tupf06.pdf (accessed on 22 August 2025).
  92. Bisson, J.; Zhao, Z.; Gammel, G.; Alvarado, D.; Walker, C. Faraday System for Ion Implanters. 2004. Available online: https://patents.google.com/patent/US6723998B2/en (accessed on 22 August 2025).
  93. Cohen, A.J.; Koral, K.F. Backscattering and Secondary-Electron Emission from Metal Targets of Various Thicknesses; National Aeronautics and Space Administration: Washington, DC, USA, 1965. Available online: https://ntrs.nasa.gov/api/citations/19650012044/downloads/19650012044.pdf (accessed on 22 August 2025).
  94. Ziegler, J.F.; Ziegler, M.D.; Biersack, J.P. SRIM–The stopping and range of ions in matter. Nucl. Instrum. Methods Phys. Res. Sect. B Beam Interact. Mater. Atoms 2010, 268, 1818–1823. [Google Scholar] [CrossRef]
  95. Adıgüzel, A.; Çetinkaya, H.; Esen, Ş.; Halis, D.; İlhan, T.B.; Kılıçgedik, A.; Oğur, S.; Öz, S.; Özbey, A.Y.D.I.N.; Özcan, V.E.; et al. Low-energy ion beam diagnostics: An integrated solution. J. Instrum. 2024, 19, T03002. [Google Scholar] [CrossRef]
  96. Brongersma, H.H. Low-energy ion scattering. Charact. Mater. 2012, 2044, 1–23. [Google Scholar] [CrossRef]
  97. Salvat, F. Bethe stopping-power formula and its corrections. Phys. Rev. A 2022, 106, 032809. [Google Scholar] [CrossRef]
  98. Ebrahimibasabi, E.; Feghhi, H.S.A. Design and construction of a secondary electron suppressed Faraday Cup for measurement of beam current in an electrostatics proton accelerator. Int. J. Mass Spectrom. 2015, 386, 1–5. [Google Scholar] [CrossRef]
  99. Naieni, A.K.; Bahrami, F.; Yasrebi, N.; Rashidian, B. Design and study of an enhanced Faraday cup detector. Vacuum 2009, 83, 1095–1099. [Google Scholar] [CrossRef]
  100. Bravin, E.; Welsch, C.P.; Cantero, E.D.; Garcia, S.A. Optimization of a short Faraday cup for low-energy ions using numerical simulations. In Proceedings of the IBIC 2014, Monterry, CA, USA, 14–18 September 2014; Available online: https://accelconf.web.cern.ch/ibic2014/papers/wepf07.pdf (accessed on 22 August 2025).
  101. Johnston, R.; Bernauer, J.; Cooke, C.M.; Corliss, R.; Epstein, C.S.; Fisher, P.; Friščić, I.; Hasell, D.; Ihloff, E.; Kelsey, J.; et al. Realization of a large-acceptance Faraday Cup for 3 MeV electrons. Nucl. Instrum. Methods Phys. Res. Sect. A Accel. Spectrometers Detect. Assoc. Equip. 2019, 922, 157–160. [Google Scholar] [CrossRef]
  102. Masoumzadeh, A.; Habibi, M.; Afsharmanesh, M. Design, construction and test of an optimized Faraday cup for beam current determination of a helicon ion source. Vacuum 2019, 159, 99–104. [Google Scholar] [CrossRef]
  103. Vala, S.; Kumar, R.; Abhangi, M.; Swami, H.L.; Bandyopadhyay, M.; Kumar, R. Installation, commissioning and testing of a low energy accelerator based 14-MeV neutron generator for lab scale fusion neutronics experiment. Fusion Eng. Des. 2025, 217, 115158. [Google Scholar] [CrossRef]
  104. Stockli, M.P.; Welton, R.F.; Keller, R.; Leitner, M. Emittance studies with an Allison scanner. Rev. Sci. Instrum. 2006, 77, 03B706. [Google Scholar] [CrossRef]
  105. Allison, P.W.; Sherman, J.D.; Holtkamp, D.B. An emittance scanner for intense low-energy ion beams. IEEE Trans. Nucl. Sci. 2007, 30, 2204–2206. [Google Scholar] [CrossRef]
  106. Laxdal, A.; Ames, F.; Baartman, R.A.; Brennan, D.; Koscielniak, S.R.; Morris, D.; Rawnsley, W.R.; Vincent, P.; Waters, G.; Yosifov, D. High Power Allison Scanner for Electrons. In Proceedings of the BIW2012, Newport News, VA, USA, 17 April 2012; Available online: https://accelconf.web.cern.ch/BIW2012/talks/tucp04_talk.pdf (accessed on 22 August 2025).
  107. Kima, D.H.; Dang, J.J.; Kwon, H.J.; Lee, S.H.; Kimb, H.S.; Chunga, K.J.; Hwanga, Y.S. Design and Installation of A Prototype Multi-pinhole Faraday Cup. In Proceedings of the Transactions of the Korean Nuclear Society Virtual Spring Meeting, Virtual, 9–10 July 2020; Available online: https://journal-home.s3.ap-northeast-2.amazonaws.com/site/kns2020spring/presentation/20S-525.pdf (accessed on 22 August 2025).
  108. Zuo, C.; Huang, J.; Yang, J.; Zhang, L.G. Design and analysis of a beam uniformity detector based on Faraday cup array. In Proceedings of the 4th Internamtional Beam Instrumentation Conference (IBIC), Barcelona, Spain, 11–15 September 2016; pp. 1–4. [Google Scholar] [CrossRef]
  109. Rosing, M.; Hummer, C.; Zolecki, R. The measurement of Twiss parameters using segmented Faraday Cups. In Proceedings of the IEEE Particle Accelerator Conference, Accelerator Science and Technology, Chicago, IL, USA, 20–23 March 1989; pp. 1586–1588. [Google Scholar] [CrossRef]
  110. Knolle, D.; Ratschko, D.D.; Gläser, M. A segmented Faraday cup for two-dimensional representation of the current distribution of an ion beam. Rev. Sci. Instrum. 1996, 67, 3082–3084. [Google Scholar] [CrossRef]
  111. Kosonen, S.T.; Kalvas, T.; Tarvainen, O.; Toivanen, V. Empirical study of multidimensional Child-Langmuir law with plasma ion source extraction using round apertures. J. Phys. Conf. Ser. 2022, 2244, 012079. [Google Scholar] [CrossRef]
  112. Huo, W.; Hu, J.; Qin, L.; Cao, X.; Zhao, W. Variable beam entrance Faraday cup system for pulsed electron beam current profile characterization. Rev. Sci. Instrum. 2020, 91, 113303. [Google Scholar] [CrossRef]
  113. Godlove, T.F.; Toms, M.E.; Jones, D.W.; Murray, K.M. Faraday cup and secondary-emission monitor calibration. IEEE Trans. Nucl. Sci. 1967, 14, 215–216. [Google Scholar] [CrossRef]
  114. Chapman, S.J.; Hewett, D.P.; Trefethen, L.N. Mathematics of the Faraday cage. Siam Rev. 2015, 57, 398–417. [Google Scholar] [CrossRef]
  115. Conecici, L.M.; Munteanu, C.; Purcar, I.M. Study of the shielding performances of different materials regarding Electromagnetic Field Interference. Iop Conf. Ser. Mater. Sci. Eng. 2017, 200, 012045. [Google Scholar] [CrossRef]
  116. Becherini, G.; Di Fraia, S.; Schneider, M.; Ciolini, R.; Tellini, B. Shielding of high magnetic fields. In Proceedings of the 2008 14th Symposium on Electromagnetic Launch Technology, Victoria, BC, Canada, 10–13 June 2008; pp. 1–6. [Google Scholar] [CrossRef]
  117. Abdullah, M.A.H.; Rashid, R.S.M.; Amran, M.; Hejazii, F.; Azreen, N.M.; Fediuk, R.; Voo, Y.L.; Vatin, N.I.; Idris, M.I. Recent Trends in Advanced Radiation Shielding Concrete for Construction of Facilities: Materials and Properties. Polymers 2022, 14, 2830. [Google Scholar] [CrossRef] [PubMed]
  118. Wang, K.; Ma, L.; Yang, C.; Bian, Z.; Zhang, D.; Cui, S.; Wang, M.; Chen, Z.; Li, X. Recent Progress in Gd-Containing Materials for Neutron Shielding Applications: A Review. Materials 2023, 16, 4305. [Google Scholar] [CrossRef] [PubMed]
  119. Brenner, K.; Zimmermann, M.; Butterling, M.; Wagner, A.; Hugenschmidt, C.; Guatieri, F. Spatially-resolved charge detectors for particle beam optimization with femtoampere resolution achieved by in-vacuum signal preamplification. arXiv 2024, arXiv:2402.06902. [Google Scholar] [CrossRef]
  120. Harrison, R.G.; Robert, D. A Faraday cup for charge measurements in biophysical and environmental fieldwork. J. Electrost. 2025, 135, 104062. [Google Scholar] [CrossRef]
  121. Texas Instruments. OPA129 Precision FET-Input Op Amp. 2020. Available online: https://datasheet.octopart.com/OPA129U-Texas-Instruments-datasheet-8443484.pdf (accessed on 22 August 2025).
  122. FEMTO Messtechnik GmbH. DLPCA-200 Variable Gain Transimpedance Amplifier. 2022. Available online: https://www.femto.de/en/products/current-amplifiers/dlpca-200.html (accessed on 22 August 2025).
  123. Koornneef, J.M.; Bouman, C.; Schwieters, J.B.; Davies, G.R. Measurement of small ion beams by thermal ionisation mass spectrometry using new 1013 Ohm resistors. Anal. Chim. Acta 2014, 819, 49–55. [Google Scholar] [CrossRef]
  124. Cox, S.E.; Hemming, S.R.; Tootell, D. The Isotopx NGX and ATONA Faraday amplifiers. Geochronology 2020, 2, 231–243. [Google Scholar] [CrossRef]
  125. Brown, F.B.; Mosteller, R.D.; Sood, A. Verification of MCNP 5. Available online: https://mcnp.lanl.gov/pdf_files/TechReport_2002_LANL_LA-UR-02-3199_BoothBrownEtAl.pdf (accessed on 22 August 2025).
  126. Battistoni, G.; Boehlen, T.; Cerutti, F.; Chin, P.W.; Esposito, L.S.; Fasso, A.; Ferrari, A.; Lechner, A.; Empl, A.; Mairani, A.; et al. Overview of the FLUKA code. Ann. Nucl. Energy 2015, 82, 10–18. [Google Scholar] [CrossRef]
  127. Donegani, E.M.; Olsson, A.; Page, L.; Ruelas, M. Design and performance of the shielded DTL4 Faraday cup for the commissioning of the high-power ESS proton linac. Nucl. Instrum. Methods Phys. Res. Sect. A Accel. Spectrometers Detect. Assoc. Equip. 2023, 1057, 168727. [Google Scholar] [CrossRef]
  128. Frasca, A.; Kersevan, R.; Lerner, G.; Welsch, C.; Ciarma, A.; Kumar, N.; Boscolo, M.; Calviani, M.; Calzolari, D.; Perillo Marcone, A.; et al. Energy deposition and radiation level studies for the FCC ee experimental insertions. In Proceedings of the 15th International Particle Accelerator Conference, Nashville, TN, USA, 19–24 May 2024; pp. 1152–1155. [Google Scholar] [CrossRef]
  129. PIC Wire. Triaxial Cables for Low-Current Measurements. 2022. Available online: https://picwire.com/Resources/Technical/Technical-Articles/Coaxial-Cable-vs-Triaxial-Cable (accessed on 22 August 2025).
  130. Tektronix. Triaxial Cables for Low-Current Measurements. Available online: https://www.tek.com/en/documents/application-note/making-stable-low-current-measurements-high-test-connection-capacitance (accessed on 22 August 2025).
  131. Nyquist, H. Thermal Agitation of Electric Charge in Conductors. Phys. Rev. 1928, 32, 110–113. [Google Scholar] [CrossRef]
  132. Nouzák, L.; James, D.; Němeček, Z.; Šafránková, J.; Pavlů, J.; Nováková, J.; Vaverka, J.; Sternovsky, Z. Detection of Dust Particles Using Faraday Cup Instruments. Astrophys. J. 2021, 909, 132. [Google Scholar] [CrossRef]
  133. Gavin, H.P.; Morales, R.; Reilly, K. Drift-free integrators. Rev. Sci. Instrum. 1998, 69, 2171–2175. [Google Scholar] [CrossRef]
  134. Chen, H.L.; Chen, P.S.; Chiang, J.S. A Low-Offset Low-Noise Sigma-Delta Modulator with Pseudorandom Chopper-Stabilization Technique. IEEE Trans. Circuits Syst. I Regul. Pap. 2009, 56, 2533–2543. [Google Scholar] [CrossRef]
  135. CAEN DT5730—8-Channel, 14-bit, 500 MS/s Digitizer. 2022. Available online: https://www.caen.it/products/dt5730/ (accessed on 22 August 2025).
  136. Adaptive Computing Support. Available online: https://www.xilinx.com/support/download.html (accessed on 22 August 2025).
  137. Altera featured products. Available online: https://www.altera.com/ (accessed on 22 August 2025).
  138. Kamil, M. Simple digital integration algorithm with saturation and drift elimination based Second-Order Generalized Integrator. In Proceedings of the 2015 9th International Conference on Compatibility and Power Electronics (CPE), Lisbon, Portugal, 24–26 June 2015; pp. 312–316. [Google Scholar] [CrossRef]
  139. Hung-Chie, C. Stable baseline correction of digital strong-motion data. Bull. Seismol. Soc. Am. 1997, 87, 932–944. [Google Scholar] [CrossRef]
  140. El Pro Cus. What is Analog to Digital Converter and Its Working. 2025. Available online: https://www.elprocus.com/analog-to-digital-converter (accessed on 22 August 2025).
  141. Oppenheim, A.V.; Schafer, R.W. Discrete-Time Signal Processing; Prentice-Hall Inc.: Englewood Cliffs, NJ, USA, 2010; Available online: https://research.iaun.ac.ir/pd/naghsh/pdfs/UploadFile_2230.pdf (accessed on 22 August 2025).
  142. Harris, F.J. On the use of windows for harmonic analysis with the discrete Fourier transform. Proc. IEEE 1978, 66, 51–83. [Google Scholar] [CrossRef]
  143. Mandal, S.; Sau, S.; Chakrabarti, A.; Chattopadhyay, S. FPGA based High Speed Data Acquisition System for High Energy Physics Application. arXiv 2015, arXiv:1503.08819. [Google Scholar] [CrossRef]
  144. Seifert, B.; Eizinger, M.; Hörbe, T.; Gerger, J.; Fries, J.; Bettiol, L. From Analog to Digital Faraday Cups: An Overview of FOTEC’s Plasma Diagnostics Equipment Evolution. In Proceedings of the AIAA SCITECH 2025 Forum, Orlando, FL, USA, 6–10 January 2025; p. 1667. [Google Scholar] [CrossRef]
  145. Villamarín, D. Design of a high performance Digital data AcquIsition SYstem (DAISY) for innovative nuclear experiments. Nucl. Instrum. Methods Phys. Res. Sect. A Accel. Spectrometers Detect. Assoc. Equip. 2023, 1055, 168526. [Google Scholar] [CrossRef]
  146. Xilinx. Zynq-7000 SoC Overview. 2022. Available online: https://www.xilinx.com/products/silicon-devices/soc/zynq-7000.html (accessed on 22 August 2025).
  147. Liu, G.; Bao, Y.; Yue, N.; Wang, S.; Wu, H.; Liu, Q.; Yang, W. A GPU-based real-time processing system for frequency division multiple-input-multiple-output radar. Iet Radar Sonar Navig. 2023, 17, 1524–1537. [Google Scholar] [CrossRef]
  148. The White Rabbit Project. 2024. Available online: https://white-rabbit.web.cern.ch/ (accessed on 22 August 2025).
  149. Kester, W. Mixed Signal and DSP Design Techniques; Analog Devices: Wilmington, MA, USA, 2002; Available online: https://www.analog.com/en/resources/technical-books/mixed_signal_dsp_design_book.html (accessed on 29 June 2025).
  150. Brun, R.; Rademakers, F. ROOT—An object oriented data analysis framework. Nucl. Instrum. Methods Phys. Res. Sect. A Accel. Spectrometers Detect. Assoc. Equip. 1997, 389, 81–86. [Google Scholar] [CrossRef]
  151. National Instruments. Introduction to EPICS. 2025. Available online: https://www.ni.com/en/shop/seamlessly-connect-to-third-party-devices-and-supervisory-system/introduction-to-epics.html?srsltid=AfmBOooC6Wah9oSiORPsE2K2nuaZuyqRyKC3f80-ADvr6HjrhYBasmaY (accessed on 22 August 2025).
  152. Singh, R.; Klaproth, S.; Forck, P.; Reichert, T.; Reiter, A.; Rodrigues, G. Simulation and Measurements of the Fast Faraday Cups at GSI UNILAC. In Proceedings of the 11th International Beam Instrumentation Conference (IBIC’22), Kraków, Poland, 1–15 September 2022; JACOW Publishing: Geneva, Switzerland, 2022; pp. 286–290. [Google Scholar] [CrossRef]
  153. Mal, K.; Kumar, S.; Rodrigues, G.; Singh, R. Study and improvements of a radially coupled coaxial Fast Faraday cup design toward lower intensity beams. Aip Adv. 2022, 12, 125223. [Google Scholar] [CrossRef]
  154. Shemyakin, A. Estimation of Dilution of a Fast Faraday Cup Response Due to the Finite Particles Speed; Technical Report; Fermilab: Batavia, IL, USA, 2016. Available online: https://lss.fnal.gov/archive/test-tm/2000/fermilab-tm-2641-ad.pdf (accessed on 22 August 2025).
  155. Sefkow, A.B.; Davidson, R.C.; Efthimion, P.C.; Gilson, E.P.; Yu, S.S.; Roy, P.K.; Bieniosek, F.M.; Coleman, J.E.; Eylon, S.; Greenway, W.G.; et al. Fast Faraday cup to measure neutralized drift compression in intense ion charge bunches. Phys. Rev. Spec. Top. Beams 2006, 9, 052801. [Google Scholar] [CrossRef]
  156. Singh, R.; Barth, W.; Forck, P.; Lauber, S.; Miski-Oglu, M.; Reichert, T.; Scarpine, V.; Sieber, T.; Sun, D. Comparison of Feschenko BSM and Fast Faraday Cup with Low Energy Ion Beams. JACoW 2021, IBIC2021, WEPP16. [Google Scholar] [CrossRef]
  157. Caravita, R. Towards Measuring Gravity on Neutral Antimatter. Ph.D. Thesis, Genoa University, Genoa, Italy, 2018. Available online: https://cds.cern.ch/record/2640201 (accessed on 22 August 2025).
  158. Johnson, M.A. Design and Commissioning of Beamlines for the ALPHA Antihydrogen Experiment. Ph.D. Thesis, The University of Manchester, Manchester, UK, 2019. Available online: https://search.proquest.com/openview/24c156b0a071c869db79c73a4fe9d960/1?pqorigsite=gscholar&cbl=18750&diss=y (accessed on 29 June 2025).
  159. Cerchiari, G.; Kellerbauer, A.; Safronova, M.S.; Safronova, U.I.; Yzombard, P. Ultracold anions for high-precision antihydrogen experiments. Phys. Rev. Lett. 2018, 120, 133205. [Google Scholar] [CrossRef]
  160. Latacz, B.M.; Fleck, M.; Jäger, J.I.; Umbrazunas, G.; Arndt, B.P.; Erlewein, S.R.; Wursten, E.J.; Devlin, J.A.; Micke, P.; Abbass, F.; et al. Orders of Magnitude Improved Cyclotron-Mode Cooling for Nondestructive Spin Quantum Transition Spectroscopy with Single Trapped Antiprotons. Phys. Rev. Lett. 2024, 133, 053201. [Google Scholar] [CrossRef]
  161. Fischer, J.; Schmidt, A.; Azaryan, N.; Butin, F.; Somoza, J.F.; Husson, A.; Klink, C.; Obertelli, A.; Schlaich, M.; Sinturel, A.; et al. Design and characterization of an antiproton deceleration beamline for the PUMA experiment. Nucl. Instrum. Methods Phys. Res. Sect. B Beam Interact. Mater. Atoms 2024, 550, 165318. [Google Scholar] [CrossRef]
  162. Andresen, G.; ALPHA Collaboration. Antimatter Plasmas in a Multipole Trap for Antihydrogen. Phys. Rev. Lett. 2007, 98, 023402. [Google Scholar] [CrossRef]
  163. Andresen, G.; ALPHA Collaboration. Antiproton, positron, and electron imaging with a microchannel plate/phosphor detector. Rev. Sci. Instrum. 2009, 80, 123701. [Google Scholar] [CrossRef]
  164. Kornakov, G.; Cerchiari, G.; Zieliński, J.; Lappo, L.; Sadowski, G.; Doser, M. Synthesis of cold and trappable fully stripped highly charged ions via antiproton-induced nuclear fragmentation in traps. Phys. Rev. C 2023, 107, 034314. [Google Scholar] [CrossRef]
  165. Butler, B. Antihydrogen Formation, Dynamics and Trapping. Ph.D. Thesis, Swansea University, Swansea, UK, 2011. Available online: https://cds.cern.ch/record/1350519 (accessed on 22 August 2025).
  166. Smorra, C.; Blaum, K.; Bojtar, L.; Borchert, M.; Franke, K.A.; Higuchi, T.; Leefer, N.; Nagahama, H.; Matsuda, Y.; Mooser, A.; et al. BASE–the baryon antibaryon symmetry experiment. Eur. Phys. J. Spec. Top. 2015, 224, 3055–3108. [Google Scholar] [CrossRef]
  167. Gabrielse, G. Trapped antihydrogen in its ground state. Phys. Rev. Lett. 2012, 108, 113002. [Google Scholar] [CrossRef]
  168. Vallis, N.; Auchmann, B.; Craievich, P.; Duda, M.; Garcia-Rodrigues, H.; Kosse, J.; Schaer, M. P3: A Positron source demonstrator for FCC-ee. In Proceedings of the 65th ICFA Advanced Beam Dynamics Workshop High Luminosity Circular e+ e Colliders, Frascati, Italy, 12–15 September 2022. [Google Scholar] [CrossRef]
  169. Rienäcker, B.; Mariazzi, S.; Povolo, L.; Guatieri, F.; Caravita, R.; Penasa, L.; Pino, F.; Nebbia, G.; Brusa, R.S. Method for measuring positron number in high intensity nanosecond positron bunches based on Poisson statistic. Nucl. Instrum. Methods Phys. Res. Sect. A Accel. Spectrometers Detect. Assoc. Equip. 2022, 1033, 166661. [Google Scholar] [CrossRef]
  170. Watson, T.L. Accumulation and Manipulation of Positron Plasmas for Antihydrogen Production. Ph.D. Thesis, University of Wales Swansea, Swansea, UK, 2003. Available online: https://books.google.co.uk/books?id=61B50AEACAAJ (accessed on 22 August 2025).
  171. Aghion, S.; Amsler, C.; Ariga, A.; Ariga, T.; Belov, A.S.; Bonomi, G.; Bräunig, P.; Bremer, J.; Brusa, R.S.; Cabaret, L.; et al. Positron bunching and electrostatic transport system for the production and emission of dense positronium clouds into vacuum. Nucl. Instrum. Methods Phys. Res. Sect. A Accel. Spectrometers Detect. Assoc. Equip. 2015, 362, 86–92. [Google Scholar] [CrossRef]
  172. Dubov, L.; Akmalova, Y.; Stepanov, S.; Shtotsky, Y.; Shtotsky, Y. Evaluation of Positron Implantation Profiles in Various Materials for 22Na Source. Acta Phys. Pol. A 2017, 132, 1482–1485. [Google Scholar] [CrossRef]
  173. Li, X.; Barbiellini, B.; Di Noto, V.; Pagot, G.; Zheng, M.; Ferragut, R. A Positron Implantation Profile Estimation Approach for the PALS Study of Battery Materials. Condens. Matter 2023, 8, 48. [Google Scholar] [CrossRef]
  174. Maher, S.; Jjunju, F.P.; Taylor, S. Colloquium: 100 years of mass spectrometry: Perspectives and future trends. Rev. Mod. Phys. 2015, 87, 113–135. [Google Scholar] [CrossRef]
  175. Dempster, A.J. A new Method of Positive Ray Analysis. Phys. Rev. 1918, 11, 316–325. [Google Scholar] [CrossRef]
  176. Aston, F.W. A new mass-spectrograph and the whole number rule. Proc. R. Soc. Lond. A 1927, 115, 487–514. [Google Scholar] [CrossRef]
  177. Alvarez, L.W. Ernest Orlando Lawrence. 1967. Available online: https://history.aip.org/phn/11604030.html (accessed on 22 August 2025).
  178. Revesz, K.M.; Wehr, J.M.; Keybl, J. Measurement of Delta13C and Delta18O Isotopic Ratios of CaCO3 Using a Thermoquest Finnigan GasBench II Delta Plus XL Continuous Flow Isotope Ratio Mass Spectrometer with Application to Devils Hole Core DH-11 Calcite; Technical report; US Geological Survey, National Center: Reston, VA, USA, 2001. [Google Scholar] [CrossRef]
  179. Yang, Z.; Ren, Z.; Cheng, Y.; Sun, W.; Xi, Z.; Jia, W.; Li, G.; Wang, Y.; Guo, M.; Li, D. Review and prospect on portable mass spectrometer for recent applications. Vacuum 2022, 199, 110889. [Google Scholar] [CrossRef]
  180. Gilchrist, K.H.; Bower, C.A.; Lueck, M.R.; Piascik, J.R.; Stoner, B.R.; Natarajan, S.; Parker, C.B.; Glass, J.T. A Novel Ion Source and Detector for a Miniature Mass Spectrometer. In Proceedings of the SENSORS, Atlanta, GA, USA, 28–31 October 2007; pp. 1372–1375. [Google Scholar] [CrossRef]
  181. Schneider, J.M.; Kleine, T. Effects of Faraday cup deterioration on Sr and Cr isotope analyses by thermal ionization mass spectrometry. J. Anal. At. Spectrom. 2024, 39, 1910–1918. [Google Scholar] [CrossRef]
  182. Panitzsch, L.; Stalder, M.; Wimmer-Schweingruber, R.F. Direct high-resolution ion beam-profile imaging using a position-sensitive Faraday cup array. Rev. Sci. Instrum. 2009, 80. [Google Scholar] [CrossRef]
  183. Goebel, D.M.; Katz, I.; Mikellides, I.G. Fundamentals of Electric Propulsion; John Wiley and Sons: Hoboken, NJ, USA, 2008. [Google Scholar] [CrossRef]
  184. Hilton, H.H.; Stevens, J.R. Faraday Cup Detectors. The Aerospace Corporation Rept. TR-0172 (2260-20)-3, El Segundo, CA. 1971. Available online: https://apps.dtic.mil/sti/tr/pdf/AD0732284.pdf (accessed on 22 August 2025).
  185. Habl, L.; Rafalskyi, D.; Lafleur, T. Ion beam diagnostic for the assessment of miniaturized electric propulsion systems. Rev. Sci. Instrum. 2020, 91, 093501. [Google Scholar] [CrossRef]
  186. Pioch, R.; Désangles, V.; Chabert, P. Investigation of the directional Faraday cup and improvement of the comparison between direct and indirect thrust measurements of a magnetic nozzle ECR thruster. Phys. Plasmas 2024, 31, 043516. [Google Scholar] [CrossRef]
  187. Hey, F.G.; Vaupel, M.; Groll, C.; Tajmar, M.; Sell, A.; Eckert, K.; Weise, D.; Saks, N.; Johann, U. Development of a Gridless Retarding Potential Analyser. In Proceedings of the 35th International Electric Propulsion Conference, Atlanta, GA, USA, 8–12 October 2017; Available online: https://electricrocket.org/IEPC/IEPC_2017_271.pdf (accessed on 22 August 2025).
  188. Bramanti, C.; Fearn, D. The design and operation of beam diagnostics for the dual stage 4-grid ion thruster. In Proceedings of the 30th International Electric Propulsion Conference, Florence, Italy, 17–20 September 2007; pp. 17–20. Available online: https://electricrocket.org/IEPC/IEPC-2007-050.pdf (accessed on 22 August 2025).
  189. Brown, D.L.; Gallimore, A.D. Evaluation of ion collection area in Faraday probes. Rev. Sci. Instrum. 2010, 81, 063504. [Google Scholar] [CrossRef] [PubMed]
  190. Hallouin, T.; Guglielmi, A.; Gurciullo, A.; Moriconi, B.; Mazouffre, S. Far-field plume properties of a cluster of 100 W-class permanent magnets Hall thrusters. In Proceedings of the 37th International Electric Propulsion Conference, Boston, MA, USA, 19–23 June 2022; Available online: https://hal.science/hal-03797516v1 (accessed on 22 August 2025).
  191. Rakhimov, R.G.; Kharlan, Y.Y.; Uzhinsky, I.; Milov, A.E.; Aypov, R.E.; Cherniy, I.A. Numerical simulation of plasma discharge in RF ion thruster. In Proceedings of the 36th International Electric Propulsion Conference, Vienna, Austria, 15–20 September 2019; pp. 15–20. Available online: https://www.researchgate.net/publication/336013173_Numerical_simulation_of_plasma_discharge_in_RF_ion_thruster (accessed on 22 August 2025).
  192. Taploo, A.; Lin, L.; Keidar, M. Air ionization in self-neutralizing air-breathing plasma thruster. J. Electr. Propuls. 2022, 1, 25. [Google Scholar] [CrossRef]
  193. Scharmann, S.; Keil, K.; Zorn, J.; Dietz, P.; Nauschütt, B.; Holste, K.; Hannemann, K.; Klar, P.J.; Kloss, S.; Graubner, S.; et al. Thrust measurement of an ion thruster by a force probe approach and comparison to a thrust balance. Aip Adv. 2022, 12, 045218. [Google Scholar] [CrossRef]
  194. Zhang, Z.; Zhang, Z.; Tang, H.; Ling, W.Y.L.; Chen, Z.; Ren, J.; Cao, J. Measurement of the distribution of charge exchange ions in a Hall-effect thruster plume. Plasma Sources Sci. Technol. 2020, 29, 085001. [Google Scholar] [CrossRef]
  195. Mühlich, N.S.; Seifert, B.; Ceribas, E.; Gerger, J.; Aumayr, F. High-precision digital Faraday cups for FEEP thrusters. J. Instrum. 2022, 17, P08008. [Google Scholar] [CrossRef]
  196. Hofer, R.R.; Gallimore, A.D. A Comparison of Nude and Collimated Faraday Probes for Use with Hall Thrusters. In Proceedings of the 27th International Electric Propulsion Conference, Pasadena, CA, USA, 14–19 October 2001; Available online: https://api.semanticscholar.org/CorpusID:15143357 (accessed on 22 August 2025).
  197. Tsui, C.K.; Boedo, J.A.; Stangeby, P.C.; TCV Team. Accounting for Debye sheath expansion for proud Langmuir probes in magnetic confinement fusion plasmas. Rev. Sci. Instrum. 2018, 89, 013505. [Google Scholar] [CrossRef]
  198. Chen, F.F. Langmuir probe analysis for high density plasmas. Phys. Plasmas 2001, 8, 3029–3041. [Google Scholar] [CrossRef]
  199. Karamcheti, A.; Steinbrüchel, C. Parametrization of Laframboise’s results for spherical and cylindrical Langmuir probes. J. Vac. Sci. Technol. A 1999, 17, 3051–3056. [Google Scholar] [CrossRef]
  200. Rawat, B.S.; Sharma, S.K.; Prahlad, V.; Choksi, B.; Baruah, U.K. Experimental Studies on the Roles of Space Charge Neutralization in a Ring Cusp Ion Source. IEEE Trans. Plasma Sci. 2023, 51, 2218–2224. [Google Scholar] [CrossRef]
  201. Kucerovsky, D.; Kucerovsky, Z. Analysis of the dynamic Faraday cup. J. Phys. D Appl. Phys. 2003, 36, 2407. [Google Scholar] [CrossRef]
  202. Sotnikov, O.; Ivanov, A.; Belchenko, Y.; Gorbovsky, A.; Deichuli, P.; Dranichnikov, A.; Emelev, I.; Kolmogorov, V.; Kondakov, A.; Sanin, A.; et al. Development of high-voltage negative ion based neutral beam injector for fusion devices. Nucl. Fusion 2021, 61, 116017. [Google Scholar] [CrossRef]
  203. Rostoker, N.; Fisher, A.; Leader, J.C. High Flux Neutral Beams. Technical report; University of California: Los Angeles, CA, USA, 1990; Available online: https://apps.dtic.mil/sti/html/tr/ADA236994/ (accessed on 22 August 2025).
  204. Sasao, M.; Nishitani, T.; Krasilnilov, A.; Popovichev, S.; Kiptily, V.; Kallne, J. Chapter 9: Fusion product diagnostics. Fusion Sci. Technol. 2008, 53, 604–639. [Google Scholar] [CrossRef]
  205. Yamamoto, S.; Ogawa, K.; Isobe, M.; Darrow, D.S.; Kobayashi, S.; Nagasaki, K.; Okada, H.; Minami, T.; Kado, S.; Ohshima, S.; et al. Faraday-cup-type lost fast ion detector on Heliotron J. Rev. Sci. Instrum. 2016, 87. [Google Scholar] [CrossRef]
  206. Lei, G.J.; Yan, L.W.; Liu, D.P.; Zhang, X.M.; Zhao, M.; Geng, S.F.; Li, M.; Zhang, Y.X.; Bi, Z.H.; Bu, Y.N.; et al. Development of megawatt radiofrequency ion source for the neutral beam injector on HL-2A tokamak. Nucl. Fusion 2021, 61, 036019. [Google Scholar] [CrossRef]
  207. Arcimovich, L.A.; Bobrovskij, G.L.; Gorbunov, E.P.; Ivanov, D.P.; Kirillov, V.D.; Kuznecov, J.I.; Mirnov, S.V.; Petrov, M.P.; Razumova, K.A.; Strelkov, V.; et al. Experiments in Tokamak Devices. In Proceedings of the International Conference on Plasma Physics and Controlled Nuclear Fusion Research, Novosibirsk, Russia, 1–7 August 1968; pp. 157–171. Available online: https://inis.iaea.org/records/210rf-1g491 (accessed on 22 August 2025).
  208. Wesson, J.; Campbell, J.D. Tokamaks; Oxford University Press: Oxford, UK, 2011; Volume 149, Available online: https://books.google.com/books?hl=en&lr=&id=XJssMXjHUr0C&oi=fnd&pg=PP2&dq=Wesson,+John+and+Campbell,+David+J+TOKAMAKS&ots=EDmi0K5iDe&sig=Yt8r4Du8Suz8XhP36aafrMY3Ffo (accessed on 22 August 2025).
  209. Manchanda, R.; Chowdhuri, M.B.; Ghosh, J.; Ramaiya, N.; Yadava, N.; Patel, S.; Shukla, G.; Shah, K.; Dey, R.; Jadeja, K.A.; et al. Physics studies of ADITYA & ADITYA-U tokamak plasmas using spectroscopic diagnostics. Nucl. Fusion 2022, 62, 042014. [Google Scholar] [CrossRef]
  210. Mantica, P.; Bonanomi, N.; Mariani, A.; Carvalho, P.; Delabie, E.; Garcia, J.; Hawkes, N.; Johnson, T.; Keeling, D.; Sertoli, M.; et al. The role of electron-scale turbulence in the JET tokamak: Experiments and modelling. Nucl. Fusion 2021, 61, 096014. [Google Scholar] [CrossRef]
  211. ITER. External Heating Systems—Supporting Systems. 2024. Available online: https://www.iter.org/machine/supporting-systems/external-heating-systems (accessed on 22 August 2025).
  212. Dlougach, E.; Panasenkov, A.; Kuteev, B.; Serikov, A. Neutral beam coupling with plasma in a compact fusion neutron source. Appl. Sci. 2022, 12, 8404. [Google Scholar] [CrossRef]
  213. Sharma, S.K.; Vattilli, P.; Choksi, B.; Punyapu, B.; Sidibomma, R.; Bonagiri, S.; Aggrawal, D.; Baruah, U.K. Design of a Prototype Positive Ion Source with Slit Aperture Type Extraction System. J. Phys. Conf. Ser. 2017, 823, 012025. [Google Scholar] [CrossRef]
  214. Knoll, G.F. Radiation Detection and Measurement; John Wiley and Sons: Hoboken, NJ, USA, 2010; p. 864. Available online: https://books.google.com/books?hl=en&lr=&id=4vTJ7UDel5IC&oi=fnd&pg=PA1&dq=Radiation+Detection+and+Measurement,+4th+Edition+Share+Icon+Glenn+F.+Knoll+&ots=VyDSEVGJaB&sig=w35uM2hySopxJ-8GVQ0RCbPYZTw (accessed on 22 August 2025).
  215. Kak, A.; Kher, A.; Vishwakarma, S.C.; Kumar, A.; Gandhi, M.; Radheshyam, P.; Kumar, A.; Abhinandan, L. Fabrication of an Ultra High Vacuum Compatible Faraday Cup for Qualification of Electron Gun for 10 kW Industrial LINAC. J. Phys. Conf. Ser. 2012, 390, 012069. [Google Scholar] [CrossRef]
  216. Boromiza, M.; Borcea, C.; Dessagne, P.; Ghita, D.; Glodariu, T.; Henning, G.; Kerveno, M.; Marginean, N.; Mihai, C.; Negret, A.; et al. Proton inelastic scattering cross section measurements on 16 O and 28 Si. EPJ Web Conf. 2017, 146, 11015. [Google Scholar] [CrossRef]
  217. Wiedemann, H. Particle Accelerator Physics; Springer: Berlin/Heidelberg, Germany, 2015. [Google Scholar] [CrossRef]
  218. You, H.J.; Jang, S.O.; Choo, W.I. Beam Profile Measurements with a Slit-Faraday Cup and a Wire Scanner for a Newly Developed 18 GHz Superconducting ECR Ion Source and its LEBT. In Proceedings of the 4th International Beam Instrumentation Conference, Barcelona, Spain, 11–15 September 2016; p. MOPB035. [Google Scholar] [CrossRef]
  219. Laschinsky, L.; Karsch, L.; Leßmann, E.; Oppelt, M.; Pawelke, J.; Richter, C.; Schürer, M.; Beyreuther, E. Radiobiological influence of megavoltage electron pulses of ultra-high pulse dose rate on normal tissue cells. Radiat. Environ. Biophys. 2016, 55, 381–391. [Google Scholar] [CrossRef]
  220. Morita, K.; Morimoto, K.; Kaji, D.; Akiyama, T.; Goto, S.I.; Haba, H.; Ideguchi, E.; Kanungo, R.; Katori, K.; Koura, H.; et al. Experiment on the Synthesis of Element 113 in the Reaction 209 Bi(70 Zn, n) 278113. J. Phys. Soc. Jpn. 2004, 73, 2593–2596. [Google Scholar] [CrossRef]
  221. Wang, Y.; Chen, D.; dos Santos , R.; Liang, J.; Qin, Z.; Liu, J.; Liu, Z. Production Review of Accelerator-Based Medical Isotopes. Molecules 2022, 27, 5294. [Google Scholar] [CrossRef]
  222. Evans, L.; Bryant, P. LHC Machine. J. Instrum. 2008, 3, S08001. [Google Scholar] [CrossRef]
  223. Dabrowski, A.; Lefevre, T.; Velasco, M.; Wood, M. Beam Loss Monitoring. 2007. Available online: https://indico.cern.ch/event/17870/session/26/contribution/203/attachments/235310/329275/CLIC_workshop_BeamLossMonitor.pdf (accessed on 22 August 2025).
  224. Anh, N.T.; Chung, L.X.; Anh, L.T.; Anh, T.T.; La Cognata, M.; Dien, M.V.; Hoa, B.T.; Hung, N.T.; Khue, P.D.; Linh, D.T.K.; et al. Faraday Cup Development for Beam Monitoring and Cross-Sectional Measurement of p+12C Elastic Scattering with Ep = 0.95–3.2 MeV. IEEE Trans. Nucl. Sci. 2025, 72, 608–613. [Google Scholar] [CrossRef]
  225. Gambaryan, V.V.; Gubin, K.V.; Levichev, A.E.; Maltseva, Y.I.; Martyshkin, P.V.; Pachkov, A.A.; Peshekhonov, S.N.; Trunov, V.I. Design and test of a Faraday cup for low-charge measurement of electron beams from laser wakefield acceleration. Rev. Sci. Instrum. 2018, 89, 063303. [Google Scholar] [CrossRef] [PubMed]
  226. Hu, H. The design of faraday cup for C-ADS injector I. J. Phys. Conf. Ser. 2025, 2964, 012017. [Google Scholar] [CrossRef]
  227. Margarone, D.; Krása, J.; Giuffrida, L.; Picciotto, A.; Torrisi, L.; Nowak, T.; Musumeci, P.; Velyhan, A.; Prokůpek, J.; Láska, L.; et al. Full characterization of laser-accelerated ion beams using Faraday cup, silicon carbide, and single-crystal diamond detectors. J. Appl. Phys. 2011, 109. [Google Scholar] [CrossRef]
  228. Ablikim, M.; Achasov, M.N.; Ahmed, S.; Albrecht, M.; Alekseev, M.; Amoroso, A.; An, F.F.; An, Q.; Bai, J.Z.; Bai, Y.; et al. Measurement of branching fractions for ψ(3686)→γη, γη, and γπ0. Phys. Rev. D 2017, 96, 052003. [Google Scholar] [CrossRef]
  229. Adamson, P.; Anderson, K.; Andrews, M.; Andrews, R.; Anghel, I.; Augustine, D.; Aurisano, A.; Avvakumov, S.; Ayres, D.S.; Baller, B.; et al. The NuMI neutrino beam. Nucl. Instrum. Methods Phys. Res. Sect. A Accel. Spectrometers Detect. Assoc. Equip. 2016, 806, 279–306. [Google Scholar] [CrossRef]
  230. Abgrall, N.; Andreeva, O.; Aduszkiewicz, A.; Ali, Y.; Anticic, T.; Antoniou, N.; Baatar, B.; Bay, F.; Blondel, A.; Blumer, J.; et al. NA61/SHINE facility at the CERN SPS: Beams and detector system. J. Instrum. 2014, 9, P06005. [Google Scholar] [CrossRef]
  231. Forck, P. Lecture Notes on Beam Instrumentation and Diagnostics. 2022. Available online: https://indico.cern.ch/event/569714/contributions/2303731/attachments/1415057/2166101/juas_script.pdf (accessed on 22 August 2025).
  232. Ponce, A.; Aguilar, J.A.; Tate, J.; Yacamán, M.J. Advances in the electron diffraction characterization of atomic clusters and nanoparticles. Nanoscale Adv. 2021, 3, 311–322. [Google Scholar] [CrossRef]
  233. Barrett, R.J.; Anderson, B.D.; Willard, H.B.; Anderson, A.N.; Jarmie, N. Testing and calibration of a Faraday cup and other intensity monitors for the external proton beam at LAMPF. Nucl. Instrum. Methods 1975, 129, 441–445. [Google Scholar] [CrossRef]
  234. Criegee, L. Untersuchung der direkten Paarbildung durch Elektronen. Zeitschrift für Physik 1960, 158, 433–443. [Google Scholar] [CrossRef]
  235. Elmer, J.W.; Teruya, A.T. An enhanced Faraday cup for rapid determination of power density distribution in electron beams. Weld. J. 2001, 80, 288-s. Available online: https://s3.us-east-1.amazonaws.com/WJ-www.aws.org/supplement/WJ_2001_12_s288.pdf (accessed on 22 August 2025).
  236. Gras, J.J.; Belohrad, D.; Barschel, C.; Odier, P.; Ludwig, M. Optimization of the LHC beam current transformers for accurate luminosity determination. In Proceedings of the 2nd International Particle Accelerator Conferenc, San Sebastian, Spain, 4–9 September 2011; Available online: https://cds.cern.ch/record/1379466 (accessed on 22 August 2025).
  237. Abe, T.; Akai, K.; Akasaka, N.; Akemoto, M.; Akiyama, A.; Arinaga, M.; Cai, Y.; Ebihara, K.; Egawa, K.; Enomoto, A.; et al. Achievements of KEKB. Prog. Theor. Exp. Phys. 2013, 2013. [Google Scholar] [CrossRef]
  238. Roy, P.K.; Taller, S.; Toader, O.; Naab, F.; Dwaraknath, S.; Was, G.S. A Multi-Pinhole Faraday Cup Device for Measurement of Discrete Charge Distribution of Heavy and Light Ions. In Proceedings of the 6th International Particle Accelerator Conference, Richmond, VA, USA, 3–8 May 2015; p. MOPWI009. [Google Scholar] [CrossRef]
  239. Borghesi, M. The first neutrino massmeasurement of HOLMES. 2023. Available online: https://indico.cern.ch/event/1199289/contributions/5447083/attachments/2703332/4692480/TAUP23_Holmes.pdf (accessed on 22 August 2025).
  240. DeWerd, L.A.; Smith, B.R. Ionization Chamber Instrumentation. CRC Press: Boca Raton, FL, USA, 2021; Available online: https://www.taylorfrancis.com/chapters/edit/10.1201/9781351005388-2/ionization-chamber-instrumentation-larry-dewerd-blake-smith (accessed on 22 August 2025).
  241. Papa, A.; Bertschi, S.; Künzi, L.; Signorelli, G. A pixelated Faraday cup for proton beam diagnostics. Nucl. Instrum. Methods Phys. Res. Sect. A Accel. Spectrometers Detect. Assoc. Equip. 2019, 936, 25–26. [Google Scholar] [CrossRef]
  242. Wulff, J.; Paul, A.; Bäcker, C.M.; Baumann, K.S.; Esser, J.N.; Koska, B.; Timmermann, B.; Verbeek, N.G.; Bäumer, C. Consistency of Faraday cup and ionization chamber dosimetry of proton fields and the role of nuclear interactions. Med. Phys. 2024, 51, 2277–2292. [Google Scholar] [CrossRef]
  243. Verhey, L.J.; Koehler, A.M.; McDonald, J.C.; Goitein, M.; Ma, I.C.; Schneider, R.J.; Wagner, M. The Determination of Absorbed Dose in a Proton Beam for Purposes of Charged-Particle Radiation Therapy. Radiat. Res. 1979, 79, 34–54. Available online: https://pubmed.ncbi.nlm.nih.gov/472125/ (accessed on 22 August 2025). [CrossRef]
  244. Cascio, E.W.; Gottschalk, B. A Simplified Vacuumless Faraday Cup for the Experimental Beamline at the Francis H. Burr Proton Therapy Center. In Proceedings of the 2009 IEEE Radiation Effects Data Workshop, Québec City, QC, Canada, 20–24 July 2009; pp. 161–165. [Google Scholar] [CrossRef]
  245. Ehwald, J.; Togno, M.; Lomax, A.J.; Weber, D.C.; Safai, S.; Winterhalter, C. Detailed Monte-Carlo characterization of a Faraday cup for proton therapy. Med. Phys. 2023, 50, 5828–5841. [Google Scholar] [CrossRef] [PubMed]
  246. Perl, J.; Shin, J.; Schümann, J.; Faddegon, B.; Paganetti, H. TOPAS: An innovative proton Monte Carlo platform for research and clinical applications. Med. Phys. 2012, 39, 6818–6837. [Google Scholar] [CrossRef]
  247. Cambria, R.; Hérault, J.; Brassart, N.; Silari, M.; Chauvel, P. Proton beam dosimetry: A comparison between the Faraday cup and an ionization chamber. Phys. Med. Biol. 1997, 42, 1185. [Google Scholar] [CrossRef] [PubMed]
  248. Tesfamicael, B.; Athar, B.; Bejarano Buele, A.; Kozlyuk, V.; Nichiporov, D.; Watts, D.A.; Arjomandy, B. Technical Note: Use of commercial multilayer Faraday cup for offline daily beam range verification at the McLaren Proton Therapy Center. Med. Phys. 2019, 46, 1049–1053. [Google Scholar] [CrossRef]
  249. Yeap, P.L.; Lew, K.S.; Koh, W.Y.; Chua, C.G.; Wibawa, A.; Master, Z.; Lee, J.C.; Park, S.Y.; Tan, H.Q. Proton Beam Range and Charge Verification Using Multilayer Faraday Collector. Technol. Cancer Res. Treat. 2024, 23, 1–9. [Google Scholar] [CrossRef]
  250. Schoenauen, L.; Coos, R.; Colaux, J.L.; Heuskin, A. Design and optimization of a dedicated Faraday cup for UHDR proton dosimetry: Implementation in a UHDR irradiation station. Nucl. Instrum. Methods Phys. Res. Sect. A Accel. Spectrometers Detect. Assoc. Equip. 2024, 1064, 169411. [Google Scholar] [CrossRef]
  251. Marshall, C.; Meisel, Z.; Montes, F.; Wagner, L.; Hermansen, K.; Garg, R.; Chipps, K.A.; Tsintari, P.; Dimitrakopoulos, N.; Berg, G.P.A.; et al. Measurement of Charge State Distributions using a Scintillation Screen. Nucl. Instrum. Methods Phys. Res. Sect. A Accel. Spectrometers Detect. Assoc. Equip. 2023, 1056, 168661. [Google Scholar] [CrossRef]
  252. Jones, A.Z.; Bloch, C.D.; Hall, E.R.; Hashemian, R.; Klein, S.B.; Przewoski, B.v.; Murray, K.M.; Foster, C.C. Comparison of Indiana University Cyclotron Facility Faraday cup proton dosimetry with radiochromic films, a calorimeter, and a calibrated ion chamber. IEEE Trans. Nucl. Sci. 1999, 46, 1762–1765. [Google Scholar] [CrossRef]
  253. Dell, G.F.; Fotino, M. A Compraision of CEA and SLAC Faraday Cup Calibration by Means of a Secondary Emission Monitor; Technical report; Cambridge Electron Accelerator, Mass.: Cambridge, UK, 1968. [CrossRef]
  254. Ghergherehchi, M.; Afarideh, H.; Ghannadi, M.; Mohammadzadeh, A.; Aslani, G.R.; Boghrati, B. Proton beam dosimetry: A comparison between a plastic scintillator, ionization chamber and Faraday cup. J. Radiat. Res. 2010, 51, 423–430. [Google Scholar] [CrossRef]
  255. Delacroix, S.; Mazal, A.; Daures, J.; Ostrowsky, A.; Nauraye, C.; Kacperek, A.; Vynkier, S.; Brassard, N.; Habrand, J. Proton dosimetry comparison involving ionometry and calorimetry. Int. J. Radiat. Oncol. Biol. Phys. 1997, 37, 711–718. [Google Scholar] [CrossRef]
  256. Ajit, A.; Seeger, S.; Gottschalk, M.; Tuch, T.; Wiedensohler, A. Observation of systematic deviations between Faraday cup aerosol electrometers for varying particle sizes and flow rates—results of the AEROMET FCAE workshop. Metrologia 2021, 58, 055006. [Google Scholar] [CrossRef]
  257. Spieler, H. Semiconductor Detector Systems; Oxford University Press: Oxford, UK, 2005; Available online: https://inspirehep.net/literature/700866 (accessed on 22 August 2025).
  258. Sauli, F. The gas electron multiplier (GEM): Operating principles and applications. Nucl. Instrum. Methods Phys. Res. Sect. A Accel. Spectrometers Detect. Assoc. Equip. 2016, 805, 2–24. [Google Scholar] [CrossRef]
  259. Halvorsen, M.M.; Coco, V.; Gkougkousis, E.L.; Collins, P.; Girard, O. The Silicon Electron Multiplier sensor. Nucl. Instrum. Methods Phys. Res. Sect. A Accel. Spectrometers Detect. Assoc. Equip. 2022, 1041, 167325. [Google Scholar] [CrossRef]
  260. Grishin, V.; Dehning, B.; Effinger, E.; Emery, J.; Holzer, B. A family of gas ionization chambers and SEM for beam loss monitoring of LHC and other accelerators. In Proceedings of the 26th Russian Particle Accelerator Conference (RuPAC’18), Protvino, Russia, 1–5 October 2018; pp. 44–48. [Google Scholar] [CrossRef]
  261. Gschwendtner, E.; Assmann, R.W.; Dehning, B.; Ferioli, G.; Kain, V. Ionization chambers for the LHC beam loss detection. In Proceedings of the DIPAC 2003, Mainz, Germany, 5–7 May 2003; Available online: https://cds.cern.ch/record/923970?ln=en (accessed on 22 August 2025).
  262. Lecoq, P. Scintillation detectors for charged particles and photons. In Particle Physics Reference Library: Volume 2: Detectors for Particles and Radiation; Springer: Berlin, Germany, 2020; pp. 45–89. [Google Scholar] [CrossRef]
  263. Joukainen, H.; Sarén, J.; Ruotsalainen, P. Position sensitive plastic scintillator for beta particle detection. Nucl. Instrum. Methods Phys. Res. Sect. A Accel. Spectrometers Detect. Assoc. Equip. 2022, 1027, 166253. [Google Scholar] [CrossRef]
  264. Mezek, G.K. Semiconductor detectors for detection of elementary particles. Available online: https://www2.ung.si/~sstanic/teaching/MEM/2013_Eksp_metode_2_Gasper_Kukec_V2.pdf (accessed on 22 August 2025).
  265. Togawa, M.; Fujii, S.; Imura, M.; Itabashi, K.; Isobe, T.; Miyahara, M.; Nishinaga, J.; Okumura, H. The CIGS semiconductor detector for particle physics. J. Instrum. 2024, 19, C05042. [Google Scholar] [CrossRef]
  266. Zorzetti, S. Digital Signal Processing and Generation for a DC Current Transformer for Particle Accelerators; Technical report; Fermi National Accelerator Lab. (FNAL): Batavia, IL, USA, 2013. [CrossRef]
  267. Unser, K. A Toroidal DC Beam Current Transformer with High Resolution. IEEE Trans. Nucl. Sci. 1981, 28, 2344–2346. [Google Scholar] [CrossRef]
  268. Webber, R.C. Charged particle beam current monitoring tutorial. In Proceedings of the AIP Conference Proceedings, Vancouver, BC, USA, 3–6 October 1994; American Institute of Physics: College Park, MA, USA, 1995; Volume 333, pp. 3–23. [Google Scholar] [CrossRef]
  269. Suwada, T.; Tamiya, K.; Urano, T.; Kobayashi, H.; Asami, A. New analysis and performance of a wall-current monitor. Nucl. Instrum. Methods Phys. Res. Sect. A Accel. Spectrometers Detect. Assoc. Equip. 1997, 396, 1–8. [Google Scholar] [CrossRef]
  270. Ahire, S.A.; Bachhav, A.A.; Pawar, T.B.; Jagdale, B.S.; Patil, A.V.; Koli, P.B. The Augmentation of nanotechnology era: A concise review on fundamental concepts of nanotechnology and applications in material science and technology. Results Chem. 2022, 4, 100633. [Google Scholar] [CrossRef]
  271. Ebrahimibasabi, E.; Feghhi, S.A.H.; Khorsandi, M. Design and simulation of a new Faraday Cup for ES-200 electrostatic accelerator. In Proceedings of the 23rd Russian Particle Accelerator Conference, RuPAC’12—Russian Particle Accelerator Conference, St. Petersburg, Russia, 27–28 September 2012; pp. 682–684. Available online: https://accelconf.web.cern.ch/rupac2012/papers/weppd061.pdf (accessed on 22 August 2025).
  272. Bower, C.A.; Gilchrist, K.H.; Lueck, M.R.; Stoner, B.R. Microfabrication of fine-pitch high aspect ratio Faraday cup arrays in silicon. Sens. Actuators A Phys. 2007, 137, 296–301. [Google Scholar] [CrossRef]
  273. Letcher, E.; Stanton, D.; Novak, D.; Bunnell, K.; Peters, C.; Blomberg, B. Automated Faraday Cup reading at ATLAS. In Proceedings of the 14th International Particle Accelerator Conference (IPAC’14), Venice, Italy, 7–12 May 2023. [Google Scholar] [CrossRef]
  274. Kasper, J.C.; Lazarus, A.J.; Steinberg, J.T.; Ogilvie, K.W.; Szabo, A. Physics-based tests to identify the accuracy of solar wind ion measurements: A case study with the Wind Faraday Cups. J. Geophys. Res. Space Phys. 2006, 111. [Google Scholar] [CrossRef]
  275. Goutierre, E. Machine Learning-Based Particle Accelerator Modeling. Ph.D. Thesis, Université Paris-Saclay, Paris, France, 2024. [Google Scholar]
  276. Garcia, A.S.; Eichler, A.; Xu, C.; Kaiser, J.; Scomparin, L.; Schenk, M.; Pochaba, S.; Hirlaender, S. The reinforcement learning for autonomous accelerators collaboration. JACoW 2024, IPAC2024, TUPS62. [Google Scholar] [CrossRef]
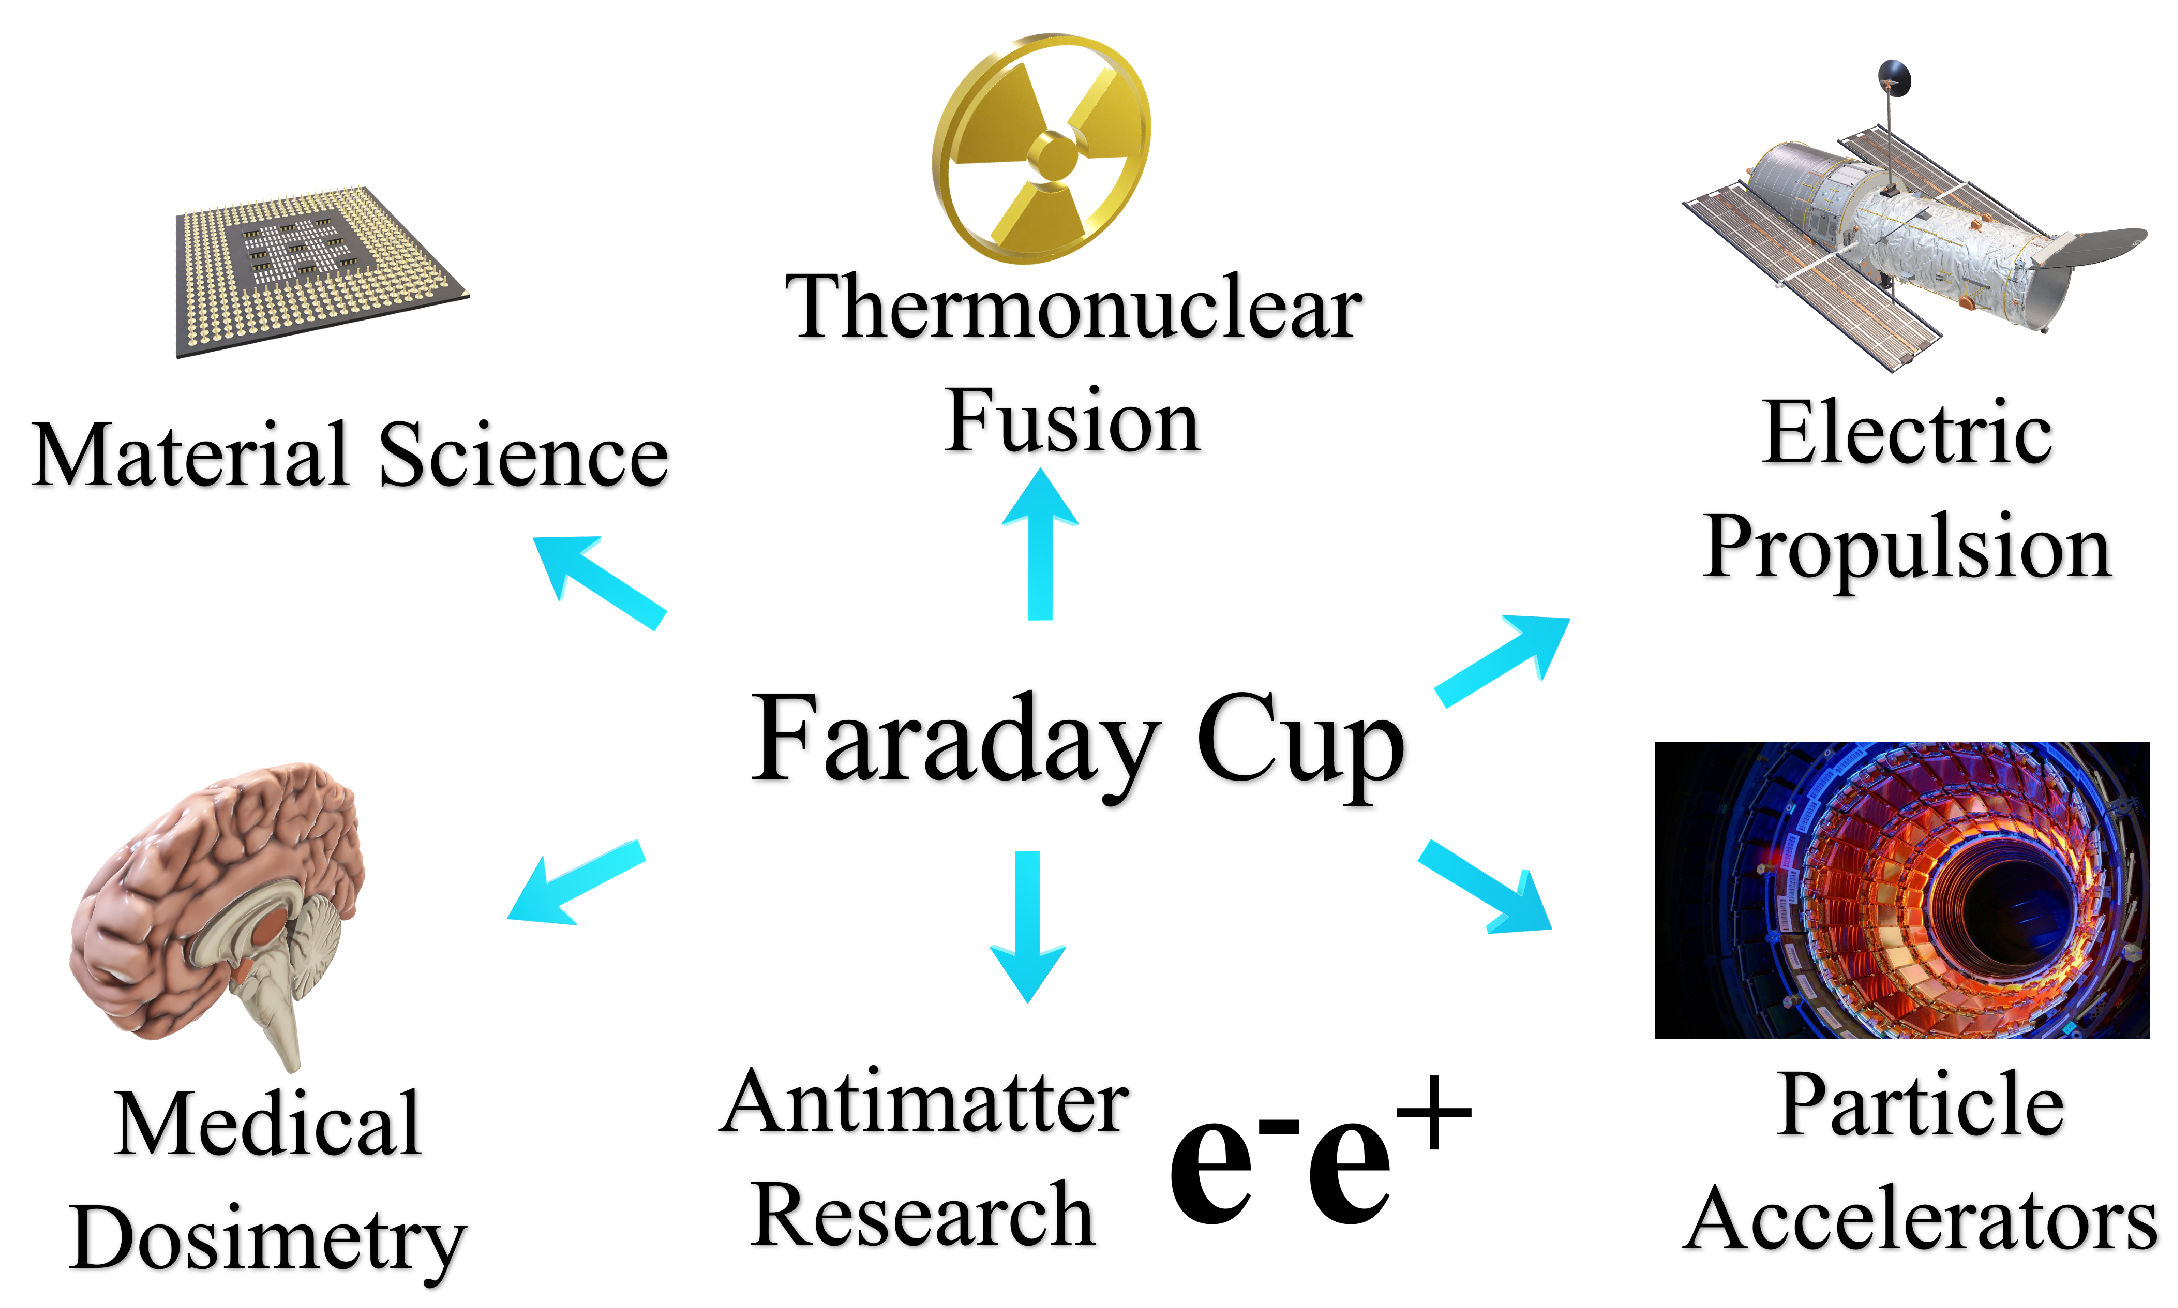
Figure 1. Applications of FCs across different scientific disciplines.
Instruments 09 00020 g001
Figure 2. Schematic showing suppression of secondary electrons using suppressor electrodes: (a) insufficient electron suppression leads to an overestimation of the measured charge; (b) sufficient electron suppression leads to correct charge measurement.
Instruments 09 00020 g002
Figure 6. Schematic showing the typical process of secondary electron emission from a metallic surface.
Instruments 09 00020 g006
Figure 10. (a) Estimated probability density (normalized by the sum over all grid points) of the distribution of backscattered ions simulation performed using TRIM. Target: copper; layer width 5 μ m is irradiated by protons; number of incident particles, N i n p u t = 99,999 ; incident energy, E i n p u t = 10 keV; incident angle, A n g l e i n p u t = 0 . (b) The probability of backscattering as a function of incident energy and the incident angle for simulations, shown in Figure 11, has been calculated as ( N b s / N i n p u t ) × 100 .
Instruments 09 00020 g010
Figure 11. The most probable backscattered energy, E b s , and angles θ b s and ϕ b s in the output of TRIM simulations described in Figure 10 which were run with various incident energy and angle. The spread is calculated as the trace of covariance matrix normalized by trace of uniform distribution for corresponding simulations.
Instruments 09 00020 g011
Figure 12. A typical plot of 500 keV proton in copper target at normal incidence, simulated in TRIM.
Instruments 09 00020 g012
Figure 17. Schematic of resistance transimpedance amplifier circuit.
Instruments 09 00020 g017
Figure 20. Schematic of capacitive transimpedance amplifier circuit.
Instruments 09 00020 g020
Figure 22. Different load-matching conditions and the output signals for an FFC design. (a) Perfect matching: no reflected signals. (b) Short circuit: the reflected signal is of same amplitude but opposite sign. (c) Open circuit: the reflected signal has same amplitude and sign and overlaps with the initial signal doubling its amplitude.
Instruments 09 00020 g022
Figure 23. (a) Schematic of a 1D FFC model by Shyemyakin [154]; (b) planar geometry; (c) cylindrical geometry; (d) spherical geometry.
Instruments 09 00020 g023
Figure 24. (a) Value of geometrical parameter κ as a function of α for geometrical and spherical cases; (b) schematic of Fast Faraday Cup developed for the ALPI post-accelerator by M. Bellato et al. [4].
Instruments 09 00020 g024
Figure 25. Energy spectra of charged particles for annihilation of 300 keV antiprotons on aluminum target simulated in FLUKA [5].
Instruments 09 00020 g025
Figure 26. Voltage drop measured on the FC as a function of bias applied for a positron beam [21].
Instruments 09 00020 g026
Figure 27. Schematic of a mass spectrometer and its important components [178].
Instruments 09 00020 g027
Figure 28. (a) Schematic (not to scale) of the FC with multiple grids developed at the Space Physics Laboratory (LA, California). (b) Plot showing the energy range of protons and electrons detected by the FCs on the satellites launched between 1964 and 1969 [184].
Instruments 09 00020 g028
Figure 29. (a) Comparison of beam current inferred by FCA measurements and beam current measured electrically by assuming a 2 π symmetry (Rawat et al. [24]) for A r + beam in a ring cusp ion source; (b) comparison of beam current inferred from 17 channel FCA with the total beam current (grid current) measurements for a miniature thruster with I + and X e + ion by Habl et al. [185] (reproduced with permission).
Instruments 09 00020 g029
Figure 30. Comparison of different Faraday Cup designs: (a) semi-circular probe FCA for 2D mapping of ion beam profiles by [185]; (b) collimated FCA by [22] (all figures reproduced with permission).
Instruments 09 00020 g030
Figure 31. Comparison of different Faraday Cup designs for ion beam applications: (a) collimated FC for current density measurement of a Hall thruster developed by Hofer et al. [196]; (b) FC design by Rawat et al. for filtering charge exchange ions by using 3-electrode system [200] (reproduced with permission).
Instruments 09 00020 g031
Figure 32. Multi-grid FC for neutral beam current estimation by Okamoto et al. [31].
Instruments 09 00020 g032
Figure 33. (a) Experimental setup for measuring pulsed beam current using the FC [215]. (b) Beam current measurements for various proton beam intensities at INFN-LNS [5] (reproduced with permission).
Instruments 09 00020 g033
Figure 34. A schematic drawing of an experimental setup, consisting of two detectors, relative to the proton beam direction. An FC was placed at the back of the reaction chamber for collecting the protons [216] (reproduced with permission).
Instruments 09 00020 g034
Figure 35. Schematic illustration of the experimental setup at the radiation source of ELBE LINAC [219].
Instruments 09 00020 g035
Figure 36. (a) Experimental set-up of an FC attached to a JEOL 2010F microscope, used to measure the electric current of the electron beam. (b) An electron beam was collected at a magnification of 800,000 times, using a CMOS camera. The two dashed lines indicate the region across which the beam intensity profile was extracted and shown in (c), with a diameter of approximately 55 nm [232] (reproduced with permission).
Instruments 09 00020 g036
Figure 37. Schematic of three physical mechanisms depending on material properties during ion or electron bombardment: reflection, sputtering, and secondary electron emission. The arrows have arbitrary length and direction [23] (reproduced with permission).
Instruments 09 00020 g037
Figure 38. Neutrino mass measurement with HOLMES detector’s Transition Edge Sensors (TESs) [239] (reproduced with permission).
Instruments 09 00020 g038
Figure 39. A pixelated FC for proton beam diagnostics, used in Cockcroft–Walton accelerator facility [241] (reproduced with permission).
Instruments 09 00020 g039
Figure 40. FC modeled in TOPAS by Ehwald et al. [245]. (Reproduced with permission).
Instruments 09 00020 g040
Table 1. Qualitative comparison of commonly used FC materials.
MaterialAdvantagesDisadvantages
Copper (Cu)Cheap, good heat dissipation, high electrical and thermal conductivity, easily machinable, and corrosion resistantProne to oxidation
Aluminum (Al)Cheap, lightweight, good thermal conductivity, and corrosion resistantLower mechanical strength and melting point compared to Cu
Graphite (C)Lightweight, radiation resistant, and high melting pointBrittle, difficult to machine, and average thermal conductivity
Tungsten (W)High melting point, excellent for high-power beamsVery dense and heavy, expensive, and difficult to machine
Titanium (Ti)Strong, lightweight, and corrosion resistantExpensive and difficult to machine
Table 4. Example hardware components used in Faraday Cup signal processing and DAQ.
ComponentExample Model / Specification
Operational AmplifierOPA129 (TI), DLPCA-200 (FEMTO), OPA627 (Burr-Brown)
ADC ModuleCAEN DT5730 (14-bit, 500 MS/s), NI PXIe-5162 (10-bit, 5 GS/s)
DAQ SystemNI PXI, CAEN VME, Keysight Infiniium Oscilloscope
FPGA PlatformXilinx Zynq-7000, Altera Cyclone V
Shielded CableRG-223 Coaxial, Triaxial with Driven Shield
Shielding Materialsµ-metal, lead composite, copper mesh
Table 5. Comparison table of FCs and other diagnostic devices.
DeviceAdvantagesLimitations
FCs [5,6,100]Simple and robust design, direct current measurement, wide dynamic range, radiation hardness, absolute measurements without calibration, suitable for high-intensity beamsLow sensitivity for low currents, slow response times, no energy resolution, secondary electron emission can affect accuracy, destructive measurement
Electron multipliers [258,259]High sensitivity, capable of detecting single ions, fast response timesLimited dynamic range, gain instability over time, requires high-voltage power supplies and complex signal processing
Ionization chambers [260,261]Gas amplification increases sensitivity, non-destructive measurementRequires careful gas handling and calibration, lower resolution compared to electron multipliers, slower response times, saturation at Ultra-High Dose Rates.
Scintillation detectors [262,263]Fast response times, good energy resolutionRequires careful calibration, can be affected by radiation damage, involves complex photomultiplier tubes or photodiodes for signal readout
Semiconductor detectors [264,265]High energy resolution, capable of detecting individual particlesComplex and expensive, sensitive to radiation damage, requires cooling systems for optimal performance
Current transformers (CTs) [266,267]Non-destructive measurement, continuous monitoring without intercepting the beamLimited to pulsed beams, lower sensitivity for DC beams
Beam current transformers (BCTs)Non-invasive, real-time measurement, high accuracyLimited by bandwidth, sensitive to external magnetic fields
Wall current monitors [268,269]Non-interceptive measurement, can measure the image current induced on beam pipe wallsLimited–high-energy beams, requires precise calibration and alignment
Disclaimer/Publisher’s Note: The statements, opinions and data contained in all publications are solely those of the individual author(s) and contributor(s) and not of MDPI and/or the editor(s). MDPI and/or the editor(s) disclaim responsibility for any injury to people or property resulting from any ideas, methods, instructions or products referred to in the content.