1. Introduction
In advanced synchrotron light sources, the injection process in the electron storage ring is a critical factor influencing beam quality and stability. Optimizing the injection process can reduce beam loss, enhance injection efficiency, and minimize interference with experiments [
1,
2,
3,
4,
5,
6,
7,
8]. Therefore, in-depth research of the electron storage ring injection process is of significant theoretical and practical importance.
In the study of bunch injection dynamics, PLS-II (Pohang Light Source-II) uses the particle tracking software ELEGANT to simulate and analyze transient behaviors in the transverse and longitudinal phase spaces during beam injection [
9]. Analysis of this injection system focused on characterizing post-injection beam behavior and evaluating how system errors affect beam capture efficiency. This work established the optimal injected beam conditions and permissible error margins required for high-efficiency injection, while providing operational guidance for tuning the injection system during actual commissioning.
The beam diagnostics team at the Shanghai Synchrotron Radiation Facility (SSRF) has conducted significant research on the transient processes during bunch injection [
10,
11]. In 2017, they employed a dual-frequency method to measure the bunch length evolution during injection [
12], which successfully captured the longitudinal oscillations of bunch length during top-up charge injection, achieving a remarkable measurement uncertainty of 0.49 ps. In 2020, they further investigated the longitudinal phase of the injected bunches [
13]. By comparing the bunch signals before and after injection, they were able to isolate the signals of the injected bunches. Using the signals of the stored bunches as a reference, they calculated the phase of the injected bunches. Additionally, they conducted long-term monitoring of the injection process across different time periods, analyzing the changes in the phase of the injected bunches before and after machine maintenance.
At present, the initial phase and initial bunch length of freshly injected bunches can be measured using the bunch-by-bunch data acquisition and processing system developed by the Shanghai Synchrotron Radiation Facility (SSRF). However, for parameters including initial energy offset, initial energy spread, and initial energy chirp, existing diagnostic tools are unable to provide direct and precise measurements.
In light of the current research landscape, this paper proposes a novel technique for extracting the initial longitudinal phase space parameters of freshly injected bunches in electron storage rings. This technique employs a high-speed oscilloscope to capture beam signals during the injection process and integrates advanced data processing algorithms, enabling the acquisition of bunch phase and bunch length evolution within a single injection cycle. By combining this approach with a newly developed single-bunch tracking simulation software based on the mbtrack2-0.5.0 and PyQt-5.15.10 software, this technology enables the precise determination of the injected bunch’s initial phase, bunch length, energy, energy spread, and energy chirp. These parameters provide critical references for optimizing injection system performance.
2. Simulation Development and Single-Bunch Tracking
As particles move around the ring, they are accelerated by the electric field in the RF cavity, gaining energy, and then lose energy due to synchrotron radiation in the bending magnets. This establishes a dynamic balance, and the total energy change is given by the sum of these two terms [
14]:
where
q is the charge of the particle,
V is the RF cavity voltage,
is the accelerating phase, and
is the energy loss due to synchrotron radiation, which depends on the particle’s energy.
In most practical applications, parameters like the normalized velocity or the energy vary only slowly during acceleration compared to the rate of change of the phase, and we consider them, for the time being, as constants. Under the assumption that the deviation of non-equilibrium particles from the equilibrium particle is small, the phase motion equation of the particle in the RF field is as follows:
By solving the phase motion equation of the particle, we obtain the expression for phase oscillation [
15]:
Similarly, by solving the energy motion equation, we obtain the expression for energy oscillation:
From the above analysis, it can be concluded that during the injection process in the storage ring, individual particles undergo exponentially damped harmonic oscillations in phase space, and this is similar to the particle bunch. However, within the particle bunch, the initial phase and energy of each particle are different, making the analysis of the overall motion in phase space highly complex. In general, the particle bunch in phase space can be approximated as a two-dimensional Gaussian distribution, as shown in
Figure 1. This approximation simplifies the study of the bunch’s overall motion.
Theoretically, for a Gaussian-distributed bunch, if we can measure the phase oscillation curve and bunch length oscillation curve after injection, we can deduce its initial two-dimensional Gaussian distribution at injection, including the initial phase, initial bunch length, initial energy offset, initial energy spread, and initial energy chirp. These parameters are crucial for optimizing the injection system. The measured initial phase can be used to optimize the injection timing sequence, while the initial energy offset informs adjustments to the injection line’s dipole correctors, reducing longitudinal oscillation amplitudes (which could otherwise lead to head or tail bunch losses) and thereby improving injection efficiency. Furthermore, based on the characterized energy chirp, magnetic compressors or RF phase modulation can be implemented in the injector to compensate for the chirp effect, ultimately achieving the goal of bunch length compression.
Based on the above theoretical foundation, to gain deeper insights into the longitudinal phase space evolution of the bunch during the injection process in the electron storage ring, we developed a single-bunch simulation tool using the mbtrack2-0.5.0 and PyQt-5.15.10 software packages [
16,
17,
18]. This tool is designed to track the longitudinal phase space distribution of the bunch after injection.
The user interface of the software is shown in
Figure 2. The interface is divided into the following sections:
1. Left Section (Visualization Area): Top-left: Displays the longitudinal phase space distribution of the injected bunch for a specified number of turns (set on the right panel). Middle-left: Shows the phase evolution results from the beginning to the end of the simulation. Bottom-left: Displays the bunch length evolution results.
2. Right Section: Top-right (Initial Parameter Input Area): Includes the initial bunch length, initial energy spread, initial phase, initial energy offset, and initial energy chirp, used to control the initial phase space distribution of the injected bunch. Bottom-right (Operation Area): Allows the user to control the number of turns to view and displays the specific values of phase and bunch length for the current turn.
3. Bottom Section: Contains buttons for saving data, saving images, and starting the simulation.
The software supports reading of external machine parameter files. By modifying these parameter files, the effects of higher harmonic cavities and wakefields can be taken into account. However, since all simulations in this experiment use a single-bunch model, the influence of higher harmonic cavities and wakefields is not considered.
In mbtrack2, a particle is described as a point in six-dimensional phase space. x and y represent the horizontal and vertical positions, respectively. and represent the transverse momentum in the horizontal and vertical directions. is the time difference relative to the reference particle. represents the energy offset relative to the reference energy .
If
, the particle is delayed relative to the reference particle. In this case, we only track the longitudinal motion of
and
. Due to the effects of the RF cavity and synchrotron radiation damping, the iteration for
and
follows the code below [
19]:
In this context,
is the momentum compaction factor;
is the revolution time;
is the energy loss per turn;
is the total energy;
h is the harmonic number;
is the revolution angular frequency;
is the accelerating phase;
is the longitudinal damping time;
is the standard deviation of
; and
is a randomly distributed number with mean 0 and standard deviation 1. This formula describes the energy dissipation and noise effects on particle motion due to synchrotron radiation. A more comprehensive discussion can be found in the pertinent publications [
20].
We conducted separate simulations for injected bunches with characteristically different initial distributions. The initial phase space parameters used in these simulations are listed in
Table 1, while the corresponding initial phase space distributions and longitudinal charge distribution are shown in
Figure 3. In the longitudinal charge distribution, the horizontal axis is the turn number, the vertical axis is the longitudinal phase, and the color from blue to yellow represents the density from small to large. This figure also reflects the central position and bunch length of the bunch at different turns, which is similar to the measurement results of the streak camera.
In the simulation, when generating the initial two-dimensional Gaussian distribution bunch, there is a correlation coefficient between the phase and energy of particles in the bunch. The value of this coefficient is between (−1, 1). The magnitude of this coefficient represents the tilt degree of the bunch ellipse, which is called energy chirp. When the energy chirp is 0, the particle energies at the head and tail of the bunch are the same, meaning the bunch shows a regular elliptical distribution in phase space. When the energy chirp is not 0, there is an energy difference between the head and tail of the bunch, which appears as a tilted distribution in phase space.
In
Figure 3a, both the initial phase and energy offset are 0, with no longitudinal oscillation of the phase, achieving perfect injection.
In
Figure 3b, the initial phase of the bunch is 0, the energy offset is 0.008, and the bunch length exhibits a maximum at the center of the phase oscillation, with minima at both ends. This phenomenon is the exact opposite of that shown in
Figure 3c, where the bunch length exhibits a minimum at the center of the longitudinal oscillation, with maxima at both ends.
In
Figure 3d, the initial phase, energy offset, and energy chirp are all non-zero, which is more representative of practical injection scenarios. Near the extrema of the phase oscillation, a “winged” shape appears in the image, indicating a maximum in the bunch length.
Through these simulation results, it can be observed that the evolution differences after injection are quite obvious for bunches with different initial distributions. By adjusting these initial parameters, this simulation tool can model the phase space evolution of various injected bunches that may occur.
4. Beam Experiment
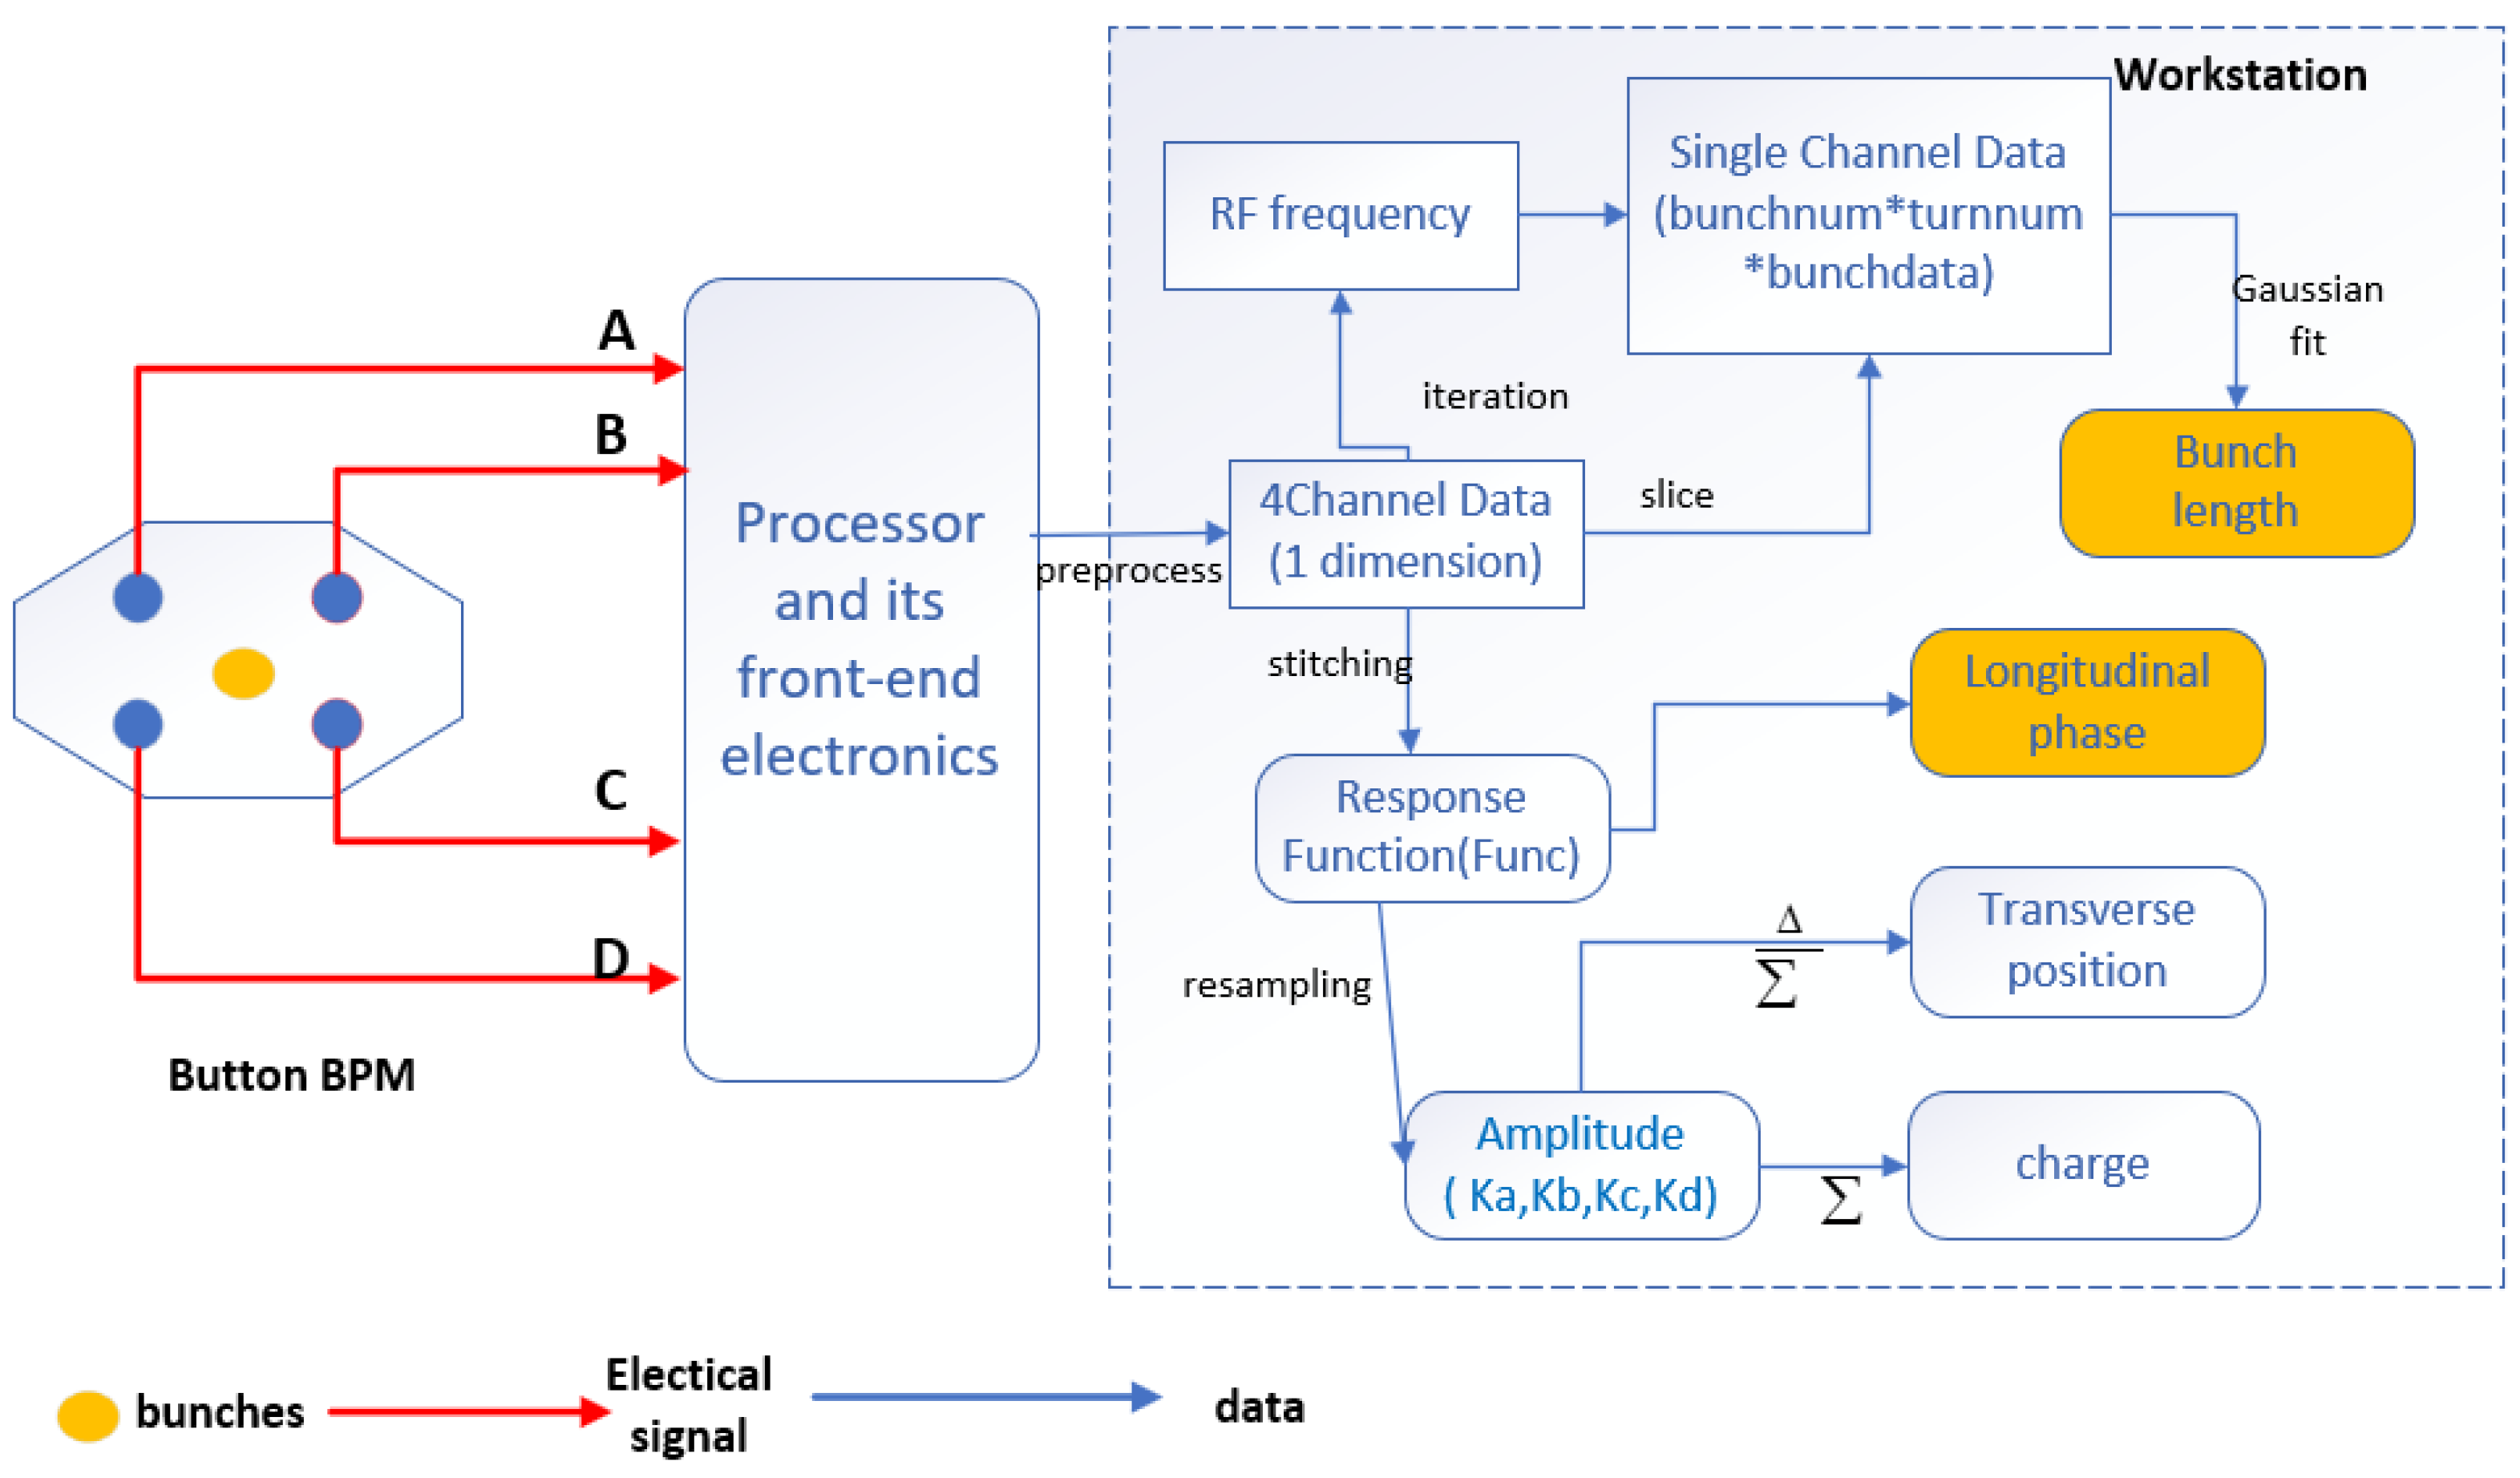
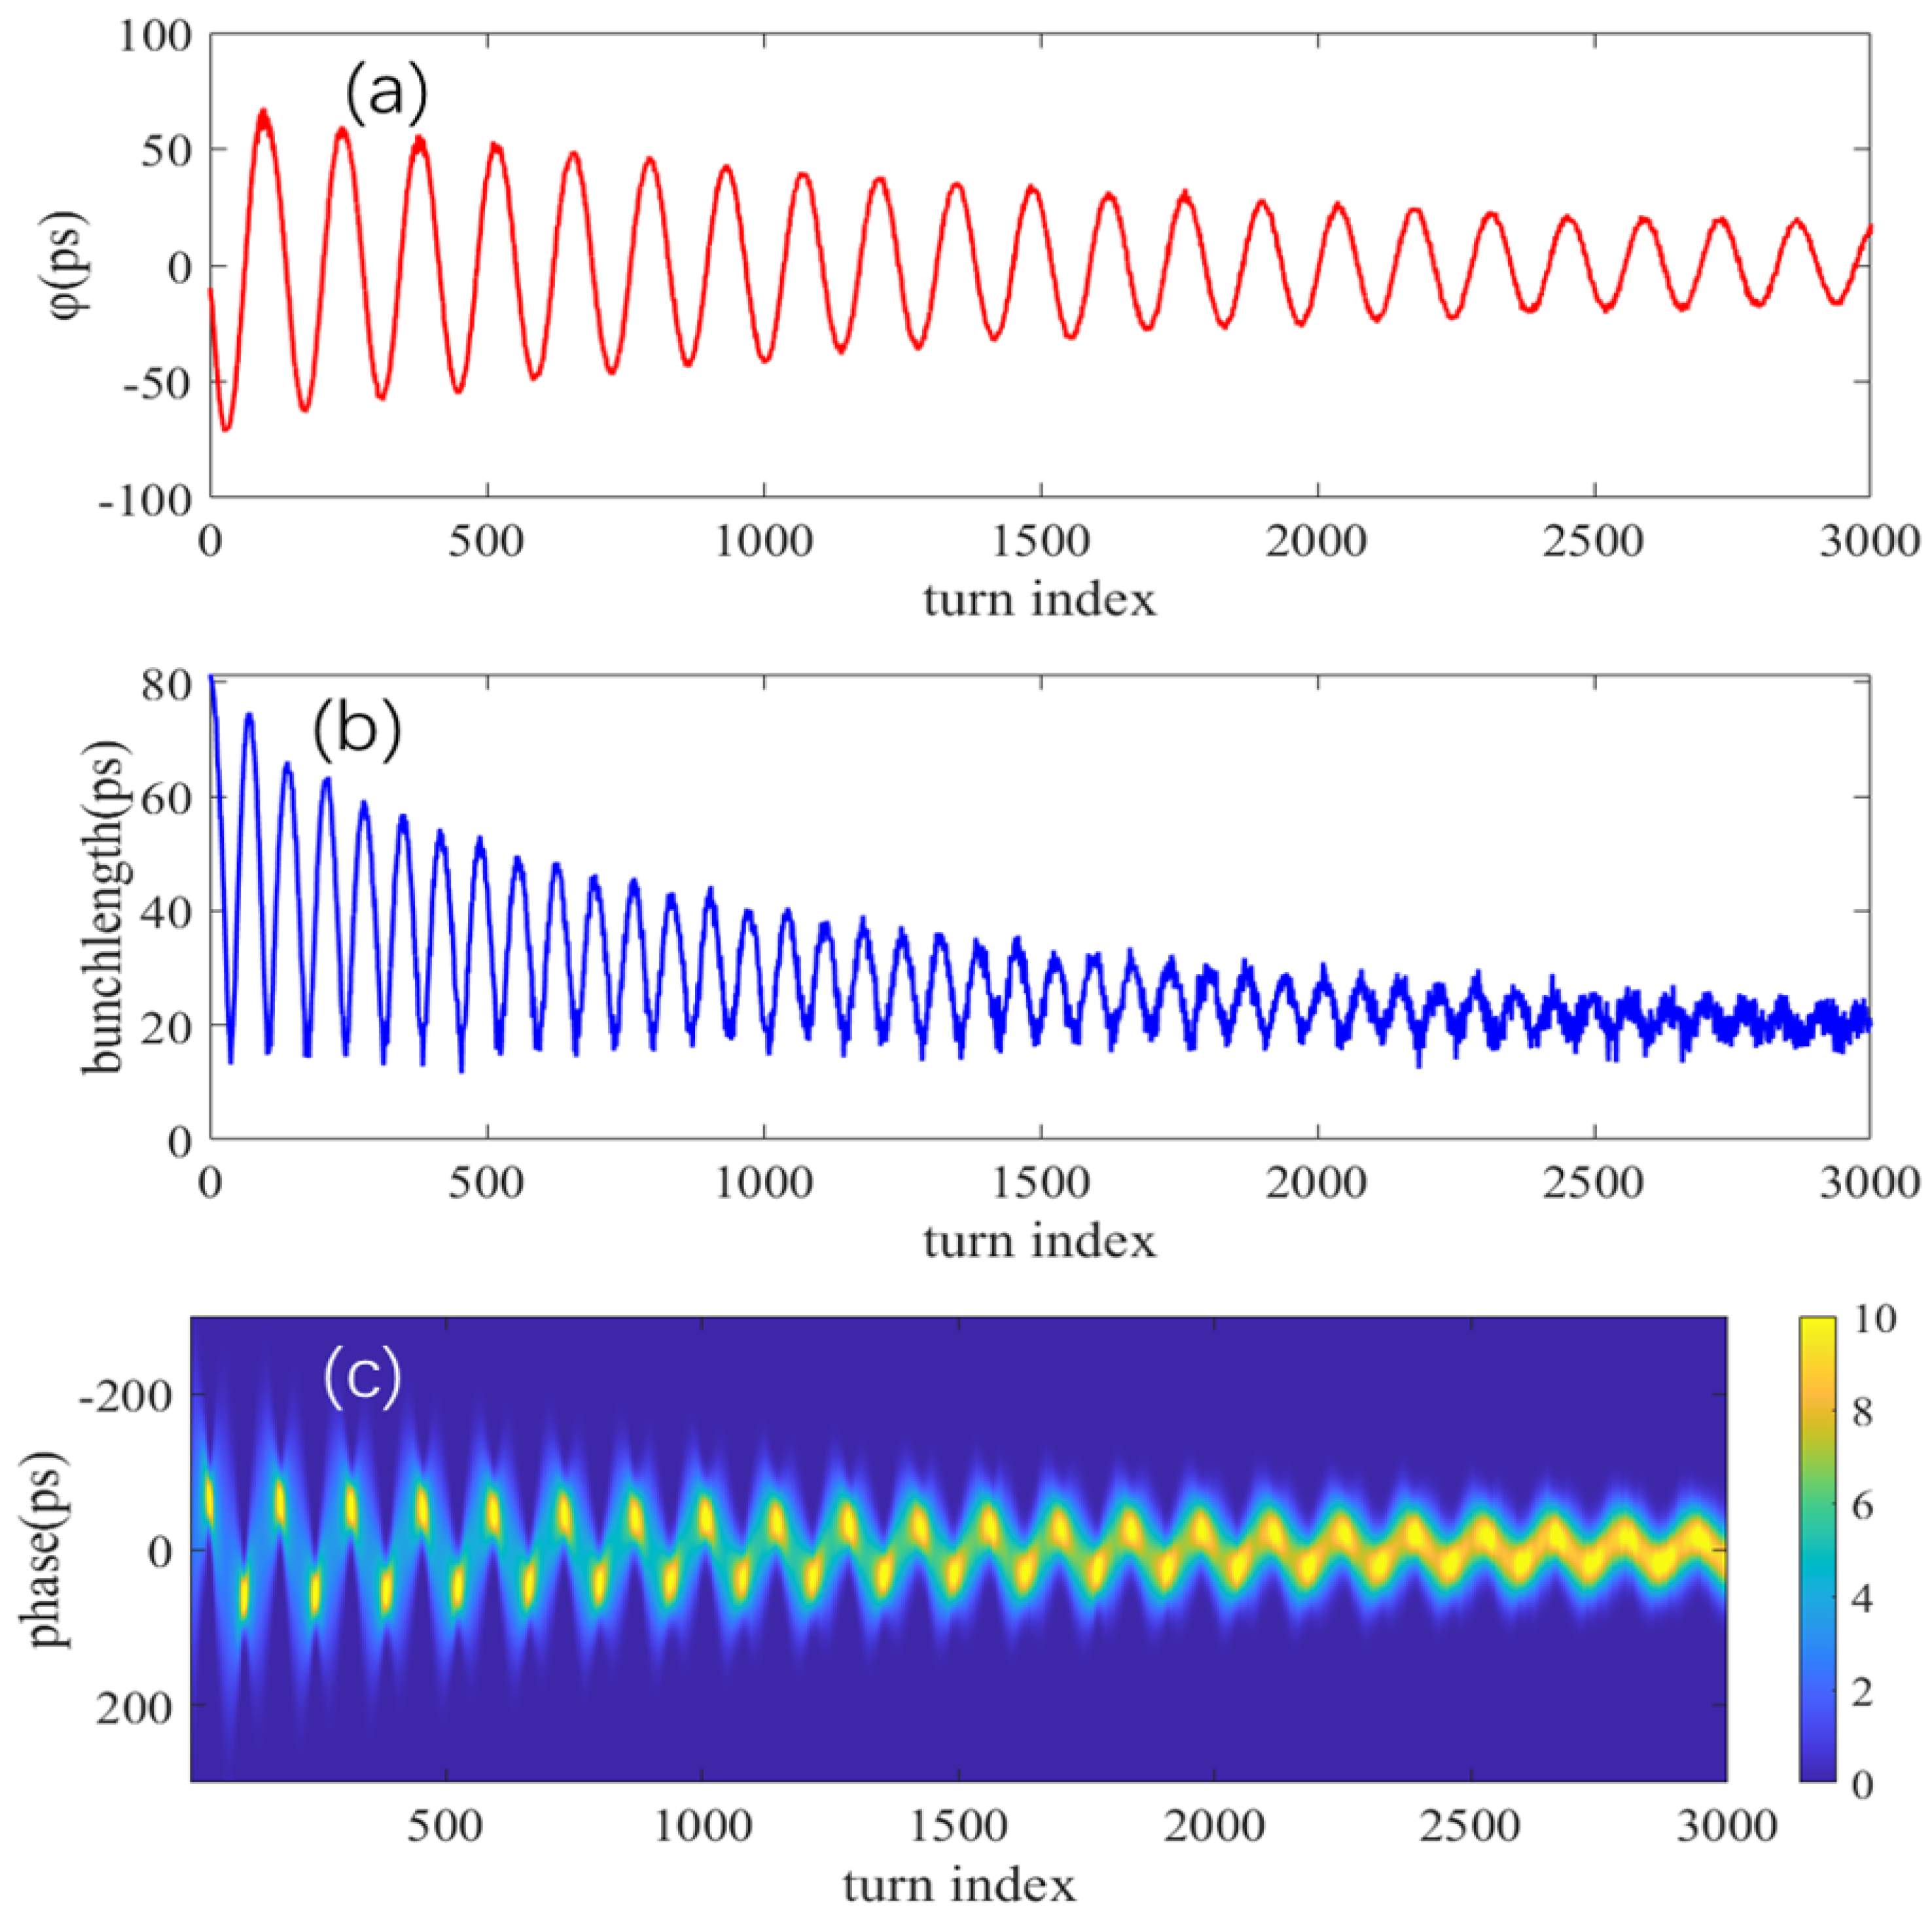
We collected multiple sets of data under the empty-ring injection process in the Shanghai Synchrotron’s storage ring. When there was a beam injection, the oscilloscope captured the trigger signal and recorded the data. Data was collected at regular intervals. Through the calculation of the developed bunch-by-bunch diagnostic system script, we obtained the longitudinal phase and bunch length evolution of a single bunch over several thousand turns during the injection process. A typical calculation result is shown in
Figure 5.
Figure 5a shows the evolution of the phase during the injection process. The entire evolution process follows a nearly exponential decay of sinusoidal oscillation, which matches the theory very well. The maximum amplitude does not exceed 100 ps, and of course, this is related to the beam energy introduced into the injector, the injection timing, and the initial phase space distribution of the injected bunch. After 3 to 4 ms (2500 turns) of injection, the oscillation amplitude decays to within 20 ps.
Figure 5b shows the evolution of the bunch length during the injection process. The upper envelope of the bunch length also follows a trend of exponential decay. The initial oscillation amplitude reaches 80 ps. After 3000 turns, the bunch length oscillates and stabilizes around 20 ps. However, there is significant high-frequency noise in the bunch length calculation results. In the future, we will further optimize the bunch length calculation algorithm.
To gain a more intuitive understanding of the beam’s trajectory within the vacuum chamber, we reconstructed the longitudinal charge distribution in phase space.
Figure 5c shows the reconstructed result. This figure is similar to the measurement results of a streak camera, but it covers several thousand turns, extending beyond the dynamic range of the streak camera, and provides higher temporal resolution.
By zooming in and comparing different experimental samples, the details of the evolution can be observed. As shown in
Figure 6a, at the maxima of the phase oscillation, the bunch length also reaches its maximum. When the phase is close to the center position, the bunch length is minimized.
Figure 6b, on the other hand, shows the opposite pattern.
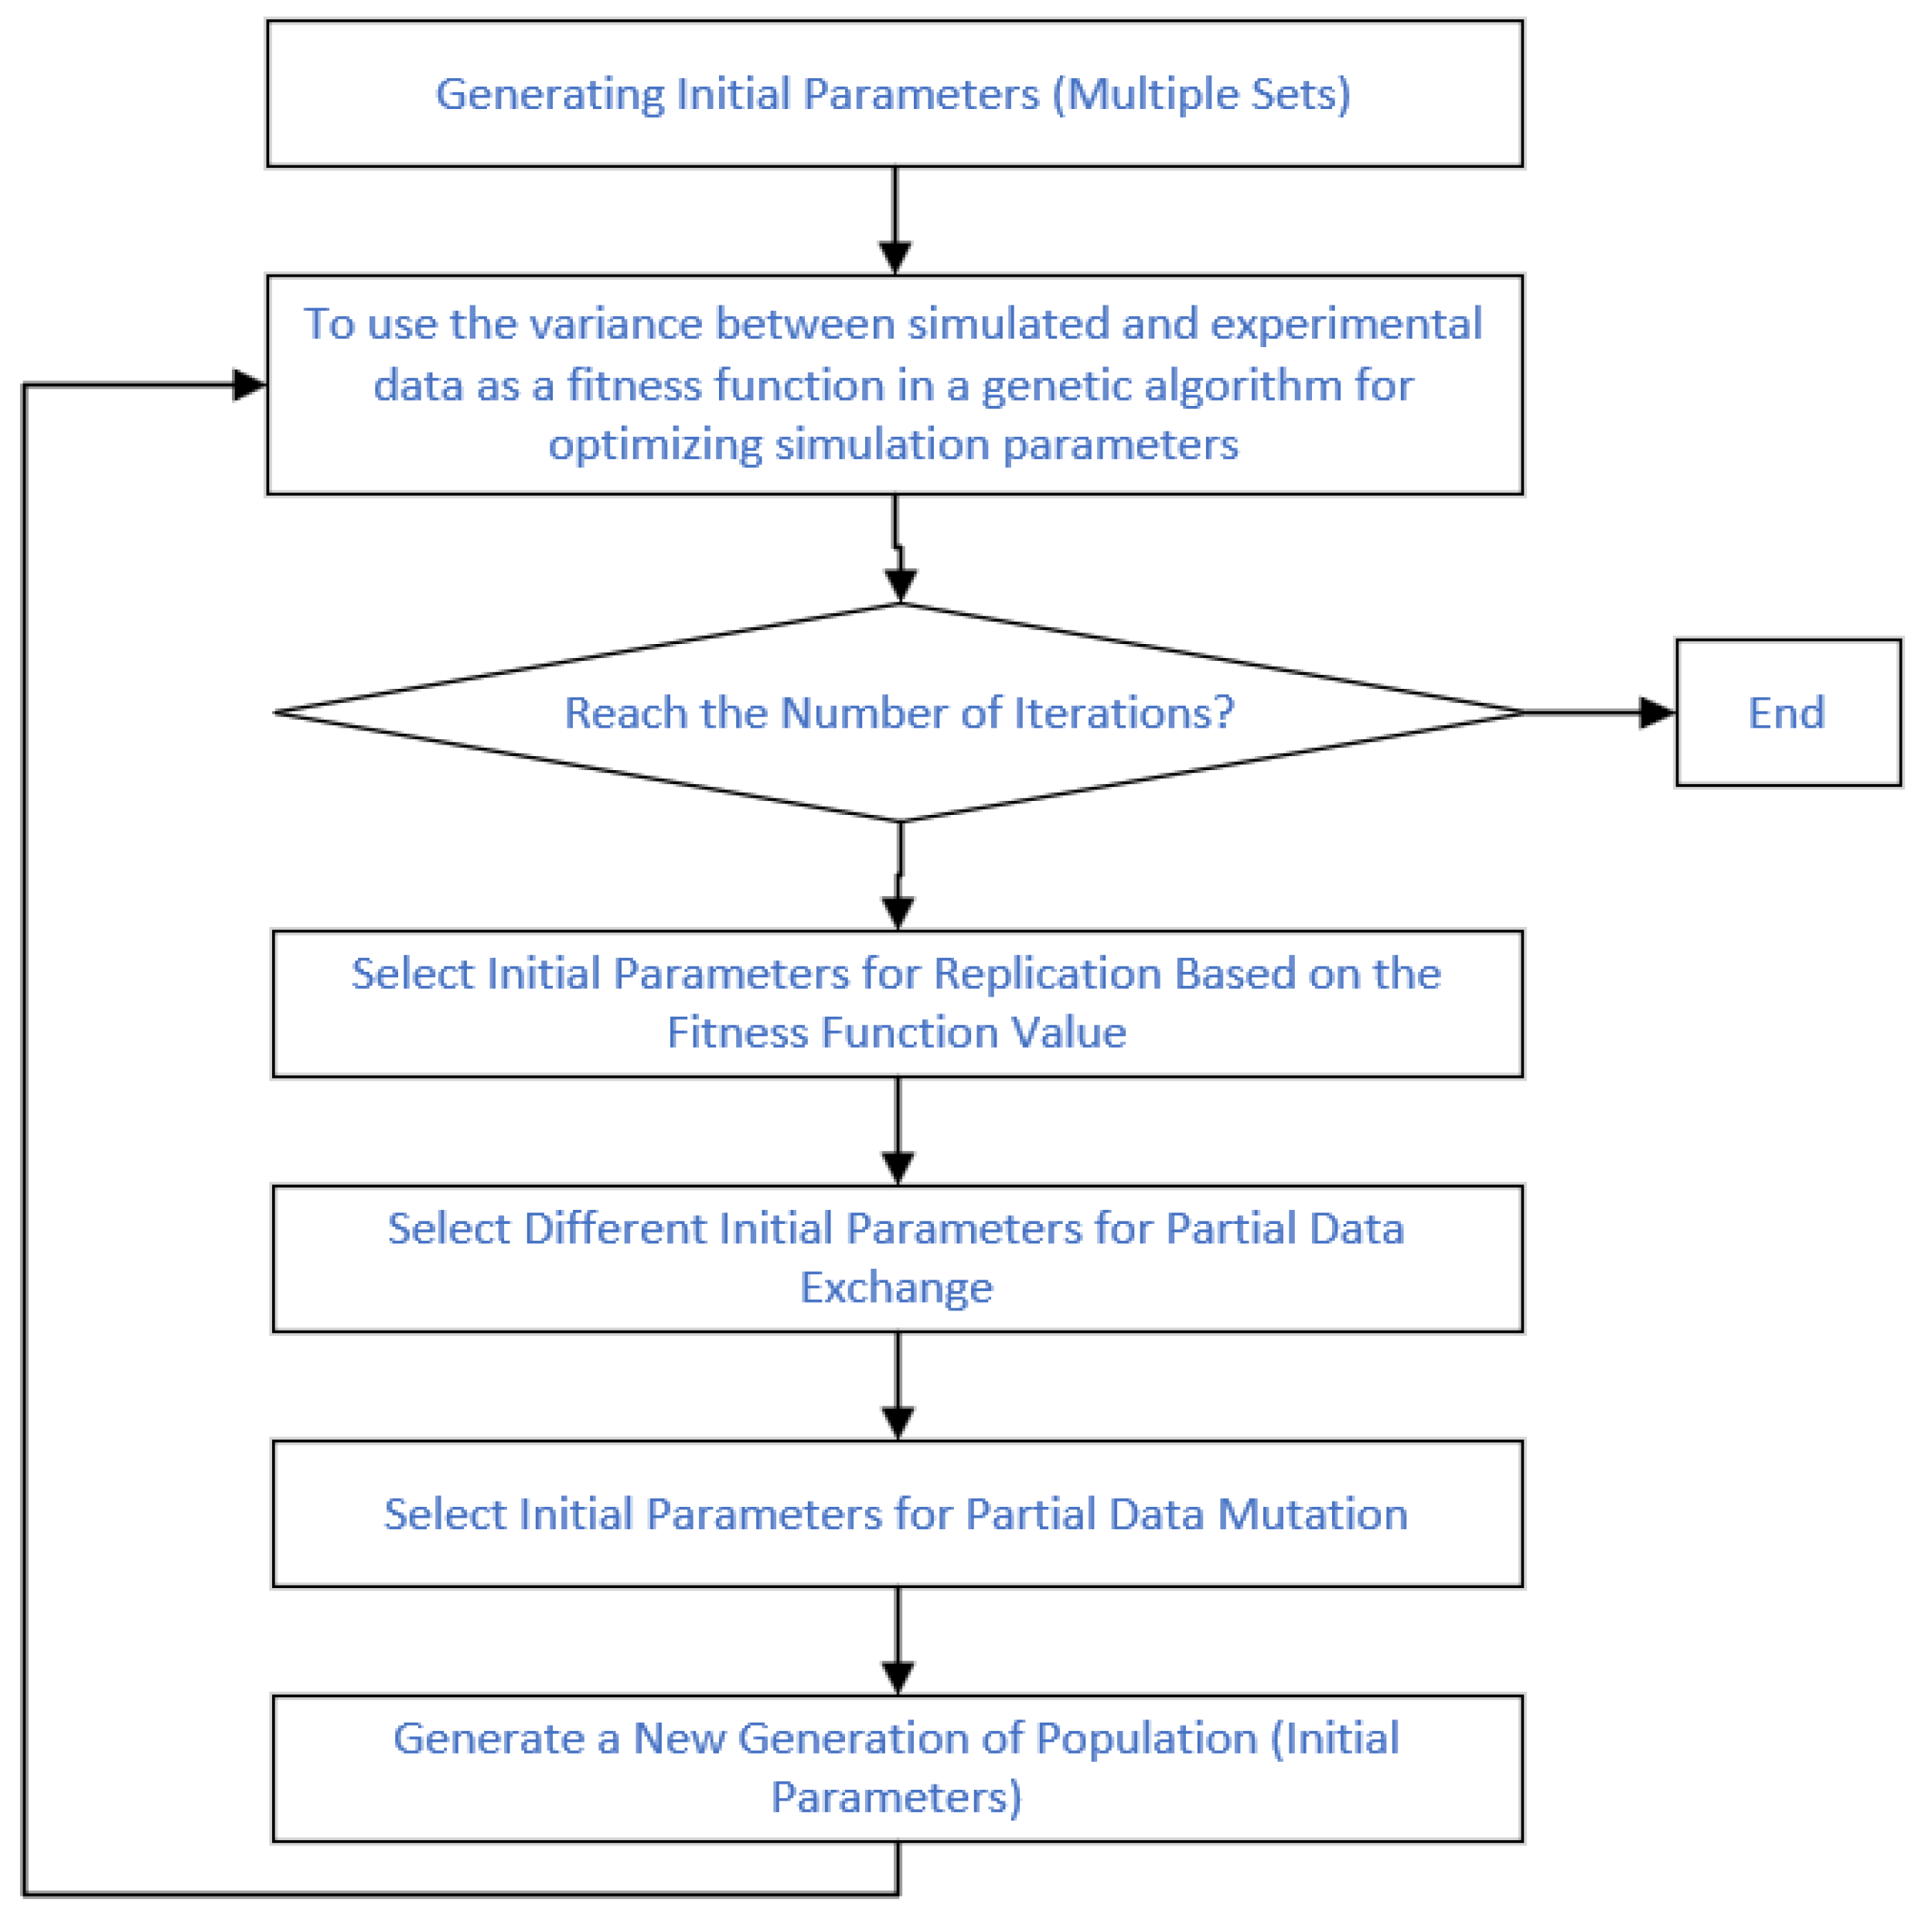
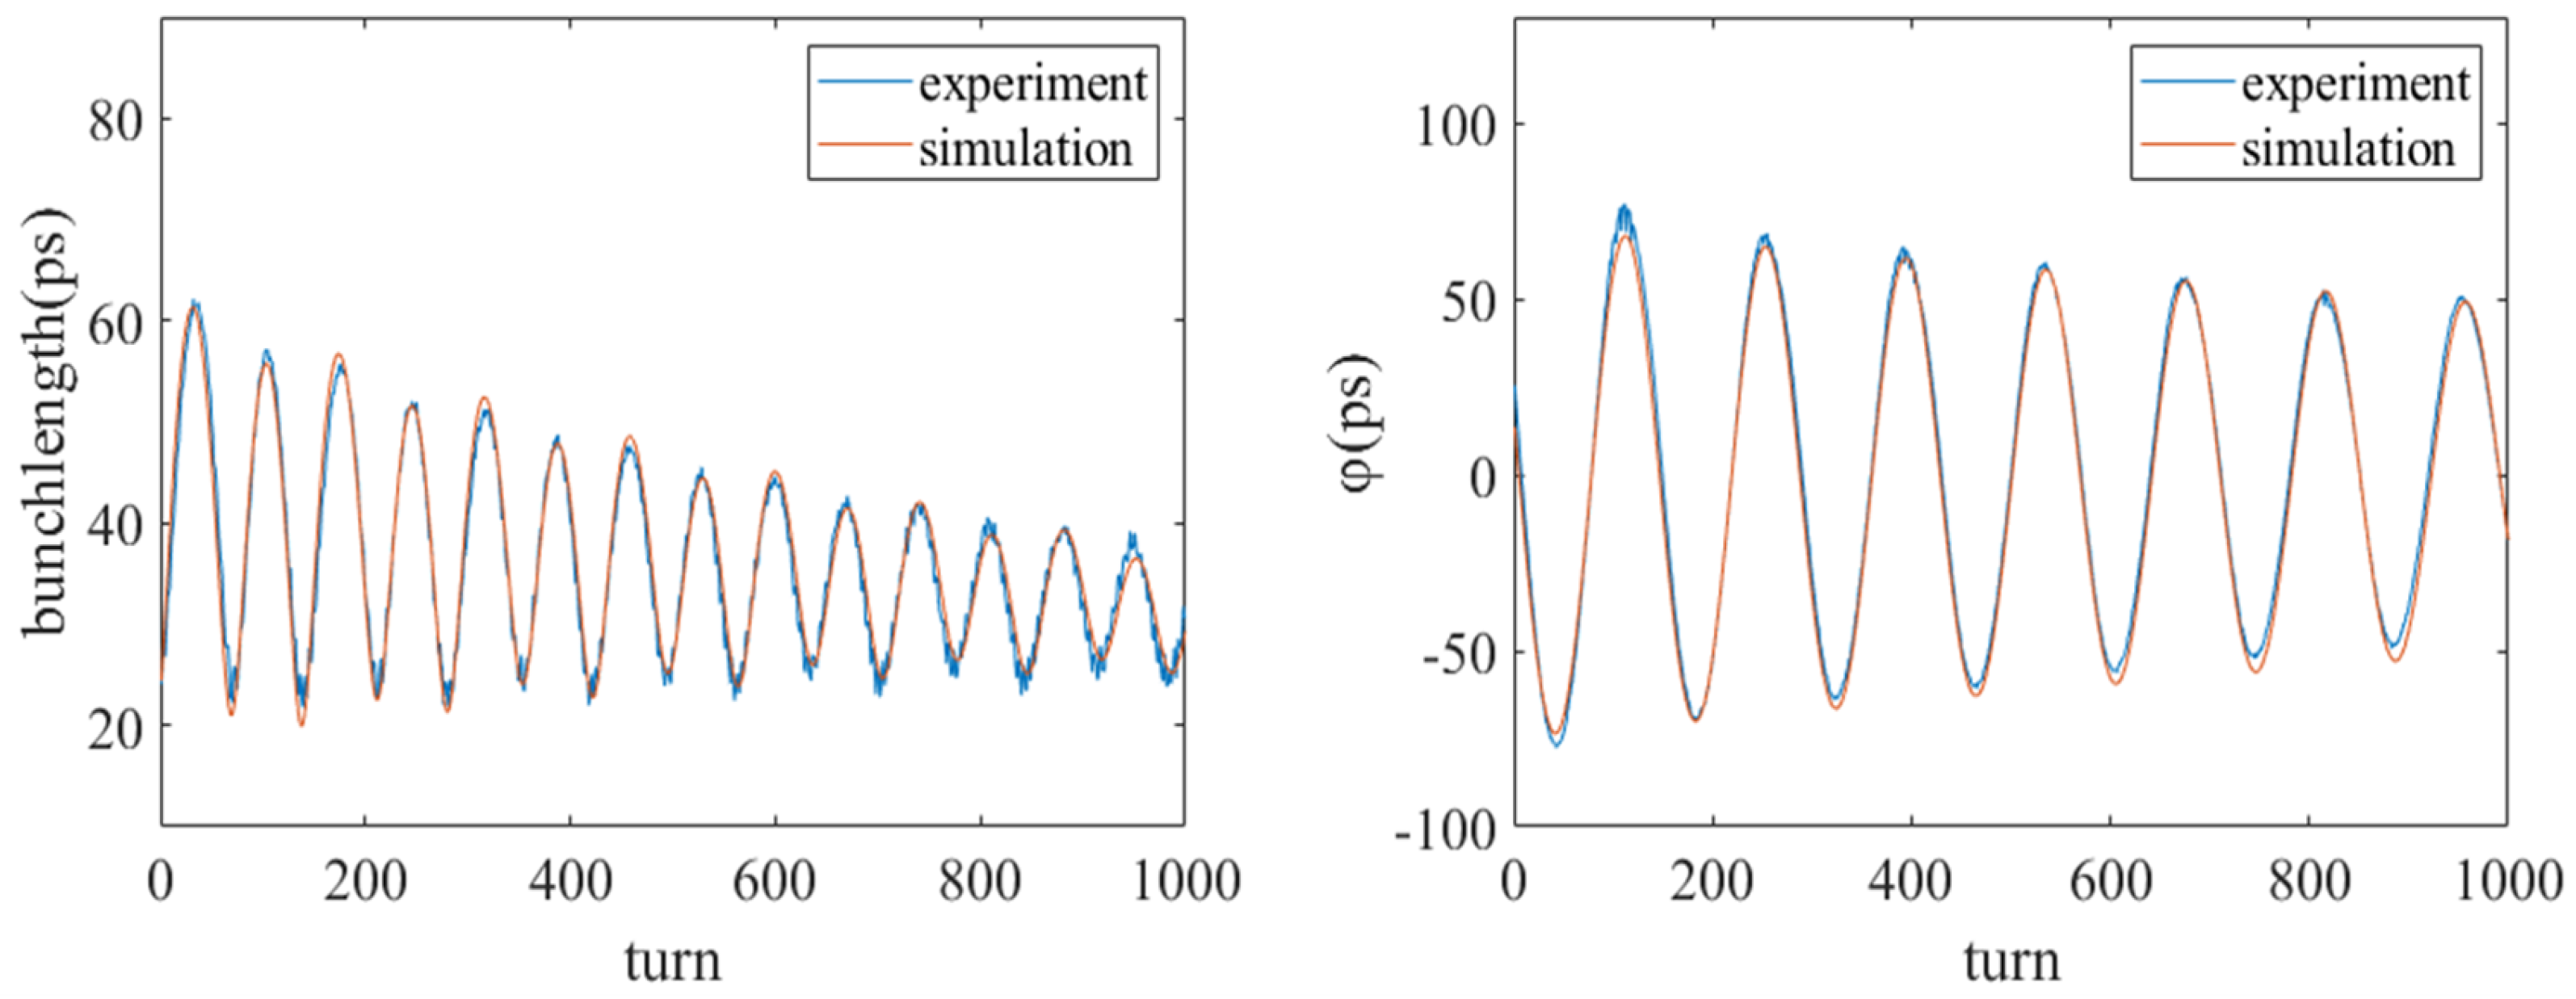
As mentioned earlier, by combining simulation results with experimental data, the initial parameters of the injected bunch in the experiment can be obtained. The specific implementation uses a genetic algorithm, where the variance between the simulation results and the experimental data is set as the fitness function to automatically optimize the simulation parameters. When the code runs to the preset number of iterations or the adaptive function reaches the desired accuracy, the final simulation results are derived. The simulation parameters are specified as follows: an initial phase step of 0.5 ps, an initial bunch length step of 1 ps, an initial energy offset step of 0.01%, an initial energy spread step of 0.01%, and an initial energy chirp step of 0.01. The Pearson correlation coefficient for the phase of the optimal simulation data reaches approximately 0.99, with a variance of 5–10 (ps
2). The Pearson correlation coefficient for the bunch length reaches approximately 0.98, with a variance of 10–20 (ps
2). A detailed implementation block diagram is shown in
Figure 7.
We present a set of typical experimental and corresponding simulated reconstructed longitudinal charge distribution images, with the dataset originating from the year 2023. As can be observed from
Figure 8, the simulation results exhibit a high degree of consistency with the experimental results, thereby validating the accuracy of the simulation software. This also reflects the high precision of the measurements obtained from the bunch-by-bunch diagnostic system, as well as the capability of this technique to accurately determine the initial parameters of the injected bunches in the experiment.
At the same time, we calculated the error’s 2D distribution by subtracting the longitudinal charge distribution of the experimental and simulation data. As shown in
Figure 8c, the error between the experimental and simulation data gradually increases during the evolution over 3000 turns. This could be due to inconsistent longitudinal oscillation normalization frequencies or imperfect matching of the machine parameters. Another possible reason lies in the assumption that the experimental data always follows a two-dimensional Gaussian distribution for the bunch, while this is not the case in the simulation. However, overall, the error remains within a relatively small range, especially within the first 1000 turns, where the experimental and simulation data match very well. By calculating the square of the modulus, the similarity between the two can reach 98.13%.
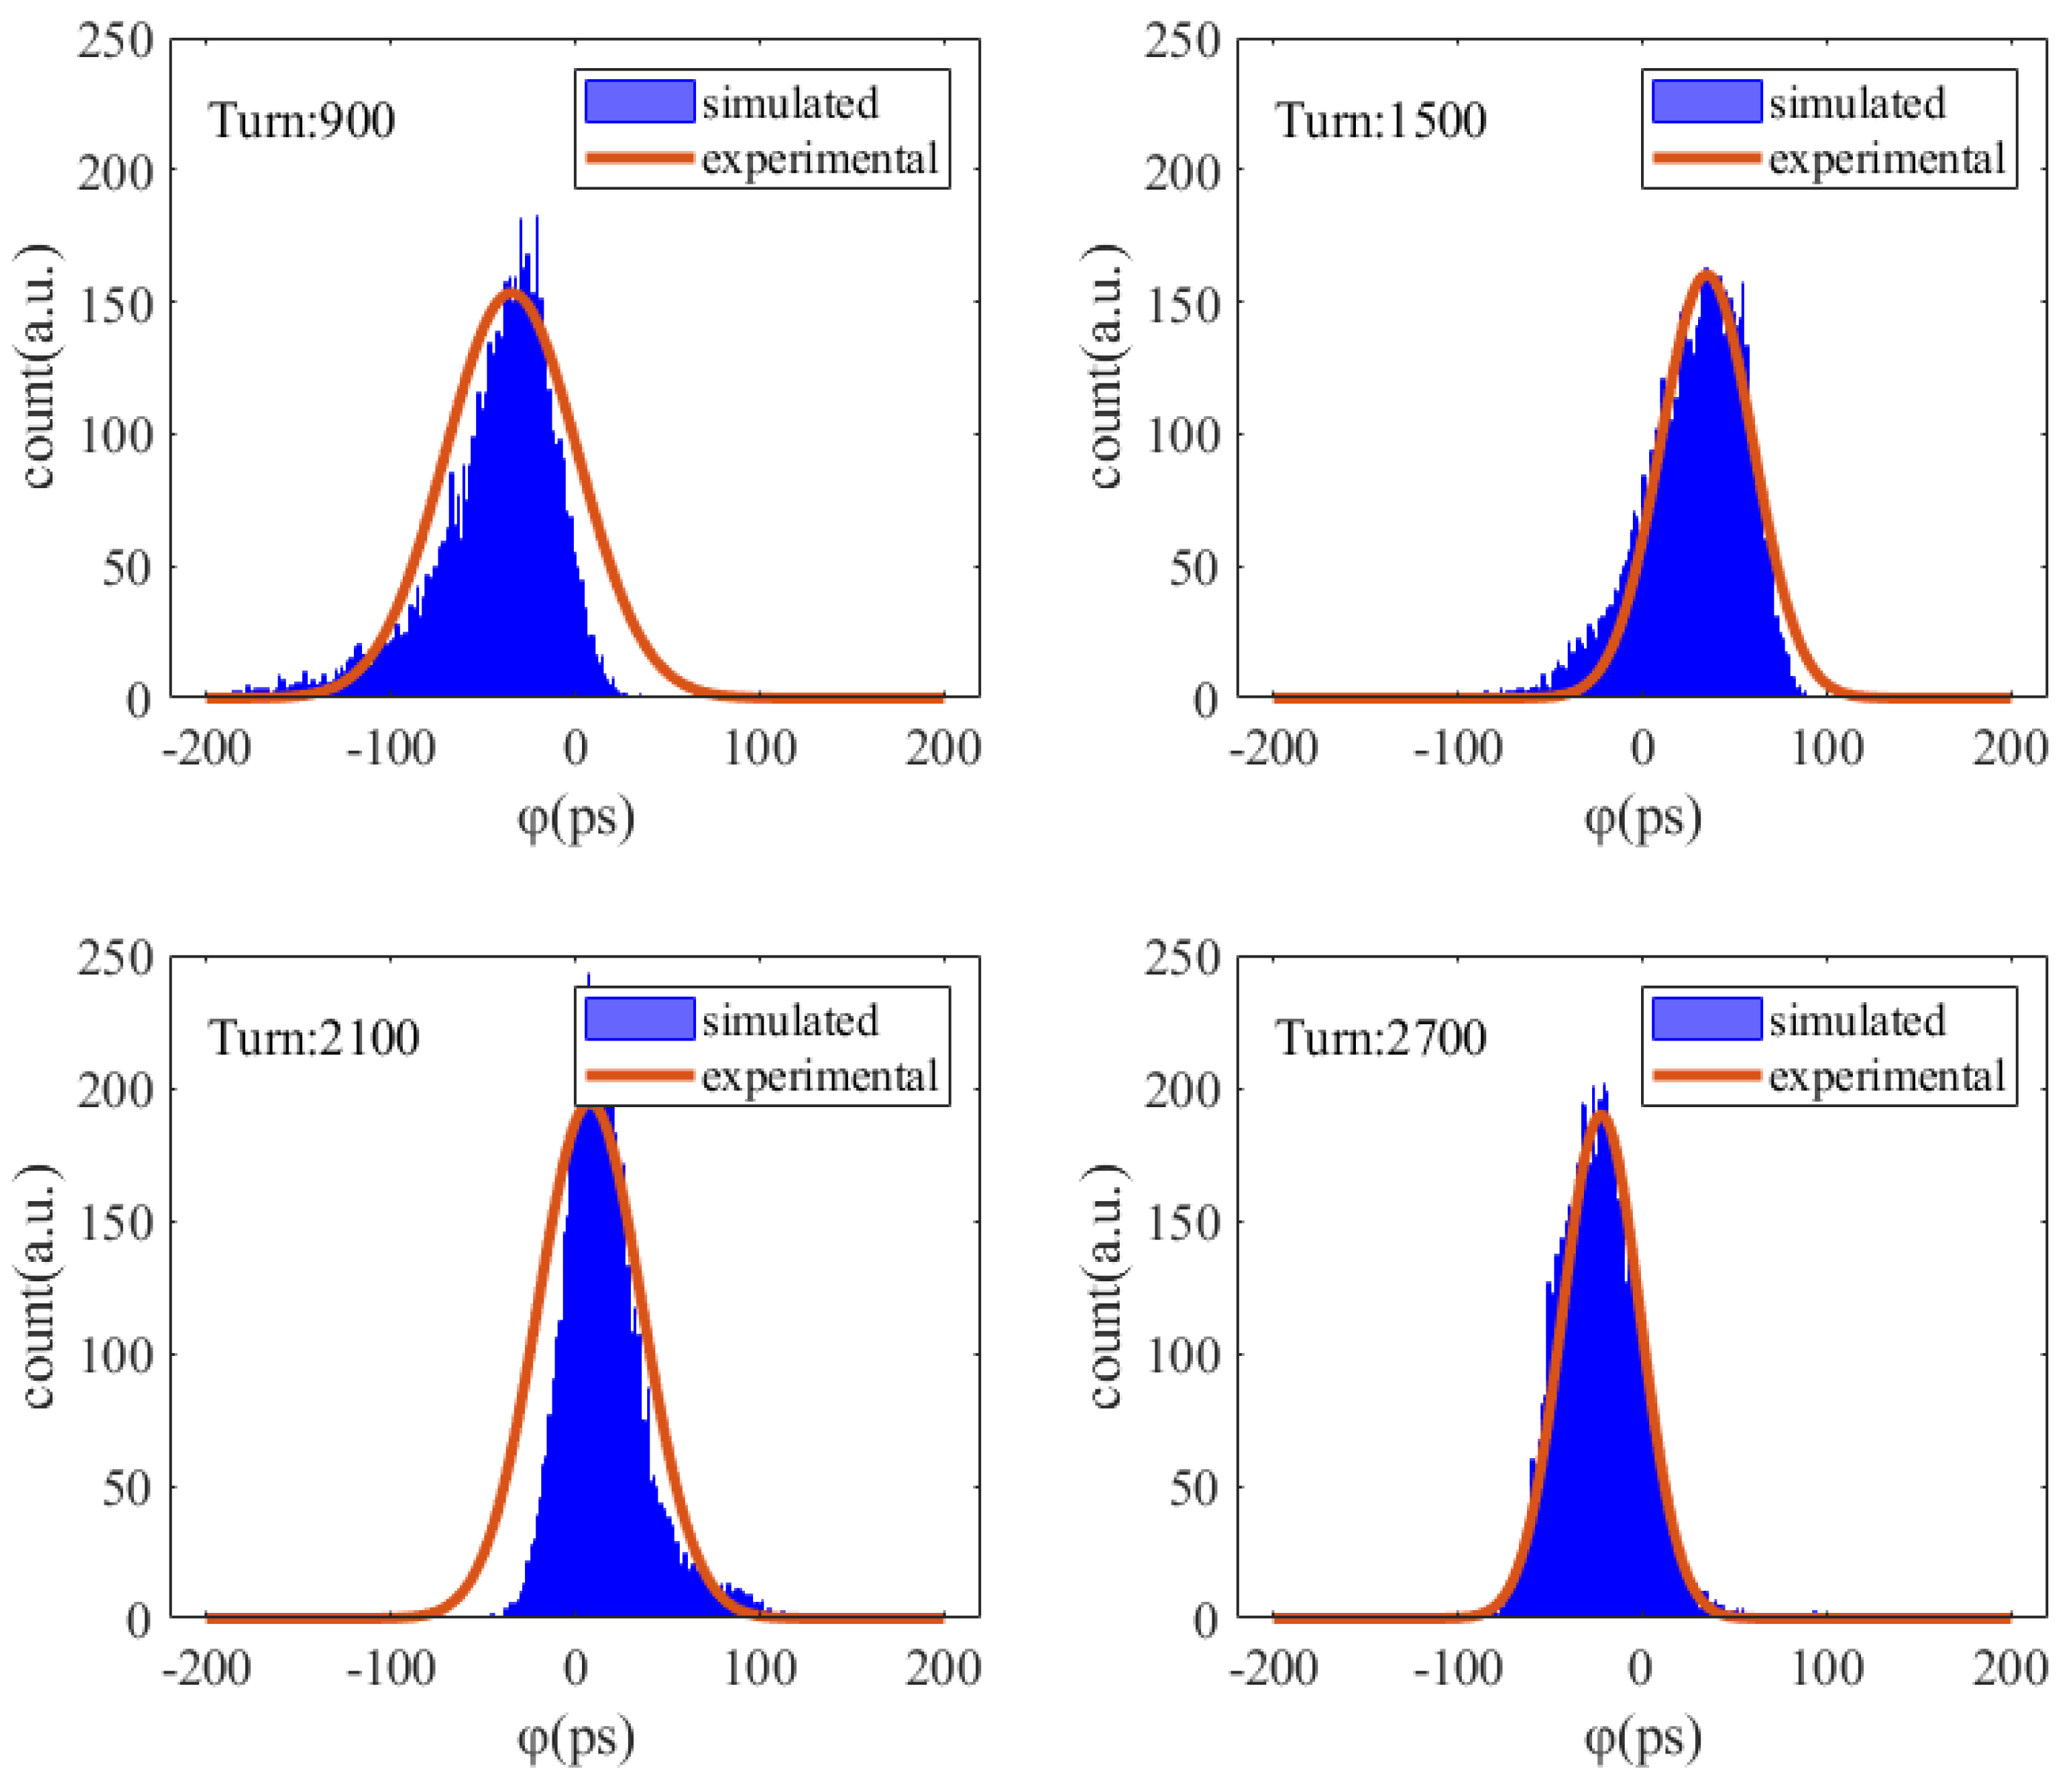
As mentioned earlier, we made the assumption that the experimental bunch’s phase space distribution follows a two-dimensional Gaussian distribution, while in reality, the bunch’s phase space is an eccentric two-dimensional Gaussian distribution. This assumption introduces errors in the experimental results. As shown in
Figure 9, the plot displays both the statistical distribution histogram of the phase space projection along the phase direction from simulations, and the ideal Gaussian distribution reconstructed from experimentally measured bunch length and phase data. The comparison reveals differences between them across various turns. Since we focus on the mean value of the projection for the phase, while for the bunch length we consider the root-mean-square value of the projection, this leads to close agreement between the experimental calculations and simulation results for both the bunch length and phase even when the Gaussian distribution’s eccentricity is not severe, as shown in
Figure 10 (only results within 1000 turns are displayed for better observation).
Additionally,
Table 3 lists the initial parameter calculation results for injection data over the years. It can be observed that in the early stages, the initial phase of injected bunches could deviate from the equilibrium position by up to 91.6 ps, with relatively large longitudinal oscillation amplitudes, while the initial bunch length ranged from 24.3 ps to 84.5 ps. Data analysis reveals that when the initial bunch length was smaller, the energy chirp values were consistently non-zero, indicating that the initial distribution of injected bunches in phase space was not a perfect ellipse, but rather exhibited a certain tilt angle.
Over time, the initial phase amplitude of injected bunches gradually decreased, the initial bunch length became more stable, and the energy offset was reduced from 0.003–0.006 to 0–0.002. This demonstrates that the injection position of bunches became more precise and the injection angle became more stable. Regarding energy spread, the simulation results range approximately from to , showing a certain discrepancy with SSRF’s natural energy spread of . This difference may be attributed to variations in machine conditions.
In summary, although this technique has not yet been formally implemented for injection optimization adjustments, the analysis of historical data using the proposed method clearly shows continuous improvements in the performance of SSRF’s injection system over time. For the data and code used in this article, please refer to the
Supplementary Materials.
5. Summary and Conclusions
Through the bunch-by-bunch data processing script, the evolution of the initial phase and bunch length of the injected bunch over several thousand turns could be obtained. However, the initial energy offset, energy spread, and energy chirp of the injected bunch could not be determined.
Subsequently, we developed simulation software for the single-bunch injection phase space evolution based on the mbtrack2 and PyQt5 software packages. By providing the initial parameters of the injected bunch, the software could simulate phase space evolution data under various injection conditions. Then, using a genetic algorithm, we optimized the initial parameters by aligning the simulation data with data derived from the experimental data under the assumption of a 2D Gaussian distribution, thus obtaining the initial parameters of the experimental data. The acquisition of these parameters provides a powerful tool for the optimization of the injection system.
The proposed method is simple, cost-effective, and highly adaptable. For a given accelerator, once the machine parameters are known, the bunch-by-bunch measurement system can be readily deployed alongside the corresponding longitudinal phase space simulation software. The simulation tool offers flexible configuration options, including the incorporation of higher harmonic cavities or multi-bunch simulations, to meet diverse research requirements.
Additionally, using the simulation software, a large amount of single-bunch injection phase space evolution data can be generated, and the initial phase space distribution of these bunches is known. Machine learning can then be used to train a large number of simulation samples to analyze experimental data and determine the initial injection parameters. In the future development of the simulation software, instead of simulating the phase space distribution, the original signal distribution of the bunch after injection will be directly simulated. This will serve as the training sample, allowing for the direct analysis of raw sampling signals without going through the bunch-by-bunch diagnostic system, making it easier and faster to obtain the initial injection parameters.


