1. Introduction
Experiments operating at future e+e− circular colliders (such as, for example, FCC-ee and CEPC) must cope with a rich and complex high precision physics program [
1,
2]. The abundance of hadronic final states from collisions at centre-of-mass energies ranging from 90 to 365 GeV will require superior jet reconstruction capabilities. Hadronic showers develop both an electromagnetic and a hadronic components which are usually detected with a different response (non-compensation). As a result, the fluctuations among the two components constitute one of the most limiting factors for the hadronic energy resolution. Dual readout is a calorimetric technique able to overcome the limits due to non-compensation by simultaneously detecting scintillation and Cherenkov lights. Scintillating photons provide a signal related to the energy deposition in the calorimeter by all ionising particles, while Cherenkov photons provide a signal almost exclusively related to the shower electromagnetic component. In fact, by looking at the two independent signals, it is possible to measure, event by event, the electromagnetic shower component and to properly reconstruct the primary hadron energy. Several prototypes were constructed based on different active media and absorber materials. The 20-year-long research programme by the DREAM/RD52 collaboration on dual readout calorimetry has provided a technology that is now mature for application [
3]. The performance studies based on a Monte Carlo simulation reproducing a full experiment geometry have been recently summarised [
4] even though, the modules are not identical to the ones tested on beam in 2021. Accordingly to these studies, we could target a hadronic energy resolution of ≈30%/
for single hadron and ≈38%/
for jets. In addition, using SiPMs instead of Photomultipliers (PMTs), we could further improve the excellent particle-ID capability by adding a projective image of the shower [
5,
6].
In this paper, the first results obtained with the core of the electromagnetic-size prototype, sensed with SiPMs, will be discussed together with the R&D strategy ongoing for building a new demonstrator capable of fully contain hadronic showers and measure the energy resolution.
2. Experimental Setup
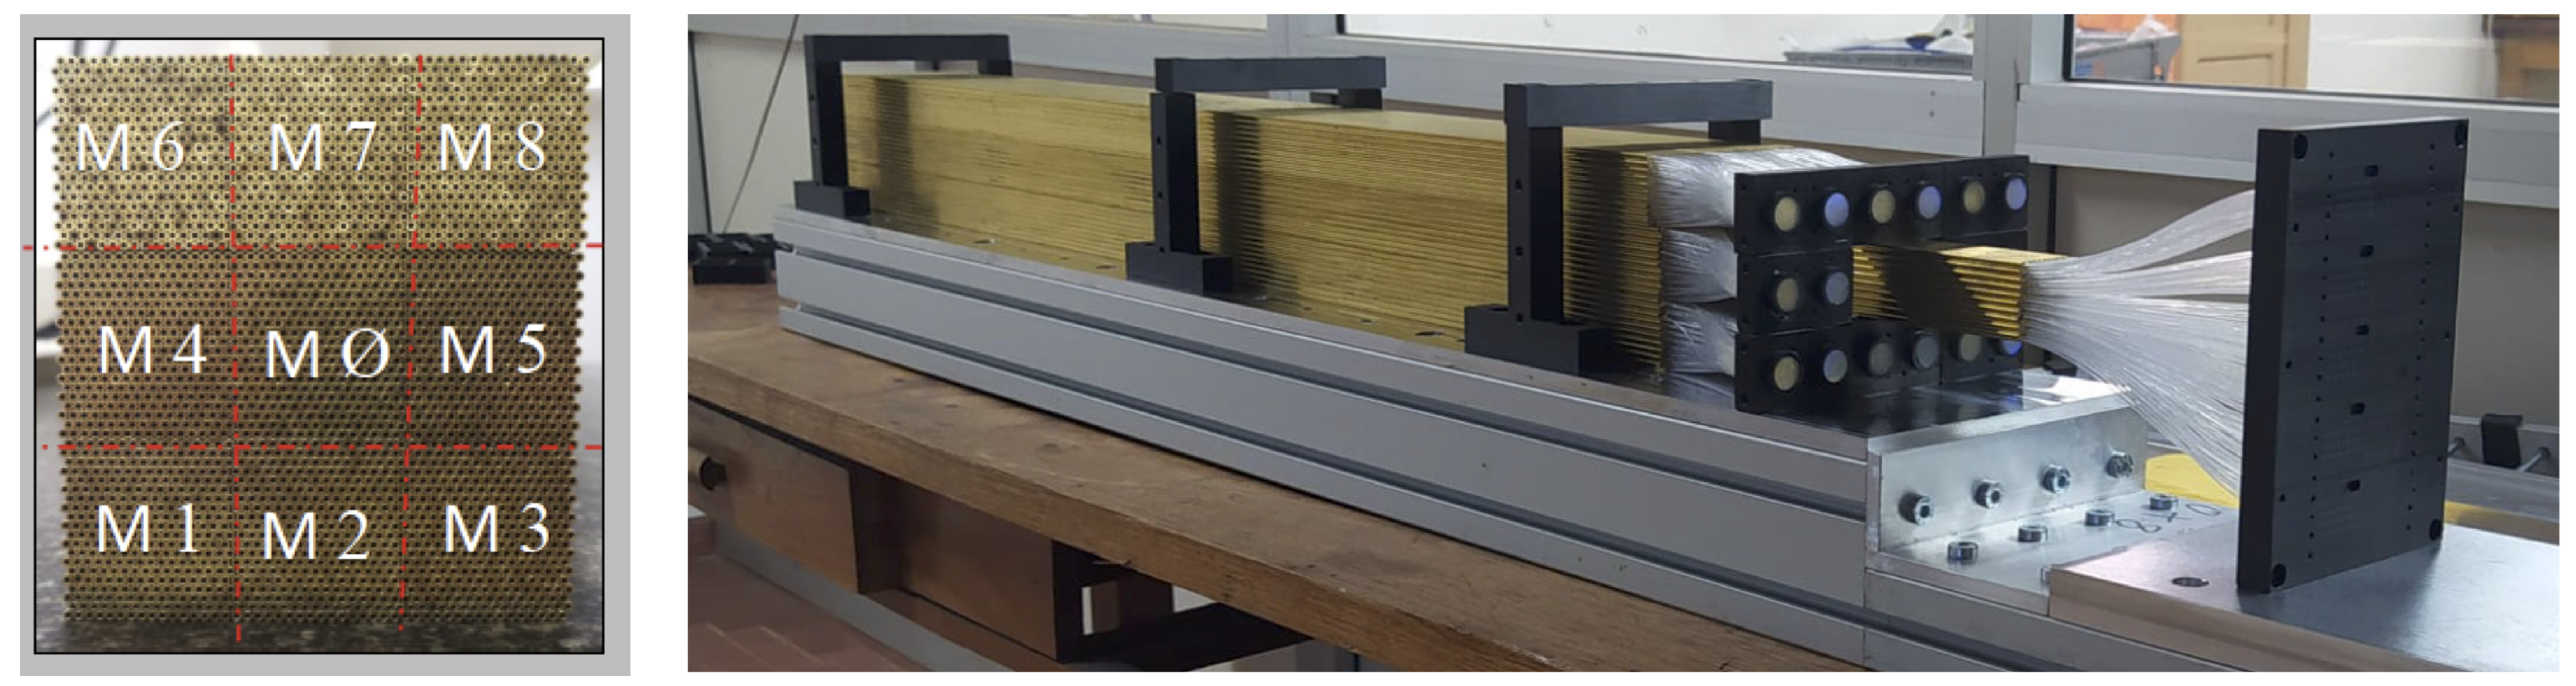
The prototype qualified on beam in 2021 is shown in
Figure 1. It is 1 m long with a cross section of 10 × 10 cm
. The Moliere radius (R
) is 23.8 mm while the effective radiation length (X
) is 22.7 mm. It consists of 9 modules, each made of 320 brass capillaries (outer diameter = 2 mm and inner diameter = 1.1 mm) equipped, alternatively, with scintillating (BC-10 from Saint Gobain) and clear (SK-40 from Mitsubishi) fibres to allow the dual sampling. The external modules are instrumented with R-8900 PMTs. The scintillating and clear fibres are separated and bundled in two groups on the back side of each module to match the PMTs’ window. A yellow filter (Kodak, Wratten nr 3, with nominal transmission of ≈7% at 425 nm and ≈90% at 550 nm) is placed between the scintillating fibres and the detector to cut off the short wavelength component of the scintillating signal (standard configuration). In fact, yellow filters reduce the calorimeter response dependence on the shower starting point by filtering the component of the light more affected by attenuation in the fibres. The PMTs are read out with V792AC QDC modules produced by CAEN s.p.a.
The central module, namely the highly granular module, has each fibre connected to a SiPM by Hamamatsu (S14160-1315 PS) with a sensitive area of 1.3 × 1.3 mm
2 read out independently. Since almost 10% of the entire energy is released within one mm from the core of the shower (1–2 fibres) [
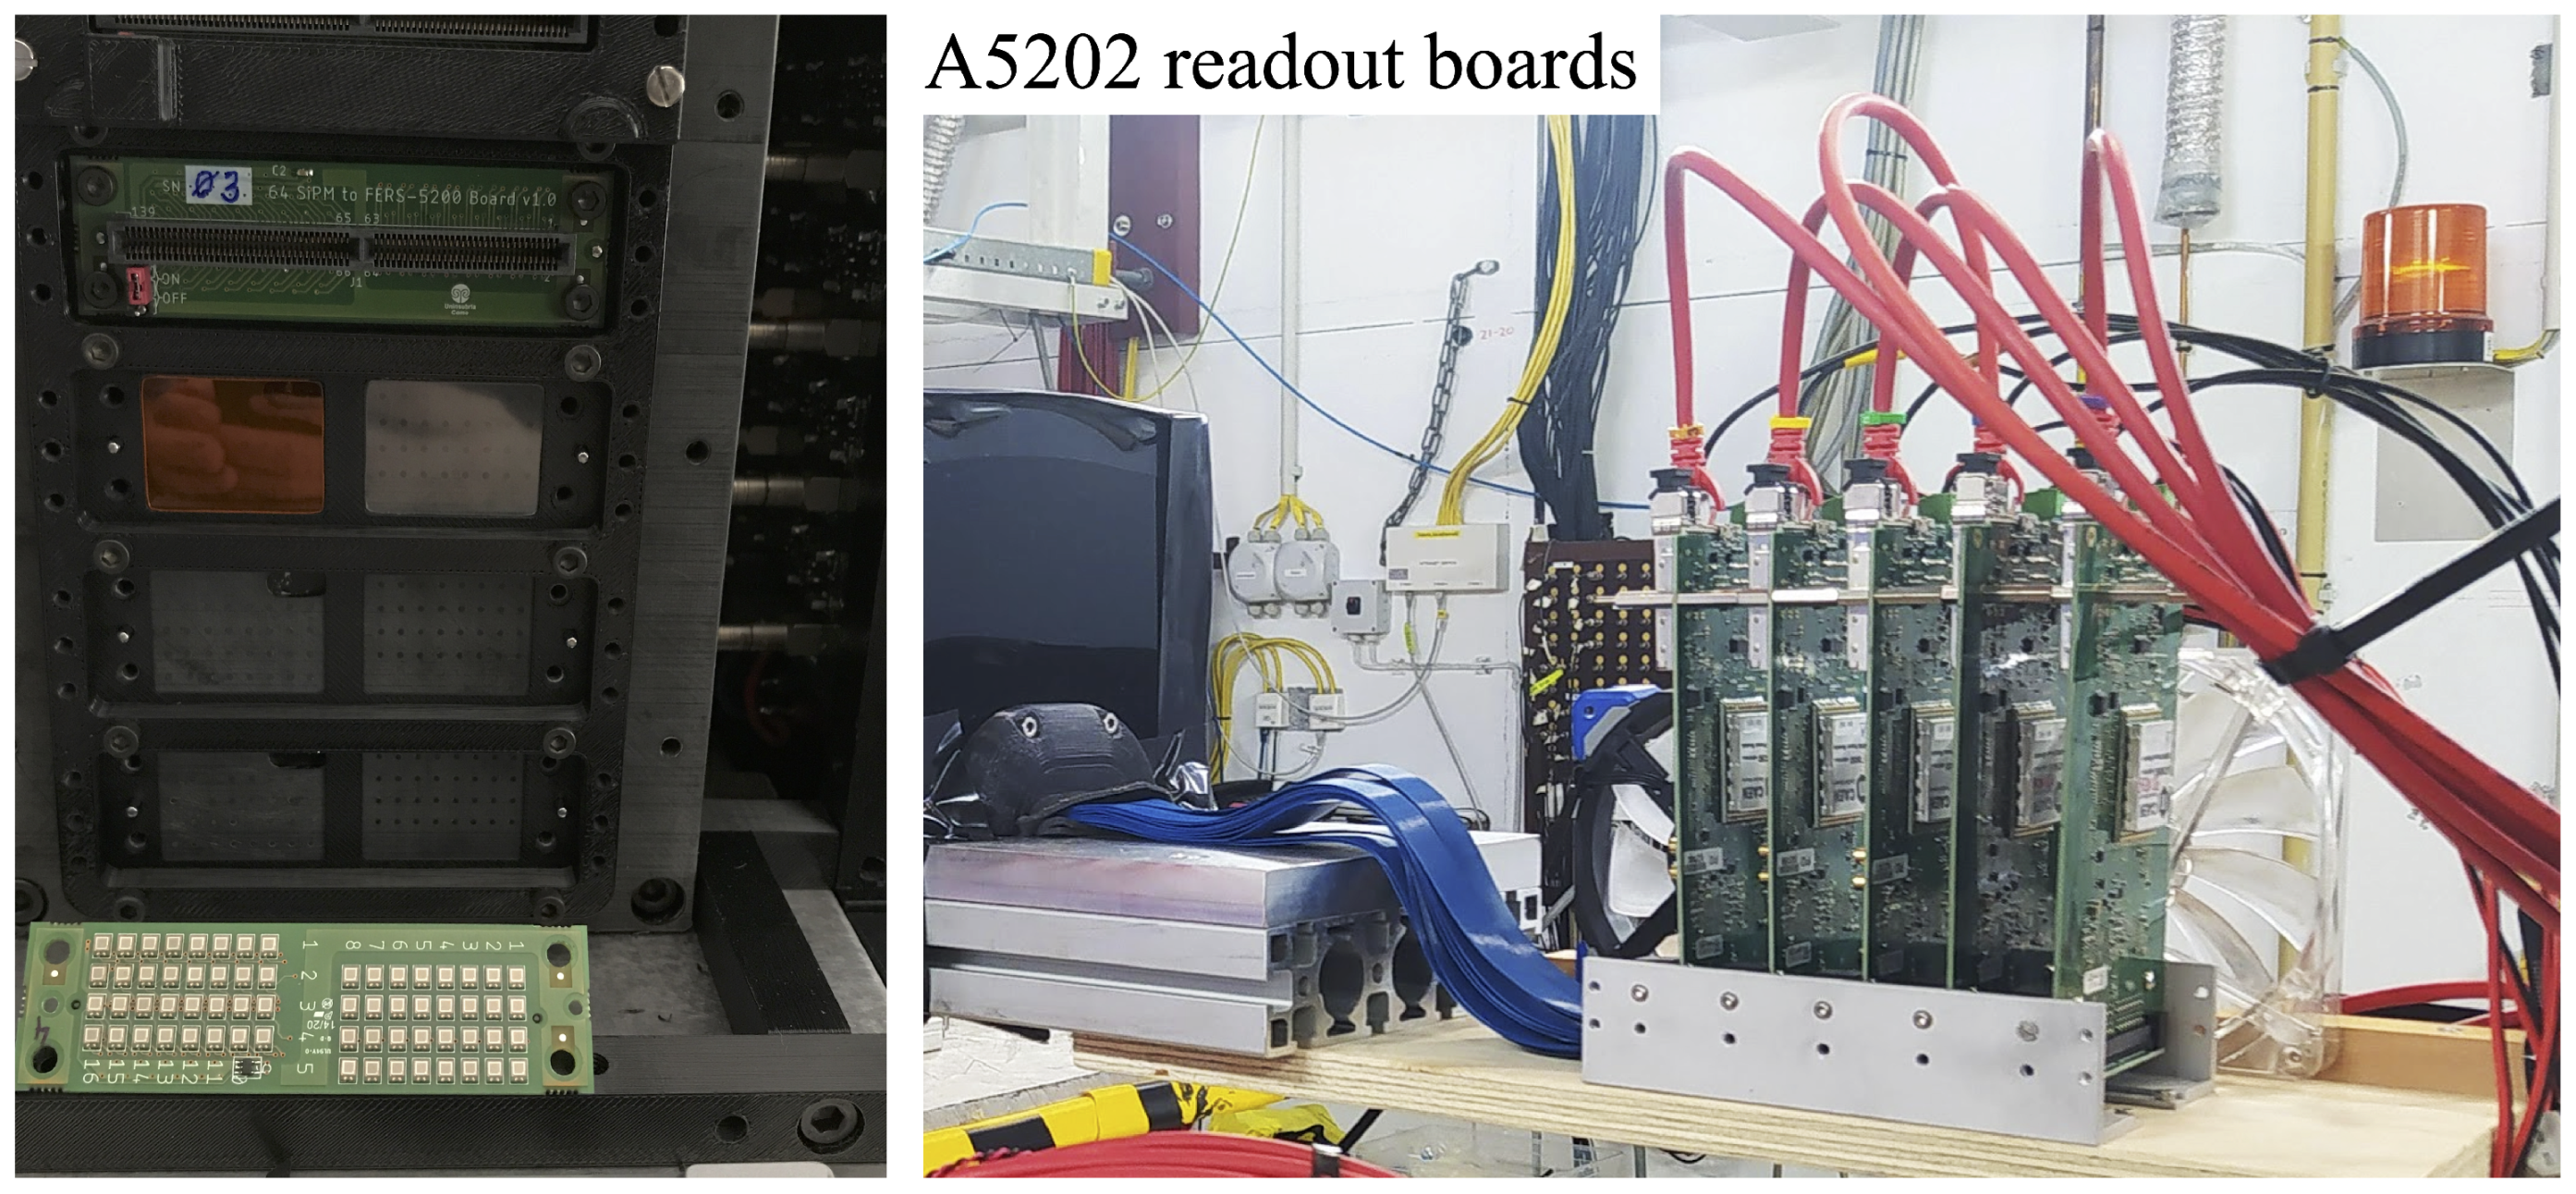
6], SiPMs with a wide dynamic range (i.e., 7284 cells, 15 μm pitch) were selected. Unfortunately, SiPMs with compact packaging were not available at the time of the construction. For this reason, we were forced to fan-out the fibres on the back sides of the calorimeter to match the front-end boards housing 64 SiPMs. The SiPMs on the front-end board are separated in two groups (32 SiPMs each) insulated with a light tight frame (
Figure 2) to avoid light contamination between Cherenkov and scintillating signals. As for the external module, yellow filters are placed between the scintillating fibres and the SiPMs. In addition, a transparent paper is used between the clear fibres and the SiPMs for mechanical reasons and to avoid any air gap between the fibres and the light sensors.
The SiPM readout is based on the FERS-System produced by CAEN s.p.a. (
https://www.caen.it/products/a5202/, accessed on 1 August 2022) to fully exploit the Citiroc-1A (
https://www.weeroc.com/products/sipm-read-out/citiroc-1a, accessed on 1 August 2022) performance: i.e., wide dynamic range, linearity and multi-photon quality even with SiPMs with small pitch size and small gain (1–3 × 10
5 at nominal settings). Each readout board (A5202) is equipped with two Citiroc-1A to operate 64 SiPMs. The signal produced by each SiPM feeds, at the same time, two charge amplifiers with tunable gains. The range accessible by one of the two amplifiers (namely the High Gain—HG) is almost 10 times higher than the other (Low Gain—LG). This characteristic allows to store on disk two spectra per each SiPM. The first (HG) useful to analyse the multi-photon and to extract the ADC to photo-electrons (ph-e) constant, and the second (LG) needed to extend the overall dynamic range. The settings for the two charge amplifiers were chosen to guarantee: (1) good quality HG spectra, (2) an overlap region between the HG and LG spectra used for the calibration, and (3) a wide dynamic range. These settings allow to read signals from 1 to almost 4000 ph-e which is ≈55% of the SiPM occupancy considering the microcells available in the sensitive area.
The prototype was qualified on beam at DESY and at CERN with small differences in the setup configuration.
2.1. DESY Setup Configuration
The trigger scheme was based on the coincidence from two scintillator counters placed in front of the calorimeter and the signal produced by the A5202 boards, running in self-trigger mode with a majority algorithm. The trigger received by the scintillators was used by the A5202 boards to accept and store on disk (event accept) the data produced by the SiPMs. The majority algorithm was running independently on each readout board (64-SiPMs) with a coincidence of 3 SiPMs detecting a signal over the threshold set at 3.5 ph-e. The event building was performed off-line correlating the trigger ID from the different A5202 boards. Data produced by electrons with energy range from 1 to 6 GeV were acquired and used in the analysis. For this test beam, the scintillating and the clear fibres were directly connected to the SiPMs. We decided to remove the yellow filters because we had access to low energy electrons and we were also interested in measuring the small signals released in the tail of the shower to tune the Monte Carlo simulation.
2.2. CERN Setup Configuration
The trigger was provided by three scintillator counters. The first two counters were used in coincidence and the third (the scintillator had a hole with a diameter of 10 mm) was used as veto. Additional detectors were included in the data taking (i.e., two delay wire chambers, a pre-shower and a muon detector) to determine the impact point of the beam particles and to flag electrons with off-line analysis. The latter selection was important because the electron beam had muon and hadron contamination with a ratio depending on the beam line extraction and beam energy. The SiPM readout schema was the same as the one used at the DESY test beam. We were running two independent data acquisition systems sharing the same trigger. The off-line synchronisation is performed by using the trigger ID. Data produced by electrons from 6 to 100 GeV are used in the analysis. For this test beam, we used yellow filters between the scintillating fibres and the SiPMs (standard configuration).
3. Test Beam Data Analysis
The two test beams allowed to qualify the readout system for the highly granular module, to define the calibration procedure and to measure the light yield for the scintillating and Cherenkov signals for this prototype.
3.1. Equalisation and Calibration
Before the installation in the experimental area, all SiPMs were qualified in the lab with an ultra-fast LED emitting at 420 nm. The SiPM response was equalised by applying the same over-voltage and by tuning the amplifier settings. The procedure allowed to operate all SiPMs with the same photon detection efficiency (PDE) and with signals equalised in amplitude. The latter requirement is needed because the system, working in self-trigger mode, has the same threshold for all 64 SiPMs served by one A5202 board. There is the possibility to adjust the threshold for each channel but the fine tuning covers 1 DAC only of the global threshold. The SiPMs were operated with a voltage set at +7 V over the breakdown. Even if it is not a typical setting for a SiPM, it guarantees a stable PDE (against small temperature variation) and a multiplication factor in the avalanche region of the order of per each detected photon, allowing to set a trigger threshold at the level of a single ph-e together with good quality multi-photon spectra. The spurious effects (i.e., dark count rate and crosstalk) have limited impact on the measurements. Even if the readout system was running in self-trigger mode, the majority algorithm plus the event-accept technique allowed to maintain the spurious events at the sub-Hz level and a crosstalk at the percent level.
Calibration in ph-e of the LG response is required in order to sum signals from different SiPMs and to correct for non-linearity due to the limited number of cells available in each detector, if needed.
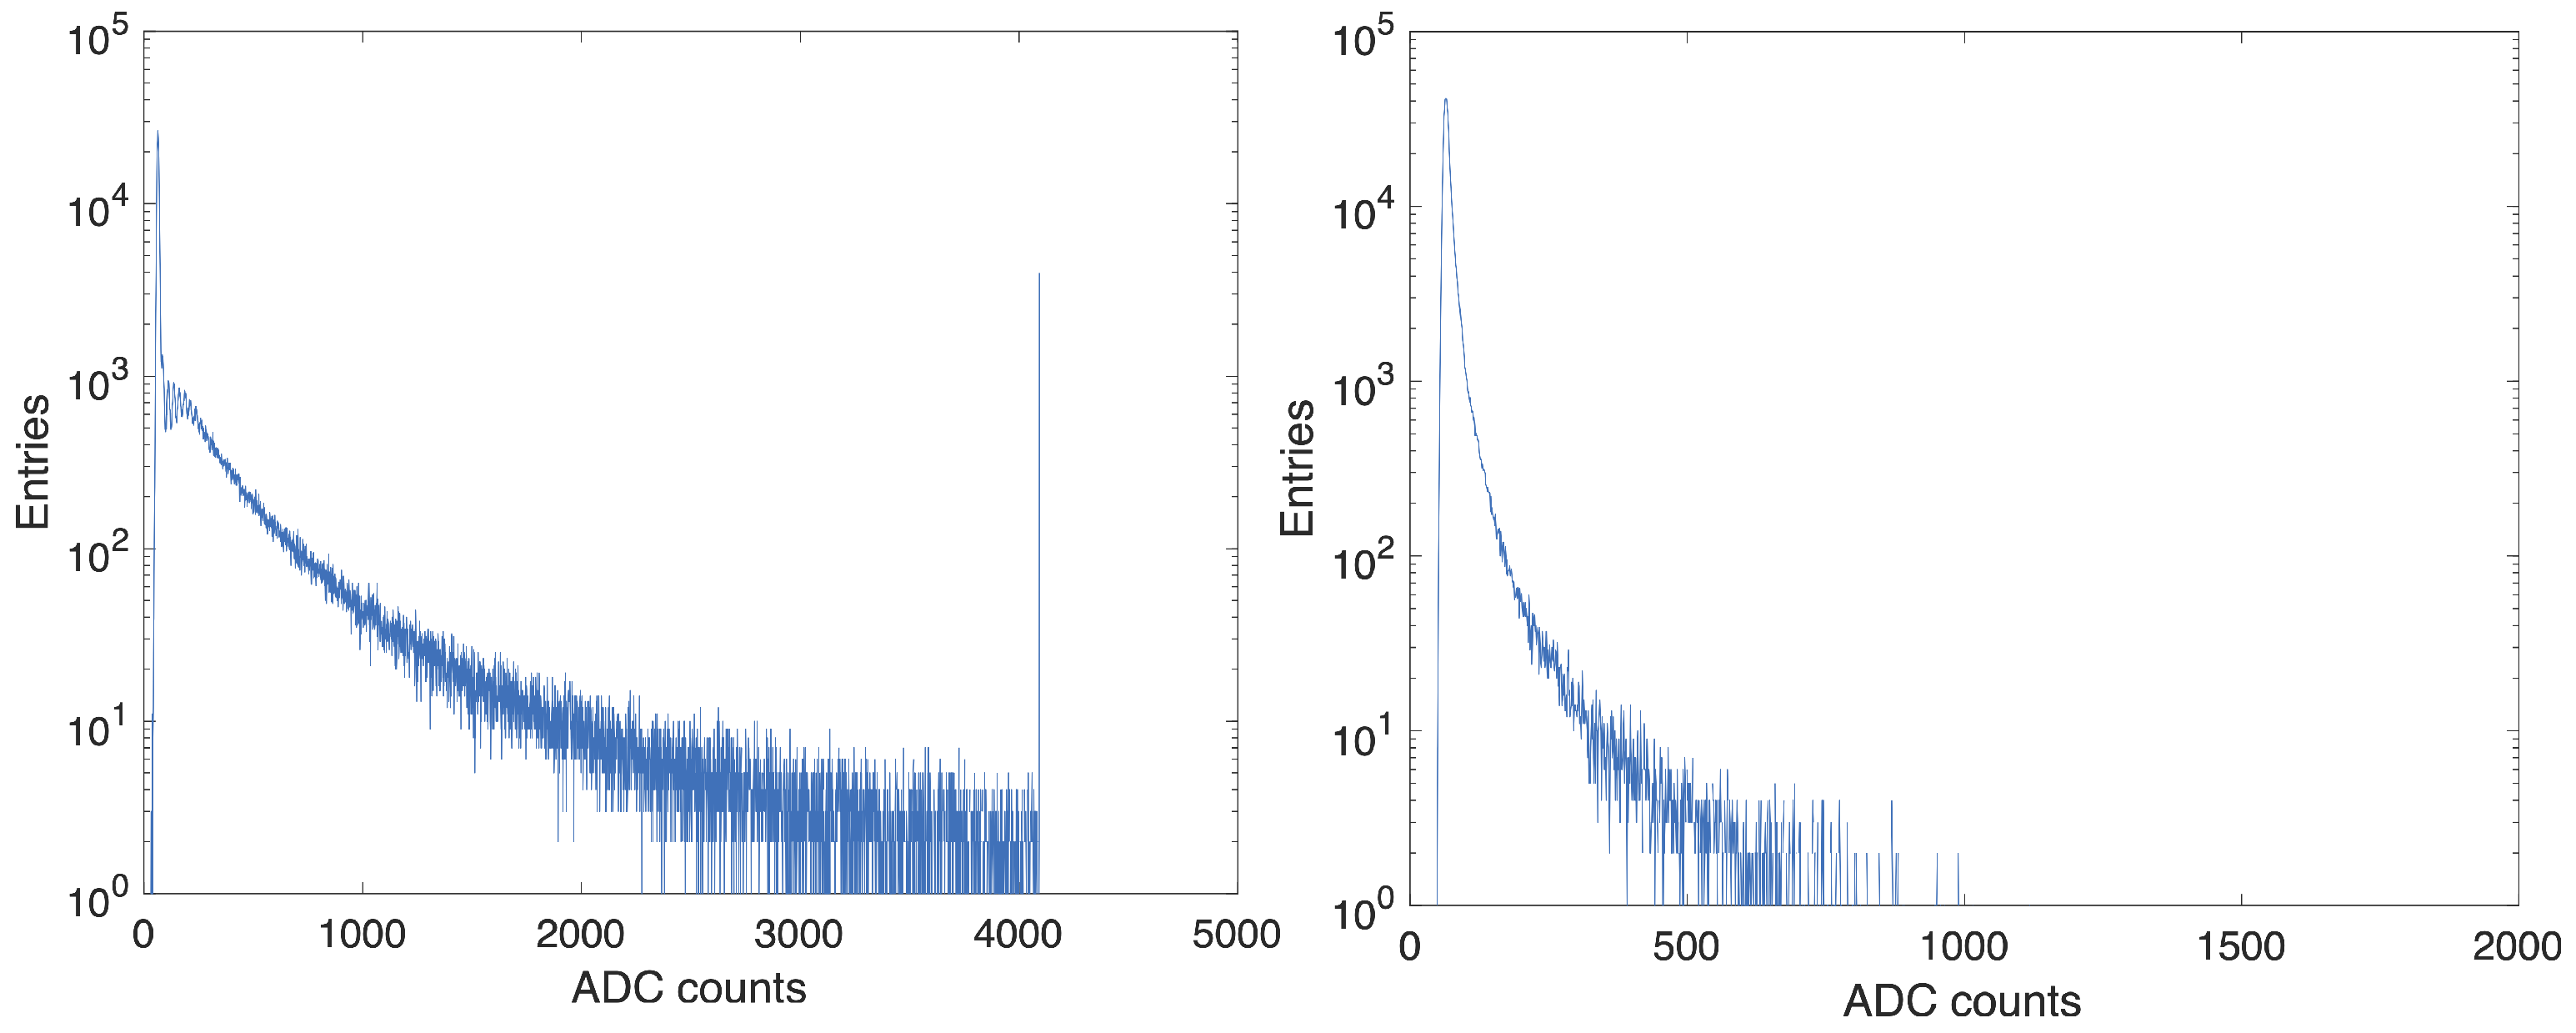
Figure 3 shows the typical HG (on the left) and LG (on the right) spectra measured by one SiPM connected to a scintillating fibre in response to 6 GeV electrons at the DESY test beam. The pedestal, the multi-photon, and the ADC saturation are clearly visible in the plot on the left. The saturation is not affecting the measurement since the information is still available in the LG spectrum and the strategy used to calibrate both spectra in ph-e is the following:
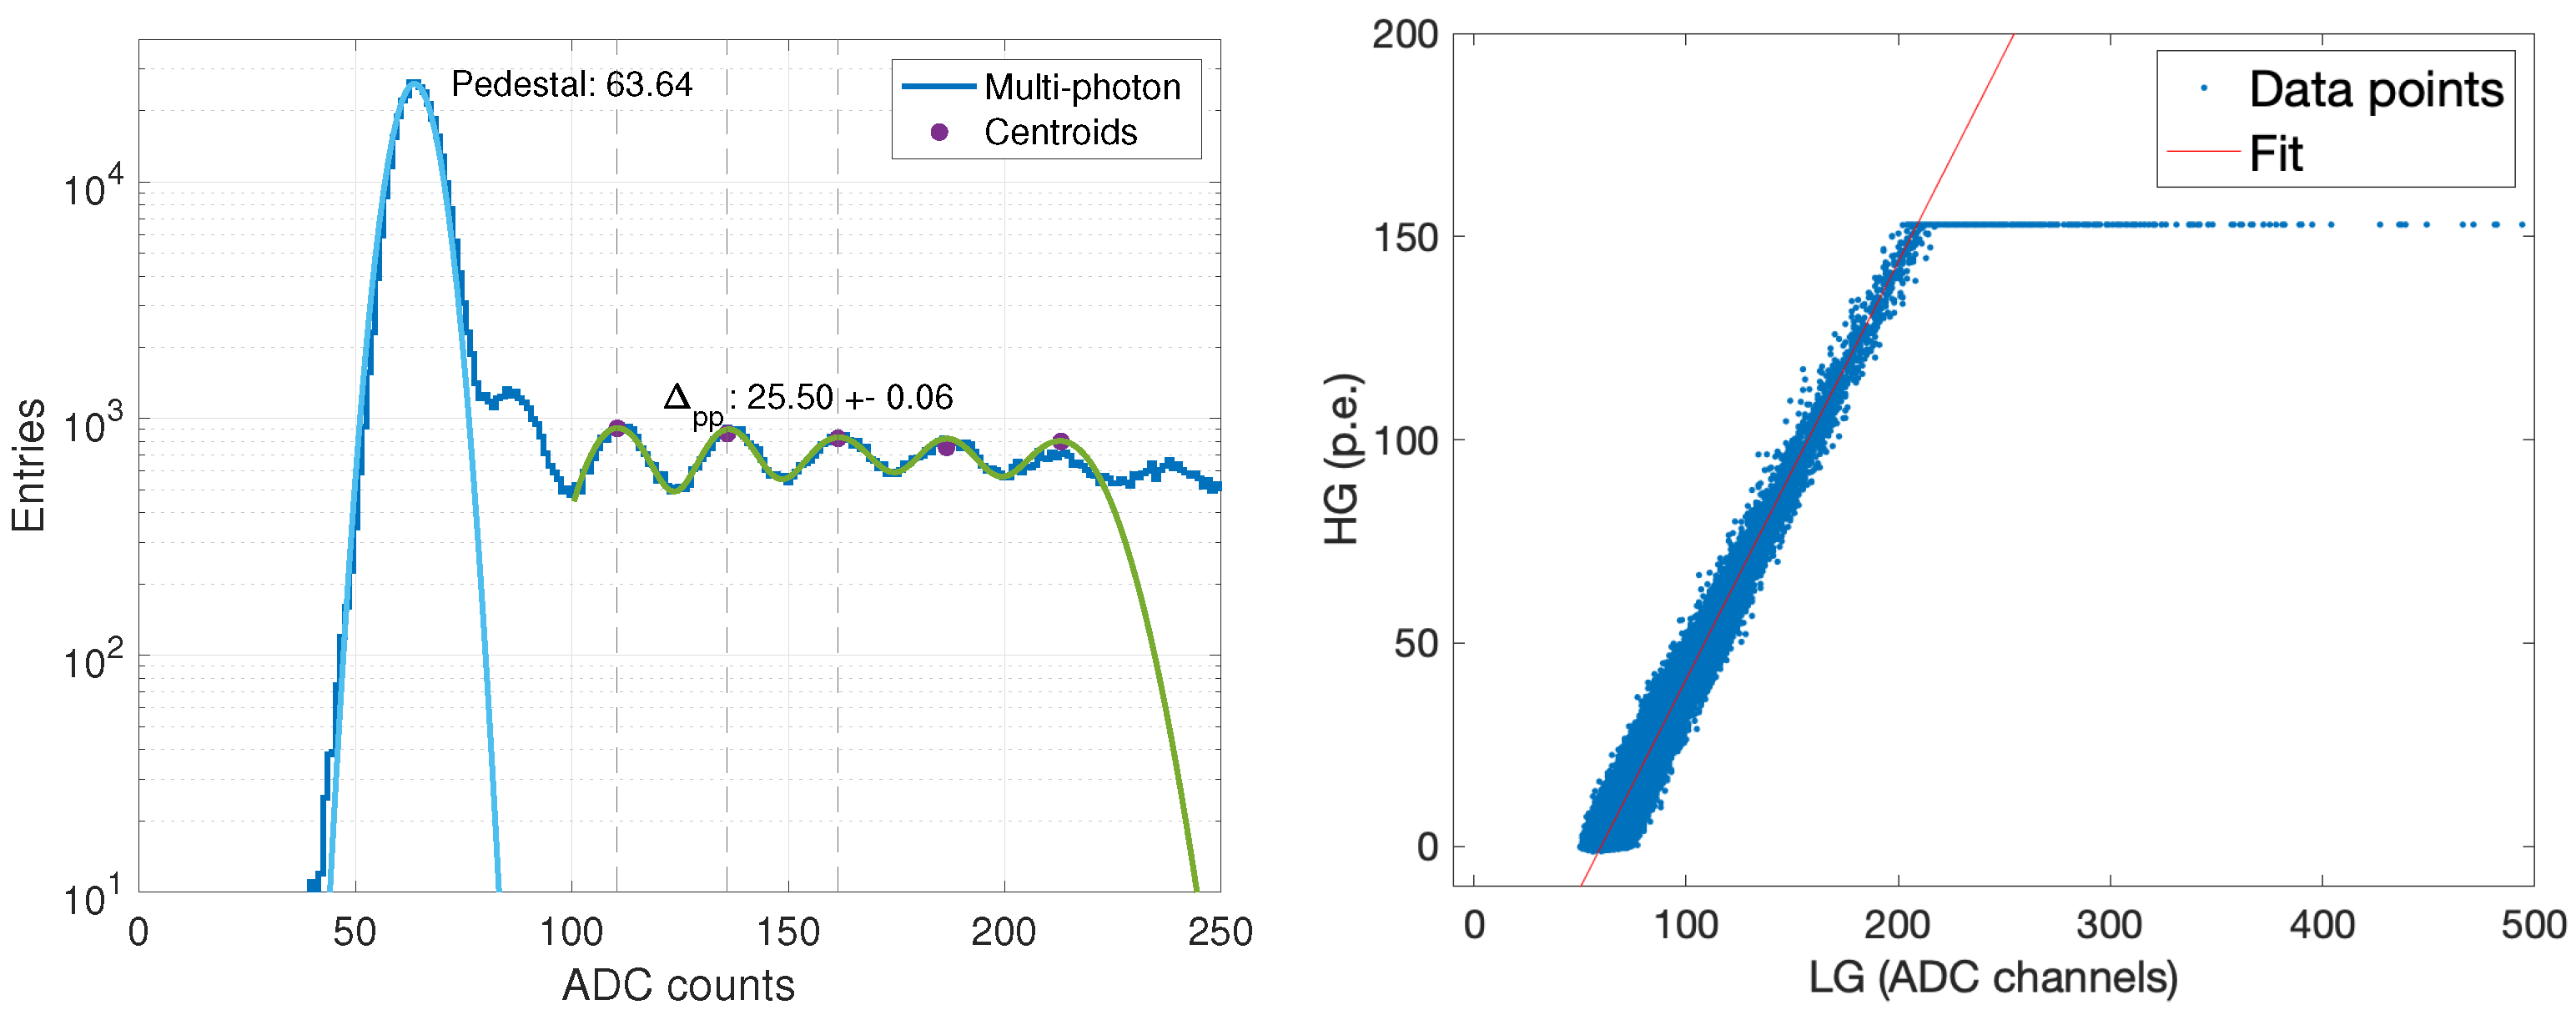
The pedestal and the multi-photon are fitted with Gaussian functions. The results are used to convert the ADC channels in ph-e by using the mean value of the pedestal and the average peak-to-peak distance obtained by fitting three consecutive peaks (
Figure 4 left plot).
The HG values, converted in ph-e, are correlated to the ADC counts of the LG channel (
Figure 4 right plot). The points in the plot exceeding 125 ph-e are not considered in the fit and the slope is used to extract the ADC to ph-e conversion for the LG even if the multi-photon structure is not accessible in this regime. The typical conversion factor is ≈1 ph-e/ADC with a few per mille of uncertainty.
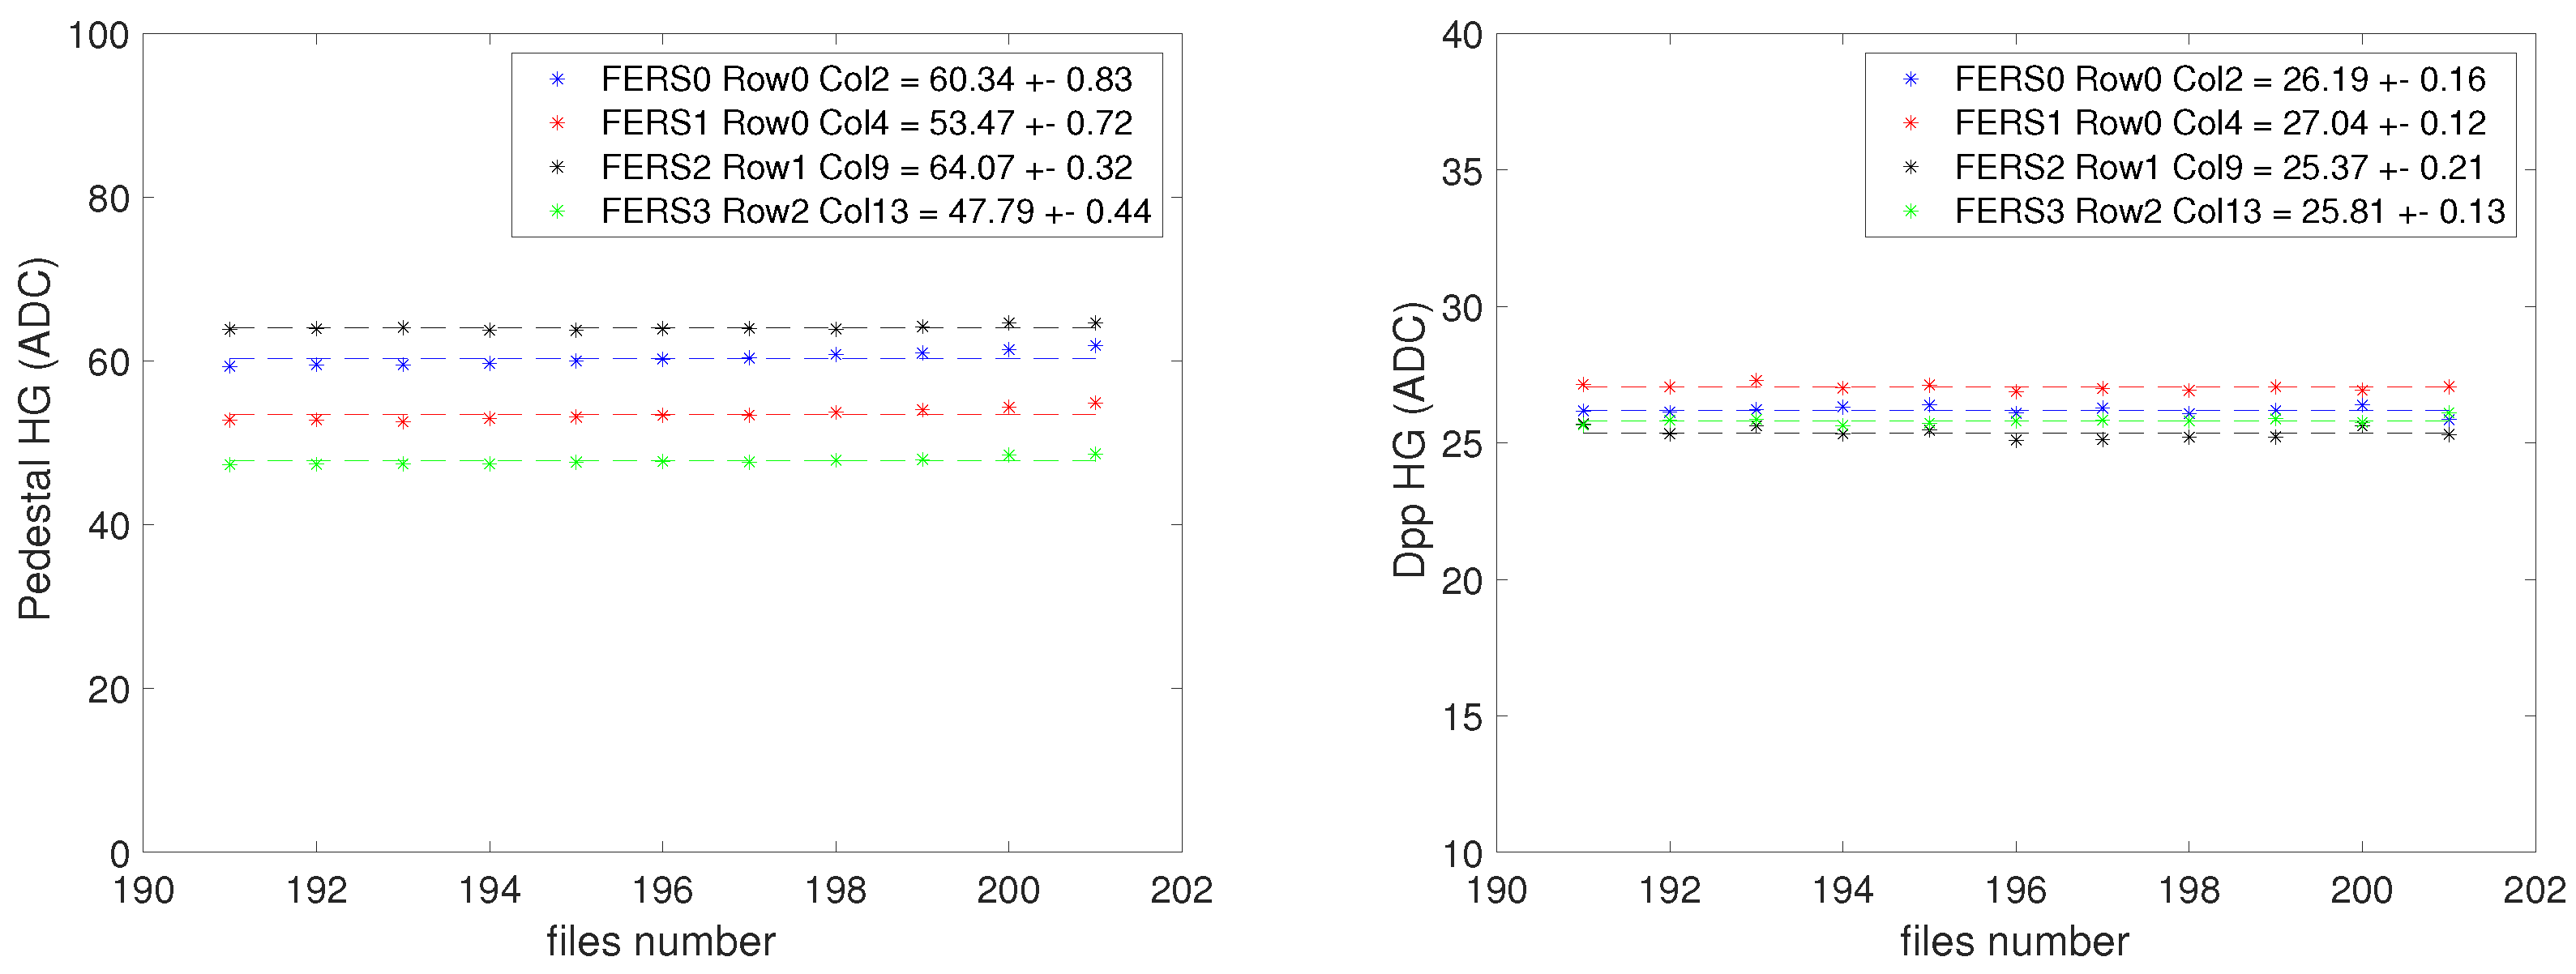
The procedure is performed for all SiPMs and the parameters are extracted on a run by run basis, without having the need to collect dedicated data for calibration. The analysis performed on these data allowed to verify the system stability in different runs. The
Figure 5 shows the baseline (on the left) and the peak-to-peak difference (on the right) measured, for one SiPM in each readout board, using the HG data collected during a series of consecutive runs. Variations never exceeding 2% were measured for the baseline and peak-to-peak difference for all SiPMs. In fact a single calibration constant per SiPM was used for all the datasets analysed.
3.2. Light Collection
Once the signals from all SiPMs are calibrated in ph-e, they are summed event by event to obtain the total distribution. Only events hitting the central part of the module equipped with SiPMs are selected. The selection is performed by using the centre of gravity (
,
) estimated with the energy deposited (
) in the 160 scintillating fibres (
,
) by using the following Formula:
and the cut in the central region is defined by a square of 4 × 4 fibres (≈8 × 7 mm
).
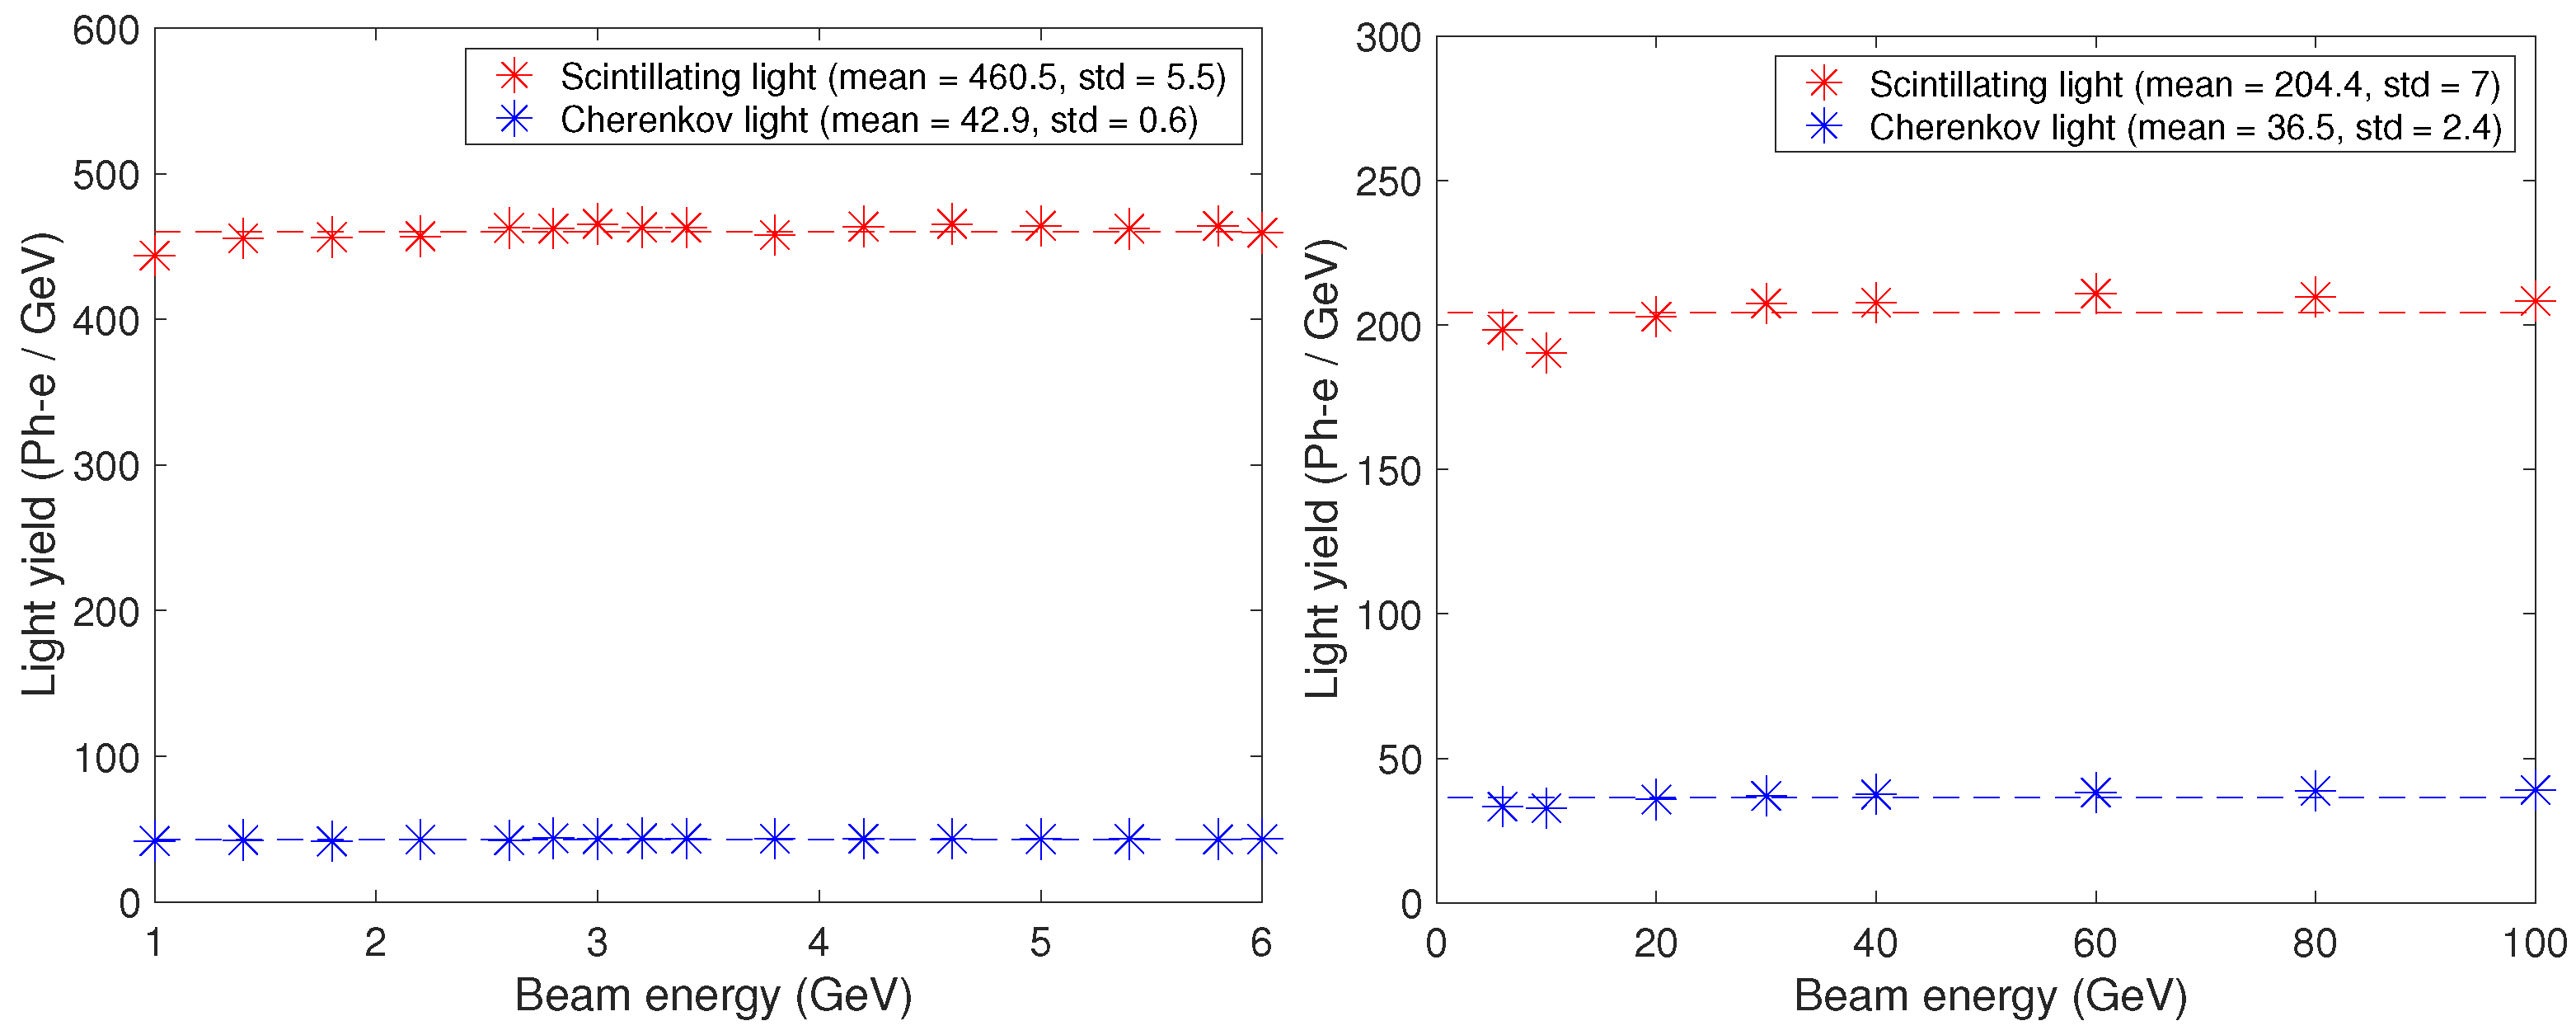
Figure 6 (on the left) shows the average number of detected photons produced by the Cherenkov and scintillating process in the central module as a function of the electron beam energy, divided by the beam energy. The preliminary results obtained in the small energy range available at DESY show an average value of 42.9 ± 0.6 ph-e/GeV for the Cherenkov light and 460.5 ± 5.5 ph-e/GeV for the scintillating light. Once corrected for the shower containment (≈72%), estimated with a detailed Monte Carlo simulation that describes the experimental setup, we obtain ≈60 ph-e/GeV for the Cherenkov light and ≈640 ph-e/GeV for the scintillating light. The value measured for the Cherenkov light is similar to the result obtained with the first measurement performed using a small module of dual readout calorimeter equipped with SiPMs [
5]. At that time, the average light yield was estimated to be 64 ph-e/GeV after the containment correction.
The analysis performed on the data collected at the CERN test beam is still ongoing but, as preliminary results, we show the light collection yield measured for a larger energy range (
Figure 6 on the right). The calibration and the selection performed on the impact point of the electrons are the same used for the DESY test beam data analysis. The only difference sits in the electron selection performed using the signals from the pre-shower and the muon detector. This selection was not required at DESY due to the high purity of the beam.
The results obtained in the full energy range available at CERN demonstrate an average scintillating light, after the correction for the shower containment (≈72%) of 284 ph-e/GeV. The reduction measured with respect to the DESY test beam is due to the yellow filters used in this test beam. The filter maximises the light collection, avoiding the non-linear regime expected when the light intensity conveyed on the single SiPM exceeds 30–40% of occupancy. In the same plot, we can also observe that the Cherenkov light measured at the CERN test beam is slightly lower than the value obtained at DESY even if the two values are is still compatible in the errors. This could be a small effect of the transparent paper used between the clear fibres and the SiPMs. In fact, even if we avoided the air gap, the paper could have introduced a small light attenuation.
3.3. Shower Shape and Comparison with Monte Carlo Simulation
The module readout with SiPMs adds an unprecedented granularity to the dual readout technique.
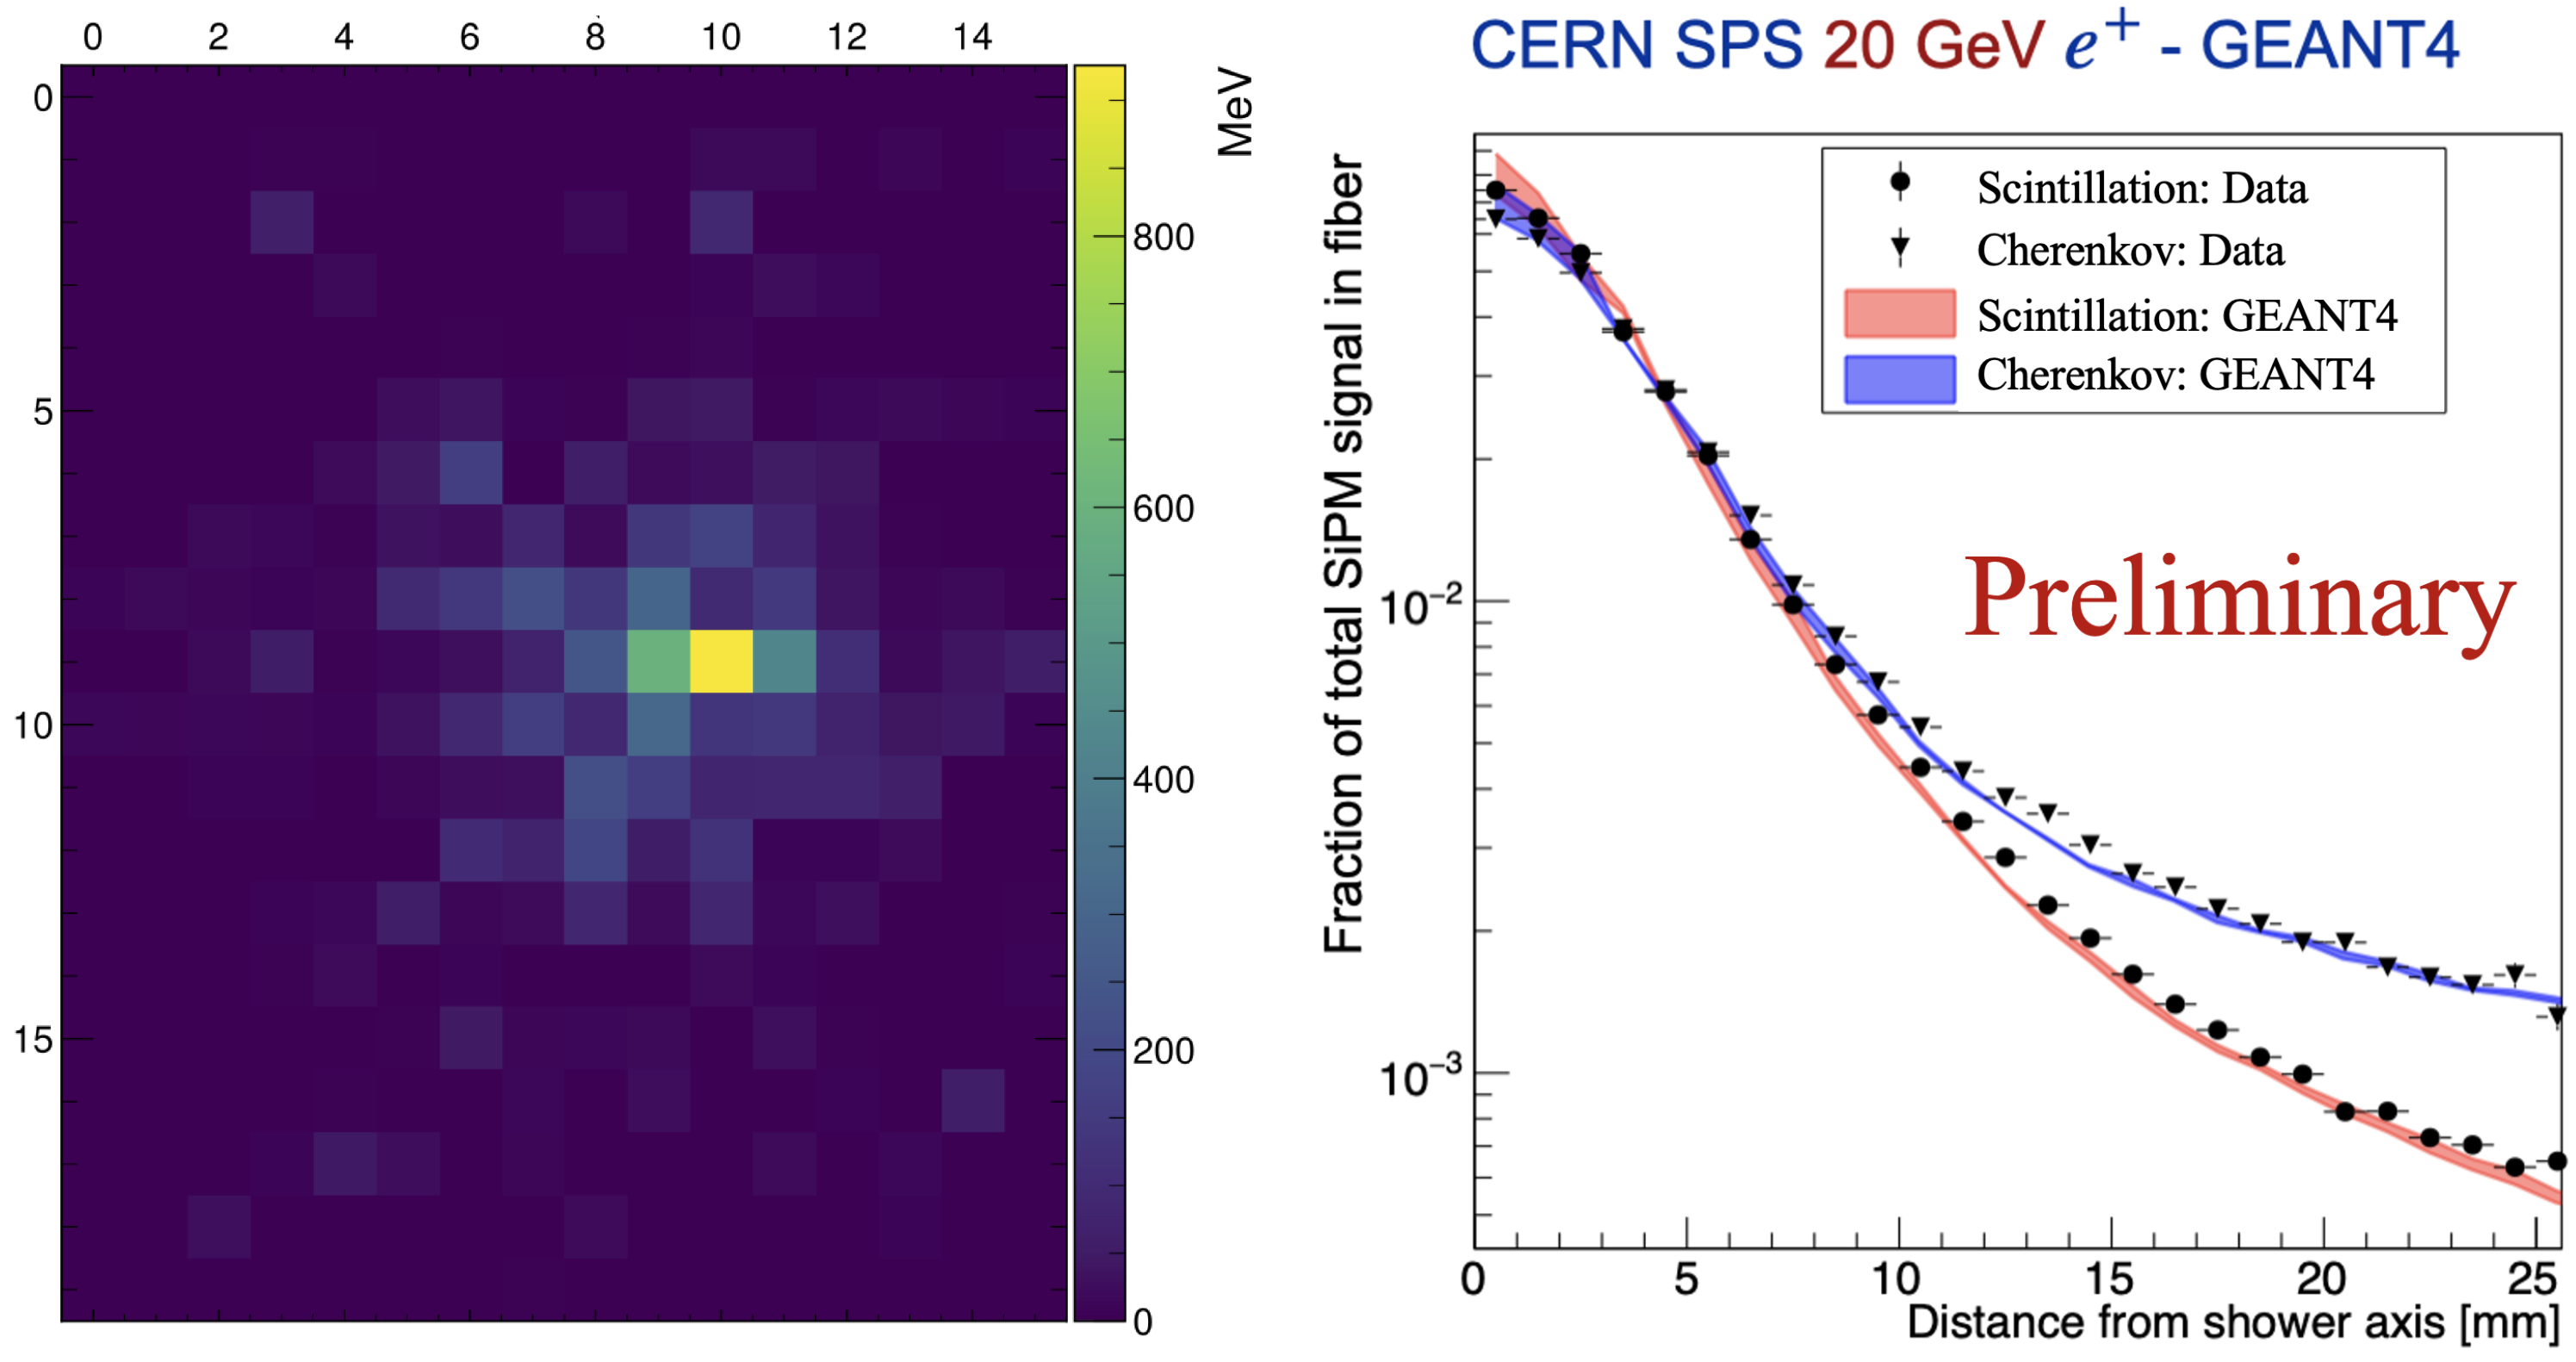
Figure 7 (plot on the left) shows the energy released by a 6 GeV electron in each fibre of the calorimeter. The number of ph-e measured by each SiPM are converted in energy by using the ph-e/GeV factor extracted from the plots in
Figure 6. The high-resolution imaging, together with the longitudinal segmentation that could be extracted by adding the time stamping information (i.e., the time delay between the signal measured in each SiPM with respect to a reference), could be used in future to improve the particle ID performance and to resolve complex final state containing non-isolated objects.
For the time being, this information has been used to qualify the Monte Carlo simulation, able to precisely reproduce the shower shape as shown by the right plot in
Figure 7. After having measured the centre of gravity in each event by measuring the deposited energy in the fibres (see Equation (
1)) a radial distance (
) between the fibres and the shower axis was measured with the following formula:
The lateral shower profile is measured by taking the fraction of scintillating and Cherenkov signals produced by the showers and recorded with SiPMs as a function of the radial distance. The values reported in the plot are averaged in radial bins of 1 mm. The Cherenkov light produced in the core of the shower (highly collimated at the beginning) falls outside the fibre numerical aperture. This could explain the wider shape measured with the Cherenkov signals [
5]. The figure clearly shows the good matching achieved between the test beam data and the Monte Carlo simulation (This preliminary result will be included in a more extensive paper that will highlight all the results obtained in the two test beams).
4. Discussion and Outlook
The electromagnetic-size prototype, built and qualified on beam in 2021, allowed the dual readout collaboration to address a series of challenges to be solved for developing a scalable solution suitable for the next generation of leptonic-collider experiments. The prototype was built using commercially available brass capillaries. This solution has the potential to be ready for mass production using (1) components machined with high precision by external companies and (2) an assembly solution that guarantees the required mechanical precision [
7].
The new SiPM readout scheme seems to satisfy the majority of the requirements set for this calorimeter. We had the chance to define a robust calibration procedure and we identified the settings suitable for the SiPMs and the readout boards in use. This configuration allows to operate the system in a linear regime preserving the good quality of multi-photon spectra required for the calibration. Nevertheless additional requirements need to be fulfilled for the next generation of prototypes:
To scale up this solution towards larger prototypes, we need to identify SiPMs fitting the rear part of the calorimeter in order to avoid any fibre fan-out. This request becomes even more demanding because we need to avoid light contamination between scintillating and Cherenkov light collected by neighbouring SiPMs. For this reason, we are considering 1 × 1 mm
SiPMs designed by Hamamatsu with 10 or 15
m size microcells and a compact packaging with almost no dead area (1.1 × 1.1 mm
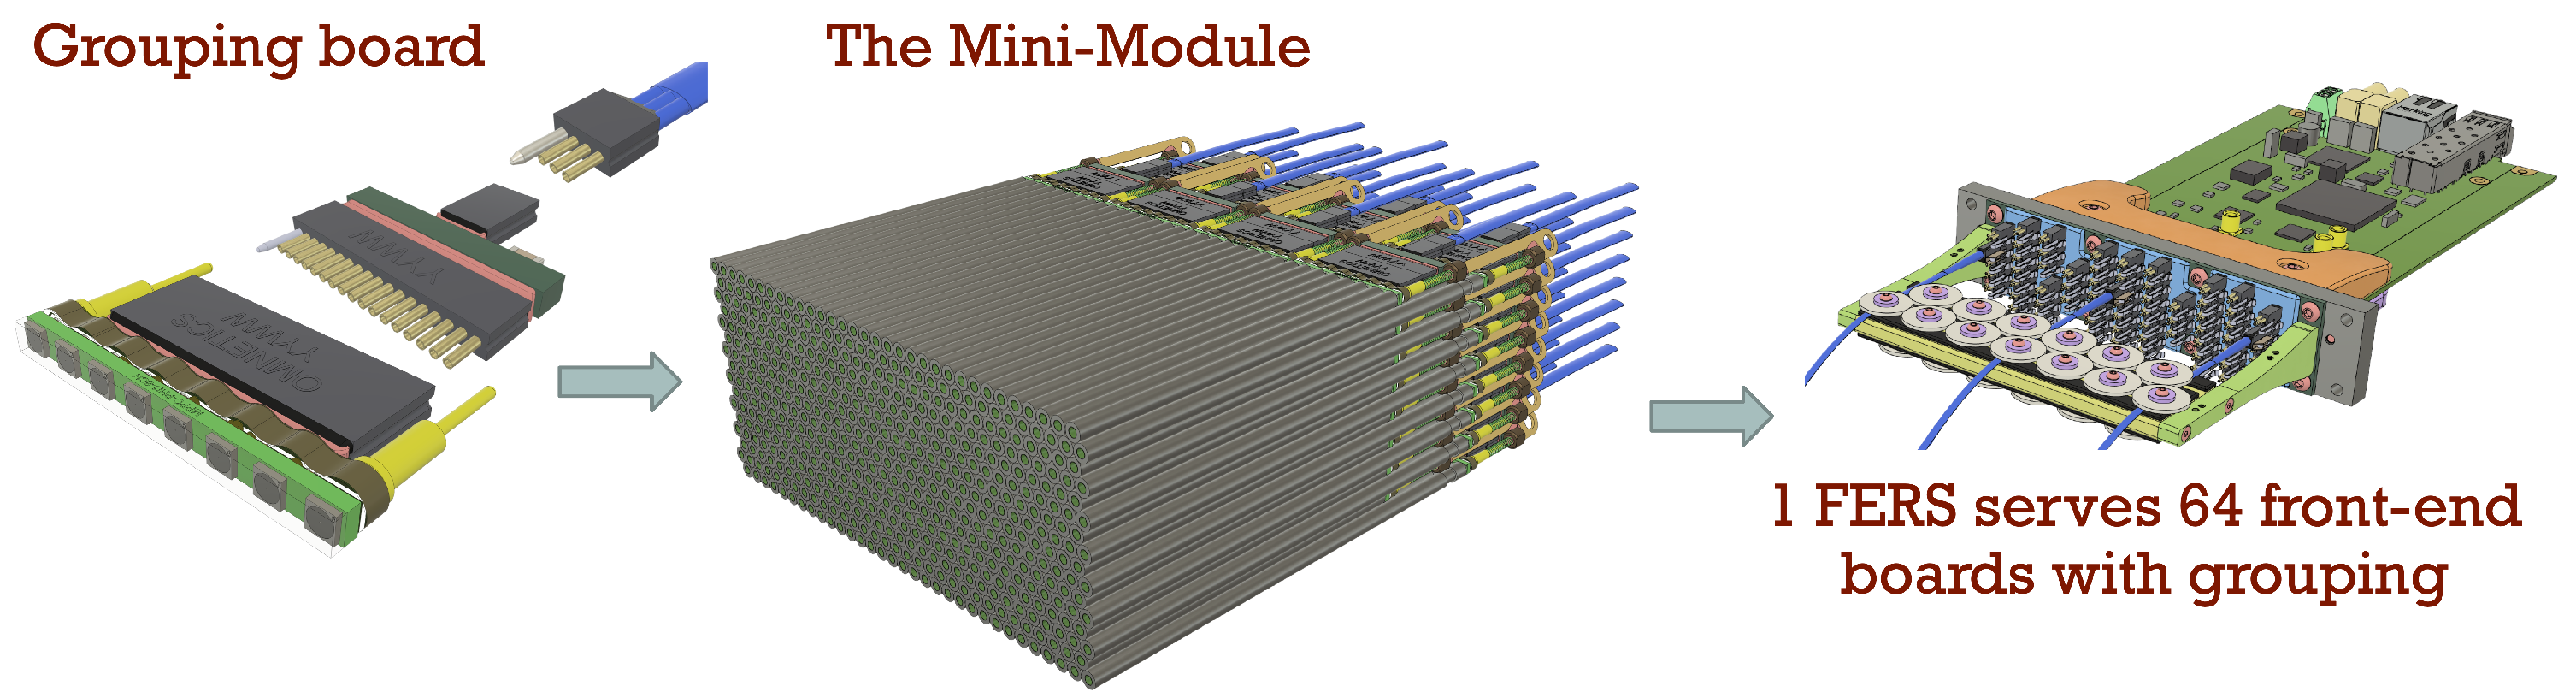
): solution not available in 2020. A custom PCB board will be equipped with 8 SiPMs with similar breakdown voltage (within 100 mV) to be operated at the same voltage and mounted with the spacing matching the fibre pitch.
Figure 8 shows the rear part of the mini-module designed for this scope and the main components. The SiPMs are directly connected to the fibres and the capillaries have different lengths (in alternating rows) to avoid the light contamination previously mentioned. This design requires compact SiPMs, PCB boards and connectors to fit in the limited space available on the back side of the calorimeter.
As discussed, it would be extremely useful to include the time information in the readout. This requirement would allow to add a longitudinal segmentation of few centimetres to the calorimeter with a time stamping ≤100 ps. This is difficult to be achieved with the actual system even though some preliminary investigation can be done. A possible solution could be based on the ASIC RADIOROC [
8] from WEEROC supposed to have a compatible performance in terms of energy spectrum plus improved timing information (≈35 ps FWHM on single ph-e). This possibility will be investigated in the near future.
A larger prototype, capable of containing hadronic showers, will be built in the next two years. As for the electromagnetic prototype, only the central part will be equipped with SiPMs but, in this case, the collaboration wants to target a real scalable solution from both the mechanical and readout point of view. This prototype will be equipped with more than 10,000 SiPMs with the final goal to target the study of the hadronic performance of the dual readout technique.


